 Wenxing Wu
 Changjun Qiu1
 Yinghao Zhou
 Yun Zhang
 Pinghu Chen
- 1School of Nuclear Science and Technology, School of Mechanical Engineering, University of South China, Hengyang, China
- 2Department of Materials Science and Engineering, Southern University of Science and Technology, Shenzhen, China
- 3State Key Laboratory of High Performance Complex Manufacturing, Light Alloys Research Institute, Central South University, Changsha, China
- 4College of Mechatronics and Control Engineering, Additive Manufacturing Institute, Shenzhen University, Shenzhen, China
High-entropy alloys (HEAs) have excellent properties of high strength–ductility, thermal stability, corrosion resistance, etc. HEAs can be considered as one of the most interesting structural or functional candidate materials and have been extensively studied based on different multiple elements in the past decades. However, the previous works focus mainly on overcoming strength–ductility trade-off. In this study, a series of WCp-reinforced FeCrMnCox (x values in atomic ratio, x = 0, 2, 4, 6, 8, and 10 at.%) HEAs are fabricated to investigate the influence of Co on the microstructures, microhardness, cracking behavior, and wear resistance. The results indicate that γ phase (fcc structure) can be formed in the designed HEA with a small amount of α phase (bcc structure). Stress can result in cracking initiation owing to the formation of lattice distortion caused by the decomposition and diffusion of WC into the matrix, and the cracking phenomenon is more serious when Co content is decreased gradually. In addition, microhardness is also increased gradually with the decrease in Co content, and the maximum microhardness reaches 680 HV for the 0–2 sample without Co. Furthermore, excellent wear resistance of the designed materials can be attributed mainly to hardness rather than friction coefficient. A conspicuous monotonic decrease in the wear rate is discovered with a monotonic increase in microhardness, adhesive wear mechanism appears mainly in the samples with higher Co content, and the wear mechanism is transformed gradually from a typical adhesive wear mechanism to an abrasive wear mechanism with the reduction in Co content.
Introduction
High-entropy alloys (HEAs) were composed of multiple elements in near-equimolar ratios to form a relatively stable solid solution phase as face-centered cubic (fcc), body-centered cubic (bcc), or close-packed hexagonal (hcp) structures. They have many advantages of high strength–ductility, excellent thermal stability, and good corrosion resistance (Santodonato et al., 2015; Zou et al., 2015; George et al., 2019). Therefore, high-entropy alloys have obtained the researchers’ high favor as a result of the combination of useful properties and promising applications in the past decade (Li et al., 2016; Tracy et al., 2017; Sarker et al., 2018).
High-entropy alloys based on the Fe–Cr–Mn–Co–Ni system have been extensively studied. To further understand the relationship between physical metallurgical mechanisms and their properties, an atomistic simulation study was conducted. Meanwhile, the effect of individual elements on solid hardening for the equiatomic CoCrFeMnNi HEA was explored, and the results revealed that a large amount of stable vacancy sites might produce sluggish diffusion, resulting in outstanding properties (Tsai et al., 2013; Choi et al., 2018). Furthermore, due to the transformation-induced plasticity (TRIP) effect, a metastable fcc structure might contribute to excellent ductility when the stronger hcp structure could result in high strength and overcome the strength and ductility trade-off in a dual-phase high-entropy alloy (Li et al., 2016; Li et al., 2017; Chen et al., 2020). In addition to the aforementioned works, a strengthening phase was obtained to improve the strength with excellent fracture toughness, and selective laser melting (SLM) was employed to fabricate an Fe-based metallic glass-reinforced FeCoCrNiMn HEA. High entropy and sluggish diffusion effect could contribute to stabilize two different high-entropy phases in the matrix, and high strength and excellent fracture toughness were achieved simultaneously, which attributed to the existence of the Fe-based metallic glass phase (Li et al., 2020). Otherwise, Zheng et al. (2020) reported that a new strategy was carried out to tailor the strength and ductility of CoCrFeNi-based high-entropy alloy. Nano-L12 precipitates were formed on the fcc high-entropy alloy matrix to improve the mechanical properties, which included a tensile fracture strength of 1,200 MPa, yield strength of 910 MPa, and elongation of 14%. Holcomb et al. (2015) researched the oxidation behaviors of CoCrFeMnNi system HEAs in addition to solving strength–ductility trade-off. The excellent oxidation resistance of the CoCrFeNi high-entropy alloy was equivalent to that of 304H at 650°C. When a substantial amount of hydrogen is absorbed, the resistance of CoCrFeMnNi HEA to gaseous hydrogen embrittlement was better than that of two representative austenitic stainless steels (Zhao et al., 2017). Furthermore, the CoCrFeMn/Ni high-entropy alloys also have good corrosion resistance (Luo et al., 2018; Zhu L et al., 2021) and wear resistance (Wang et al., 2019; Joseph et al., 2020), but higher price of Co and Ni might limits its engineering utility.
In this article, laser cladding is used to fabricate a series of WCp-reinforced nonequilibrium FeCrMnCox (x = 0, 2, 4, 6, 8, and 10 at.%) HEAs. SEM and XRD are employed to analyze the microstructure and its corresponding phase of the HEAs. In the meanwhile, hardness and friction-wear tests are performed. The influence of Co content on the microstructure, hardness, cracking behaviors, and wear resistance is investigated, as well as the wear mechanism.
Materials and Methods
In this study, some commercial high-purity metal powder (Fe, Cr, Mn, and Co) and WC particles are used and provided by Shanghai Puwei Applied Materials Technology Co., Ltd., and TIJO METAL MATERIAL CO., LTD. Seven kinds of alloy powders are mixed based on the specific ratio of metal powder, and mechanical agitation is performed to mix the designed alloy power for 2 h, the final atomic ratio of alloy powers is shown in Table 1. Their atomic ratio of Cr, Mn, and WC are set as constant values of 20, 30, and 2 at.%, and the ratio of Fe element is increased by 2 at.% with a decrease in Co element. In addition, all samples are numbered based on the corresponding contents of Co and WC, for example, 10–0, 10–2, 8–2, 6–2, 4–2, 2–2, and 0–2 are on behalf of 10 at.% Co-0 at.% WC, 10 at.% Co-2 at.% WC, 8 at.% Co-2 at.% WC, 6 at.% Co-2 at.% WC, 4 at.% Co-2 at.% WC, 2 at.% Co-2 at.% WC, and 0 at.% Co-2 at.% WC, respectively.
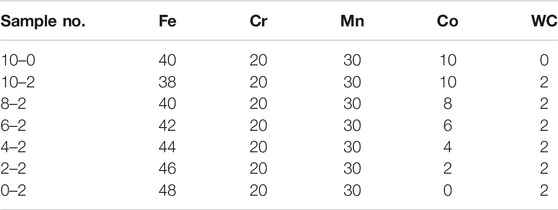
TABLE 1. Chemical compositions of seven alloys after mechanical mixing (at.%).
An XL-F500 Laser cladding system (Guangzhou Xinglai Laser Technology Co., Ltd., China, Guangzhou), equipped with a 500 W pulse laser (the pulse width is 10–50 ns), is employed to fabricate the samples with different alloy compositions, and the schematic diagram of the laser cladding process is shown in Figure 1A. Laser process parameters include an energy density of 1,333 W/mm2 and a scanning speed of 480 mm/min with the lapping rate of 50%; all layers were scanned using a “reciprocate” strategy, as shown in Figure 1B, seven layers are cladded for each sample. During laser cladding process, the protective atmosphere of high-purity N2 with 99.99% is supplied by bottles.
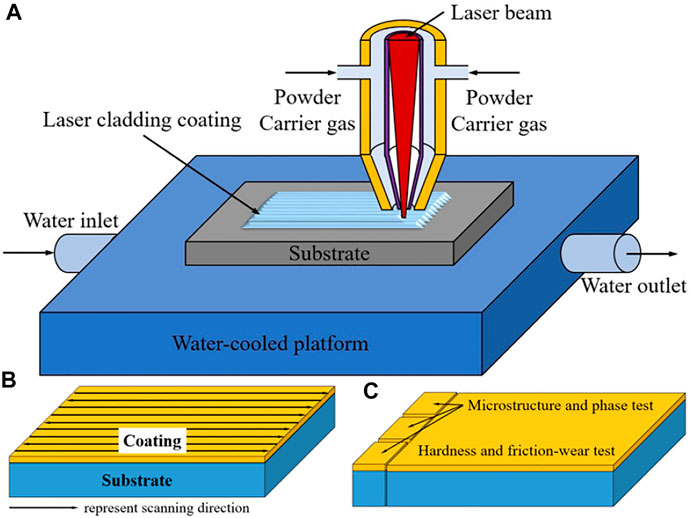
FIGURE 1. Schematic diagram of laser cladding process (A) and samples’ preparation for material 104 characterization and properties testing (B,C).
The samples for material characterization and friction-wear tests are cut by wire cut electrical discharge machining based on Figure 1C. Three samples are prepared for morphologies of building/scanning directions and microhardness testing, as shown in the left of Figure 1C, and the sample for friction-wear testing is shown in right of Figure 1C. On the one hand, for properties’ testing, all samples are grinded with 400 #, 800 #, 1200 #, 1500 #, and 2000 # sand papers. The digital micro Vickers hardness tester is employed to measure the microhardness of different samples under a load of 500 gf and a duration time of 15 s, five points are carried out for each sample, and their average values can be considered as the final value. In addition, the friction-wear tests are performed by a high-temperature friction-wear machine (HT-1000, Zhongke Kaihua, Lanzhou, China) with a φ 4 mm Si3N4 counterpart ball under the friction conditions of 20 N friction load, 200 r/min, 5 mm friction radius, and 30 min friction time. Then, the morphology features of wear tracks are characterized using 3D laser confocal scanning microscopy (VK-X200 series, Keyence Corporation of America, United States). In addition to that, the corresponding wear rates are calculated according to the following equation (Zhang et al., 2021):
where w is the worn rate, mm3/(mN); V represents the wear volume, mm3; L represents the total travel, m; and F is the friction load, N.
On the other hand, all samples of material characterization are grinded with 400 #, 800 #, 1200 #, 1500 #, 2000 #, 3000 #, and 5000 # sand papers, and followed by etching using a solution of sulphonic acid. Optical microscope (OM) and scanning electron microscope (SEM, TESCAN MIRA three LMH/LMU, Czech Republic) are employed to count the cracking characteristics and characterize microstructure. In addition, high-energy X-ray diffraction (XRD, D8 discover, Bruker, Germany) is used to analyze the phase of different samples, and XRD is operated at 45 kV and 200 mA using scanning speed of 2o/min over a range of 2θ = 35o∼95o. Furthermore, micro morphology and the corresponding elemental distribution of wear tracks are characterized by SEM and EDS to explore wear mechanisms.
Results and Discussion
Crystal Structure and Microstructure Evolutions
XRD patterns of WCp-FeCrMnCox (x = 0, 2, 4, 6, 8, and 10 at.%) HEAs are shown in Figure 2. A γ Fe (fcc structure) appears with a small amount of α Fe (bcc structure) and unknown phase within 45o∼49o in the 10–0 sample, the spectra peaks for (111), (200), (220), and (311) γ-Fe crystallographic planes can appear at 43.3o, 50.4o, 74o, and 89.8o, respectively. Significantly, the peaks of (220)γ and (311)γ have a shift to the small angle because the lattice constant is increased and lattice is expanded due to the reduction of Co atom with bigger diameter, for example, the spectra peak for (311) γ-Fe crystallographic planes in the 0–2 sample has a maximum offset angle of above 0.5°. Furthermore, two overlapping peaks of γ phase at the (111) crystallographic plane can be formed with γ1 and γ2. For α structure, the strongest peak of α-Fe with (110) crystallographic plane at 44.3o, and its intensity of (110)α has a relatively small change. Beyond that, WC and W2C are detected in the samples with adding WC, and the intensity of the WC peak with (101) crystallographic plane is increased accompanied with the increase in the intensity of the W2C peak with (102) the crystallographic plane. W2C is discovered because WC can be resolved and diffused to the matrix during laser cladding (Riabkina–Fishman et al., 2001; Yang et al., 2003; Van Acker et al., 2005). Co can promote the decomposition of WC particles, and Cr-rich carbides are simultaneously precipitated and appeared at 56.2 and 79.5 o and formed weak peaks for all the samples with WC.
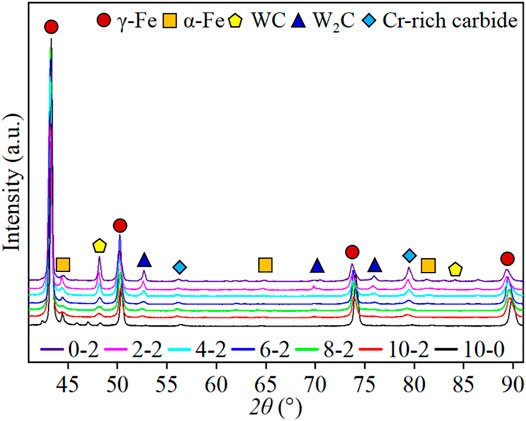
FIGURE 2. XRD patterns of the samples with different Co contents.
In addition to the crystal structure, the corresponding metallographic microscopes are characterized as shown in Figure 3, a whole molten pool cannot be discovered in the samples on account of an overlapping rate of 50%, and it is obvious that the molten-pool morphology of all samples can include transition zone between the neighboring layers. It is well-known that laser power and scanning speed has a greater influence on microstructure than that of the overlapping rate, and the overlapping rate can affect the shape of molten pool with a small role in microstructure. Therefore, the width of transition zone can be attributed largely to Co content. Just as in Figure 3, the transition zone of the 10–0 sample has a minimum width of about 40 μm, but the others’ width of transition zone increases relative to the 10–0 sample, these values can be in the range of 50–120 μm. Two reasons can contribute to this phenomenon, on the one hand, similar microstructure is discovered within each molten pool due to the certain laser process parameters, but different microstructures are distributed in the different regions (Top, middle, and bottom) of the molten pool during the solidification (Tu et al., 2017), and the micro morphology is transformed from the dendrite structure at the bottom of molten pool to an equiaxed structure at the top of molten pool because of different temperature gradients (Zhu M et al., 2021); On the other hand, Co element has a dramatic effect in inhibiting the solubility of alloying elements (Xin et al., 2015) effectively, which can result in different widths of the transition zone. Also, different microstructures within the transition zone are shown in Figure 4.
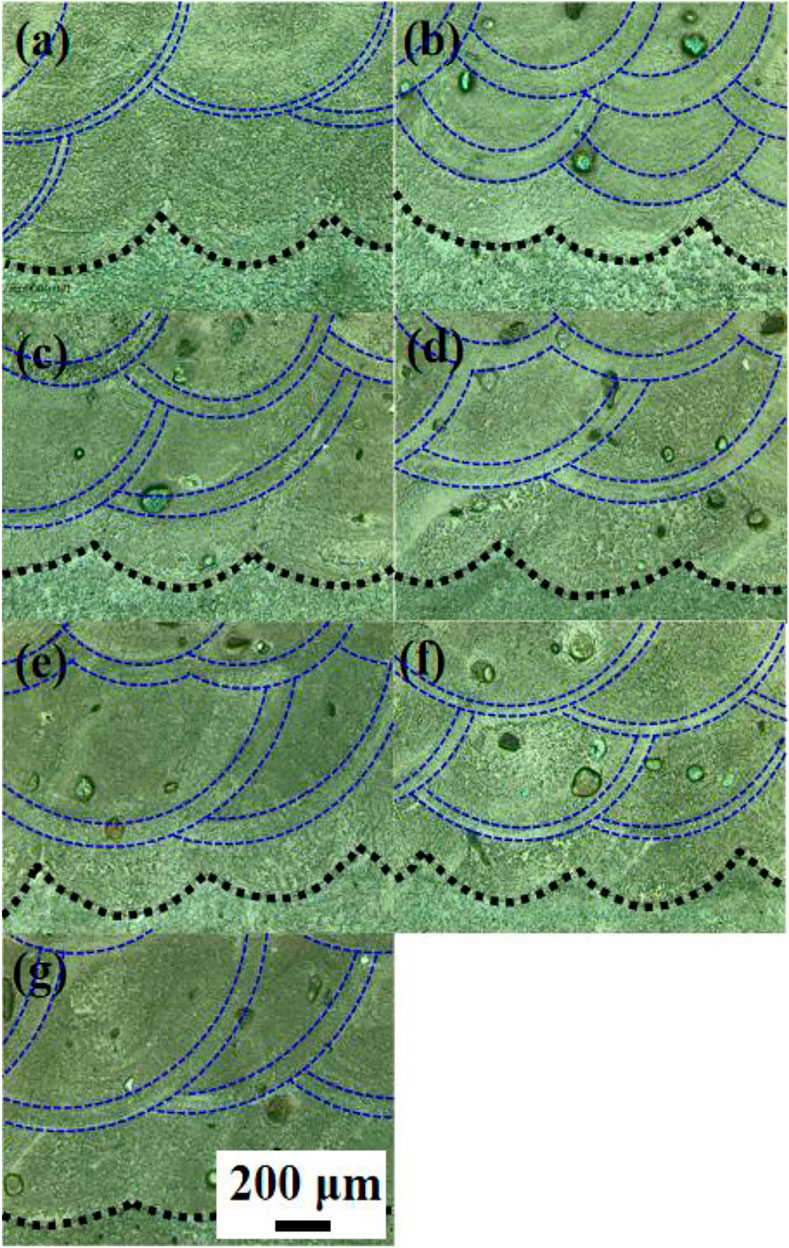
FIGURE 3. Metallographic morphology of different samples in the building direction. (A) 10–0 sample; (B) 10–2 sample; (C) 8–2 sample; (D) 6–2 sample; (E) 4–2 sample; (F) 2–2 sample; and (G) 0–2 sample.
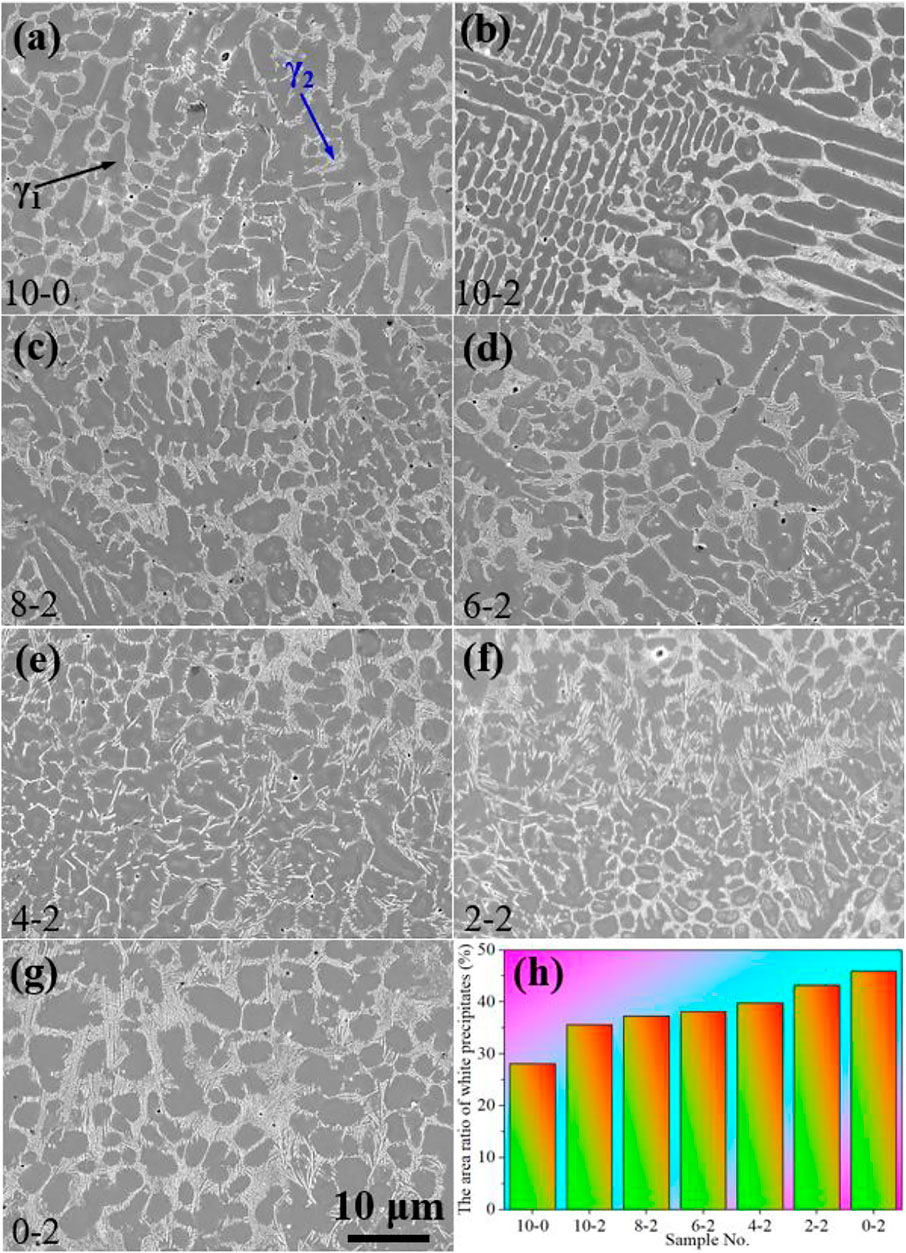
FIGURE 4. SEM image of different samples in the building direction. (A) 10–0; (B) 10–2; (C) 8–2; (D) 6–2; (E) 4–2; (F) 2–2; (G) 0–2; and (H) the area ratio of white precipitates.
Two regions of gray matrix (γ1) and net-like white precipitates (γ2) can appear in the transition zone of the designed materials without W carbides. On the one hand, γ2 is discovered in the building direction of all samples; on the other hand, small-scale γ2 is made of short rod-like precipitates when WC is 0 at.%, long-strip γ2 appears in the 10–2 sample with the addition of 2 at.% WC, as shown in Figure 4B. Also, the length of the white rod-like structure in the transition zone increases gradually from a few hundred nanometers of the 10–2 sample to a few micrometers of the 0–2 sample. Meanwhile, the thickness of γ2 is increased gradually by the reduction in Co content and accompanied with the reduction in the size of the net, the area ratio of γ2 is counted in Figure 4F, it is noted that γ2 with 28.1% appears in the 10–0 sample with 10 at.% Co and 0 at.% WC, and the area ratio of γ2 is increased to 35.6% owing to the addition of WC with 2 at.%. Furthermore, the area ratio of γ2 is increased gradually with the reduction in Co content, and the area ratio of the 0–2 sample without Co can be increased by 28.9% relative to the 10–2 sample with 10 at.% Co. On the other hand, according to the EDS results of Figure 5, these results indicated that a selective segregation can occur between different alloying elements, and Co element has a greater role in the segregation degree of other alloying elements (Li et al., 2010). For example, the mass ratio of Cr and Mn elements within γ2 is higher than that within γ1. It is obvious that white rod-like structure is a Cr, Mn-rich precipitate with γ structure, and its detail mass ratio of Cr, Mn, Fe, and Co elements include 19.6, 34.5, 35, and 10.9 wt%, respectively. However, the mass ratio of Fe, Co-rich γ1 includes 16 wt% Cr, 32.9 wt% Mn, 39.8 wt% Fe, and 11.3 wt% Co. Moreover, WC can be decomposed into W and C elements, and then diffused into the HEA matrix during laser cladding (Li et al., 2021), and the priority ranking of segregation between Cr and W elements is higher than that between Cr and Mn elements, therefore, a higher W content of 9.7 wt% is within γ2 accompanied with Mn element of lower mass ratio with 30.4 wt%, and the detailed information for the microstructure and element distribution of the 10–2 sample in the building direction is discovered in Figure 6. The A region of Figure 6A is magnified as Figures 6B,C, and the interface between the WC particle and HEA matrix has an obvious transition zone (Figure 6B). Meanwhile, the mass ratio of the alloying elements for ten points from the WC particle to the HEA matrix are detected by EDS in Figure 6C and its illustration. It is noted that W element of above 5 wt% is discovered in the HEA matrix. However, a higher ratio of W element exists in the γ2.
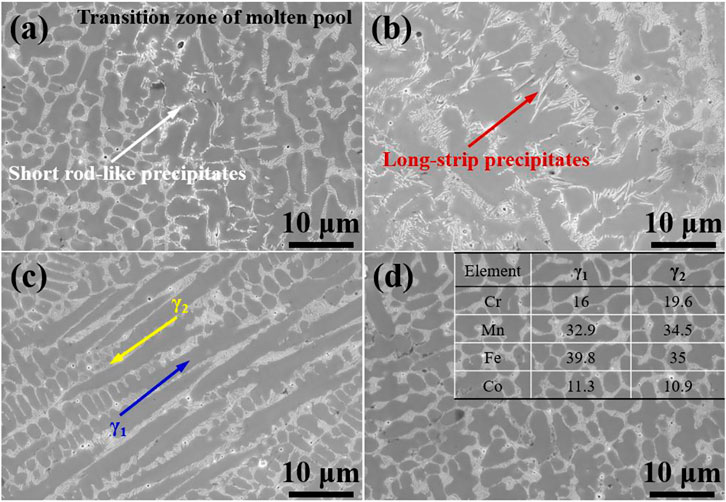
FIGURE 5. Microstructure and elemental composition of the 10–0 sample. (A–D) are only different microstructure of local region in the the 10-0 sample. .
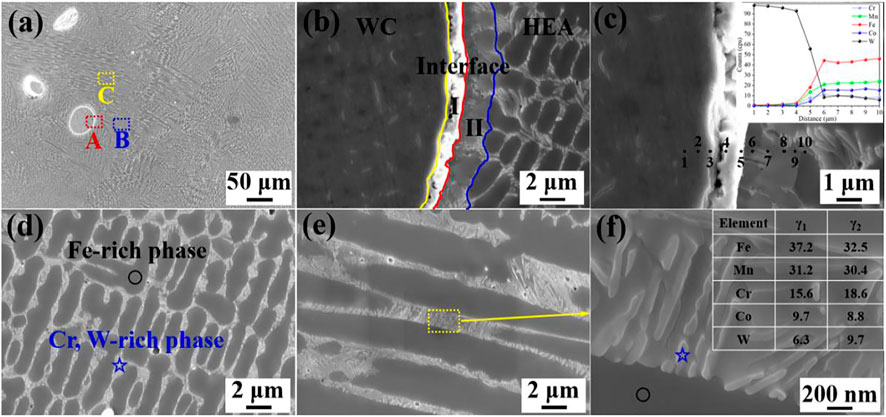
FIGURE 6. SEM image and the corresponding elemental composition of the 10–2 sample. (A) sketch maps of different morphologies; (B,C) magnified image of A region in the (A) and points' elemental composition; (D) magnified image of B region in the (A); (E,F) magnified image of C region in the (A) and points' elemental composition.
Cracking Behaviors
Figure 7 shows cracking behaviors of the samples in the building and scanning directions. It is obvious that the cracking phenomenon can appear owing to the addition of WC particles. Although WC can be decomposed and diffused to the matrix and result in a relatively good bonding in the interface between the WC particles and the matrix (Lou et al., 2003), cracks is discovered in the 10–2 sample on account of a local stress caused by the addition of WC and high temperature gradient during laser cladding. In addition, the numbers of cracks increase gradually with the decrease in Co content. Cracks is never discovered in the building and scanning directions of the 10–0 sample, because higher Co can efficiently reduce the crack susceptibility (Gao et al., 2009), but one crack appears along the scanning direction in the 10–2 sample when it is cladded to the fifth layer. Although the formation of cracks in the fifth layer for the 8–2 sample, the number of cracks increase to 2, as shown in Figure 7C and its illustration. Particularly, crack begin to form in the vertical direction of the scanning direction when the Co content decreases to 6 at.%. This can be because cracks appear in the third layer, and the crack is constantly expanded in later cladding. With the decrease in Co content, cracking morphology begins to change from cross style to net-like style accompanied with an increase in the number of cracks, as shown in Figures 7E–G. Meanwhile, a portion of small block falls away on the surface of the 0–2 sample, this tendency is in accordance with the macroscope of Figure 7F. It seems to indicate that Co element can contribute to reduce the cracking probability due to the decrease in the proportion of γ2 with higher brittlement. In addition, the lattice distortion can contribute to the cracking initiation. In other words, the cracking initiation can be attributed to the synergistic effect of temperature gradient and lattice distortion caused by the segregation of Co and W atoms.
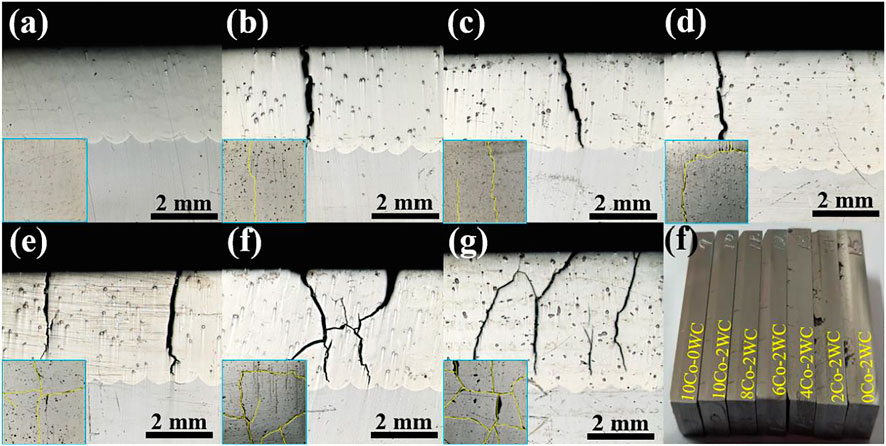
FIGURE 7. Cracking characteristics of the samples in the building and scanning directions. (A) 10–0 sample; (B) 10–2 sample; (C) 8-2 sample; (D) 6–2 sample; (E) 4–2 sample; (F) 2–2 sample; and (G) 0–2 sample.
Microhardness and Tribological Behaviors
It is well known that excellent wear resistance is attributed to high hardness or low friction coefficient of the designed material (Chen et al., 2019; Gao et al., 2019; Yuan et al., 2021). Figure 8 shows the microhardness and tribological characteristics of the samples with different Co contents. As shown in Figure 8A, average microhardness of the samples increases gradually with the decrease in Co content or adding WC (Nagarjuna and Sarma, 2002), average microhardness of the 10–2 sample is increased by 5.7% relative to the 10–0 sample with the addition of 2 at.% WC and 10 at.% Co. In addition, the microhardness reaches 680 HV when the Co content is decreased to 0 at.%, this value is 52.8% higher than that of the 10–2 sample with 10 at.% Co. In addition to microhardness, there is a large difference in the friction coefficient of the samples with different Co contents, as shown in Figure 8B. Co content has significant effects on friction coefficient with the increasing trend; friction coefficient with 0.3 can exist in the 10–0 sample during the stable stage of friction-wear testing, and the friction coefficient can be higher than 0.6 when the Co content is less than 6 at.%.
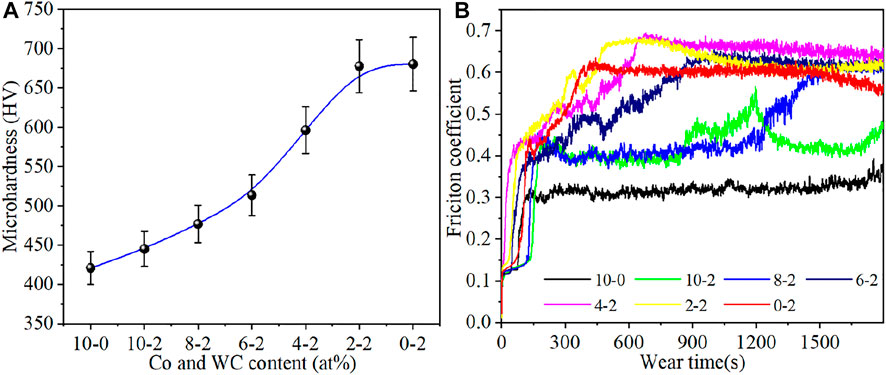
FIGURE 8. Microhardness (A) and friction coefficient (B) of the samples with different Co contents.
However, the friction coefficient is not a main factor in the wear resistance of the designed materials; herein, hardness is the most significant factor affecting tribological behaviors, as shown in Figures 3D, 9. Images of the wear tracks with different samples are characterized by 3D laser confocal scanning microscopy, and the wear depth and width can be accordance with the changing trend of wear rate, as shown in Figures 9A–G. A maximum depth and width of wear track appear in the 10–0 sample, smaller depth and width of wear track occur in the samples with lower Co content, such as the 4–2, 2–2, and 0–2 samples. Furthermore, the corresponding wear rates are calculated based on Eq. 1. It is noted that the wear rate is decreased gradually with an increase in hardness owing to the reduction in Co content. The wear rate of the 10–0 sample without WC is about 85 × 10–6 mm/(Nm), and the value of the 10–2 sample with the microhardness of 445.2 HV is decreased dramatically by 32.1% relative to the 10–0 sample with 421 HV. Furthermore, the wear rate is reduced to 8.85 × 10⁻⁶ mm/(Nm) when the Co content decreases to 0 at.% accompanied with the microhardness of 680.4 HV.
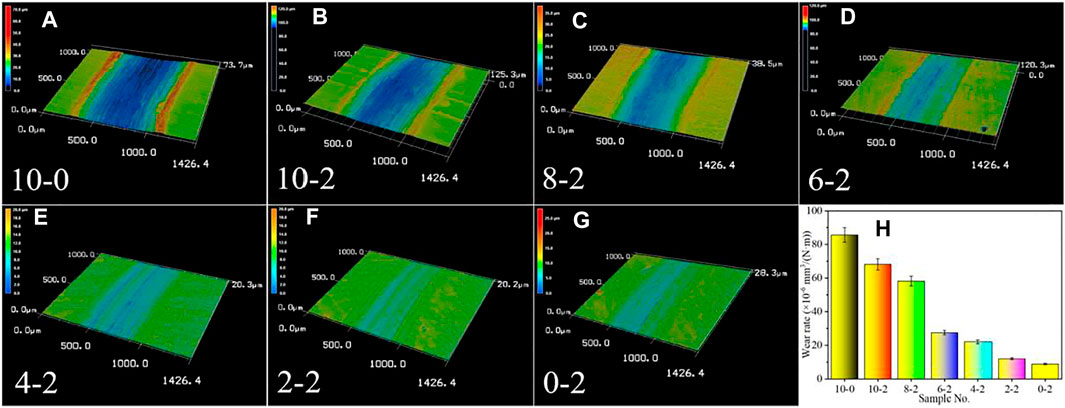
FIGURE 9. 3D skeleton map of wear tracks and their wear rates of the samples with different Co contents. (A–G) 3D skeleton map of wear tracks of the samples and (H) the wear rate of the samples after 1,800 s.
To better understand the wear mechanisms, micro morphology of wear tracks for four typical samples are shown in Figure 10 and Figure 11. On the one hand, the width of wear track is a downward trend in spite of a larger value in the 2-2 sample. The width of wear track is about 935.8 μm in the 10–0 sample when the value is 756.6 μm in the 10–2 sample with 2 at. % WC, and their wear tracks have an obvious boundary in the 10–0 and 10–2 samples. However, a fuzzy boundary exists in the 6–2 and 2–2 samples due to the attachment of debris in the edge of wear track, therefore, a lager value is reflected in the 6–2 and 2–2 samples relative to their real values. It also implies that significant plastic deformation features are exhibited in the 10–0 and 10–2 samples during the friction and wear, but small plastic deformation features occur in the 6–2 and 2–2 samples on account of higher hardness. On the other hand, the corresponding alloying elemental distribution of wear tracks are detected by EDS line scanning. Alloying elements are distributed uniformly within wear track in the 10–0 sample, and discrete debris is never discovered on the surface of wear track and accompanies with a clear texture within the wear track of the 10–0 sample. However, a large fluctuation of Si element exists in the local region of the 10–2, 6–2, and 2–2 samples owing to the attachment of debris from the Si3N4 counterpart. There is an interesting difference in the morphology of wear track, a small amount of discrete debris appears in the wear track of the 10–2 sample, and more discrete debris exists within the wear tracks of the 6–2 and 2–2 samples. These results indicate that a typical adhesive wear mechanism appears under higher Co content, and the wear mechanism is transformed gradually from a typical adhesive wear mechanism to an abrasive wear mechanism with the reduction in Co content (Jiang et al., 2017).
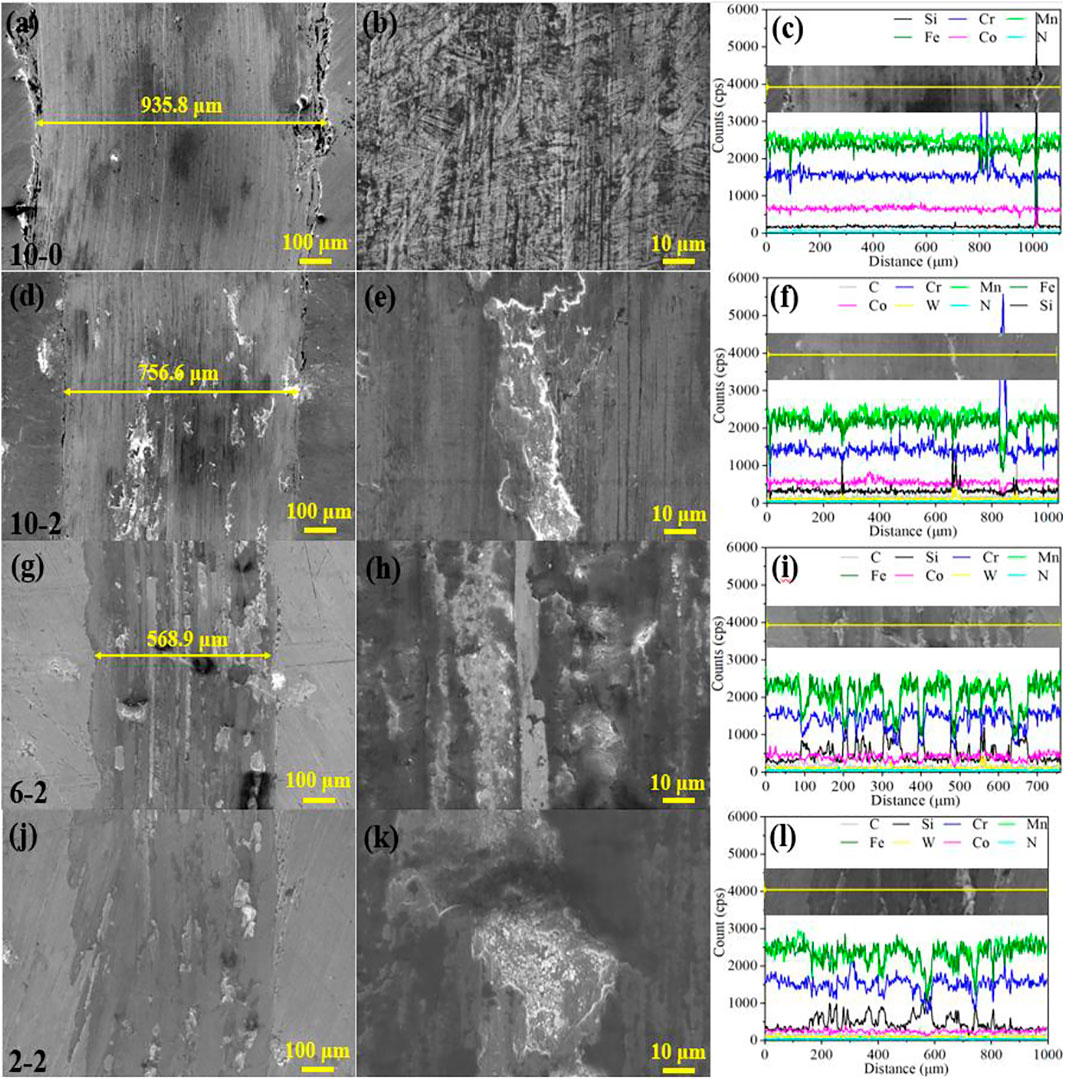
FIGURE 10. Backscattered electron images of wear tracks in the samples and the corresponding alloying elemental distribution in line scanning. (A)(B)(C) Wear track of the 10–0 sample; (D)(E)(F) wear track of the 10–2 sample; (G)(H)(I) wear track of the 6-2 sample; and(J)(K)(L) wear track of the 2–2 sample.
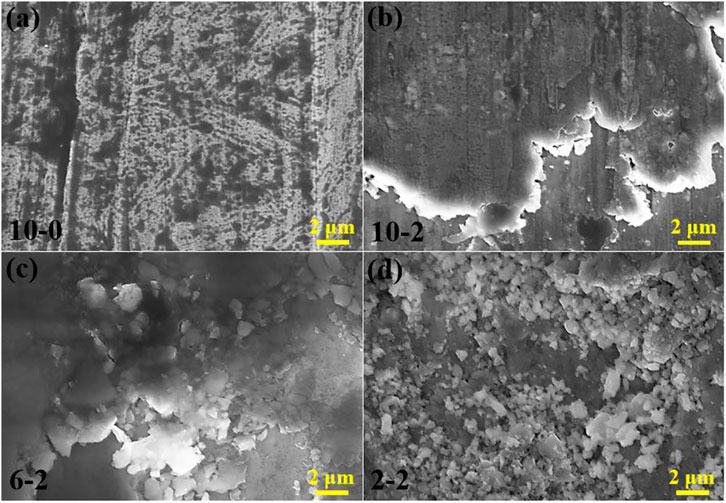
FIGURE 11. Local surface morphology of the wear tracks in the four typical samples. (A) The 10–0 sample; (B) the 10–2 sample; (C) the 6–2 sample; and (D) the 2–2 sample.
Conclusion
WCp-reinforced FeCrMnCox (x = 0, 2, 4, 6, 8 and 10 at.%) HEAs are fabricated using the laser cladding method. The influence of Co content on microstructure, microhardness, and wear resistance is studied. The main conclusions are as follows:
1) An fcc-structure γ phase is formed in the sample with 10 at.% Co accompanied with a small amount of bcc-structure α phase. Also, Cr, Co-rich net-like white precipitate is distributed uniformly, and the ratio of white precipitate is increased with the reduction in Co content. In addition, the intensity of WC and W2C peaks is stronger with the decrease in Co content because Co can promote the decomposition of WC particles and diffuse into the matrix.
2) The crack began to form and increase gradually with the addition of WC or the reduction in Co element, and the cracking initiation can be attributed to a synergistic effect of temperature gradient during laser cladding and lattice distortion caused by the segregation of Co and W atoms.
3) Microhardness is increased gradually with a decrease in Co content, and the microhardness is only 421 HV0.5 in the 10–0 sample, and the microhardness of the 0–2 sample is increased by 61.6% compared to the 10–0 sample. In addition, excellent wear resistance can be attributed to a main factor of microhardness, the wear rate has a monotone decrease with the monotone increase in microhardness. The wear rate of the 0–2 sample is the minimum value of 8.85 × 10⁻⁶ mm/(Nm), and it is decreased dramatically by 89.6%. Meanwhile, the wear mechanism is also transformed from a typical adhesive mechanism under higher Co content to a major abrasive wear mechanism under lower Co content.
Data Availability Statement
The original contributions presented in the study are included in the article/Supplementary Material, further inquiries can be directed to the corresponding author.
Author Contributions
Conceptualization, PC; methodology, PC and WW; software, YZ and WW; validation, PC, CQ, YuZ, YiZ, MY, and RL; formal analysis, YuZ, WW, and MY; investigation, WW, YuZ, and YiZ; resources, PC; data curation, YuZ and PC; writing—original draft preparation, PC and YuZ; writing—review and editing, CQ and MY; visualization, YuZ; supervision, YiZ; project administration, PC; and funding acquisition, PC, YuZ, and RL. All authors have read and agreed to the published version of the manuscript. Please turn to the CRediT taxonomy for the term explanation. Authorship must be limited to those who have contributed substantially to the work reported.
Funding
This work was funded by the Open Research Fund of State Key Laboratory of High-Performance Complex Manufacturing, Central South University (Grant No. Kfkt 2020-01), and Guangdong Basic and Applied Basic Research Foundation (Grant No. 2019A1515011858). Meanwhile, this work was also supported by the Science and Technology Innovation Program of Hunan Province (Grant No. 2020RC 2002), Hunan Provincial Natural Science Foundation of China (Grants No. 2019JJ50807 and 2021JJ40774), and the Project of State Key Laboratory of High-Performance Complex Manufacturing, Central South University (Grant No. ZZYJKT2021-01).
Conflict of Interest
The authors declare that the research was conducted in the absence of any commercial or financial relationships that could be construed as a potential conflict of interest.
Publisher’s Note
All claims expressed in this article are solely those of the authors and do not necessarily represent those of their affiliated organizations, or those of the publisher, the editors, and the reviewers. Any product that may be evaluated in this article, or claim that may be made by its manufacturer, is not guaranteed or endorsed by the publisher.
References
Chen, P., Wu, Z., Huang, Q., Ji, S., Weng, Y., Wu, Z., et al. (2019). A quasi-2D Material CePO4 and the Self-Lubrication in Micro-arc Oxidized Coatings on Al alloy. Tribology Int. 138, 157–165. doi:10.1016/j.triboint.2019.05.030
Chen, S., Oh, H. S., Gludovatz, B., Kim, S. J., Park, E. S., Zhang, Z., et al. (2020). Real-time Observations of TRIP-Induced Ultrahigh Strain Hardening in a Dual-phase CrMnFeCoNi High-Entropy alloy. Nat. Commun. 11 (No. 1), 826. doi:10.1038/s41467-020-14641-1
Choi, W.-M., Jo, Y. H., Sohn, S. S., Lee, S., and Lee, B.-J. (2018). Understanding the Physical Metallurgy of the CoCrFeMnNi High-Entropy alloy: an Atomistic Simulation Study. Npj. Comput. Mater. 4 (1), 1. doi:10.1038/s41524-017-0060-9
Gao, L.-l., Bian, X.-f., Tian, Y.-s., and Fu, C.-x. (2009). Effect of Co on Microstructure and Interfacial Properties of Fe-Based Laser Cladding. J. Iron Steel Res. Int. 16 (4), 84–88. doi:10.1016/s1006-706x(09)60066-2
Gao, P.-H., Chen, B.-Y., Wang, W., Jia, H., Li, J.-P., Yang, Z., et al. (2019). Simultaneous Increase of Friction Coefficient and Wear Resistance through HVOF Sprayed WC-(nano WC-Co). Surf. Coat. Technology 363, 379–389. doi:10.1016/j.surfcoat.2019.02.042
George, E. P., Raabe, D., and Ritchie, R. O. (2019). High-entropy Alloys. Nat. Rev. Mater. 4 (8), 515–534. doi:10.1038/s41578-019-0121-4
Holcomb, G. R., Tylczak, J., and Carney, C. (2015). Oxidation of CoCrFeMnNi High Entropy Alloys. JOM. 67 (10), 2326–2339. doi:10.1007/s11837-015-1517-2
Jiang, H., Jiang, L., Qiao, D., Lu, Y., Wang, T., Cao, Z., et al. (2017). Effect of Niobium on Microstructure and Properties of the CoCrFeNb X Ni High Entropy Alloys. J. Mater. Sci. Technology. 33 (7), 712–717. doi:10.1016/j.jmst.2016.09.016
Joseph, J., Haghdadi, N., Annasamy, M., Kada, S., Hodgson, P. D., Barnett, M. R., et al. (2020). On the Enhanced Wear Resistance of CoCrFeMnNi High Entropy alloy at Intermediate Temperature. Scripta Materialia. 186, 230–235. doi:10.1016/j.scriptamat.2020.05.053
Li, N., Wu, S., Ouyang, D., Zhang, J., and Liu, L. (2020). Fe-based Metallic Glass Reinforced FeCoCrNiMn High Entropy alloy through Selective Laser Melting. J. Alloys Compounds. 822, 153695. doi:10.1016/j.jallcom.2020.153695
Li, Y. M., Liu, H. J., Liu, J., An, B., and Hao, Y. (2010). Effect of Co on As-Cast Structure and Properties of K4169 Superalloy. J. Foundry. Technology. 31 (3), 280.
Li, Z., Körmann, F., Grabowski, B., Neugebauer, J., and Raabe, D. (2017). Ab Initio assisted Design of Quinary Dual-phase High-Entropy Alloys with Transformation-Induced Plasticity. Acta Materialia 136, 262–270. doi:10.1016/j.actamat.2017.07.023
Li, Z., Pradeep, K. G., Deng, Y., Raabe, D., and Tasan, C. C. (2016). Metastable High-Entropy Dual-phase Alloys Overcome the Strength-Ductility Trade-Off. Nature. 534 (7606), 227–230. doi:10.1038/nature17981
Li, Z., Teng, B., Yao, B., and Liu, J. (2021). Microstructure and Mechanical Properties of WC Reinforced 18Ni300 Composites Produced by Selective Laser Melting. Mater. Characterization. 180, 111406. doi:10.1016/j.matchar.2021.111406
Lou, D., Hellman, J., Luhulima, D., Liimatainen, J., and Lindroos, V. K. (2003). Interactions between Tungsten Carbide (WC) Particulates and Metal Matrix in WC-Reinforced Composites. Mater. Sci. Eng. A. 340 (No. 1), 155. doi:10.1016/s0921-5093(02)00173-9
Luo, H., Li, Z., Mingers, A. M., and Raabe, D. (2018). Corrosion Behavior of an Equiatomic CoCrFeMnNi High-Entropy alloy Compared with 304 Stainless Steel in Sulfuric Acid Solution. Corrosion Sci. 134, 131–139. doi:10.1016/j.corsci.2018.02.031
Nagarjuna, S., and Sarma, D. S. (2002). Effect of Cobalt Additions on the Age Hardening of Cu-4.5Ti alloy. J. Mater. Sci. 37 (10), 1929. doi:10.1023/A:1015278610543
Riabkina-Fishman, M., Rabkin, E., Levin, P., Frage, N., Dariel, M. P., Weisheit, A., et al. (2001). Laser Produced Functionally Graded Tungsten Carbide Coatings on M2 High-Speed Tool Steel. Mater. Sci. Eng. A 302 (1), 106–114. doi:10.1016/s0921-5093(00)01361-7
Santodonato, L. J., Zhang, Y., Feygenson, M., Parish, C. M., Gao, M. C., Weber, R. J. K., et al. (2015). Deviation from High-Entropy Configurations in the Atomic Distributions of a Multi-Principal-Element alloy. Nat. Commun. 6, 5964. doi:10.1038/ncomms6964
Sarker, P., Harrington, T., Toher, C., Oses, C., Samiee, M., Maria, J.-P., et al. (2018). High-entropy High-Hardness Metal Carbides Discovered by Entropy Descriptors. Nat. Commun. 9 (1), 4980. doi:10.1038/s41467-018-07160-7
Tracy, C. L., Park, S., Rittman, D. R., Zinkle, S. J., Bei, H., Lang, M., et al. (2017). High Pressure Synthesis of a Hexagonal Close-Packed Phase of the High-Entropy alloy CrMnFeCoNi. Nat. Commun. 8 (1), 15634. doi:10.1038/ncomms15634
Tsai, K.-Y., Tsai, M.-H., and Yeh, J.-W. (2013). Sluggish Diffusion in Co-cr-fe-mn-ni High-Entropy Alloys. Acta Materialia 61 (13), 4887–4897. doi:10.1016/j.actamat.2013.04.058
Tu, J., Zhou, K.-F., Zhou, Z.-M., Huang, C., and Tang, H.-L. (2017). Microstructural Characteristics of Cobalt Treated by High-Speed Laser Surface Melting under High Power. Mater. Characterization. 128, 63–67. doi:10.1016/j.matchar.2017.03.037
Van Acker, K., Vanhoyweghen, D., Persoons, R., and Vangrunderbeek, J. (2005). Influence of Tungsten Carbide Particle Size and Distribution on the Wear Resistance of Laser Clad WC/Ni Coatings. Wear. 258 (1), 194. doi:10.1016/j.wear.2004.09.041
Wang, J.-y., Fang, J.-h., Yang, H.-l., Liu, Z.-l., Li, R.-d., Ji, S.-x., et al. (2019). Mechanical Properties and Wear Resistance of Medium Entropy Fe40Mn40Cr10Co10/TiC Composites. Trans. Nonferrous Met. Soc. China. 29 (7), 1484–1494. doi:10.1016/s1003-6326(19)65055-7
Xin, X., Zhang, W. H., Yu, L. X., Liu, F., Jia, D., Sun, W. R., et al. (2015). Effects of Co on the Solidification and Precipitation Behaviors of IN 718 alloy. Msf. 816, 613–619. doi:10.4028/www.scientific.net/msf.816.613
Yang, Q. Q., Senda, T., and Ohmori, A. (2003). Effect of Carbide Grain Size on Microstructure and Sliding Wear Behavior of HVOF-Sprayed WC–12% Co Coatings. Wear 254 (No. 1), 23. doi:10.1016/S0043-1648(02)00294-6
Yuan, Q., Chai, L., Shen, J., Wang, H., Guan, H., Guo, N., et al. (2021). Microstructural Characteristics, Hardness and Wear Resistance of a Typical Ferritic/martensitic Steel Surface-Treated by Pulsed Laser. Surf. Coat. Technology 418, 127261. doi:10.1016/j.surfcoat.2021.127261
Zou, Y., Ma, H., and Spolenak, R., Ultrastrong Ductile and Stable High-Entropy Alloys at Small Scales, Nat. Commun., 6(2015), p. 7748. doi:10.1038/ncomms8748
Zhang, Y., Lai, R., Chen, Q., Liu, Z., Li, R., Chen, J., et al. (2021). The Correlation Analysis of Microstructure and Tribological Characteristics of In Situ VCp Reinforced Iron-Based Composite. Materials 1415, 4343. doi:10.3390/ma14154343
Zhao, Y., Lee, D.-H., Seok, M.-Y., Lee, J.-A., Phaniraj, M. P., Suh, J.-Y., et al. (2017). Resistance of CoCrFeMnNi High-Entropy alloy to Gaseous Hydrogen Embrittlement. Scripta Materialia 135, 54–58. doi:10.1016/j.scriptamat.2017.03.029
Zheng, F., Zhang, G., Chen, X., Yang, X., Yang, Z., Li, Y., et al. (2020). A New Strategy of Tailoring Strength and Ductility of CoCrFeNi Based High-Entropy alloy. Mater. Sci. Eng. A 774, 138940. doi:10.1016/j.msea.2020.138940
Zhu, L., Xue, P., Lan, Q., Meng, G., Ren, Y., Yang, Z., et al. (2021). Recent Research and Development Status of Laser Cladding: A Review. Opt. Laser Technology 138, 106915. doi:10.1016/j.optlastec.2021.106915
Keywords: high-entropy alloys, laser cladding method, cracking behaviors, microhardness, wear resistance
Citation: Wu W, Qiu C, Zhou Y, Yan M, Zhang Y, Li R and Chen P (2022) Influence of Co Content on Cracking Behavior and Wear Resistance of WCp-Reinforced FeCrMnCox HEAs Fabricated by the Laser Cladding Method. Front. Mater. 9:811253. doi: 10.3389/fmats.2022.811253
Received: 08 November 2021; Accepted: 28 February 2022;
Published: 21 March 2022.
Edited by:
Peng Cao, The University of Auckland, New ZealandReviewed by:
Ning Guo, Southwest University, ChinaHui Zhang, Anhui University of Technology, China
Bharat Gwalani, Pacific Northwest National Laboratory (DOE), United States
Copyright © 2022 Wu, Qiu, Zhou, Yan, Zhang, Li and Chen. This is an open-access article distributed under the terms of the Creative Commons Attribution License (CC BY). The use, distribution or reproduction in other forums is permitted, provided the original author(s) and the copyright owner(s) are credited and that the original publication in this journal is cited, in accordance with accepted academic practice. No use, distribution or reproduction is permitted which does not comply with these terms.
*Correspondence: Pinghu Chen, Y2hlbnBpbmdodTE5ODZAMTYzLmNvbQ==