 Julia Sjöström
 A. Durga
 Greta Lindwall
- 1Department of Materials Science and Engineering, KTH Royal Institute of Technology, Stockholm, Sweden
- 2VBN Components AB, Uppsala, Sweden
Additive manufacturing (AM) offers several benefits including the capability to produce unique microstructures, geometrical freedom allowing for material and energy savings, and easy production lines with fewer post-processing steps. However, AM processes are complex and phenomena occurring at different length and time scales need to be understood and controlled to avoid challenges with, for example, defects, residual stresses, distortions, and alloy restrictions. To overcome some of these challenges and to have more control over the final product, computational tools for different length scales need to be combined. In this work, an 18Ni300 maraging steel part is studied to understand the link between the process parameters and the as-built microstructure. The temperature evolution during laser powder bed fusion is simulated using the MSC simulation software Simufact Additive. This result is then linked to microscale models within the Thermo-Calc software package to predict the elemental micro-segregation, martensite start (Ms) temperature, and martensite fraction. The different values of the key process parameters such as laser speed, laser power, heating efficiency, and baseplate temperature are considered, leading to different thermal histories. The thermal histories affect the elemental segregation across the solidification structure, which in turn results in different Ms temperatures at different locations of the built part. It is found that higher laser energy generally causes higher temperatures and higher cooling rates, which results in a larger degree of elemental segregation and lower Ms temperatures in segregated regions. Furthermore, the segregated regions are predicted to have Ms temperatures below 200°C, which would result in retained austenite when using a baseplate temperature of 200°C. On the other hand, by using a baseplate temperature of 100°C, all regions would reach temperatures below the Ms temperature, and an almost fully martensitic structure would be possible. In summary, it is demonstrated how the linkage of macro- and microscale modeling tools for AM can be used to optimize the process and produce the desired microstructure, thereby achieving the desired mechanical properties.
Introduction
Metal additive manufacturing (AM) is expanding in use and research. More companies and institutions discover and explore the benefits of this growing and relatively novel technology. The novelty, however, brings several challenges and areas to improve. For example, challenges arise regarding microstructure, residual stresses, and distortions. The use of computational tools helps to predict different aspects of the AM process in order to overcome these challenges and control the final material properties.
Process parameters such as laser scanning speed, laser power, efficiency or absorptivity, hatch spacing, and baseplate temperature impact the final quality of the finished component, such as surface roughness, microstructure, fatigue strength, density, and hardness (Sinaei and Fatemi, 2021). The laser scanning speed affects the amount of energy available to melt the powder. If the speed is too high, it will leave unmelted powder resulting in porosity and poor surface quality. If the speed is too low, the energy consumption is unnecessarily large, and the risk for evaporation is larger. Similar consequences will rise if the selected laser power is inappropriate. The efficiency of the process is set by the amount of laser energy that is transferred to the powder bed, after accounting for radiation, reflection, and convection losses. In addition, a suitable build baseplate temperature can lower the risk of solidification cracking and distortions (Kempen, 2014). These factors, together with the hatch distance, powder layer thickness, and scan orientation, should be chosen optimally in relation to each other to reduce this risk of porosity and to achieve dense parts. The thermal history and level of cleanliness also have a large impact on the final microstructure. During AM, high cooling rates cause phase transformations far from equilibrium and large temperature gradients may induce residual stresses and distortions (Kruth, 2004; Belle, 2013; Papadakis et al., 2014).
Modeling may be used to predict the resulting characteristics of a printed component and can be helpful to minimize time-consuming and expensive trial-and-error experimental methods. There are various approaches to simulate AM processes, ranging from computational fluid dynamic tools such as ANSYS Fluent, ABAQUS, Sierra Multiphysics, Flow 3D, and ALE3D that simulate the temperature and strain evolution at the melt pool scale in great detail to those such as Simufact Additive, 3DSIM, Additive Works, and GEONX that use a simplified approach by using an element layer technique instead of a moving heat source. The key to an efficient modeling approach is to enable interlinkage of phenomena occurring at different length scales. For this, simulated microscale information on a small computational domain should be connected to a macroscale calculation on a full component (Fan, 2017). Due to the complexity of influencing factors, a combination of modeling tools is needed. By combining CALPHAD-based tools with finite element method (FEM) modeling, meso- and macroscale aspects such as thermal evolution can be linked with microstructure models. This approach is necessary to understand the connection between process parameters and material characteristics and has for example been applied by Smith et al. (2016) to predict the microstructure evolution during solidification of an AM processed SS316L material.
Material development is needed to accompany the new additive way of manufacturing, and much focus is put on powder bed fusion (PBF)-based technologies in which the powder is melted in a layer-by-layer pattern by a specific energy source. Different steel grades are of major interest due to many possible benefits of steels in combination with the geometrical freedom that the PBF technologies offer. In the tooling industry, for example, which has large requirements on material performance, high-strength martensitic steels are of interest for AM. Chou et al. (2021) investigated a martensitic, medium carbon steel for hot-work tooling applications and correlated the Ms temperature and its dependence on the degree of micro-segregation with the retained austenite fraction using computational thermodynamics and kinetics tools. New alloy families for PBF are continuously being developed and the Vibenite® group of alloys is one example in which high carbon contents do not cause cracking but rather enhance performance further through the electron beam powder bed fusion (E-PBF) manufacturing method (VBN Components AB, 2019). Up to 65% carbides are achieved which previously was considered impossible to print and give rise to hardness levels up to 72 HRC in the case of Vibenite® 290, which makes it one of the hardest alloys in the world. These are examples in which AM clearly provides improved performance, in addition to the geometry freedom (Beste, 2021).
Maraging steels have also been researched extensively for AM. Their low carbon content leads to a relatively soft martensitic matrix, which makes them less challenging to manufacture by AM than the higher carbon grades mentioned above. A common maraging steel used for laser powder-bed fusion (L-PBF) is of the grade 18Ni300 (Shamsdini et al., 2020). During L-PBF, the high cooling rates result in an as-built microstructure of highly dislocated martensite (Conde et al., 2021). The presence of the alloying elements Ni, Mo, and Ti results in nano-sized intermetallic precipitates during post-heat treatments performed for the material to reach desired toughness, hardness, and Young’s modulus, etc. Aging also increases the austenite fraction (Kapoor et al., 2003; Jägle, 2014), and this austenite reversion typically occurs in Ni-rich regions of retained austenite during over-aging and is desired when higher ductility is needed. In the case of L-PBF of 18Ni300, there is a possibility that the fraction of austenite increases during the process due to intrinsic heat treatment. The upper part of the component experiences shorter intrinsic heating times, and there is less time for austenite to grow and also for precipitation of the hardening precipitates. These aspects show why it is important to understand, and be able to predict, the influence of the process parameters in order to optimize or control the resulting microstructure and material performance. Typically, a fine cellular solidification sub-structure is seen in the as-built microstructure after L-PBF of 18Ni300 in which the cell diameter is ≤ 1 μm (Tan, 2017; Mutua et al., 2018). This very fine segregated cellular structure is achieved due to the high solidification velocities affected by the laser scanning speed. Higher speeds usually increase the cooling rate and leave no time for secondary dendrite arm formation (Freeman et al., 2019).
In the context of maraging steels, one particularly interesting area to investigate is martensite transformation. As-built maraging steels consist of approximately 94% martensite (Kempen et al., 2011; Mutua et al., 2018). The amount of retained and reversed austenite is correlated to the segregation during solidification, which in turn depends on the cooling rates. Interdendritic/cellular regions tend to contain increased amounts of austenite-stabilizing elements, which decrease the Ms temperature in those regions. Chou et al. (2021) have shown that the segregation during L-PBF affects the martensite transformation in hot-work tool steels. The martensite–austenite balance determines the material properties and is therefore an important factor to predict. The link between process parameters and phase fractions is thus studied in this work with the aim to link macro- and microscale modeling tools for 18Ni300 produced using L-PBF. The results can be used to find relations between different process parameter sets and material characteristics so that desired microstructure and thereby mechanical properties may be achieved.
Materials and Methods
To study the microstructure evolution in an 18Ni300 component during L-PBF, the macroscale temperature evolution was first simulated using MSC simulation software Simufact Additive (Simufact Additive, 2020). The results from these simulations were then linked to microstructure models within the Thermo-Calc software package (Andersson et al., 2002) to study how printing parameters affect the micro-segregation and subsequently, the Ms temperature.
Simufact Additive is an MSC software tool developed for fast prediction of macroscale properties for powder bed-based additive manufactured components. Simufact Additive uses the Lagrangian computational framework by MSC Marc which allows for the easy activation/deactivation of element technique saving computational cost (Megahed et al., 2016). Heat conduction and radiation are solved at every time step. Phase transformation is considered using the Leblond model involving CCT and TTT diagrams (Leblond and Devaux, 1984). Furthermore, it assumes a flat powder and layer surface and does not consider element vaporization during the build. The powder characteristics are also not considered in the simulations, and the powder does not possess any material differences from bulk material such as density and conduction. Densities for bulk material are, however, considered temperature-dependent for martensite and austenite as well as Young’s modulus (Wang, 2018). Finally, the thermal model does not consider the microscale properties such as surface tension, evaporation, recoil pressure, and Marangoni effect of the melt pool (Megahed et al., 2016).
Thermal Evolution
The printing parameters that were varied and examined in the Simufact Additive simulations are laser speed, laser power, laser energy efficiency, and baseplate temperature. These parameters all affect the energy density and, in turn, the temperature evolution and the elemental segregation. The combination of printing parameters determines the process result, and it is therefore of interest to investigate different sets of parameter combinations.
One way to define the printing parameters more easily is to introduce the volumetric energy density Ev. The parameters influencing Ev for L-PBF are defined in Equation 1 where P is the absorbed laser power [energy efficiency ∙ laser power], v is the scanning speed according to Equation 2, D is the point distance, θ is the exposure time, h is the hatch spacing, and w is the layer thickness.
The energy density needed to melt the powder, Em, depends on the specific heat capacity, c, material density, ρ, melting temperature, Tm, and the ambient temperature, Ta, according to the following equation:
Furthermore, the latent heat of fusion is also considered in the simulations. These equations include the most important process parameters and are hence helpful when optimizing the L-PBF process (Yakout, 2017; Yin et al., 2018; Shamsdini et al., 2020).
Simulation Setup
The simulations were run on a Windows 10 Version 1903 for x64-based systems and Intel Core i5, seventh generation computer. When deciding the different build parameters, the highest as-built density was aimed for according to the previous L-PBF studies of 18Ni300. The range of energy density giving optimal part densities is usually 67–123 J/mm3, and reported parameters (Yakout, 2017; Yin et al., 2018; Shamsdini et al., 2020) were used for this study, as shown in Table 1. The laser energy efficiency was set to 99.2% to reach the recommended energy density of 67.47 J/mm3 (Tan et al., 2017; Bhardwaj and Shukla, 2018). It is assumed that the energy density given in the literature is the one reaching the powder, after considering energy losses from radiation, reflection, and convection. It is also assumed that this energy density is large enough to remelt the underlying layer, ensuring a high densification. A “stripe-wise” scanning strategy was set in accordance with Shakerin et al. (2019), and the initial baseplate temperature was 200°C. The scan width is defined as the distance between two parallel beam centers. The simulated part geometry is shown in Figure 1 and the selected measuring points are shown in Figure 2. The part geometry was chosen to include different shape types, in order to compare and see if there were any local differences between the points at varying locations. The points were chosen accordingly and kept the same for all simulations to observe any geometrical related differences. The part was imported as a CAD-file (Guillaume, 2019) and placed 3 mm above the baseplate. An orientation assistant, included in the Simufact Additive software, calculated the optimal geometry orientation considering the support area and volume, projected area, component height, cost, and local minima. A support structure of 0.12 mm thickness was generated.

TABLE 1. Recommended printing parameters for 18Ni300 (Yakout, 2017; Yin et al., 2018; Shamsdini et al., 2020).
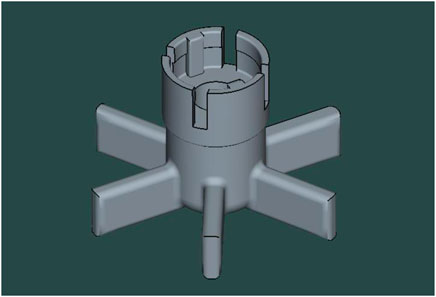
FIGURE 1. Part geometry used in the Simufact Additive simulations.
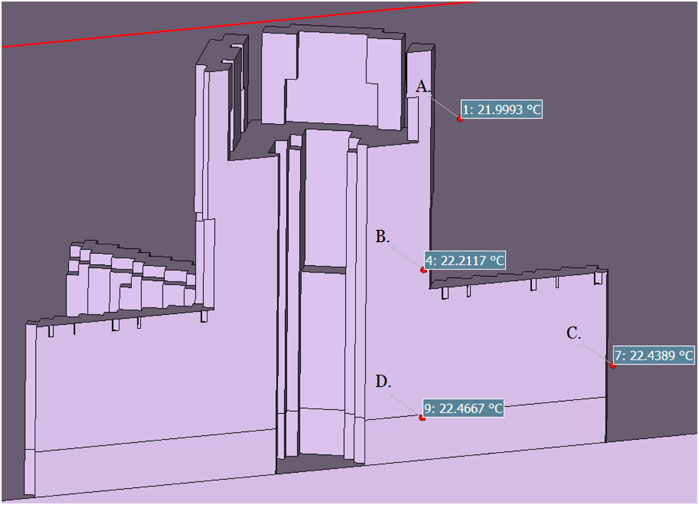
FIGURE 2. Measuring points for temperature evolution in the geometry.
The composition of 18Ni300 applied in this work is listed in Table 2. For the thermal evaluation, a copy of the “MS1-MPM,” a similar maraging steel powder from the Simufact Materials database was first set as the material. The thermal conductivity and specific heat capacity of 18Ni300 are temperature-dependent properties which may highly influence the simulation results. In order to obtain reliable results, the predefined values in Simufact Material were compared to values calculated using Thermo-Calc (Andersson et al., 2002) and to literature data. The thermal conductivity, latent heat of fusion, Young’s modulus, and density were kept as the predefined MS1-MPM values whereas the specific material properties such as solidus and liquidus temperatures, specific heat capacity, and thermal expansion factor were calculated for the 18Ni300 composition using the thermodynamic database TCFE101, see Table 3. Lastly, the numerical setting of calculated time steps considered for each voxel layer was increased from the default value of 14 to 20.
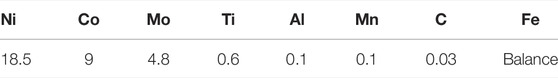
TABLE 2. Composition of 18Ni300 in weight % (wt%).

TABLE 3. Thermodynamic material properties for 18Ni300 calculated using the TCFE10 database1.
To investigate the thermal evolution at the chosen points of the geometry, the mesh setting was fixed to 0.7 mm and power, efficiency, speed, and baseplate temperature were varied. The different combinations of varied parameters are listed in Table 4, and each case has been addressed with a number for convenience. In addition to the process parameters (laser power, scanning speed, and baseplate temperature), the laser power absorption efficiency is needed as an input for the Simufact Additive simulations. Since this efficiency depends on the powder and the laser source and thus is not readily available, it was also varied in the simulations. The efficiency values were selected either to match a reported energy density or set to a more expected value. For the other parameters in the Simufact Additive simulations, the recommended actual build parameters (Yakout, 2017; Yin et al., 2018; Shamsdini et al., 2020) were used as a starting point (Case 1-reference). The values were then varied (Cases 2–7) to values large enough to see changes in the simulation results.
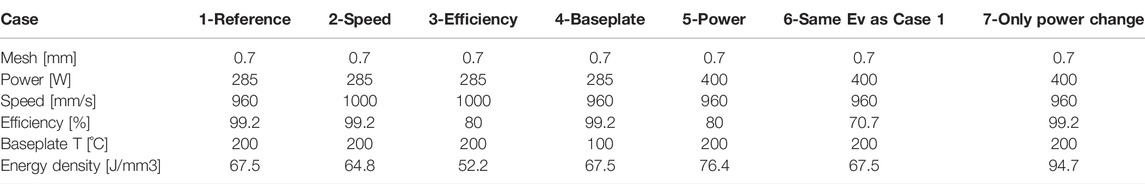
TABLE 4. Seven cases of different combination of process parameters studied by the Simufact Additive simulations.
Micro-Segregation During Printing
The diffusion module (DICTRA) in the Thermo-Calc software package was used as a linkage tool to connect the process simulation to the microstructure evolution. DICTRA simulates diffusion-controlled phase transformations in one dimension for multi-component systems assuming a sharp phase interface and that local equilibrium holds at that interface. The temperature evolution is required as an input, as well as the CALPHAD atomic mobility data for diffusion in the liquid and the solid phases in addition to the CALPHAD thermodynamic data.
Simulation Setup
The elemental segregation in the current work was simulated in the diffusion module DICTRA in Thermo-Calc 2020a, using the Thermo-Calc Software TCFE10 and MOBFE5 Steels/Fe-alloys databases2. The thermal histories of Cases 1, 4, and 5 were imported from Simufact Additive to consider the non-isothermal and time-dependent nature of AM. The small time steps in the FEM data caused numerical problems in the DICTRA calculations. Therefore, the temperature evolutions were approximated as stepwise functions ensuring that the cooling rates remained within around 30% of the cooling rates obtained from the Simufact simulations between each time step. A computational 1D region of 250 nm representing half of the cellular spacing was entered as the computational domain size with a double geometric grid with 180 points with 10% increased grid point density at each edge. Liquid was entered as the active phase present at the start of the simulation, and FCC (austenite) was set as the inactive phase, allowed to form at the right interface boundary. In order to improve the speed of the simulations, but without affecting the results significantly, only the major alloying elements were considered in the simulations, namely, Ni, Co, Mo, Ti, and Fe.
Points A and D in the geometry were compared for the reference case (Case 1), Case 5 with higher power, and Case 4 with lower baseplate temperature. During the solidification calculation, the elemental segregations led to interface compositions at which liquid and austenite could not coexist at equilibrium. Therefore, the calculations for both points for Case 5 and point A for Case 1 could not be completed and stopped when around 0.0005–0.05% liquid remained. In these cases, the calculations were re-started from the same point in time but excluding the liquid phase which allowed them to run till the end.
Ms Temperature
Based on the segregated compositions calculated using DICTRA for Cases 1 and 5, the Ms temperatures at point A and D were calculated using the Ms temperature property model in Thermo-Calc.
The Ms temperature model is a semi-empirical, thermodynamic-based model based on the work by Borgenstam and Hillert (1997) and Stormvinter et al. (2012). It uses the information of experimentally determined Ms temperatures for binary systems and thermodynamic calculations of the driving force for the austenite-to-martensite transition. The model is capable of predicting Ms temperatures of multi-component systems such as commercial steels with good accuracy (Stormvinter et al., 2012).
Simulation Setup
The input composition for the Ms model was the composition profile across the cell calculated with DICTRA, grain size (set to 100 µm) and the end of the martensite transition was taken as the baseplate temperature, which is assumed to be the temperature to which the material is cooled to during printing. The thermodynamic Thermo-Calc Software TCFE10 Steels/Fe-alloys database3 was used, and the calculations were run using TC-Python API of Thermo-Calc to enable efficient calculations for multiple compositions.
Results
Thermal Evolution
The thermal history at point D at the bottom of the part is shown in Figure 3A for Case 1. It shows the first 1300 s during which the location experiences six temperature peaks and is representative of all cases. The thermal histories for all sets of process parameters are shown in Figure 3B. Here, only the first two temperature peaks are shown to make the comparison between the different cases easier. They indicate the peaks during which melting and solidification occur. The time interval between each peak is a result of the time needed to finish melting that particular layer. The slight change in time interval between each case is due to the variation in the parameter settings, for instance, a higher speed results in a shorter time interval. Cases 1 and 6 show approximately the same thermal history with near-identical cooling rates, see Figure 3C where the second temperature peak is shown. These two cases use different build parameters but the same energy density. Case 7 shows that a power increase has a significantly larger impact on the temperature evolution compared to a change in the scanning speed. Case 5, in which a higher laser power is used, leads to higher temperatures than the other cases, even though the efficiency is lowered. Case 4 uses a lower baseplate temperature, 100°C, which does not lead to a remarkable change in the cooling rate compared to the baseplate temperature of 200°C. However, a lower minimum peak temperature is reached. As the cooling proceeds, Case 4 exhibits higher cooling rates than Case 1. Figure 4 shows the cooling rates for point D. Higher peak temperature also correlates with a higher cooling rate.
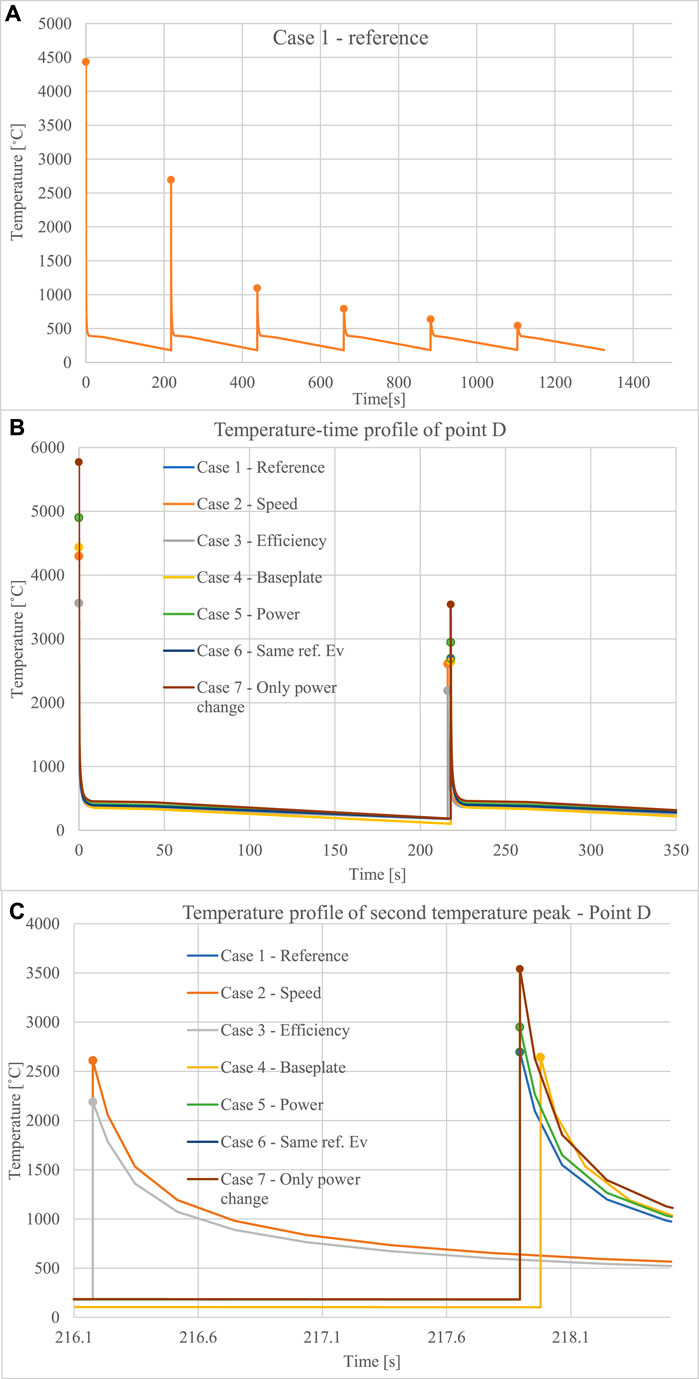
FIGURE 3. Temperature–time profiles at the bottom of the part (point D) using different sets of build parameters for (A) the first 1300 s/six temperature peaks for Case 1, (B) the two first scans leading to melting and solidification, and (C) the second scan leading to melting and solidification for all cases.
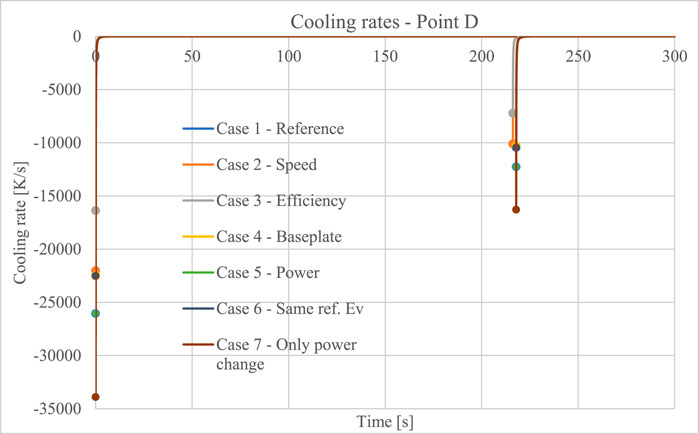
FIGURE 4. Cooling rates at the bottom of point D using different sets of build parameters.
The same pattern is shown when evaluating point A at the top of the component, see Figure 5. The first temperature peaks reach a lower value than for point D, while the second reaches slightly higher temperatures. Furthermore, point A exhibits much higher cooling rates as seen in Figure 6.
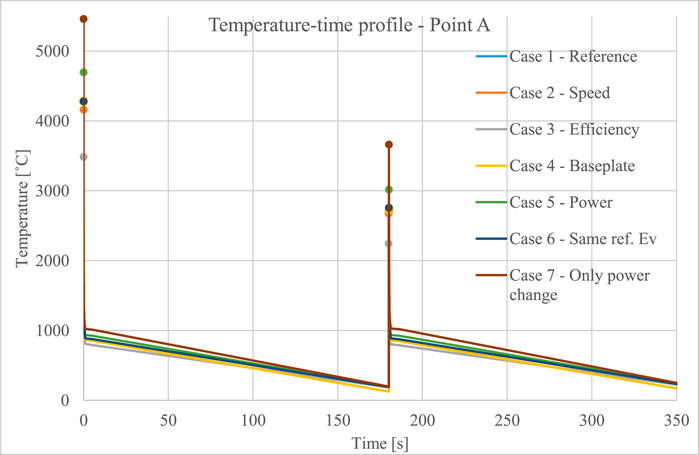
FIGURE 5. Temperature–time profiles at the top of point A using different sets of build parameters.
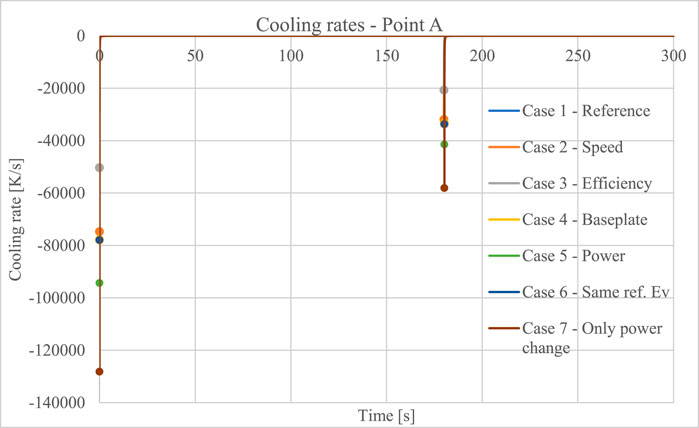
FIGURE 6. Cooling rates for the top of point A using different sets of build parameters.
When comparing the first temperature peaks for point D with those for point A from time 0 (corresponding to the start of complete melting of the region), it is shown that at point A, the time between each layer is shorter, see Figure 7. The results for point C resemble the results for point D. However, at the first temperature peak, the cooling rate and temperature are initially higher for point D but reaches lower temperatures faster than for point C. For the subsequent peaks, the maximum cooling rates are instead higher for point C.
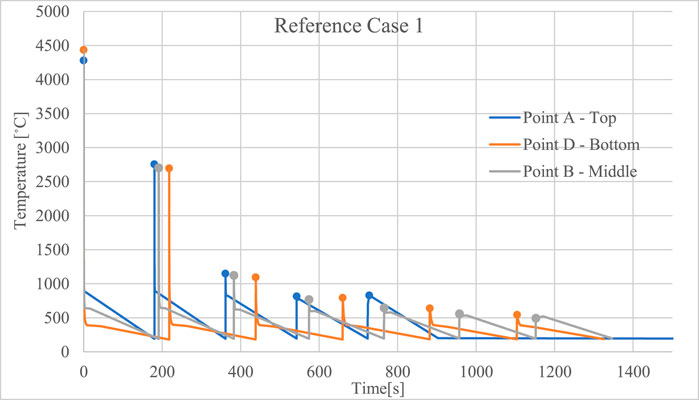
FIGURE 7. First temperature peaks of points A and D for reference Case 1.
A summary of the results and how different parameter inputs affect the resulting cooling rates and segregations are shown in Table 5.
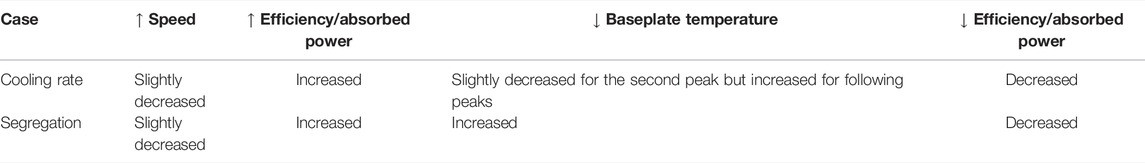
TABLE 5. Summary of parameter effects on cooling rate and segregations.
The results of the first three temperature peaks for all cases are shown in Table 6. The results for point B are in line with the expected trends, moving further from the baseplate from point D, to point B and to point A.
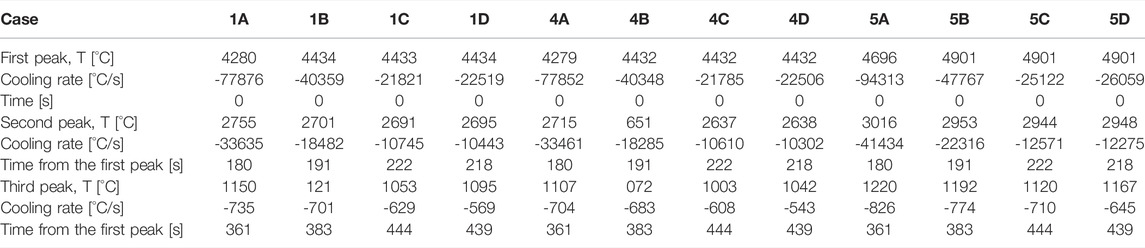
TABLE 6. Summary of the thermal simulation results for all cases and locations.
Micro-Segregation During Printing
To study the effect of the thermal histories on the micro-segregation and the Ms temperature when using a lower baseplate temperature and higher energy density compared to the results of the reference Case, Cases 1, 4 and 5 were used as an input to the DICTRA simulations.
The equilibrium phases for 18Ni300 expected to be present at different temperatures are shown in Figure 8 and the first solid phase to form, FCC (austenite), was used in the diffusion simulations together with the liquid.
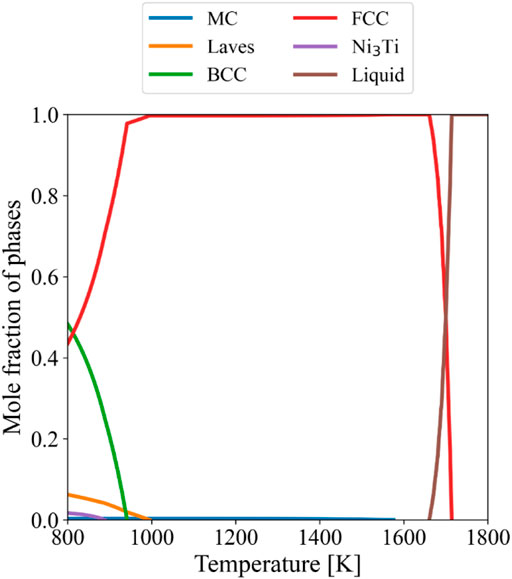
FIGURE 8. Calculated equilibrium phase fractions for the 18Ni300 composition at 1 atmospheric pressure.
The temperature–time profiles from the Simufact Additive simulations used as an input to the DICTRA calculations for the reference case (Case 1), and the increased energy density printing condition case (Case 5) are shown in Figures 9 and 10, respectively. Only one temperature peak is shown to enable the comparison of the different temperature profiles.
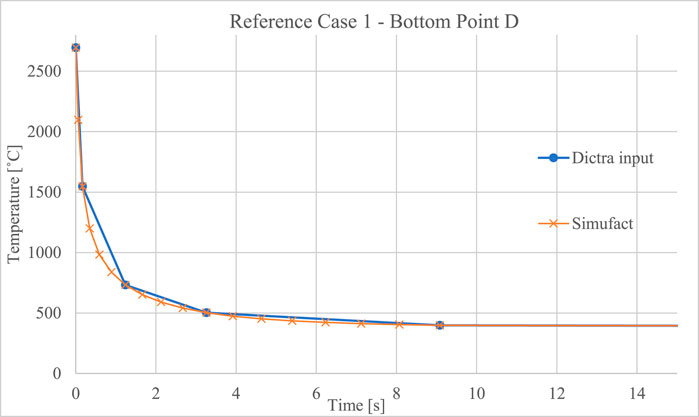
FIGURE 9. Temperature–time profile retrieved from Simufact Additive and used as an input to DICTRA for reference Case 1.
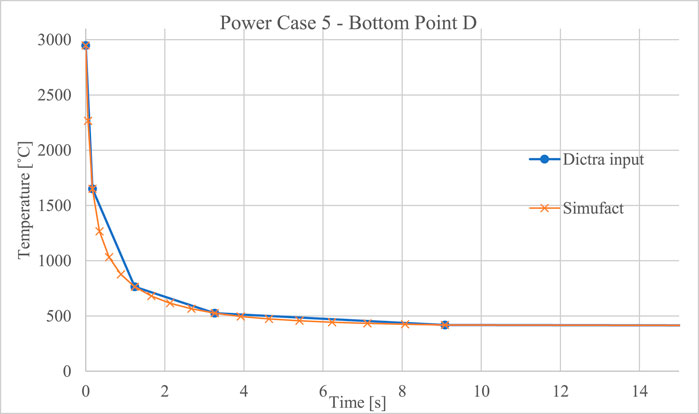
FIGURE 10. Temperature–time profile retrieved from Simufact Additive and used as an input to DICTRA for power Case 5.
For each case, the DICTRA calculations resulted in the same compositional segregation profiles irrespective of whether one, two, or three temperature peaks from the last temperature peak reaching above the liquidus temperature were used as an input. Supplementary Material shows an example simulation using one and two scans from the last temperature peak above the liquidus. Hence, only one peak for each case was used.
The composition profiles obtained from the DICTRA simulations for Cases 1, 4, and 5 after around 200 s after cooling from approximately 3000°C to 200°C are shown in Figure 11 for point D and in Figure 12 for point A.
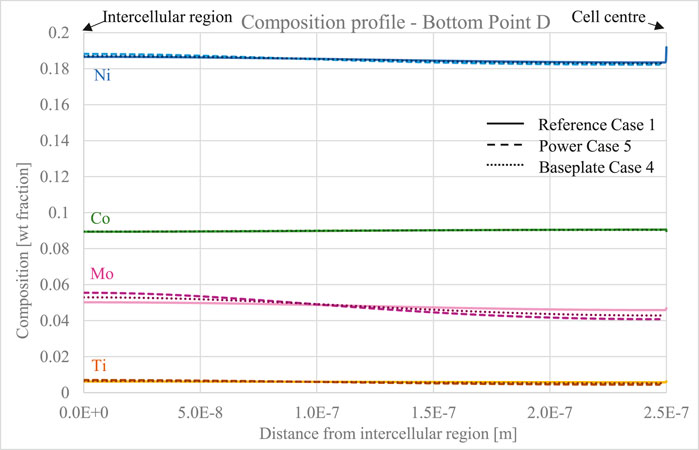
FIGURE 11. Calculated composition profile for point D for Cases 1, 4, and 5. Dendrite/cell center at the right side and interdendritic/intercellular region to the left.
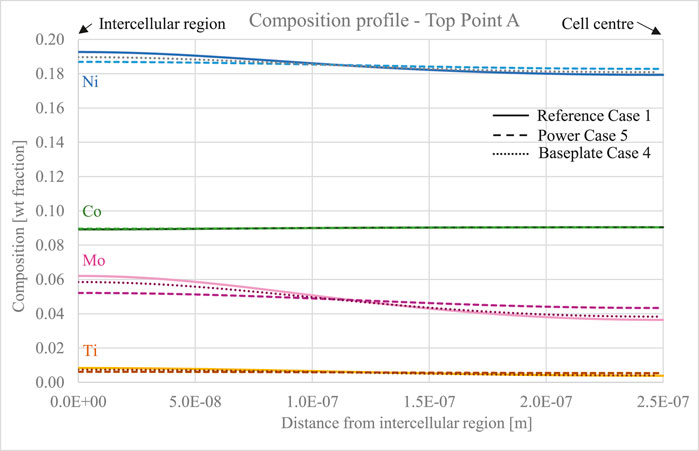
FIGURE 12. Calculated composition profile for point A for Cases 1, 4, and 5. Cell center is at the right side and interdendritic/intercellular region to the left.
Slightly more segregation was obtained for the increased energy density (Case 5) except for point A where Case 1 instead resulted in the largest segregation. The higher energy density created higher peak temperature and a higher cooling rate. The maximum temperature for point D was 2695°C for Case 1 and 2948°C for Case 5 and the cooling rates were approximately −10,000°C/s and −12,000°C/s, respectively, for the last temperature peak reaching the liquid state for each printing condition. The peak temperatures for point A were 2755°C for Case 1 and 3016°C for Case 5 and the cooling rates were approximately −34,000°C/s and −41,000°C/s, respectively. The composition profile for Case 4 is shown in Figure 13 comparing points A and D, illustrating the increased segregation for point A due to higher cooling rates.
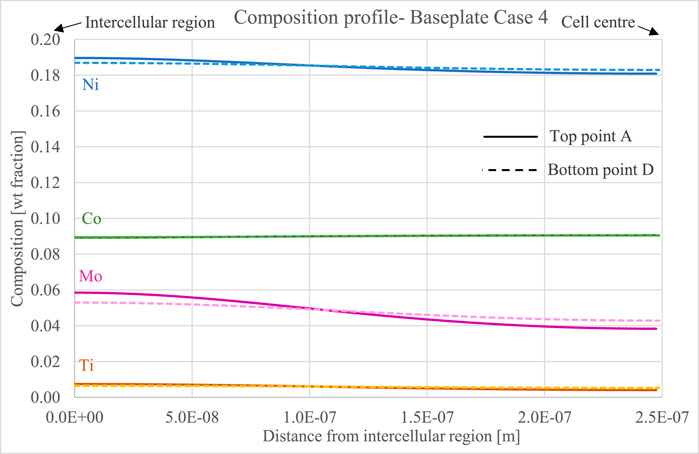
FIGURE 13. Calculated composition profile for Case 4 for points A and D. Dendrite/cell center at the right side and interdendritic/intercellular region to the left.
Ms Temperature
The Ms temperature calculations indicate that higher Ni and Mo contents decrease the Ms temperature. Figures 14 and 15 show how the Ms temperature changes over distance. The closer the last solidified material (distance = 0, intercellular region), the lower the Ms temperature. The center of the cell is, thus, experiencing a higher Ms temperature than the intercellular region. For point A in Case 1, Ni and Mo have segregated more than those in the other cases, and lead to a larger variation in the Ms temperature which reaches lower values in the intercellular region. Case 4, in the case of lower baseplate temperature, shows more segregation than Case 1 at point D and a slightly larger variation of the Ms temperature as a consequence.
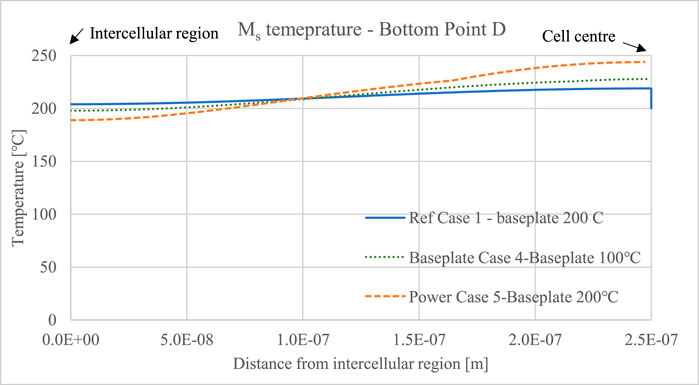
FIGURE 14. Calculated Ms temperature variation for point D as a function of distance from the intercellular region for cases 1, 4, and 5.
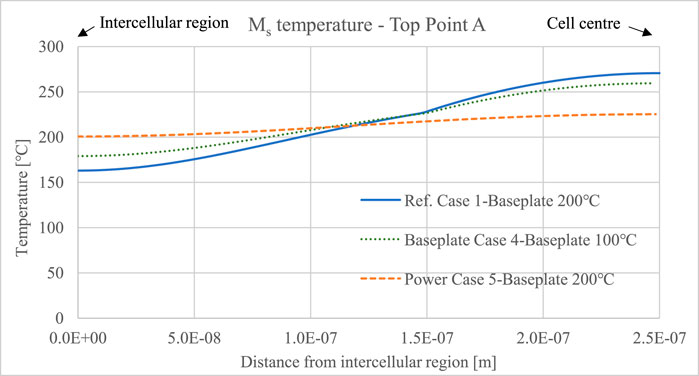
FIGURE 15. Calculated Ms temperature variation for point A as a function of distance from the intercellular region for cases 1, 4, and 5.
Discussion
Thermal Evolution
The thermal history varies depending on where in the component the results from the Simufact Additive simulations are collected. It also depends on the baseplate temperature and process parameters. The process parameters, represented by the energy density, affect the cooling rate and resulting microstructure. The second temperature peak was in all cases the last scan reaching to a temperature above the liquidus temperature where the material was completely melted and the corresponding cooling rate from that peak is thus the one affecting the as-solidified microstructure and the cooling rate that is referred to in coming sections.
The calculated cooling rates (Table 6) are lower than normally expected for the L-PBF process, for which cooling rates up and above 106 K/s are possible (DebRoy et al., 2018). In the cases where the cooling starts from around 3000°C for top point A, the simulated cooling rates reach the largest values but are still not close to reported values for L-PBF of 18Ni300 (Bai et al., 2017). The literature values are not specified to be the maximum rates or the rates during solidification, which is necessary to know to make a valid comparison since the cooling rates are not constant during the process. However, the current results show that Simufact Additive underestimates the cooling rates at higher temperatures where melting and solidification occur.
In an attempt to evaluate the FEM simulations, the calculated cooling rate is used to predict the primary dendrite arm spacing (PDAS), λ1 (μm), and compared to experimental information on the microstructure available in the literature. An equation for the PDAS is given as follows:
where α and n are material specific constants, respectively, and
Location
Both the local geometry and distance to the baseplate influence the thermal history. The top of the geometry reaches higher temperatures which can be explained by less surrounding material to act as conducting media and shorter time between each scan, which accumulates heat. The higher cooling rates for point A can be explained by the longer distance to the baseplate. Even though the amount of surrounding material to act as conductive media is less, the fewer added layers on top of point A than those on points B and C, may have a larger influence. This decreases the accumulation of heat at the top of the geometry.
Baseplate Temperature
The cooling rate is not significantly affected by lowering the baseplate temperature from 200°C (Cases 1–3 and 5–7) to 100°C (Case 4). In fact, the cooling rate is slightly lower for the first peaks, but higher for the other peaks as the process proceeded for Case 4 compared to the cases with a higher baseplate temperature. Since the temperature difference between the melted spot and baseplate is large in the beginning, an explanation of this can be that the relatively small change in baseplate temperature will not influence the cooling for the first peaks, but rather the laser scanning strategy.
Energy Density
The simulations indicate that similar temperature history and segregation results are obtained when using the same energy density. Similarly, Yakout (2017) found that the same energy density value gave similar material density and microstructural results after processing. The energy density, according to Equation 1, increases proportionally with increasing power. If the energy density is kept constant by increasing the laser power and by equivalently decreasing the scanning speed, similar thermal results will, thus, be obtained, although the simulation time will increase. It is, however, important to remember that changes of the scanning speed will affect the melt pool. Higher scanning speed cannot always be compensated by an increase in power and will result in unmelted powder and rough surfaces. A change in the laser power alone does, however, influence the temperature evolution remarkably according to both Simufact Additive simulations and literature. In the current simulations with Simufact Additive, the energy density is the major input parameter influencing the thermal results.
Segregation and Ms Temperature
The calculations show a clear correlation between the cooling rate, segregation, and Ms temperatures. According to dos Reis et al. (Reis et al., 2015), the Ms temperature is 194°C and the Mf temperature is 62°C for this maraging steel, implying that a fully martensitic structure at room temperature is possible. These values are based on the nominal composition of the alloy. Due to segregation, however, the local composition changes, and thereby, the Ms temperature. Generally, the current simulations show that the higher energy density creates more segregations due to the higher cooling rate, which is expected when solute trapping is not considered. At higher cooling rates, there is less time for elemental diffusion and homogenization of the elements in the solid phase. This causes alloying elements such as Ni, Mo, and Ti to segregate to the liquid during the solidification, which stabilizes austenite and lowers the Ms temperature for the current material system. The DICTRA results for the composition profiles as a function of distance from the intercellular regions correspond to the reported Ms temperatures. The intercellular region, with a higher Ni content which stabilizes the austenite, has lower Ms temperature. On the contrary, the regions with a lower Ni content have higher Ms temperature.
The thermal simulations show that the build never reaches temperatures far below the baseplate temperature. Relating this to the Ms temperature, it is found that some parts of the build do not reach the Ms temperature when using the 200°C baseplate. Figures 14 and 15 show that the intercellular region has an Ms temperature below 200°C, explaining why retained austenite is found in those areas (Jägle, 2017; Conde et al., 2021). When instead of simulating with a baseplate temperature of 100°C, the segregated regions of the build reach temperatures below the Ms temperature, allowing for a full or almost full martensitic structure. Figures 14 and 15 show that a lower baseplate temperature, and hence a slightly higher cooling rate as in Case 4, affect the Ms temperature compared to reference Case 1.
Comparing points A and D for all cases shows a larger degree of segregation at point A than at point D. This can be explained by the higher cooling rates at point A. While comparing similar locations across different cases, however, there is an exception when comparing point A in Case 1 and point A in Case 5. Although the cooling rates are higher for Case 5, the segregation is lower than Case 1. The reason for this can be that the temperature where the cooling starts to slow down after solidification, see Figure 5, is higher in Case 5 compared to Case 1. Hence, point A for Case 5 experiences longer times at slightly higher temperatures than point A for Case 1. This allows for more elemental diffusion and hence, less segregation.
By using a baseplate temperature of 200°C, the maximum predicted martensite fraction is approximately 73%, which is lower than the experimental values of 94.2% (Kempen et al., 2011) and 99.9–99.98% (Conde et al., 2021). However, it is difficult to compare the simulated results with the experimental data quantitatively since the predicted cooling rates are lower than expected, which in turn affects the degree of segregation.
Furthermore, inhomogeneous distribution of elements has also shown to promote austenite reversion. Studies have observed enrichments of Ti, Ni, Mo, and Co in intercellular areas which obstruct the martensitic transformation on cooling (Jägle, 2017). The locally increased alloying in the last solidified material, in the intercellular areas, accelerates the austenite reversion during post-heat treatments. Since the reversion is diffusion controlled, homogenization and quenching of the material post L-PBF will facilitate a fully martensitic microstructure.
Limitations and Challenges
A limitation with this approach is that Simufact Additive does not aim to describe the AM process on the melt pool scale in detail, which is needed in order to accurately predict the cooling rates during solidification. Consequently, the current simulations underestimate the cooling rate which in turn affect the predicted micro-segregation and Ms temperatures.
Furthermore, the thermal histories reach higher temperatures and larger cooling rates when using higher energy density. This may affect pore formation, spatter, and unmelted powder which is currently neglected in the simulations. The results based on the specific printing parameters are hard to evaluate quantitatively and validate due to lack of similar experimental setups and thermal results to compare with. In order to reach the recommended energy density with the suggested printing parameters, the efficiency is needed to be set to 99.2% which is unlikely due to thermal losses.
The applied Ms temperature model does not consider the effect of thermal stress on the transformation temperature which introduces uncertainties in the calculations. In addition, sample preparation can lead to phase transformations and affect the fraction of austenite and martensite observed during experimental microstructure evaluation (LeBrun et al., 2015; Conde et al., 2019). Another factor to consider is the slightly lower cooling rate used in the DICTRA calculations compared with the one obtained from the Simufact Additive calculations due to the approximation of stepwise temperature functions. In addition, the temperature history is in reality cyclic, with higher cooling rates, which also has an effect on the martensitic transformation. In the current simulation, the sixth peak is still within the austenite phase region but for a very short period of time, leaving little time for homogenization of the elemental segregation. Experimentally, the material is less homogenized, leaving only the very last segregated liquid that solidified to form austenite. The thermal distribution within the melt pool is also not considered in the layer-based simulations in this work. The higher cooling rates at the melt pool boundaries compared to those at the middle create segregation differences within a layer, and the interaction of neighboring tracks can cause local differences in the cooling rate, thus altering the austenite/martensite phase fractions.
Although the DICTRA results lead to the expected influence on the Ms temperatures, the model also comes with simplifications to consider. For example, at high solidification velocities, finite interface kinetics and solute trapping may influence the segregation which is not accounted in these simulations.
Finally, since the calculations are dependent on each other, uncertainties in the models may lead to the propagation of errors in the proceeding steps, and the accumulated uncertainty is difficult to quantify.
Benefits
The linkage of the different modeling tools made this investigation possible. In order to run a reliable thermal simulation, accurate material input parameters are required which were first obtained from the thermodynamic calculations and inserted in the material database in Simufact Additive. To relate the thermal histories to segregation, Ms temperatures, and martensite fractions, the macroscale temperature profiles were used as an input in the microscale DICTRA calculation. These results could also be used to further analyze the Ms temperature and martensite fractions and compare them with experimental results reported in the literature. There are numerous advantages of this approach. There are no material and equipment needed, apart from a computer, which makes the procedure cheap and relatively simple. This facilitates the investigation of many iterations and cases. The approach is also quick, giving fast indications and help before the actual manufacturing.
The majority of the FEM studies in the literature have concerned fully thermomechanical approaches, focusing on distortions and/or residual stresses as a result of the thermal history at the melt pool level. The connection of different length scales, including material characteristics, process temperature, and microstructural impact, is not as extensively explored. This study thus contributes to the pathway of linking simulation tools for direct microstructure control by optimizing the process.
Conclusion
Modeling tools were used to link macroscale results with microstructure predictions to find relations between printing parameters and microstructural aspects such as segregation and martensitic start temperature. The conclusions are as follows:
• The macro- and microscale results of L-PBF 18Ni300 maraging steel were successfully linked, and the results are qualitatively representative despite simulation simplifications.
• A higher energy density causes increased cooling rates which lead to a larger degree of micro-segregation within the cellular solidification structure. This, in turn, leads to lower Ms temperature and more retained austenite at the intercellular regions. The locations at the top of the simulated component geometry show a larger degree of segregation when using recommended printing parameters compared to when an increased laser power is used. This is explained by the higher temperatures reached due to the increased power.
• The locations closer to the top of the simulated component generally experience higher cooling rates than a point closer to the baseplate. This causes segregation variation within the part.
• The choice of input build parameters, including baseplate temperature, can be used to obtain microstructure with less micro-segregation with effects on the amount of martensite and austenite in the as-built microstructure. By lowering the baseplate temperature, for instance, the martensite fraction can be increased.
Data Availability Statement
The raw data supporting the conclusion of this article will be made available by the authors, without undue reservation.
Author Contributions
JS performed the simulations, wrote the first draft of the manuscript, and edited it further. GL and AD supervised the work and reviewed and edited the manuscript. GL conceptualized the work.
Funding
The strategic innovation program Metalliska Material through the project Design of Novel Materials and Processes for Next Generation Additive Manufacturing (DEMA, 2018-00803), financed by the Swedish Governmental Agency for Innovation Systems (VINNOVA), Formas, and Energimyndigheten, is acknowledged for financial support.
Conflict of Interest
Author JS was employed by the company VBN Components AB.
The remaining authors declare that the research was conducted in the absence of any commercial or financial relationships that could be construed as a potential conflict of interest.
Publisher’s Note
All claims expressed in this article are solely those of the authors and do not necessarily represent those of their affiliated organizations, or those of the publisher, the editors, and the reviewers. Any product that may be evaluated in this article, or claim that may be made by its manufacturer, is not guaranteed or endorsed by the publisher.
Acknowledgments
JS also acknowledges VBN Components for the support, and GL acknowledges support from VINNOVA, Energimyndigheten, and Formas via LIGHTer Academy.
Supplementary Material
The Supplementary Material for this article can be found online at: https://www.frontiersin.org/articles/10.3389/fmats.2022.797226/full#supplementary-material
Footnotes
1Thermo-Calc Software TCFE10 Steels/Fe-alloys database.
2Thermo-Calc Software MOBFE5 Steels/Fe-alloys mobility database.
3Thermo-Calc Software TCFE10 Steels/Fe-alloys database.
References
Andersson, J.-O., Helander, T., Höglund, L., Shi, P., and Sundman, B. (2002). Thermo-Calc & DICTRA, Computational Tools for Materials Science. Calphad. 26 (2), 273–312. doi:10.1016/s0364-5916(02)00037-8
Bai, Y., Yang, Y., Wang, D., and Zhang, M. (2017). Influence Mechanism of Parameters Process and Mechanical Properties Evolution Mechanism of Maraging Steel 300 by Selective Laser Melting. Mater. Sci. Eng. A. 703, 116–123. doi:10.1016/j.msea.2017.06.033
Belle, L. V. (2013). Analysis, Modeling and Simulation of Residual Stresses during the SLM Process of Metallic Powders. INSA de Lyon.
Beste, U. (2021). The Vibenite® Materials. [2021-07-30]; Available from: https://vbncomponents.se/materials/.
Bhardwaj, T., and Shukla, M. (2018). Effect of Laser Scanning Strategies on Texture, Physical and Mechanical Properties of Laser Sintered Maraging Steel. Mater. Sci. Eng. A. 734, 102–109. doi:10.1016/j.msea.2018.07.089
Borgenstam, A., and Hillert, M. (1997). Driving Force for f.c.C. → b.c.C. Martensites in FeX Alloys. Acta Materialia. 45 (5), 2079–2091. doi:10.1016/s1359-6454(96)00308-4
Chou, C.-Y., Pettersson, N. H., Durga, A., Zhang, F., Oikonomou, C., Borgenstam, A., et al. (2021). Influence of Solidification Structure on Austenite to Martensite Transformation in Additively Manufactured Hot-Work Tool Steels. Acta Materialia. 215, 117044. doi:10.1016/j.actamat.2021.117044
Conde, F. F., Avila, J. A., Oliveira, J. P., Schell, N., Oliveira, M. F., and Escobar, J. D. (2021). Effect of the As-Built Microstructure on the Martensite to Austenite Transformation in a 18Ni Maraging Steel after Laser-Based Powder Bed Fusion. Additive Manufacturing. 46, 102122. doi:10.1016/j.addma.2021.102122
Conde, F. F., Escobar, J. D., Oliveira, J. P., Béreš, M., Jardini, A. L., Bose, W. W., et al. (2019). Effect of thermal Cycling and Aging Stages on the Microstructure and Bending Strength of a Selective Laser Melted 300-grade Maraging Steel. Mater. Sci. Eng. A. 758, 192–201. doi:10.1016/j.msea.2019.03.129
DebRoy, T., Wei, H. L., Zuback, J. S., Mukherjee, T., Elmer, J. W., Milewski, J. O., et al. (2018). Additive Manufacturing of Metallic Components - Process, Structure and Properties. Prog. Mater. Sci. 92, 112–224. doi:10.1016/j.pmatsci.2017.10.001
Fan, Y. (2017). Additive Manufacturing Process Simulation for First Time Right | Simufact. Hamburg: Simufact Engineering.
Freeman, F. S. H. B., Sharp, J., Xi, J., and Todd, I. (2019). Influence of Solidification Cell Structure on the Martensitic Transformation in Additively Manufactured Steels. Additive Manufacturing. 30, 100917. doi:10.1016/j.addma.2019.100917
Guillaume, G. (2019). Turbine Pompe Bassin Maxflow. [cited 2020 2020/03/31]; Available from: https://grabcad.com/library/turbine-pompe-bassin-maxflow-1.
Jägle, E. A. (2014). Precipitation and Austenite Reversion Behavior of a Maraging Steel Produced by Selective Laser Melting. J. Mater. Res. 29 (17), 2072–2079. doi:10.1557/jmr.2014.204
Jägle, E. A. (2017). Comparison of Maraging Steel Micro-and Nanostructure Produced Conventionally and by Laser Additive Manufacturing. Materials 10 (1), 8. doi:10.3390/ma10010008
Kapoor, R., Kumar, L., and Batra, I. (2003). A Dilatometric Study of the Continuous Heating Transformations in 18wt.% Ni Maraging Steel of Grade 350. Mater. Sci. Eng. A. 352 (1-2), 318–324. doi:10.1016/S0921-5093(02)00934-6
Kempen, K. (2014). Selective Laser Melting of Crack-free High Density M2 High Speed Steel Parts by Baseplate Preheating. J. Manufacturing Sci. Eng. 136 (6), 061026-1–061026-6. doi:10.1115/1.4028513
Kempen, K., Yasa, E., Thijs, L., Kruth, J.-P., and Van Humbeeck, J. (2011). Microstructure and Mechanical Properties of Selective Laser Melted 18Ni-300 Steel. Phys. Proced. 12, 255–263. doi:10.1016/j.phpro.2011.03.033
Kruth, J.-P. (2004). Selective Laser Melting of Iron-Based Powder. J. Mater. Process. Technol. 149 (1-3), 616–622. doi:10.1016/j.jmatprotec.2003.11.051
Leblond, J. B., and Devaux, J. (1984). A New Kinetic Model for Anisothermal Metallurgical Transformations in Steels Including Effect of Austenite Grain Size. Acta Metallurgica. 32 (1), 137–146. doi:10.1016/0001-6160(84)90211-6
LeBrun, T., Nakamoto, T., Horikawa, K., and Kobayashi, H. (2015). Effect of Retained Austenite on Subsequent thermal Processing and Resultant Mechanical Properties of Selective Laser Melted 17-4 PH Stainless Steel. Mater. Des. 81, 44–53. doi:10.1016/j.matdes.2015.05.026
Megahed, M., Mindt, H.-W., N’Dri, N., Duan, H., and Desmaison, O. (2016). Metal Additive-Manufacturing Process and Residual Stress Modeling. Integr. Mater. Manuf Innov. 5 (1), 61–93. doi:10.1186/s40192-016-0047-2
Mutua, J., Nakata, S., Onda, T., and Chen, Z.-C. (2018). Optimization of Selective Laser Melting Parameters and Influence of post Heat Treatment on Microstructure and Mechanical Properties of Maraging Steel. Mater. Des. 139, 486–497. doi:10.1016/j.matdes.2017.11.042
Papadakis, L., Loizou, A., Risse, J., and Schrage, J. (2014). Numerical Computation of Component Shape Distortion Manufactured by Selective Laser Melting. Proced. CIRP. 18, 90–95. doi:10.1016/j.procir.2014.06.113
Reis, A. G. d., Reis, D. A. P., Abdalla, A. J., and Otubo, J. (2015). High-temperature Creep Resistance and Effects on the Austenite Reversion and Precipitation of 18 Ni (300) Maraging Steel. Mater. Characterization. 107, 350–357. doi:10.1016/j.matchar.2015.08.002
Shakerin, S., Hadadzadeh, A., Amirkhiz, B. S., Shamsdini, S., Li, J., and Mohammadi, M. (2019). Additive Manufacturing of Maraging Steel-H13 Bimetals Using Laser Powder Bed Fusion Technique. Additive Manufacturing. 29, 100797. doi:10.1016/j.addma.2019.100797
Shamsdini, S., Shakerin, S., Hadadzadeh, A., Amirkhiz, B. S., and Mohammadi, M. (2020). A Trade-Off between Powder Layer Thickness and Mechanical Properties in Additively Manufactured Maraging Steels. Mater. Sci. Eng. A. 776, 139041. doi:10.1016/j.msea.2020.139041
Sinaei, N., and Fatemi, A. (2021). Defects in Additive Manufactured Metals and Their Effect on Fatigue Performance: A State-Of-The-Art Review. Prog. Mater. Sci. 117, 100724. doi:10.1016/j.pmatsci.2020.100724
Smith, J., Xiong, W., Yan, W., Lin, S., Cheng, P., Kafka, O. L., et al. (2016). Linking Process, Structure, Property, and Performance for Metal-Based Additive Manufacturing: Computational Approaches with Experimental Support. Comput. Mech. 57 (4), 583–610. doi:10.1007/s00466-015-1240-4
Stormvinter, A., Borgenstam, A., and Ågren, J. (2012). Thermodynamically Based Prediction of the Martensite Start Temperature for Commercial Steels. Metall. Mat Trans. A. 43 (10), 3870–3879. doi:10.1007/s11661-012-1171-z
Tan, C. (2017). “Microstructure and Mechanical Properties of 18Ni-300 Maraging Steel Fabricated by Selective Laser Melting,” in 2016 6th International Conference on Advanced Design and Manufacturing Engineering (ICADME 2016) (Atlantis Press). doi:10.2991/icadme-16.2016.66
Tan, C., Zhou, K., Ma, W., Zhang, P., Liu, M., and Kuang, T. (2017). Microstructural Evolution, Nanoprecipitation Behavior and Mechanical Properties of Selective Laser Melted High-Performance Grade 300 Maraging Steel. Mater. Des. 134, 23–34. doi:10.1016/j.matdes.2017.08.026
VBN Components AB (2019). Vibenite® 480: A New Type of Cemented Carbide. Sweden: YouTube, VBN Components.
Wang, L. (2018). An Approach to Predict the Residual Stress and Distortion during the Selective Laser Melting of AlSi10Mg Parts. Int. J. Adv. Manufacturing Technology. 97 (9-12), 3535–3546. doi:10.1007/s00170-018-2207-3
Yakout, M. (2017). The Selection of Process Parameters in Additive Manufacturing for Aerospace Alloys. Int. J. Adv. Manufacturing Technology. 92 (5-8), 2081–2098. doi:10.1007/s00170-017-0280-7
Keywords: maraging steel, laser powder bed fusion, temperature evolution, macro-scale modeling, micro-segregation, multi-scale modeling
Citation: Sjöström J, Durga A and Lindwall G (2022) Linkage of Macro- and Microscale Modeling Tools for Additive Manufacturing of Steels. Front. Mater. 9:797226. doi: 10.3389/fmats.2022.797226
Received: 18 October 2021; Accepted: 28 March 2022;
Published: 10 May 2022.
Edited by:
Wentao Yan, National University of Singapore, SingaporeCopyright © 2022 Sjöström, Durga and Lindwall. This is an open-access article distributed under the terms of the Creative Commons Attribution License (CC BY). The use, distribution or reproduction in other forums is permitted, provided the original author(s) and the copyright owner(s) are credited and that the original publication in this journal is cited, in accordance with accepted academic practice. No use, distribution or reproduction is permitted which does not comply with these terms.
*Correspondence: Greta Lindwall, Z3JldGFsQGt0aC5zZQ==