 Sudip Banerjee
 Prasanta Sahoo
 J. Paulo Davim
94% of researchers rate our articles as excellent or good
Learn more about the work of our research integrity team to safeguard the quality of each article we publish.
Find out more
ORIGINAL RESEARCH article
Front. Mater. , 11 March 2022
Sec. Polymeric and Composite Materials
Volume 9 - 2022 | https://doi.org/10.3389/fmats.2022.791447
Magnesium nanocomposites reinforced with ceramic reinforcements have emerged as a superior structural material for automotive applications due to their excellent specific properties. In this context, the current study aims to scrutinize the performance of Mg-WC nanocomposites in tribological applications. The effect of various input parameters (wt.% of reinforcement, load, and speed) on output responses (wear and coefficient of friction) is scrutinized using response surface methodology. Mg-WC nanocomposites having varying weight percentages of WC are synthesized using ultrasonic treatment associated the stir-casting technique. Typical characterizations of as-cast nanocomposites are done using scanning electron microscopy (SEM) and energy-dispersive spectroscopy (EDS). SEM micrographs confirm homogeneous dissemination of fortified particles in the base matrix while EDS confirms elemental composition. Analysis of variance (ANOVA) study is conducted to discover significant parameters affecting tribological performance. Surface plots and contour plots for tribological responses are also examined to observe interaction effects. ANOVA on wear confirms that wt.% of WC and speed are the most significant parameters while the interaction between wt.% of WC and speed has a significant influence. For the coefficient of friction, all the input parameters are significant, and interaction between wt.% of WC and load is of utmost significance. Regression equations for response parameters are also developed. Additionally, a desirability approach is considered to investigate both single- and multiple-objective-optimization criterions of output parameters. The desirability function for both single- and multi-optimization remains 0.9778, suggesting the presence of all input parameters within the working limit. Predicted and experimental values of the optimal setting possess a close fit for the current study. Minimum wear is achieved when wt.% of WC is 1.73%, load is 40 N, and speed is 100 rpm. Minimum friction is obtained when wt.% of WC is 1.78%, load is 40 N, and speed is 100 rpm. The multi-optimization result shows that the minimum value of wear and friction is achievable when wt.% of WC is 1.73%, load is 40 N, and speed is 100 rpm. Finally, the worn surface of samples is examined to observe possible wear mechanisms.
The attenuation of natural resources and skyrocketing price of fuels has pushed the automotive and aerospace industries towards emission depletion, fuel efficiency, and weight reduction. Meanwhile, the initial design principle of the transportation sector concerns strength, density, corrosion, and stiffness of the selected material. A lower density helps to withstand high payload while performance and safety factors are controlled by stiffness and strength factors (Kulekci, 2008). In this regard, lightweight materials (Mg, Al, etc.) with good strength have evolved as an inevitable solution. Particularly, magnesium becomes auspicious for automobile, aviation, and electronics industries as it possesses the lowest density among available structural materials, lucrative specific strength, and noticeable stiffness (Hirsch and Al-Samman, 2013). Magnesium also has some interesting advantages compared to Al, i.e., 50% superior machinability, 25%–50% greater productivity, and almost 50% reduced power expenditure (Avedesian and Baker, 1999). Accordingly, several sectors are reducing the use of CI, steel, and even Al by Mg/Mg alloys for different units like power trains, piston, housings, and transmission cases. Besides, some factors like inferior tribological characteristics, poor ductility, and subordinate thermal solidity hinder the application of magnesium and magnesium alloys (Dey and Pandey, 2015). Literature reveals that these constraints can be encountered by fortifying micron- or nano-sized reinforcements. Recent advancement of nano-science has driven researchers towards nano-reinforcements. The typical surface area of nanoparticles is the main key factor which helps to improve different properties. Consequently, investigators have employed different ceramic-based particulates (B4C, SiC, ZnO, Y2O3, TiC, TiB2, BN, WC, and Al2O3) in the magnesium matrix (Nguyen and Gupta, 2008; Alam et al., 2011; Erman et al., 2012; Tun et al., 2012; Ponappa et al., 2013; Casati and Vedani, 2014; Meenashisundaram et al., 2014; Selvam et al., 2014; Dalmis et al., 2016; Gopal et al., 2017; Nie et al., 2017; Kaviti et al., 2018; Narayanasamy et al., 2018; Aydin et al., 2018; Banerjee et al., 2019a; Banerjee et al., 2019b; Banerjee et al., 2020; Banerjee et al., 2021). Literature also reveals that a small fraction (≤2 wt.%) of nanoparticle is ample to achieve the required properties, e.g., superior hardness, enhanced ductility, noticeable yield strength, and enhanced wear resistance (Casati and Vedani, 2014; Banerjee et al., 2021). Tun and Gupta (2007) have reported that incorporation of 2 wt.% of Y2O3 nanoparticles in the magnesium matrix would lead to a significant improvement in mechanical properties. Similarly, Hassan and Gupta (2003) have concluded that incorporation of a small amount (nearly 2 wt.%) of nano-reinforcement is helpful to bring off the desired enhancement in required properties. Accordingly, in the present study, tungsten carbide (WC, nanoparticle) is employed as a fortifying agent. The main reasons behind the selection of WC are some distinct advantages like high melting point (2,870°C), superior elastic modulus (630 GPa), good oxidation resistance, noticeable thermal conductivity (5 W/m-K), and superior hardness (1,400 HV) (Razavi and Mobasherpour, 2014; Borodianskiy and Zinigrad, 2016). Recently, Borodianskiy and Zinigrad (2016) have examined the effect of incorporation of WC nanoparticles and reported around 66% improvement in hardness compared with base alloy. Pal et al. (2018) have fortified WC nanoparticles (0.5–2 wt.%) in an Al matrix and observed significant enhancement in micro-hardness and tribological characteristics. Karuppusamy et al. (2019a) have fortified WC in the AZ91 matrix and examined tribological characteristics in a cryogenic environment. Excellent wear resistance was noticed for nanocomposites.
However, synthesis of nanocomposites is a very exquisite task as nanoparticles can have dispersion-linked problems, high porosity, and agglomeration issues because of their high surface area. Even economical mass production and wettability issues also need to be considered while selecting the fabrication method. Thus, the selection of a proper synthesis method of developing nanocomposites is a very important factor. Available literature reveals that powder metallurgy, DMD technique, and ultrasonic treatment associated stir-casting (UST) are majorly used synthesis techniques (Alam et al., 2011; Meenashisundaram et al., 2014; Razavi and Mobasherpour, 2014; Labib et al., 2016; Pal et al., 2018; Tekumalla et al., 2018). Recently, different particles (SiC, CNT, AlN, Al2O3, etc.) were fortified in the Mg matrix through UST (Aung et al., 2010; Habibnejad-Korayem et al., 2010; Nie et al., 2012; Dieringa et al., 2017). Banerjee et al. (Banerjee et al., 2019c, Banerjee et al., 2019d) have successfully incorporated tungsten carbide nanoparticles in the AZ31 matrix through a UST-associated stir casting technique. Nie et al. (2012) developed Mg-SiC nanocomposites by applying UST and accomplished a uniform dissemination of reinforcement. Dieringa et al. (2017) successfully synthesized agglomeration-free Mg-AlN nanocomposites. In UST, high-frequency electric power is supplied to piezoelectric crystals, which help to cause mechanical vibrations. Then amplified vibrations generate a large number of microscopic bubbles. These bubbles fall down and produce acoustic streaming, a large number of shock waves, and severe heating (5,000°C). In the out-turn, de-agglomeration of clusters will occur, causing a uniform dispersion of particulates in the matrix.
However, the scientific community is continuously trying to develop lightweight composite material incorporating different ceramic materials with different weight/volume percentages. Available literature also reveals that performances (mechanical, tribological, and microstructural) of composites very much rely on wt.% of reinforcement. Even different process parameters (load and sliding speed) of the tribological system immensely affect the output response. Moreover, selection of proper input factors is very important as improper selection may result to severe damage by producing absurd results. Hence, in a tribological system, selection of optimal condition is very important to achieve minimum wear and friction. Optimal condition can be found by using the statistical method and a perfect design of the experiment. In this regard, several researchers have tried to achieve optimal condition to minimize wear and friction using different statistical methodologies. Recently, Karuppusamy et al. (2019b) scrutinized the role of parameters (cryogenic environment and wt.% of WC) on wear rate of AZ91–WC nanocomposites using a multilevel factorial criterion. Banerjee and Sutradhar (2018) have employed the response surface methodology (RSM) to investigate the wear characteristics of Mg–Gr–WC nanocomposites and achieved optimized result. John Iruthaya Raj et al. (2019) have employed an RSM-based central composite design (CCD) to examine the role of different parameters (load, wt.% of mica, and sliding speed) on wear behavior of Mg mica. Similarly, Selvakumar and Narayansamy (2016) have considered statistical methodology to study the contribution of process parameters on the tribological characteristics of Mg-TiC-MoS2. Banerji et al. (2019e) have employed the Taguchi methodology to investigate the optimality of input factors for minimized wear rate of Mg–WC nanocomposites. Gopal et al. (2017) scrutinized the contribution of parameters (particulate size and wt.% of CRT glass) on output (tribological characteristics) of Mg-CRT-BN. Detailed discussion of available literature reveals that researchers are fascinated towards developing magnesium-based nanocomposites and also trying to achieve optimality for tribological behavior. However, an optimality-based study of tribological behavior of Mg–WC nanocomposites using the RSM methodology is not available. Accordingly, the current study tries to revoke that literature gap by considering a statistical approach while optimizing wear and friction behavior. The experimental design is structured with the help of the RSM-based Box–Behnken design for three input parameters (wt.% of WC, load, and speed) and three levels of each parameter. In addition, a desirability approach is also considered to find optimality for multi-objective (combination of wear and friction behavior) criterion. Finally, wear tracks are minutely analyzed with the help of scanning electron microscopy (SEM) and energy-dispersive X-ray (EDAX).
In the current study, AZ31 magnesium alloy (Si-0.10, Zn-1.20, Fe-0.22, Mn-0.28, Al-3.20, and Mg-Balance) and WC nanoparticles (80 nm, HSN 28499020, 99.9% purity, Hongwu International Group Ltd.) are taken as base alloy and reinforcement, respectively. The SEM micrograph of WC nanoparticles is shown in Figure 1. AZ31-WC nanocomposites are successfully synthesized using an ultrasonic vibrator-associated stir casting setup. Illustration of the casting setup is presented in Figure 2. Initially, the furnace temperature is fixed at 750°C, and ingots are melted by being placed inside the crucible. The melt temperature is monitored by K-type thermocouple. Simultaneously, nanoparticles and permanent die are preheated in a particle preheating furnace and heater, respectively. Preheating helps to remove moisture content while die heating is necessary to avoid defects. Afterwards, mechanical stirring (500 rpm) is started when alloy gets melted. Mechanical stirring generates a vortex, and particles are continuously impinged into that generated vortex. After particle pouring is finished, the speed of the mechanical stirrer is enhanced to 600 rpm and continues for 6–8 min. After that, the horn of the ultrasonic vibrator is put into melt, and vibration (20 kHz) is applied for 3–5 min. Then molten slurry is streamed out by bottom pouring arrangement into the die in vacuum circumstances (10–2 mbar). A similar process is followed for all nanocomposites. Inert gas supply is maintained for all experiments in the furnace (argon: SF6 = 9:1). Afterwards, the solidified sample is removed from the die and machined properly to produce desired samples.
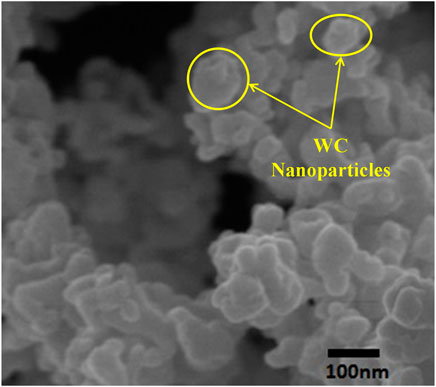
FIGURE 1. SEM micrograph of WC nanoparticles.
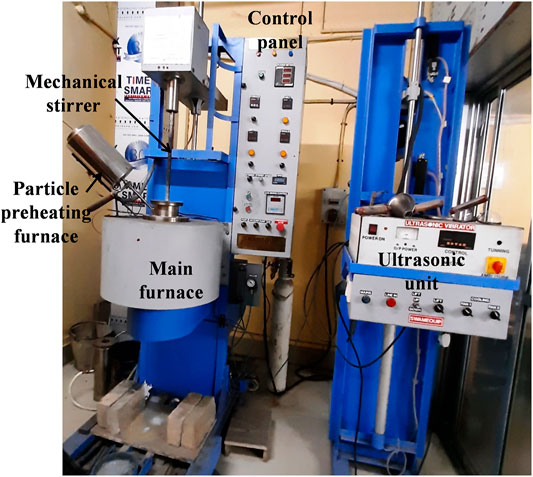
FIGURE 2. Pictorial view of furnace.
Microstructural characterization helps to understand the presence of different phases, particle distribution, and composition of developed material. It also helps us understand whether the samples are successfully developed or not. In the current study, samples are initially polished and etched properly before characterization. Samples are polished with different grades of SiC abrasive paper. Then samples are further polished in cloth. Next samples are etched in acetic picric solution (4 g picric acid, 10 ml acetic acid, 70 ml ethanol, and 10 ml H2O). An optical microscope (LEICA) is used to observe different phases and interfacial bonding of developed nanocomposites. A scanning electron microscope (JEOL, Japan) is employed to find the particle distribution of nanocomposites. EDAX (JSM-6360, Japan) is used to study compositional details of the nanocomposites.
Design of experiment is a typical methodical proposition to accomplish maximum indisputable statistics from minimum process specifics. This statistical methodology proposes features of the experimental technique to achieve suitable particulars, which can be further analyzed and validate. A proper design for experiment typically servers as a guide to achieve change in any variable with respect to another one and guides the interaction between parameters for the least number of experiments. Interpretation of interaction data between different input parameters is also very pivotal and explains the methodology to control parametric arrangement so that optimality can be achieved. The Box–Behnken design approach is one such methodology. Box–Behnken is a typical union of factorial pattern and fragmentary block design, which can limit the total number of trials. It also fulfills the rotability criterion, which suggests that variance is co-related with the distance of the central point. This methodology is also very useful for the quadratic model and found to be less expensive. Accordingly, in the current study, the Box–Behnken design criterion is considered. In this study, three input factors (wt.% of WC, load, and speed) and three levels of each factor are considered. Control factors and their levels are shown in Table 1.
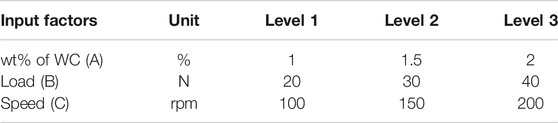
TABLE 1. Control factors and levels.
A mathematical model connecting output factors with input factors is developed by performing statistical modeling. The response is established based on RSM and corresponding regression analysis. Analysis of variance (ANOVA) is also performed to find significant parameters. Interaction criterion and quadratic terms are also included in the model so that the second-order model can be generated. As a consequence, curvature or any sort of nonlinearity can be taken under consideration. For a second-order mathematical model, depending on response surface, the following generalized equation (Eq. 1) is considered to analyze parametric supremacy on output. Finally, a confirmation study is also conducted by investigating the optimal predicted result with the experimental result.
where linear, square, and cross-product terms are xiu for surface yu; bi, bii, and bij are the intercept of the plane for second-order regression; and eu is noise.
Dry sliding tribological tests are conducted in a pin-on-disk multi-tribotester (Ducom, India) following ASTM G99-05 in normal room temperature. A pin sample (Ф6 mm, L = 30 mm) made from an as-cast bar is placed in the attachment of the tribotester where an EN8 steel disk acts as a counterface. In this study, the track diameter is taken as 40 mm, and each test is conducted for 10 min. A computerized system controls the whole operation, and load is put in by enforcing dead weight on the loading pan, which is coupled to a loading lever. Effective load and frictional forces are properly measured with the help of a load sensor and frictional force sensor, respectively. Frictional force is directly obtained from the computerized setup, and wear is computed from mass loss of sample. Wear rate is computed considering load, speed, and mass loss. Wear of counterface can be neglected as it possesses high hardness compared to the sample. Finally, worn surface is observed under SEM to investigate wear mechanisms.
Basic characterizations of synthesized nanocomposites are very important to justify the successful development. Figures 3A,B depicts an optical illustration of Mg-1WC and Mg-2WC nanocomposites. Figure 3 illustrates the presence of α-Mg and β-phase. The framework of β-phases is plate like and positioned near grain boundaries, which helps to reduce grain growth, resulting in reduced grain size. The presence of WC helps in recrystallization and generates almost equiaxed grains. Optical micrographs also divulge a superior interfacial bonding connecting base and reinforcement. Figures 4A,B shows SEM images of Mg-1WC and Mg-2WC nanocomposites. Nanocomposites show a close-packed composite layout. Reinforced nano-sized WC particles are almost homogeneously spread out over the matrix. No notable agglomeration is distinguished in SEM micrographs. Furthermore, the composition of Mg-2WC is scrutinized using EDAX analysis. The EDAX spectrum of Mg-2WC is presented in Figure 5. Compositional details of the base alloy and all nanocomposites are presented in Table 2. The EDAX result shows that all constituents of AZ31 are available along with W, O, and C. Therefore, incorporation of WC is completely apprehended.
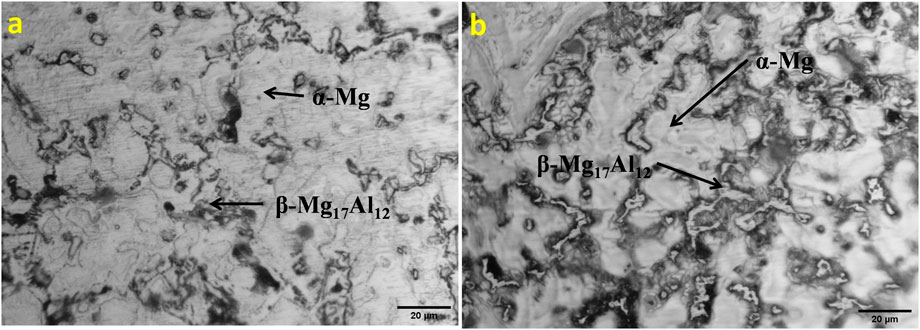
FIGURE 3. Optical micrographs of nanocomposites (A) Mg-1WC, (B) Mg-2WC.
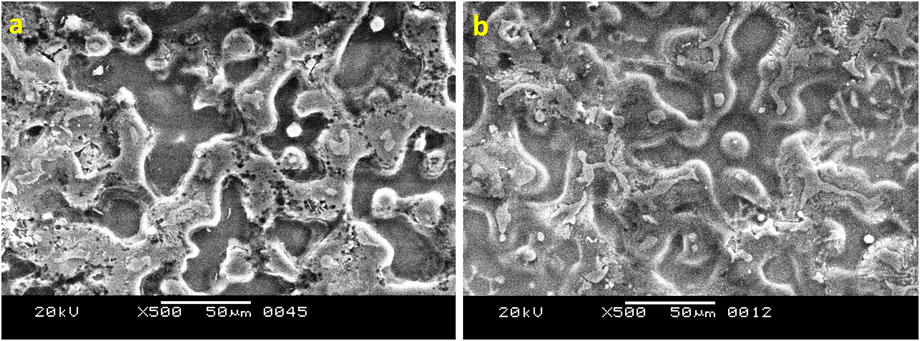
FIGURE 4. SEM micrograph of nanocomposites (A) Mg-1WC, (B) Mg-2WC.
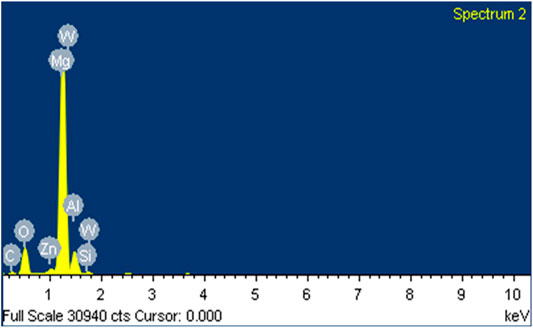
FIGURE 5. EDAX spectrum of Mg-2WC nanocomposite.
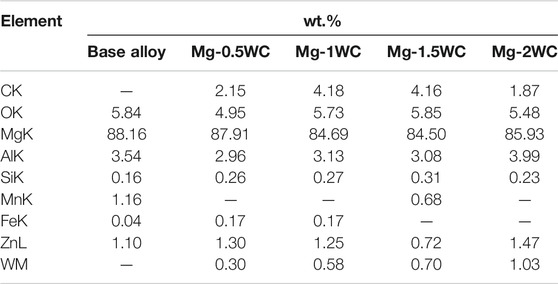
TABLE 2. Compositional details of fabricated nanocomposites.
It is essential to build connectivity between input and output factors so that process behavior can be clearly understood. In this regard, the Minitab software is used to develop the mathematical model, and corresponding parametric analysis is performed to achieve optimal results. In the current study, a similar approach is taken to minimize wear and coefficient of friction (COF) of Mg-WC MMNCs. Therefore, the response surface model is generated, and the mathematical model between input and output factors is established. Two models are generated to connect two output parameters to three process variables. Mathematical models (quadratic) consist of linear, squared, and interaction terms. The quadratic form of the model is considered so that all data can fit as precisely as possible. Experiments are carried out according to the response surface-based Box–Behnken design. Experimental results along with the uncoded design is shown in Table 3. Furthermore, the mathematical model of output factors, i.e., wear rate and COF, are obtained as in Eq. 2 and Eq. 3.
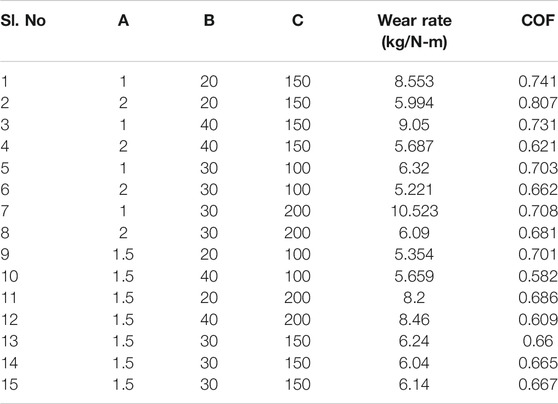
TABLE 3. Experimental design and corresponding results.
ANOVA is usually conducted to statistically analyze experimental results. Significant terms (at 1% and 5% significant levels) are obtained from the ANOVA table. The F-value and P-value of the ANOVA table help to validate the generated regression model. Typically, the obtained F-value must be superior to the critical F-value. ANOVA tables of wear rate and COF are shown in Tables 4, 5, respectively. Table 4 shows that the obtained F-values of all factors except B, (B × C) interaction, and lack of fit are superior to the corresponding critical F-value (95% confidence level). Typically, if the P-value of a parameter is less than 0.05, then that parameter is significant, while p < 0.01 suggests that the parameter is highly significant. Hence, it can be concluded from Table 4 that A, C, A2, B2, and (A × C) are highly significant while C2 and (A × B) are significant parameters. Table 5 reveals that the obtained F-values of all factors except C, (A × C) interaction, and lack of fit are superior to the corresponding critical F-value (95% confidence level). Table 5 also discloses that A, B, A2, C2, (A × B), and (B × C) are highly significant while C and B2 are significant parameters.

TABLE 4. ANOVA table of wear rate.
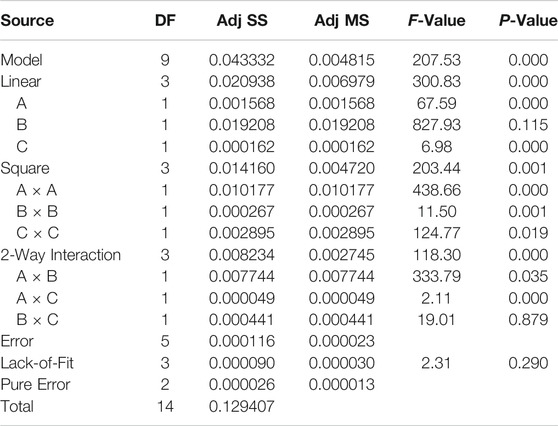
TABLE 5. ANOVA table of COF.
Minimum wear rate and COF are essential for maximum tribological systems to maintain the quality and longevity of components. The effect of WC wt.% and load on wear is presented in Figure 6A when sliding speed remains steady at 150 rpm. It is clear from Figure 6A that the wear value shrinks with a rise in wt.% of WC. Usually, the presence of hard ceramic WC particles in the Mg matrix helps to increase both load-bearing capability and work-hardening capability. As a result, a nanocomposite having a higher amount of WC possesses superior wear resistance. Figure 6A also reveals that wear initially decreases and then modestly increases with the increase in load. Initially, hard WC particles resist the penetration of asperities of the counter-surface and delay the thermal effect of frictional heating. But repeated loading creates thermal softening, causing an increase in wear rate. A similar conclusion was drawn by Banerji et al. (2013). Therefore, to achieve the best wear resistance, the wt.% of WC is to be kept at the highest level, keeping load at the moderate level, within experimental limit.
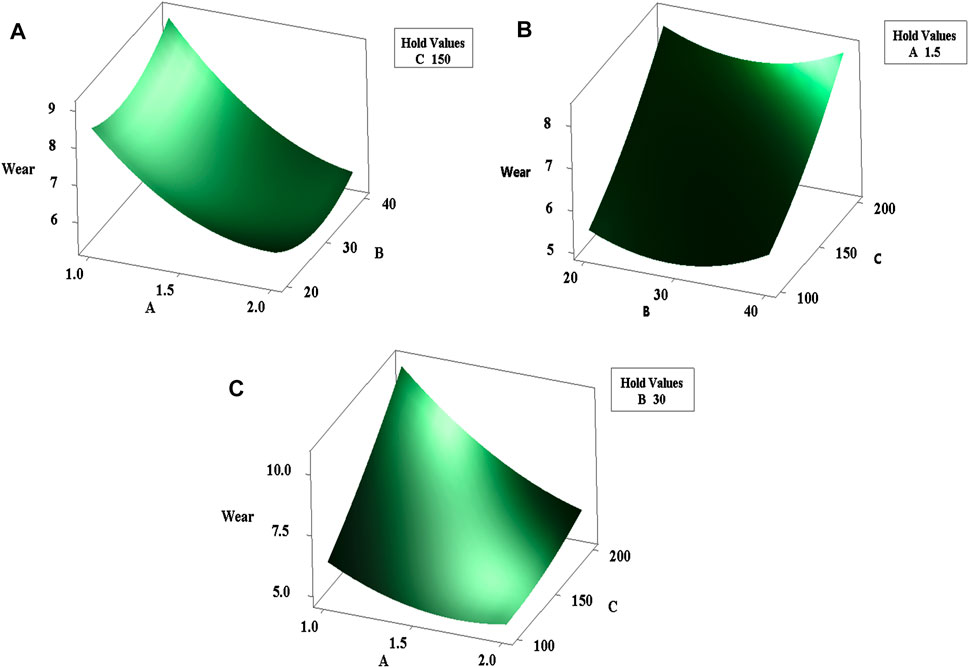
FIGURE 6. Surface plots of wear vs interacting parameters (A) A × B, (B) B × C and (C) C × A.
The integrated outcome of important input factors like load and sliding speed on wear rate is presented in Figure 6B. In this case, the wt.% of WC is fixed at 1.5%. It is observed that wear initially decreased and then modestly increased with the increase in load. Meanwhile, wear increases linearly with an increase in sliding speed within the experimental limit. Frictional heating increases with an increase in speed. Such increased frictional heating initiates thermal softening. As a result, wear increases with an increase in speed. A similar trend of WC wt.% and sliding speed is also present in the literature (Habibnejad-Korayem et al., 2010; Selvam et al., 2014). Figure 6C reveals a combined consequence of WC wt.% and speed while load remains fixed at 30 N. The wear rate contracted continuously with increased wt.% of WC, and wear rate increases linearly with increase in sliding speed. Usually, an increasing amount of particles resists penetration of the counter-surface, resulting in reduced wear rate. On the other hand, increasing speed ignites frictional heating, which results in the thermal softening of the material surface. Thermal softening results in increased wear rate. However, Figure 6C also discloses that the slope of increase in wear rate for Mg-1WC is steeper compared to Mg-2WC nanocomposites.
The combined effect of parameters A and B on COF is presented in Figure 7A, while speed remains at 150 rpm. Figure 7A discloses a moderate change in COF with respect to wt.% of WC. Moreover, COF increases slightly as wt.% of WC enhances. For increased wt.% of WC, more amount of ceramic particles come in contact with asperities of the counterface. As a result, a larger friction force develops, resulting in an increase in COF. Similar results are also available in the literature (Nguyen et al., 2015; Kaviti et al., 2018). Figure 7A also reveals that COF values decrease continuously with enhancement in load for Mg-2WC nanocomposites. This decline in COF may be ascribed to the typical softening of the contact surface due to frictional heating. The widely accepted model of Bowden and Tabor (1964)’s clearly describes friction as a force which needs to be repressed to conquer bonding of asperities from interacting with the contact surface. With increasing load, overheating occurs due to frictional heating. Overheating generates bulk softening in the contact surface. As a result, asperities of counter-disk may go through conveniently in the sample surface, resulting in reduced COF. Figure 7B presents a combined effect of load and speed on COF, while wt.% of WC is constant at 1.5%. In this case, COF decreases with the increasing load. COF initially increases but a further increase in speed leads to reduction. However, a change in COF is moderate for the experimental range. These effects are mainly due to frictional heating. Greater frictional heating generates progressive local hot spots, which lead to easier shearing of contact zones. Consequently, COF shows a declining trend. Moreover, the effect of wt.% of WC and speed is presented in Figure 7C. The COF value initially increases and then decreases with enhanced speed. Moreover, the COF value shrinks initially with enhanced wt.% of WC up to 1.5% and then tends to increase moderately.
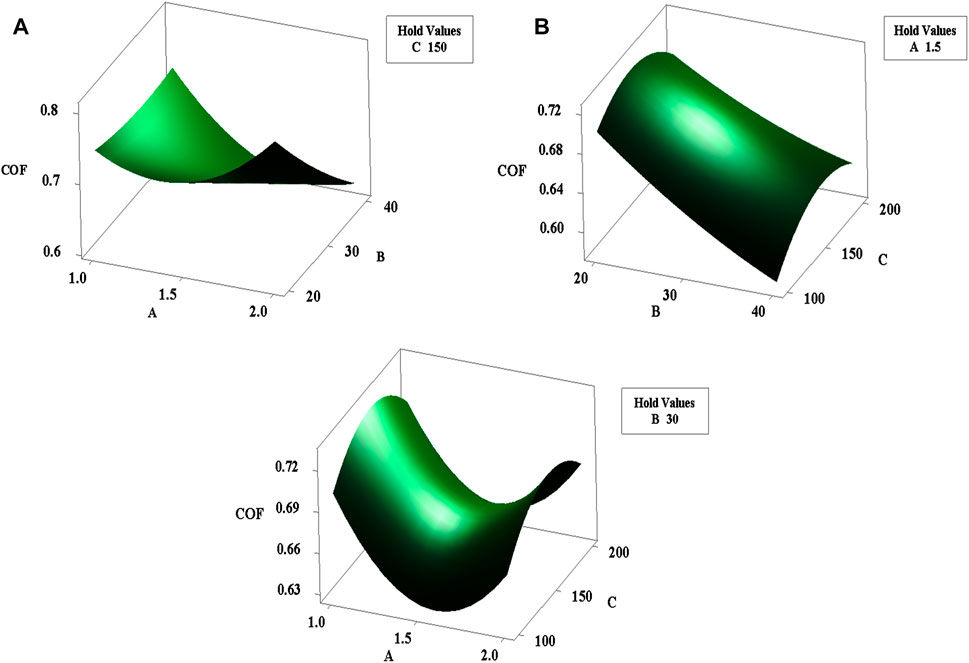
FIGURE 7. Surface plots of COF vs interacting parameters (A) A × B, (B) B × C and (C) C × A.
The desirability approach is mainly an objective function which ranges between zero and one. The desirability function typically transmutes the approximated outcome to scale-free data. The basic objective is to achieve a minimized, maximized, or targeted value. In the current study, initially single-objective optimization tries to minimize wear rate and COF depending on the developed mathematical model (Eq. 2 and Eq. 3). Figures 8, 9 depict the optimized data of wear rate and COF, respectively. For wear rate, the linear desirability function (d) is found to be one for the experimental limit. The minimum wear rate is obtained as 4.9105 when wt.% of WC, load, and speed are 1.73%, 30 N, and 100 rpm, respectively. For COF, the desirability function is obtained as 1, and a minimum COF is 0.5625 when wt.% of WC, load, and speed are 1.79%, 40 N, and 100 rpm, respectively.
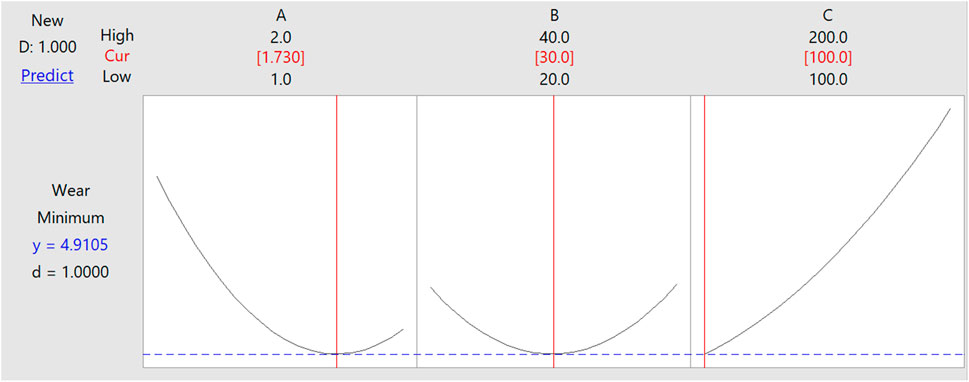
FIGURE 8. Desirability plot for single-objective optimization of wear rate.
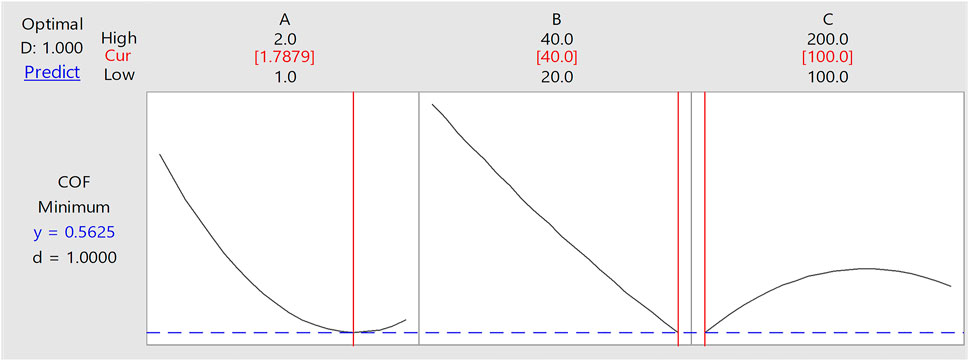
FIGURE 9. Desirability plot for single-objective optimization of COF.
Multi-objective problems related to nonlinear programming are real-world problems. Due to the absence of a proper solution procedure, these problems are statistically converted into a single-objective one. In this regard, the desirability function approach is widely a employed technique considered by the industry for optimizing multi-response problems. Typically, it depends on the quality factor of the system. This method tries to predict the most desirable operating condition which provides optimized result. In the current study, analysis of tribological parameters (wear and COF) of AZ31-WC nanocomposites is conducted to explore multi-response optimization. The multi-response optimization result is shown in Figure 10. Optimized wear and COF are computed simultaneously in a single parametric setting. In Figure 10, each row contains a plot related to output parameters, while each column is associated with input parameters of the tribological study. Every cell of the plot discloses modification of the response variable while one parameter is in action, keeping other parameters constant. In the current parametric arrangement, composite desirability as well as independent desirability for wear and COF is also shown in Figure 10. It is observed that the composite desirability value is 0.9778 for the present study. The predicted minimum wear and COF values are 5.4540 and 0.5633, respectively. The predicted desirable condition is 1.73% WC, 40 N load, and 100 rpm speed.
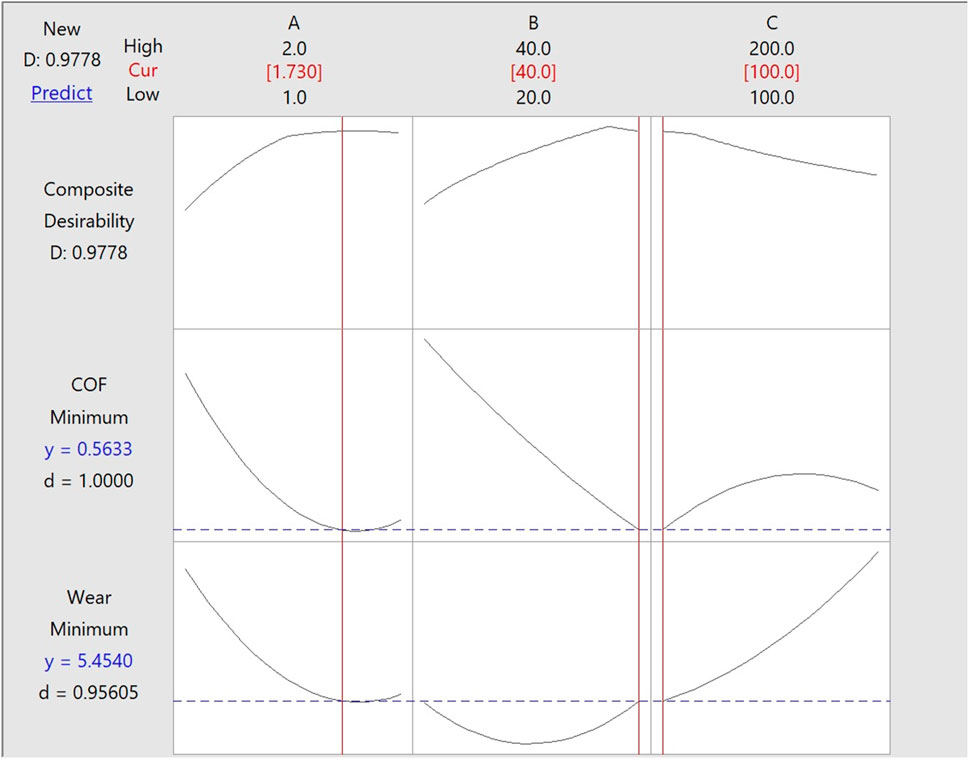
FIGURE 10. Desirability plot for multi-objective optimization of wear rate and COF.
The mathematical model is further verified by conducting experiments with a parametric setting obtained from optimized results. Those results are compared with predicted results, and percentage error is also computed.
Table 6 shows the confirmation table containing experimental results, predicted results, and percentage error. In the current investigation, the experimental value and predicted value are quite close (>5%), which is within the acceptable limit. The experimental result of the COF at optimal condition is illustrated in Figure 11.
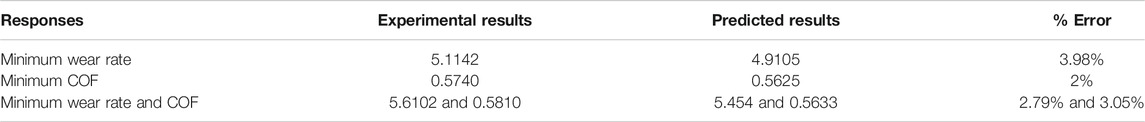
TABLE 6. Confirmation table.
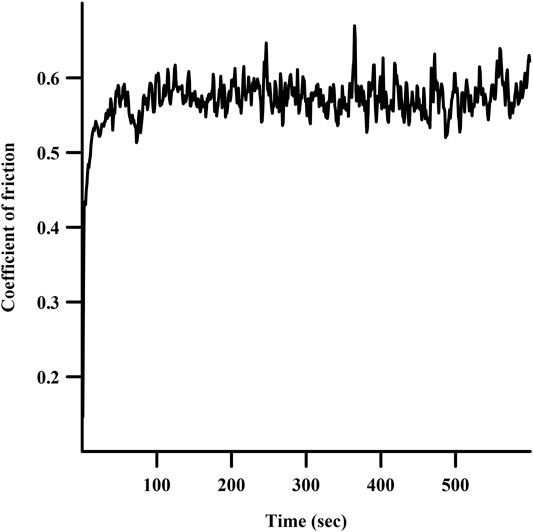
FIGURE 11. Experimental results of COF with respect to time at optimal condition.
Worn surface analysis is very important to observe the wear mechanism and justify the basic reasons behind wear and friction behavior. In the current study, worn surfaces of samples tested in optimal condition are examined, and possible wear mechanisms are discussed in detail. An SEM micrograph of samples tested at optimal wear condition is shown in Figure 12A. Figure 12A shows grooves parallel to the sliding direction. Indication of ploughing is present. Parallel trench and ploughing signify the occurrence of abrasion. Some delamination and plastic deformation are also present in the wear track. Consequently, it may be revealed that the basic wear mechanism for this sample is abrasion, delamination, and plastic deformation. Furthermore, the SEM micrograph of samples tested at optimal COF condition is shown in Figure 12B. In the SEM micrograph, some deep grooves are present, but plastic deformation and some sort of delamination are mainly observed. Plastic deformation occurs due to thermal softening, which helps to provide better COF. Hence, plastic deformation and delamination are the main wear mechanism for this condition. The SEM micrograph of samples tested at optimal condition for multi-objective optimization is presented in Figure 12C. In worn surface, deep abrasive grooves are observed along with plastic deformation and deformation. Signs of resolidified layers are also there. These layers protect the surface from severe wear, while thermal softening helps to lower the COF. As a result, the combined effect of wear and COF results in optimal conditions within the experimental range.
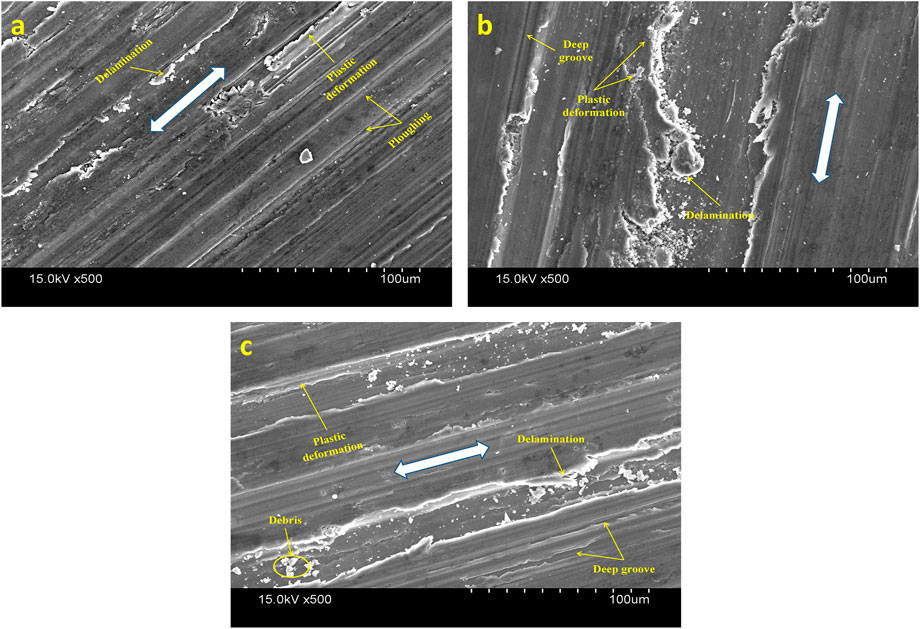
FIGURE 12. SEM micrographs of samples tested at optimal conditions: (A) optimal condition of wear, (B) optimal condition of COF, and (C) optimal condition of multi-objective system.
In the present study, the optimal condition of minimized wear rate, minimum COF, and minimized combined effect of these two output parameters of nanocomposites are investigated using the RSM technique. Nanocomposites are synthesized using an ultrasonic-treatment-associated stir-casting method. SEM analysis confirms that WC nanoparticles are equally distributed in the magnesium matrix. The EDS spectrum confirms incorporation of WC particles. The effect of selected input parameters (wt.% of WC, load, and speed) and their levels on output parameters (wear rate and COF) are scrutinized. Mathematical models for wear rate and COF are formulated. Surface plots elaborate the combined effect of input parameters on output parameters. The ANOVA study of wear rate discloses that wt.% of WC, speed, (wt.% of WC)2, (load)2, and (wt.% of WC × speed) are highly significant, while (speed)2 and (wt.% of WC × load) are significant parameters. ANOVA of COF discloses that wt.% of WC, load, (wt.% of WC)2, (speed)2, (wt.% of WC × load), and (load × speed) are highly significant, while speed and (load)2 are significant parameters. The single-objective desirability approach reveals that the minimum wear rate obtained is 4.9105 when wt.% of WC, load, and speed are 1.73%, 30 N, and 100 rpm, respectively. For COF, the desirability function obtained is 1 and the minimum COF is 0.5625 when wt.% of WC, load, and speed are 1.79%, 40 N, and 100 rpm, respectively. It is observed that the composite desirability value is 0.9778 for the present study. The predicted minimum wear and COF value are 5.4540 and 0.5633, respectively. The predicted desirable condition is 1.73% WC, 40 N load, and 100 rpm speed. The confirmation test shows that the experimental value and predicted value are within the acceptable limit. The final worn surfaces of optimal conditions are examined using SEM to reveal possible wear mechanisms.
The original contributions presented in the study are included in the article/Supplementary Material, further inquiries can be directed to the corresponding author.
SB, PS, and JD contributed to the conception and design of the study. SB performed the experiments and statistical analysis and wrote the first draft of the manuscript. PS supervised the experiments and analysis. All authors contributed to manuscript revision and read and approved the submitted version.
The authors declare that the research was conducted in the absence of any commercial or financial relationships that could be construed as a potential conflict of interest.
All claims expressed in this article are solely those of the authors and do not necessarily represent those of their affiliated organizations, or those of the publisher, the editors and the reviewers. Any product that may be evaluated in this article, or claim that may be made by its manufacturer, is not guaranteed or endorsed by the publisher.
Alam, M. E., Han, S., Nguyen, Q. B., Salem Hamouda, A. M., and Gupta, M. (2011). Development of New Magnesium Based Alloys and Their Nanocomposites. J. Alloys Compd. 509 (34), 8522–8529. doi:10.1016/j.jallcom.2011.06.020
Aung, N. N., Zhou, W., Goh, C. S., Nai, S. M. L., and Wei, J. (2010). Effect of Carbon Nanotubes on Corrosion of Mg-CNT Composites. Corrosion Sci. 52 (5), 1551–1553. doi:10.1016/j.corsci.2010.02.025
Aydin, F., Sun, Y., Ahlatci, H., and Turen, Y. (2018). Investigation of Microstructure, Mechanical and Wear Behaviour of B4C Particulate Reinforced Magnesium Matrix Composites by Powder Metallurgy. Transactions of the Indian Institute of Metals 71 (4), 873–882.
Banerjee, S., Poria, S., Sutradhar, G., and Sahoo, P. (2020). Abrasive Wear Behavior of WC Nanoparticle Reinforced Magnesium Metal Matrix Composites. Surf. Topogr.: Metrol. Prop. 8 (2), 025001. doi:10.1088/2051-672x/ab82a1
Banerjee, S., Poria, S., Sutradhar, G., and Sahoo, P. (2019). Corrosion Behavior of AZ31-WC Nano-Composites. J. Magnesium Alloys 7 (4), 681–695. doi:10.1016/j.jma.2019.07.004
Banerjee, S., Poria, S., Sutradhar, G., and Sahoo, P. (2019). Dry Sliding Tribological Behavior of AZ31-WC Nano-Composites. J. Magnesium Alloys 7 (2), 315–327. doi:10.1016/j.jma.2018.11.005
Banerjee, S., Poria, S., Sutradhar, G., and Sahoo, P. (2019). Nanoindentation and Scratch Resistance Characteristics of AZ31-WC Nanocomposites. J. Mol. Eng. Mater. 07 (03n04), 1950007. doi:10.1142/s2251237319500072
Banerjee, S., Poria, S., Sutradhar, G., and Sahoo, P. (2019). Tribological Behavior of Mg-WC Nano-Composites at Elevated Temperature. Mater. Res. Express 6 (8), 0865c6. doi:10.1088/2053-1591/ab2379
Banerjee, S., Poria, S., Sutradhar, G., and Sahoo, P. (2019). Wear Performance of Mg-WC Metal Matrix Nanocomposites Using Taguchi Methodology. Mater. Today Proc. 19, 177–181. doi:10.1016/j.matpr.2019.06.642
Banerjee, S., Sahoo, P., and Davim, J. P. (2021). Tribological Characterisation of Magnesium Matrix Nanocomposites: A Review. Adv. Mech. Eng. 13 (4), 16878140211009025. doi:10.1177/16878140211009025
Banerji, A., Hu, H., and Alpas, A. T. (2013). Sliding Wear Mechanisms of Magnesium Composites AM60 Reinforced with Al2O3 Fibres under Ultra-mild Wear Conditions. Wear 301 (1-2), 626–635. doi:10.1016/j.wear.2013.01.091
Borodianskiy, K., and Zinigrad, M. (2016). Modification Performance of WC Nanoparticles in Aluminum and an Al-Si Casting alloy. Metall. Materi Trans. B 47 (2), 1302–1308. doi:10.1007/s11663-016-0586-0
Bowden, F. P., and Tabor, D. (1964). The Friction and Lubrication of Solids-Part II. Oxford, England: University Press.
Casati, R., and Vedani, M. (2014). Metal Matrix Composites Reinforced by Nano-Particles-A Review. Metals 4 (1), 65–83. doi:10.3390/met4010065
Dalmis, R., Cuvalci, H., Canakci, A., and Guler, O. (2016). Investigation of Graphite Nano Particle Addition on the Physical and Me-Chanical Properties of ZA27 Composites. Adv. Composites Lett. 25 (2), 37. doi:10.1177/096369351602500202
Dey, A., and Pandey, K. M. (2015). Magnesium Metal Matrix Composites-A Review. Rev. Adv. Mater. Sci. 42, 58–67.
Dieringa, H., Katsarou, L., Buzolin, R., Szakács, G., Horstmann, M., Wolff, M., et al. (2017). Ultrasound Assisted Casting of an AM60 Based Metal Matrix Nanocomposite, its Properties, and Recyclability. Metals 7 (10), 388. doi:10.3390/met7100388
Erman, A., Groza, J., Li, X., Choi, H., and Cao, G. (2012). Nanoparticle Effects in Cast Mg-1 Wt% SiC Nano-Composites. Mater. Sci. Eng. A 558, 39. doi:10.1016/j.msea.2012.07.048
Gopal, P. M., Soorya Prakash, K., Nagaraja, S., and Kishore Aravinth, N. (2017). Effect of Weight Fraction and Particle Size of CRT Glass on the Tribological Behaviour of Mg-CRT-BN Hybrid Composites. Tribology Int. 116, 338–350. doi:10.1016/j.triboint.2017.07.025
Habibnejad-Korayem, M., Mahmudi, R., Ghasemi, H. M., and Poole, W. J. (2010). Tribological Behavior of Pure Mg and AZ31 Magnesium alloy Strengthened by Al2O3 Nano-Particles. Wear 268 (3-4), 405–412. doi:10.1016/j.wear.2009.08.031
Hassan, S. F., and Gupta, M. (2003). Development of High Strength Magnesium Copper Based Hybrid Composites with Enhanced Tensile Properties. Mater. Sci. Technol. 19 (2), 253–259. doi:10.1179/026708303225009346
Hirsch, J., and Al-Samman, T. (2013). Superior Light Metals by Texture Engineering: Optimized Aluminum and Magnesium Alloys for Automotive Applications. Acta Materialia 61 (3), 818–843. doi:10.1016/j.actamat.2012.10.044
John Iruthaya Raj, M., Manisekar, K., and Gupta, M. (2019). Central Composite Experimental Design Applied to the Dry Sliding Wear Behavior of Mg/Mica Composites. J. Tribology 141 (1), 011603. doi:10.1115/1.4041073
Karuppusamy, P., Lingadurai, K., and Sivananth, V. (2019). “Influence of Cryogenic Treatment on As-Cast AZ91+ 1.5 Wt% WC Mg-MMNC Wear Performance,” in Advances in Materials and Metallurgy (Singapore: Springer), 185
Karuppusamy, P., Lingadurai, K., and Sivananth, V. (2019). To Study the Role of WC Reinforcement and Deep Cryogenic Treatment on AZ91 MMNC Wear Behavior Using Multilevel Factorial Design. J. Tribology 141 (4). doi:10.1115/1.4042506
Kaviti, R. V. P., Jeyasimman, D., Parande, G., Gupta, M., and Narayanasamy, R. (2018). Investigation on Dry Sliding Wear Behavior of Mg/BN Nanocomposites. J. Magnesium Alloys 6 (3), 263–276. doi:10.1016/j.jma.2018.05.005
Kulekci, M. K. (2008). Magnesium and its Alloys Applications in Automotive Industry. Int. J. Adv. Manufacturing Technol. 39 (9-10), 851–865. doi:10.1007/s00170-007-1279-2
Labib, F., Ghasemi, H. M., and Mahmudi, R. (2016). Dry Tribological Behavior of Mg/SiC P Composites at Room and Elevated Temperatures. Wear 348-349, 69–79. doi:10.1016/j.wear.2015.11.021
Meenashisundaram, G. K., Seetharaman, S., and Gupta, M. (2014). Enhancing Overall Tensile and Compressive Response of Pure Mg Using Nano-TiB2 Particulates. Mater. Characterization 94, 178–188. doi:10.1016/j.matchar.2014.05.021
M. M. Avedesian, and H. Baker (Editors) (1999). ASM Specialty Handbook: Magnesium and Magnesium Alloys (Materials park, OH: ASM international).
Narayanasamy, P., Selvakumar, N., and Balasundar, P. (2018). Effect of Weight Percentage of TiC on Their Tribological Properties of Magnesium compositesMaterials Today: Proceedings. Mater. Today Proc. 5 (2), 6570–6578. doi:10.1016/j.matpr.2017.11.312
Nguyen, Q. B., and Gupta, M. (2008). Increasing Significantly the Failure Strain and Work of Fracture of Solidification Processed AZ31B Using Nano-Al2O3 Particulates. J. Alloys Compd. 459 (1-2), 244–250. doi:10.1016/j.jallcom.2007.05.038
Nguyen, Q. B., Sim, Y. H. M., Gupta, M., and Lim, C. Y. H. (2015). Tribology Characteristics of Magnesium alloy AZ31B and its Composites. Tribology Int. 82, 464–471. doi:10.1016/j.triboint.2014.02.024
Nie, K. B., Deng, K. K., Wang, X. J., Wang, T., and Wu, K. (2017). Influence of SiC Nanoparticles Addition on the Microstructural Evolution and Mechanical Properties of AZ91 alloy during Isothermal Multidirectional Forging. Mater. Characterization 124, 14–24. doi:10.1016/j.matchar.2016.12.006
Nie, K. B., Wang, X. J., Wu, K., Hu, X. S., and Zheng, M. Y. (2012). Development of SiCp/AZ91 Magnesium Matrix Nanocomposites Using Ultrasonic Vibration. Mater. Sci. Eng. A 540, 123–129. doi:10.1016/j.msea.2012.01.112
Pal, A., Poria, S., Sutradhar, G., and Sahoo, P. (2018). Tribological Behavior of Al-WC Nano-Composites Fabricated by Ultrasonic Cavitation Assisted Stir-Cast Method. Mater. Res. Express 5 (3), 036521. doi:10.1088/2053-1591/aab577
Ponappa, K., Aravindan, S., and Rao, P. V. (2013). Influence of Y2O3 Particles on Mechanical Properties of Magnesium and Magnesium alloy (AZ91D). J. Compos. Mater. 47 (10), 1231–1239. doi:10.1177/0021998312446501
Razavi, M., and Mobasherpour, I. (2014). Production of Aluminum Nano-Composite Reinforced by Tungsten Carbide Particles via Mechanical Milling and Subsequent Hot Pressing. Int. J. Mater. Res. 105 (11), 1103–1110. doi:10.3139/146.111126
Banerjee, S., and Sutradhar, G. (2018). Study on Wear Behaviour of Mg-Gr-WC Nanocomposite Using Response Surface Methodology. Mater. Today Proc. 5 (9), 17664–17673. doi:10.1016/j.matpr.2018.06.086
Selvakumar, N., and Narayanasamy, P. (2016). Optimization and Effect of Weight Fraction of MoS2 on the Tribological Behavior of Mg-TiC-MoS2 Hybrid Composites. Tribology Trans. 59 (4), 733–747. doi:10.1080/10402004.2015.1110866
Selvam, B., Marimuthu, P., Narayanasamy, R., Anandakrishnan, V., Tun, K. S., Gupta, M., et al. (2014). Dry Sliding Wear Behaviour of Zinc Oxide Reinforced Magnesium Matrix Nano-Composites. Mater. Des. 58, 475–481. doi:10.1016/j.matdes.2014.02.006
Tekumalla, S., Bharadwaj, S., Srivatsan, T. S., and Gupta, M. (2018). “An Engineered Magnesium Alloy Nanocomposite: Mechanisms Governing Microstructural Development and Mechanical Properties,” in TMS Annual Meeting & Exhibition (Cham: Springer), 193–202. doi:10.1007/978-3-319-72853-7_13
Tun, K. S., and Gupta, M. (2007). Improving Mechanical Properties of Magnesium Using Nano-Yttria Reinforcement and Microwave Assisted Powder Metallurgy Method. Composites Sci. Technol. 67 (13), 2657–2664. doi:10.1016/j.compscitech.2007.03.006
Keywords: magnesium, nanocomposite, tribological behavior, tungsten carbide, response surface methodology
Citation: Banerjee S, Sahoo P and Davim JP (2022) Tribological Performance Optimization of Mg-WC Nanocomposites in Dry Sliding: A Statistical Approach. Front. Mater. 9:791447. doi: 10.3389/fmats.2022.791447
Received: 08 October 2021; Accepted: 31 January 2022;
Published: 11 March 2022.
Edited by:
Bin Yu, University of Science and Technology of China, ChinaReviewed by:
Ravichandran Manickam, K. Ramakrishnan College of Engineering, IndiaCopyright © 2022 Banerjee, Sahoo and Davim. This is an open-access article distributed under the terms of the Creative Commons Attribution License (CC BY). The use, distribution or reproduction in other forums is permitted, provided the original author(s) and the copyright owner(s) are credited and that the original publication in this journal is cited, in accordance with accepted academic practice. No use, distribution or reproduction is permitted which does not comply with these terms.
*Correspondence: Prasanta Sahoo, cHNqdW1lQGdtYWlsLmNvbQ==
Disclaimer: All claims expressed in this article are solely those of the authors and do not necessarily represent those of their affiliated organizations, or those of the publisher, the editors and the reviewers. Any product that may be evaluated in this article or claim that may be made by its manufacturer is not guaranteed or endorsed by the publisher.
Research integrity at Frontiers
Learn more about the work of our research integrity team to safeguard the quality of each article we publish.