 Archana Yadav
 Shatrughna Kumar
 Anil Kumar1
 Preeta Sharan
- 1Department of ECE, Amity School of Engineering and Technology, Amity University, Uttar Pradesh Noida Lucknow Campus, Noida, India
- 2Department of Physical Electronics, School of Electrical Engineering, Faculty of Engineering, and Centre for Light-Matter Interaction, Tel Aviv University, Tel Aviv-Yafo, Israel
- 3Department of ECE, The Oxford College of Engineering, Bengaluru, India
This paper presents a multi-layered Kretschmann configuration-based Surface Plasmon Resonance (SPR) biosensor for the detection of urine glucose. The modelling, simulation, and analysis have been done by using Silver (Ag) and Gold (Au) layer on the low refractive index prism BK-7 separately, which created two structures: structure-I (BK7/Ag/Bio-sample) and structure-II (BK7/Au/Bio-sample). Urine samples from a non-diabetic person (0–15 mg/dL) and a diabetic person (.625 gm/dL, 1.25 gm/dL, 2.5 gm/dL, 5 gm/dL, and 10 gm/dL) with the corresponding refractive indices of 1.335, 1.336, 1.337, 1.338, 1.341, and 1.347, respectively, have been used as a bio-sample that has been put on the top layer of the sensor. An investigation was conducted to improve the performance parameters of the proposed plasmonic biosensor by layering different 2-D nanomaterials (graphene, BP) and TMDC materials (MoS2, MoSe2, WS2, and WSe2) over the silicon (Si) layer in both structures at a visible wavelength of 633 nm, using Transfer Matrix Method (TMM). With layer thickness optimization, Structure-I (BK7/Ag (56 nm/Si (3 nm)/WS2 (.8 nm)/Bio-sample) shows a sensitivity of 200 °/RIU which is enhanced up to 1.7 times that of the conventional biosensor (BK7/Ag/Bio-sample) and 1.3 times that of the BK7/Ag (56 nm)/Si (3 nm)/Bio-sample based biosensor. Whereas in Structure-II (BK7/Au (50 nm)/Si (3 nm)/BP (.53 nm)/Bio-sample) with optimised layer thickness, we obtained a sensitivity of 273.4°/RIU, which is enhanced up to 2.2 times that of the conventional biosensor (BK7/Au/Bio-sample) and 1.3 times that of the BK7/Au (50 nm)/Si (3 nm)/Bio-sample. Other performance parameters such as detection accuracy for Structure-I and Structure-II are .5617 degree−1 and .134 degree−1 respectively. The Figure of merit for Structure-I and Structure-II are 112.35/RIU and 36.89/RIU respectively. Therefore, we expect Structure-I (BK7/Ag (56 nm/Si (3 nm)/WS2 (.8 nm)/Bio-sample) and Structure-II (BK7/Au (50 nm)/Si (3 nm)/BP (.53 nm)/Bio-sample) have the potential to detect the glucose concentration with quick response and high sensitivity in terms of the resonance angle shift in SPR curves.
1 Introduction
The study of human health and happiness has always been a fascination among researchers. To date, many studies have been carried out to explore human physiology and pathology. In the modern era, the prevalence of diabetes mellitus, often known as “diabetes,” has significantly escalated among humans. From the previous estimation, this disease is projected to reach up to 450 million of the global population by 2030 (Oliver et al., 2009).
A person suffers from diabetes when they have trouble maintaining a healthy blood glucose level throughout a variety of prandial (before and after eating) conditions. Basically, the lack of insulin needed to properly handle glucose production in the body is what leads to diabetes. Usually, this happens because of the destruction of pancreatic beta cells, which are responsible for the production of insulin in the body (Teymourian et al., 2020). Diabetes may be broadly categorised into three distinct subtypes: type 1, type 2, and gestational. Type 1 diabetes occurs when the body’s immune system mistakenly targets and kills insulin-producing pancreatic cells. The afflicted individual will thereafter be unable to produce insulin by their own means. Whereas the majority of people suffer from type 2 diabetes, which arises due to the ineffective use of insulin production in the human body. Later in their pregnancies, some women develop a condition called gestational diabetes, which will usually be cured after the pregnancy in most cases (Hsieh et al., 2004). Both hyperglycaemia (excess glucose concentration) and hypoglycaemia (low glucose concentration) are medical conditions that must be treated as soon as possible to avoid fatal consequences. Common diabetes symptoms include frequent urination, extreme hunger and thirst, rapid weight loss, extreme fatigue, and blurred or distorted eyesight. Kidney disease, stroke, heart disease, nerve damage, and blindness are just some of the complications that can arise from untreated diabetes over time (Heller and Feldman, 2013). As a result of these complications, people with diabetes now have a mortality rate that is 50% greater than that of people without diabetes.
Although there is no permanent cure for diabetes, it can be effectively managed with timely diagnosis of glucose levels and appropriate medication. Injections of insulin or oral glucose-maintaining medications are commonplace in the treatment of diabetes, along with regular checks on sugar levels and correct dosing of medications that may improve the efficacy of these therapies (Heller and Feldman, 2008). In view of this, some advanced and reliable monitoring systems are capable of making the diabetes patient’s life easier. For years, various biological indicators like blood, urine, interstitial fluids, sweat, breath, saliva, and tears have been used to correlate with blood glucose concentration levels to make glucose monitoring simple, easy, more efficient, and less painful.
In this paper, glucose level detection has been studied using a urine sample. Urine is the liquid waste product of human metabolism, consisting of several analytes such as uric acid, urea, and creatinine. It gives a basis for monitoring an overall physical health condition (Zanon et al., 2011). Usually, a urine sample does not show any glucose concentration levels for a person in normal condition. However, for a person with diabetes, glucose concentration levels have been detected and quantified in urine (Li et al., 2015).
Many researchers have reported various techniques in the field of urinary biosensors (Scullion et al., 2013). Recently, metamaterials have emerged as a new type of material that shows potential as a way to improve the performance of the biosensor (Padilla and Averitt, 2021), (Kumar et al., 2022), (Kumar et al., 2020) (Kumar et al., 2021). However, metamaterials with small feature sizes (less than 300 nm) are hard to design. Due to the constraints of current nanolithography techniques, engineered metamaterials do not fall under the meta-regime where the unit-cell dimensions are relatively smaller than the operating wavelength (Noginov and Podolskiy, 2016) (Kaur et al., 2019) (Sortino, 2011). Very Recently, advancements in 2-D photonic crystals have been made. This is based on the hexagonal structure and resonance cavity principle (Aidinis et al., 2020). Furthermore, enhancement has been carried out in the devices, and 2-D hexagonal photonic lattice crystals (Yuan et al., 2018) were also proposed. Glucose levels were detected in all of these devices by measuring the change in the refractive index of the urine sample and then correlating the respective resonance frequencies with the glucose concentration level. These photonic crystal-based techniques can solve many challenges, yet they have a few major downsides, such as the need for pre-sample treatment, biofouling of the delicate crystal structure, and a high fabrication cost.
To overcome these issues, a surface plasmon resonance biosensor has been used for biosensing applications. This highly sensitive phenomenon makes it possible to use it in real-time and label-free biosensing applications where minute changes in refractive index are needed to be measured. SPR biosensors possess various advantages, including ultra-sensitive detection (Homola et al., 1999). They are sensitive even when the concentration of the bio-sample is very low. Extensive efforts have been made to miniaturise SPR biosensors, which are motivated by the idea of a lab-on-chip and its significance in a wide range of applications like detection, biosensing, kinetic and binding experiments, and point-of-care diagnostics (Scarano et al., 2010).
SPR is an optical phenomenon that is caused by the interaction of the p-polarized monochromatic light with the free electrons on the metal-surface interface (Srivastava et al., 2011) (Sharan et al., 2022) (Karmakar et al., 2022) The sensing phenomenon is based on the change in the refractive index of the bio-sample placed at the top layer of the sensor, which results in an angular shift in resonance curves. Based on the light coupling through the prism, these SPR-based structures are of two types. One is the Kretschmann configuration (Kretschmann and Raether, 1968) in which the metal layer is directly in contact with the prism base, and the other is Otto configuration (Otto, 1968) which maintains an air gap between the metal layer and prism base. Moreover, this air gap is filled with any dielectric material having a low dielectric constant. Most of the devices are based on the Kretschmann configuration due to its ease of construction.
This work is based on the Kretschmann configuration for the simulation of the proposed biosensor. The angular modulation method has been employed for the calculation of the resonance angle (θspr). At resonance, the electrons in the metal surface absorb the incident photons, due to which the intensity of reflected light drops. As the light travels across the layers, the reflected intensity decreases.
Due to the utmost excitation of the surface plasmons, reflectance intensity is reduced to a minimum (Hayashi and Okamoto, 2012) by conserving the momentum and energy of the incident light at resonance conditions, which satisfies the equation
And,
Further solving the Fresnel equations allows the reflectance intensity as a function of incident angle to be obtained. Moreover, the dip of the reflectance curve at the resonance shifts upon replacing the bio-sample with different refractive indices (Otto, 1968). This shift in dip is directly related to the biosensor’s sensitivity.
For the design of SPR based biosensor, a thin film of plasmonic metals such as Gold (Au), Silver (Ag), Nickle (Ni), Platinum (Pt), Aluminium (Al), and Copper (Cu) (Moznuzzaman et al., 2020) is deposited on a dielectric substrate such as a prism made up of BK-7 glass, and further, it is covered with a sensing medium consisting of a bio-sample. Due to the poor adsorption property of the metals, they do not show many effects in the detection of bio-samples, and further, they are more susceptible to oxidation and corrosion. As a result, they must be coated with a chemically inert material in addition to meeting the requirement of high adsorption against the bio-sample in order to improve sensing performance parameters. Hence, the 2-D nanomaterials (Liu et al., 2015) such as graphene, Black Phosphorus (BP), and transition metal dichalcogenides (TMDCs) such as Molybdenum disulfide (MoS2), Molybdenum diselenide (MoSe2), Tungsten disulfide (WS2) and Tungsten diselenide (WSe2) have gained great attention for the last 2 decades to enhance the sensitivity of the SPR biosensor. Because of its unique optical and electrical characteristics, it has recently been a research focus for biosensing applications. Additionally, they possess much better thermal and mechanical conductivity and a large value of elasticity, which makes them best suited for enhancing the SPR performance parameters (Singh et al., 2020).
In this study, two SPR structures have been proposed based on a typical Kretschmann configuration. In Structure-I, Ag has been used as a plasmonic metal, whereas Au has been used in Structure-II. Both of these metals have low complex refractive index values, indicating a higher capacity for absorption. Further, the effect of the silicon Layer has been simulated and analysed over both structures that simultaneously enhances the resonance effect and detection sensitivity as compared to conventional biosensors. (Green, 2008). The bio-sample consists of urine glucose samples of 0–15 mg/dL, .625 gm/dL, 1.25 gm/dL, 2.5 gm/dL, 5 gm/dL, and 10 gm/dL with the corresponding refractive indices of 1.335, 1.336, 1.337, 1.338, 1.341, and 1.347, respectively (Sani and Khosroabadi, 2020). Now, we have demonstrated the incorporation of 2-D nanomaterials over the Si layer in both Structure-I and Structure-II. After theoretical simulation and analysis of structure-I with a monolayer of WS2, the sensitivity increases up to 1.3 times that of the sensor using Ag-Si layer and 1.7 times that of the conventional biosensor (BK7/Ag/Bio sample). Using a monolayer of BP sensitivity, on the other hand, improves sensitivity up to 1.3 times that of the Au-Si layer-based sensor and 2.2 times that of the conventional (BK7/Au/bio sample) biosensor in Structure-II. Additionally, Structure-II shows a sensitivity 1.4 times greater than that of Structure-I, which resulted in the attainment of a sensitivity of 273.4 °/RIU. We expect the proposed structure has the potential to detect glucose concentration levels with a quick response in terms of resonance angle shift in reflectance vs incident angle curves.
This paper is structured into the following parts: A brief introduction to diabetes and the SPR sensing phenomenon has been explained in Section 1. Section 2 describes the design methodology for the device structure. Section 3 explains the theory and theoretical modelling of the proposed biosensor. Section 4 illustrates the findings, followed by the analysis and discussion of those findings and a comparison of the results with existing work. The overall conclusion has been reached in Section 5, and references have been added later on.
2 Device design and methodology
Figure 1 shows the schematic diagram of the proposed multilayer biosensor in a typical Kretschmann configuration. The structure is comprised of five layers, which are in the following sequence: Prism-Ag/Au-Si-2D-Bio-sample. The thickness of all layers is in the nanometre (nm) range, and the operating wavelength has been considered as 633 nm to get the best performance parameters of the proposed biosensor. Here, the prism, which is fabricated from BK-7 glass, has been taken as the first layer. The prism’s refractive index was calculated using Eq. 2 (Johnson and Christy, 1972) for an operating wavelength of 633 nm.
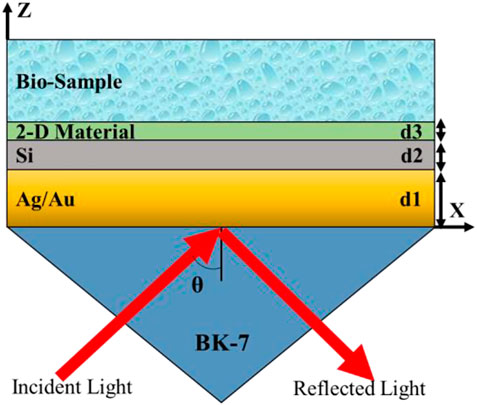
FIGURE 1. Schematic of the proposed SPR biosensor.
The base of the prism has been coated with a thin layer of Ag (a single layer of thickness d1 = 56 nm), which is later covered by a thin layer of Silicon (Si) with a thickness of d2 = 3 nm. The prism’s base has now been coated with a thin layer of Au (a single layer of thickness d1 = 50 nm), which is then covered by a thin layer of Si of thickness d2 = 3 nm. Further, A case study has been done by using various 2-D materials over the Ag (56 nm)-Si (3 nm) layer and the Au (50 nm)-Si (3 nm) layer for efficient glucose detection in a urine sample. This sample consists of a range of glucose concentrations of 0–15 mg/dL, .625 gm/dL, 1.25 gm/dL, 2.5 gm/dL, 5 gm/dL, and 10 gm/dL, and the corresponding refractive indices are 1.335, 1.336, 1.337, 1.338, 1.341, and 1.347. Here, the thickness of the bio-sample has been taken as 1,500 nm. However, we know the SPR phenomenon correlates only with a metal-dielectric interface and the operating wavelength of the monochromatic incident light. This way, analysis has been done by making two structures. Structure-I demonstrates the analysis of 2-D materials over the Ag (56 nm)-Si (3 nm) layer and forms the device with the following layers: Prism-Ag (56 nm)-Si (3 nm)-2D-Bio-sample, whereas Structure-II illustrated the analysis of 2-D materials over the Au (50 nm)-Si (3 nm) and created the device structure as Prism-Au (50 nm)-Si (3 nm)-2D-Bio-sample. Refractive indices of metal layers are complex in nature and have been calculated using the Drude–Lorentz model by using Eq. 3 (Sharma et al., 2015)
where λ, λp, and λc denote the operating wavelength of the monochromatic source of light, plasma wavelength, and collision wavelength respectively. Values of λp and λc for metals used are given in Table 1.
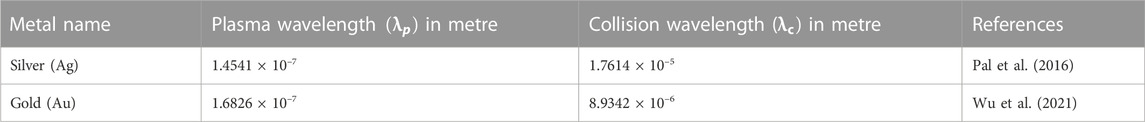
TABLE 1. Plasma and Collision wavelength for Ag and Au metal as per Drude Model at λ = 633 nm wavelength.
The refractive index of the silicon (Si) layer has been taken as 3.9160 (Malitson, 1965) with an optimised thickness of 3 nm. Table 2 provides the details of the refractive indices of 2-D materials that have been used in the simulation analysis. We can summarise our structure as a prism: the first layer is made up of BK7 glass to couple the entire incident light, the metal (Ag or Au) layer is the second layer for generating surface plasmons at the interface, Si is the third layer for enhancing the plasmonic effects at the metal surface, and the next 2-D material layer is for further improving the sensing performance of the biosensor.
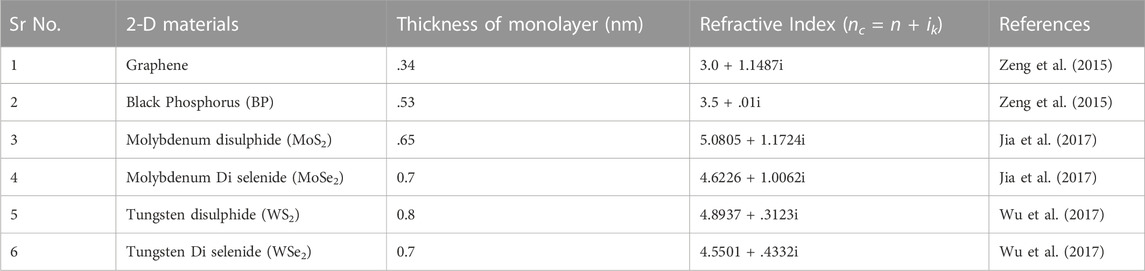
TABLE 2. Refractive Index values for the different 2-D Materials.
3 Theoretical modelling of the proposed biosensor
This section represents the mathematical modelling of the proposed biosensor. This has been done by using the Transfer Matrix Method and Fresnel equations to analyse the reflectivity of the sensor (Yamamoto, 2015). Reflectivity (R) measurement of the reflected light at the output is the major requirement for any biosensor used for sensing purposes. To find out the reflectivity, we have to consider the reflection coefficient (r) for p-polarized monochromatic light. Here, for the five-layered device structure, the relation between R12345 and r12345 for the first interface can be expressed by Eq 4 (Barchiesi, 2013):
Expression for the second interface can be represented by Eq. 5 (Yamamoto, 2015):
Expression for the third interface can be expressed by Eq. 6 (Yamamoto, 2015):
Reflection coefficient expression for interface 1 and 2, 2 and 3, 3 and 4, and four and five can be written by using Eq. 6 (Yamamoto, 2015):
Here
Eq. 7 (Barchiesi, 2013) represents the wave vector (k) component perpendicular to the layer interface
where
and the dielectric constant of jth layer can be noted as:
where
In this study, the angular modulation approach has been used to find the sensitivity of the proposed biosensor. In this approach, the incident angle, with a fixed wavelength, is scanned continuously. For a different refractive index of the bio-sample, the shift of the SPR angle is thus measured. The shift of dip in SPR curve, directly reflects the mass change on the SPR sensing surface (Liedberg et al., 1983).
3.1 SPR sensing performance parameters
Major parameters that define any sensor’s performance are angular sensitivity (S), detection accuracy (DA), figure of merit (FOM), and quality factor (QF). A good performance sensor possesses higher values of S, DA, FOM, and QF. Eq. 10 demonstrates the angular sensitivity (Sreekanth et al., 2013) of the sensor, which can be defined as the ratio of the change in the resonance angle (
The unit of angular sensitivity is the degree/RIU (Refractive Index Unit), and resonance angle can be defined as the angle at which reflectivity is minimum. A higher value of S shows that the sensor is capable of detecting the minute difference in the refractive index of the bio-sample.
Eq. 11 represents the detection accuracy (DA), which is defined as the inverse of the full width half maximum (HWFM). A high value of DA requires a minimum value of FWHM, and that shows sensors have better capability to produce an accurate response. The unit of the DA is 1/degree, where HWFM can be calculated by the thickness of the SPR curve at half (50%) of the reflectance intensity (Shalabney and Abdulhalim, 2010).
Eqs 12, 13 define the FOM and QF (Shalabney and Abdulhalim, 2010)
4 Simulation analysis and result discussion
In this study, a finite element method (FEM) based on the “COMSOL Multiphysics” software has been employed for the detection of glucose concentration in a urine sample with changes in the refractive indices. The light has been incident on the prism BK-7, and the angular interrogation method has been performed by using the parametric sweep in the range from 65° to 89° with a .01° increment. Reflection intensity has been measured for each incident angle. Optimization of biosensors has been carried out in the following subsections through a selection of metals and 2-D materials and by optimising their layer thickness.
4.1 Optimization of metal layer thickness
It is necessary for the lowest reflectance values (Rmin) of any biosensor to be somewhat near zero for the biosensor to have increased resolution and sensitivity. This is done so that a significant amount of p-polarized energy may be coupled to the surface plasmons. In this study, two structures have been considered based on Ag and Au. So firstly, it is aimed to optimise the thickness of the Ag and Au for Structure-I (Prism/Ag/Bio-sample) and Structure-II (Prism/Au/Bio-sample), respectively.
This has been done by applying iterative simulation and performance analysis. The resonance condition occurs when the incident wave vector becomes equal to the propagation constant at the interface. Optimization has been done by considering the minimum reflectance at resonance. By further increasing the thickness above this optimised thickness, the minimum reflectance at resonance increases, which indicates that the excitation of surface plasmons is weak at this thickness. Figure 2A shows the Rmin values decreasing with the increase in the thickness of the Ag layer up to the optimised value of 56 nm. Further, by increasing the Ag thickness, Rmin increases. Therefore, Figure 2A refers to 56 nm as the optimised thickness for the Ag layer, demonstrating the Rmin and S of .054337 and 118.54 °/RIU, respectively. Now the same process has been repeated for Structure-II, and Figure 2B represents the optimised thickness for the Au layer as 50 nm with the values of Rmin and S of .012912 and 143.8 °/RIU, respectively.
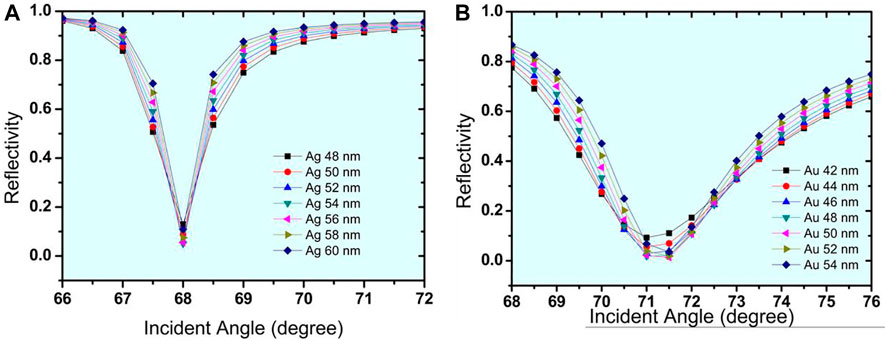
FIGURE 2. Optimization of the thickness of (A). Ag and (B) Au metals in Kreschmann configuration.
Now, at this initial stage of the proposed biosensor, it has been optimised for Structure I, which is made up of a prism/Ag (56 nm)/bio-sample, while Structure II is made up of a prism/Au (50 nm) and a bio-sample. On placing the bio-sample at the top layer of the sensor, a shift in the resonance angle occurs that can be calculated for the sensor’s performance. Figures 3A,B show the SPR curves for the reflectance relating to the change in incident angle for urine glucose detection in terms of shifting refractive indices. Structure-I and Structure-II show a sensitivity of 118.54 °/RIU and 143.8 °/RIU, respectively.
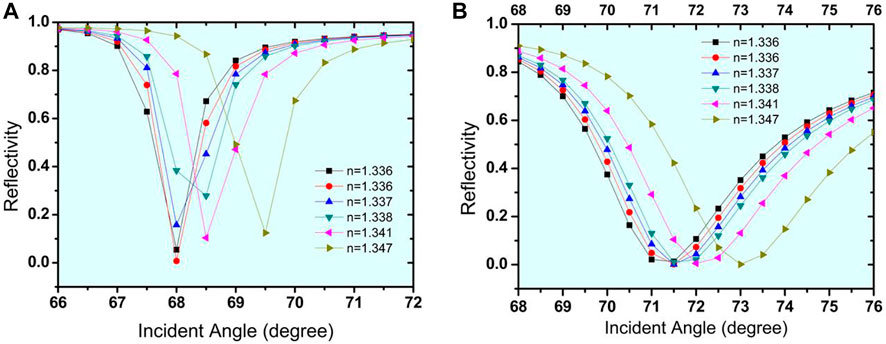
FIGURE 3. Reflectivity curve with respect to change in incident angle for the detection of urine glucose in bio-sample (A). Ag based conventional SPR biosensor (B). Au based conventional SPR biosensor.
4.2 Influence of the Si layer over the Ag and Au metal layer
In this section, the addition of the silicon layer and its thickness optimization for both structure-I and Structure-II have been done. A Si layer has been used to increase the stability and sensitivity of the proposed biosensor. This layer helps to enhance the evanescent field at the metal-dielectric interface (Ghosh and Ray, 2015). In addition to this, the Si layer covers the Ag surface in Structure-I and prevents it from being oxidized, as it cannot be directly used as a sensing layer because of its easily oxidised nature. Whereas in structure- II, the Si layer provides better resolution, sensitivity, and minimum reflectance values.
Figures 4A, B show that the Si has an optimised thickness of 3 nm for both structure I and structure II. Rmin began to increase as the thickness of the Si layer was increased, which is undesirable for the sensor. As a result, the thickness of 3 nm was determined to be optimal for the sensor’s design. The SPR curves for the reflectance concerning change in incident angle for urine glucose detection in terms of shifting refractive indices are shown in Figures 5A,B. The sensitivity obtained for Structure-I and Structure-II at this stage is 154.6 °/RIU and 245 °/RIU respectively. Table 3 shows the change in resonance angle values and reflectance values for both Structure-I and Structure-II.
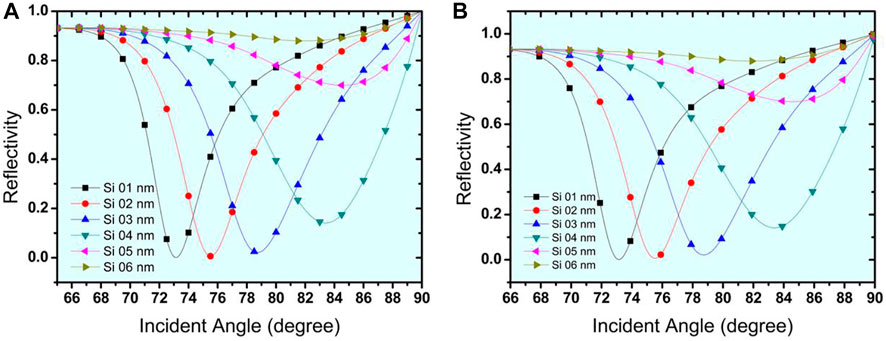
FIGURE 4. Thickness optimization of Si layer for the (A). Structure-I (Prism/Ag/Si/Bio-sample) (B). Structure-II (Prism/Au/Si/Bio-sample).
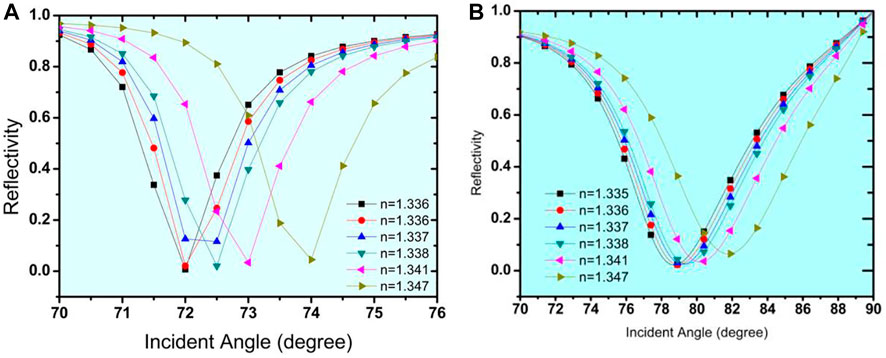
FIGURE 5. Reflectivity curve with respect to changes in incident angle for the detection of urine glucose in bio-sample (A). For Structure-I (Prism/Ag/Si/Bio-sample) (B). For Structure-II (Prism/Au/Si/Bio-sample).
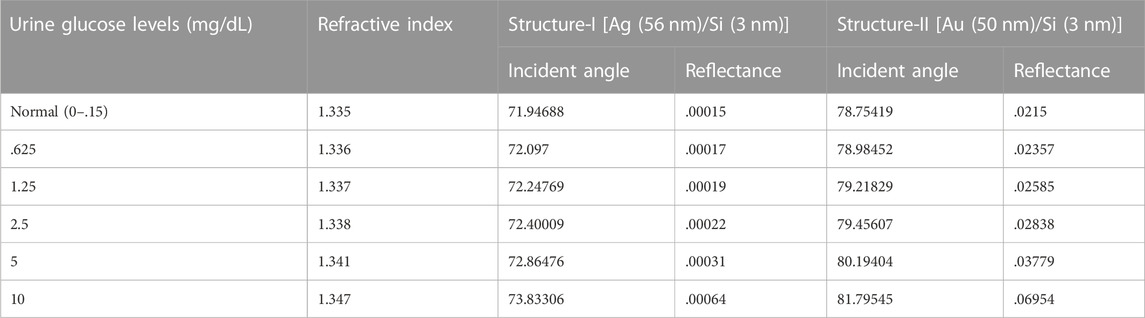
TABLE 3. Angle shift values and reflectance on the addition of Si layer for both structure-I and Structure-II.
4.3 Effect of 2D material over the Ag-Si layers and Au-Si layer
As discussed in the previous section, Structure-I has been optimised as a prism/Ag (56 nm)/Si (3 nm)/bio-sample, whereas Structure-II has been optimised as a prism/Au (50 nm)/Si (3 nm)/bio-sample. Now, this section explains the influence of various 2-D material layers in both Structure -I and Structure-II. For this, we first optimised the thickness of each 2-D material layer. It usually began to show the result on even a single layer. For this, a case study has been done for optimising the layer thickness of each 2-D material, and after that, this optimised thickness has been placed over the Si layer in both Structure-I and Structure-II. Optimization of the thickness of these layers has been done through the respective analysis of Rmin. Refractive indices of all used 2-D materials have been given in Table 1. A monolayer of Graphene, BP, MoS2, MoSe2, WS2, and WSe2 has been put over the Ag-Si layer one by one as a fourth layer of the proposed biosensor to detect the glucose concentration in a urine sample of different refractive indices, viz., 1.335, 1.336, 1.337, 1.338, 1.341, and 1.347. Simulation results show a significant resonance shift, and consequently, angular sensitivity has been calculated. The obtained sensitivities are 159.09 °/RIU, 164.3 °/RIU, 176.3 °/RIU, 174.98 °/RIU, 200 °/RIU, and 175.5 °/RIU for graphene, BP, MoS2, MoSe2, WS2, and WSe2, respectively. Table 4 shows the numerical values of angle shift and reflectance on addition of different 2-D nanomaterials over the Si layer for structure-I. As a result, for Structure-I, WS2 has a significantly higher sensitivity of 200 o/RIU than the other 2-D materials. WS2 possesses a large real part of the refractive index; thus, it has the significant ability to absorb a huge amount of light energy (Wu et al., 2017). Figure 6 shows the SPR curve for the Structure-I prism/Ag (56 nm)/Si (3 nm)/WS2(.8 nm)/Bio-sample for the detection of glucose. The refractive index variation for a change in glucose sample from 0–15 mg/dL (for a normal person) to .625 gm/dL (for a diabetic person) is .001, and the obtained corresponding angle shift is 74.2926°–74.4685°, Similarly, for the glucose concentration from 1.25 gm/dL to 2.5 gm/dL, Δns = .001, and the SPR angle (variation occurs from 74.6461° to 74.8254°. Furthermore, the refractive index variation ns = .006 and the SPR angle shift is from 75.3766° to 76.5437° for the 5 gm/dL to 10 gm/dL range. So, from these curves, we can say that, for a very minute change of .001 in the refractive index of the bio-sample, a significant change in the resonance angle is obtained, and substantially, SPR curves shift to the right.
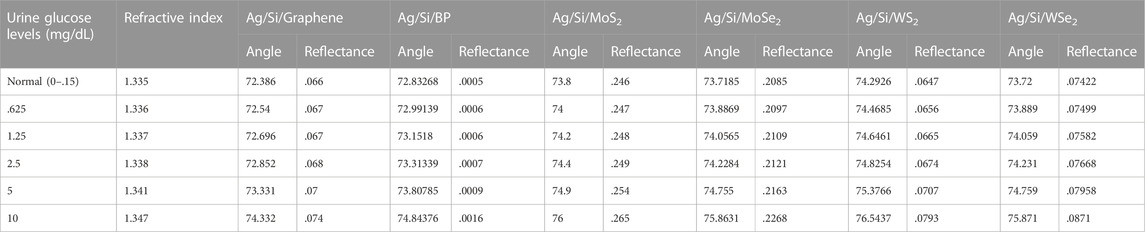
TABLE 4. Angle shift values and reflectance on addition of 2-D nanomaterials over the Si layer for structure-I.
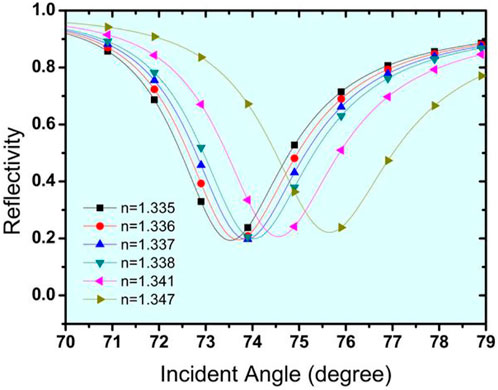
FIGURE 6. Reflectivity curve with respect to change in incident angle for the detection of urine glucose in bio-sample for Structure-I (Prism/Ag/Si/WS2/Bio-sample) with effect of WS2 nanomaterial.
Again, a similar process has been done for Structure-II. The whole process is iterated, and a monolayer of Graphene, BP, MoS2, MoSe2, WS2, and WSe2 has been put over the Au-Si layer one by one as a fourth layer of the proposed biosensor to detect the glucose concentration in a urine sample of different refractive indices, viz., 1.335, 1.336, 1.337, 1.338, 1.341, and 1.347. Simulation results reveal a significant resonance shift, and consequently, angular sensitivity has been calculated. The obtained sensitivities are 248.3 °/RIU, 273.4 °/RIU, 167.1 °/RIU, 185.4 °/RIU, 137.58 °/RIU and 209.9 °/RIU for graphene, BP, MoS2, MoSe2, WS2 and WSe2, respectively, which reveal that BP shows the better sensitivity of 273.4 °/RIU among the other 2-day materials. BP produces different results because it is a direct bandgap semiconductor material and also consists of a honeycomb lattice structure. Due to this, it can perform better in biosensing applications. Table 5 shows the numerical values of angle shift and reflectance on addition of different 2-D nanomaterials over the Si layer for structure-II.
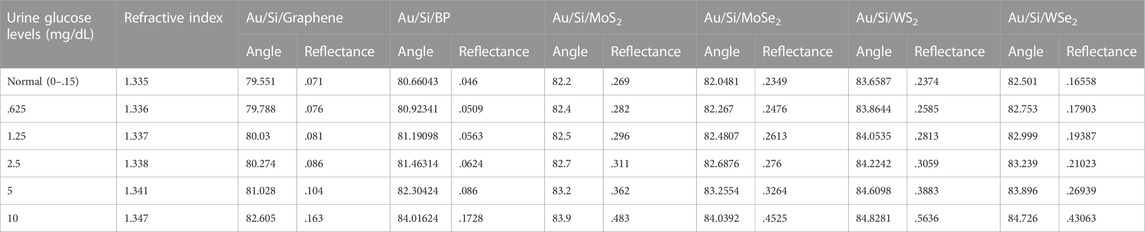
TABLE 5. Angle shift values and reflectance on addition of 2-D nanomaterials over the Si layer for structure-II.
The SPR curve for the Structure-II prism/Au (50 nm)/Si (3 nm)/BP (.53 nm)/Bio-sample for glucose detection is shown in Figure 7. For a change in glucose sample from 0–15 mg/dL (for a normal person) to .625 gm/dL (for a diabetic person), the refractive index variation found is .001, and the obtained corresponding angle shift is 80.66043°–80.92341°, Similarly, for glucose concentrations ranging from 1.25 g/dL to 2.5 g/dL, ns = .001 and the SPR angle shifts from 81.19098° to 81.46314°, while for glucose concentrations ranging from 5 g/dL to 10 g/dL, ns = .006 and the SPR angle shifts from 82.30424° to 84.01624°. As a result of this analysis, it is possible to conclude that for a very small change of .001 in the refractive index of the bio-sample, a significant change in the resonance angle is obtained, and SPR curves shift to the right with a significantly high sensitivity of 273.4 o/RIU, which is 1.4 times that obtained by the Structure-I. Tables 6, 7 show the summary of the optimised layer, change in resonance angle, and calculated sensitivity for Structure-I and Structure-II, respectively, with 2-D nanomaterials (graphene/BP/MoS2/MoSe2/WS2/WSe2).
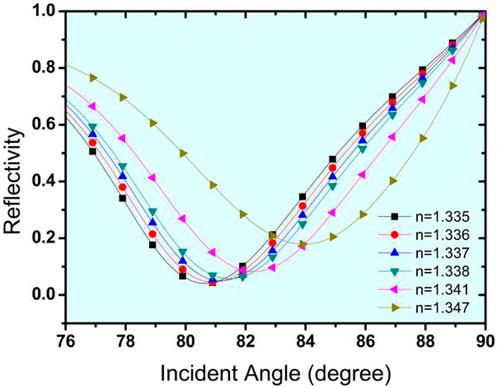
FIGURE 7. Reflectivity curve with respect to change in incident angle for the detection of urine glucose in bio-sample for Structure-II (Prism/Au/Si/BP/Bio-sample) with effect of BP nanomaterial.
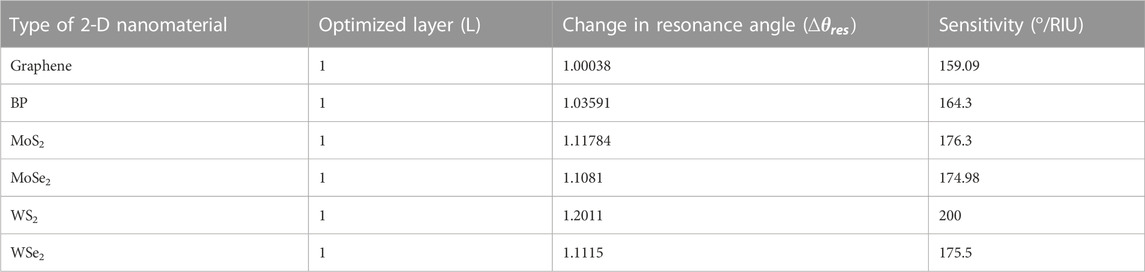
TABLE 6. Optimized layer, change in resonance angle, and calculated Sensitivity for the Structure-I, Ag/Si with 2-D nanomaterials (Graphene/BP/MoS2/MoSe2/WS2/WSe2).
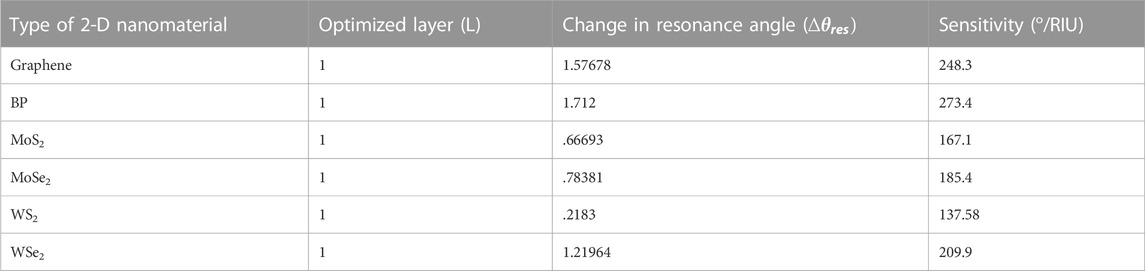
TABLE 7. Optimized layer, change in resonance angle, and calculated Sensitivity for the Structure-II, Au/Si with 2-D nanomaterials (Graphene/BP/MoS2/MoSe2/WS2/WSe2).
Some of the relevant work done in the past with 2-D material layers has also been compared to the biosensor that is proposed in Table 8.
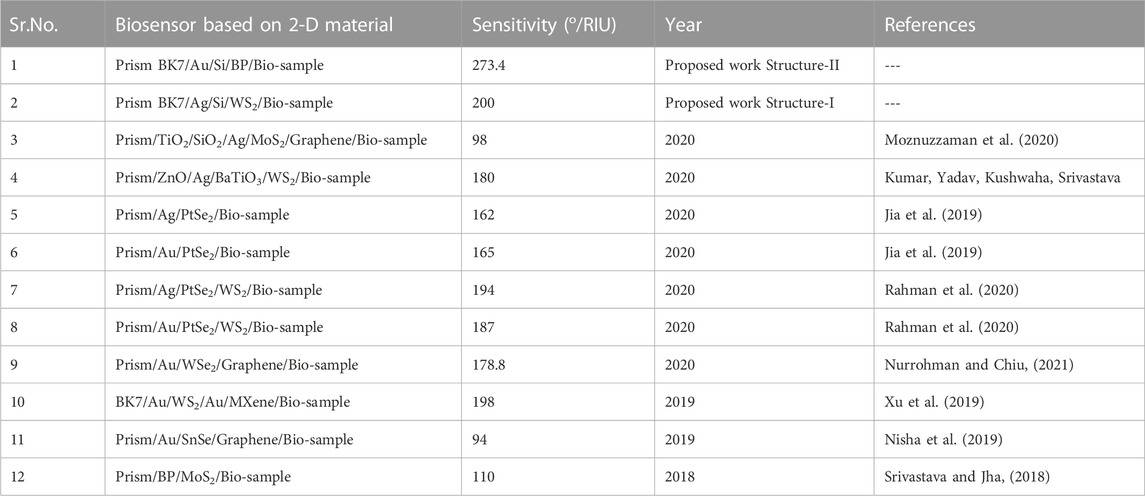
TABLE 8. Comparison of Proposed work with some of the recently published work.
Additionally, if we compare these two proposed structures, it can be said that Structure-II even shows better sensitivity as compared to Structure-I. Here we can conclude that 2-D materials perform well with Au and Si layers and give better sensing performance parameters. It gives an effective solution for the detection of glucose concentration levels in the urine sample.
5 Conclusion
In this present study, a numerical analysis has been carried out to find out the effect of 2-D nanomaterial (Graphene/BP/MoS2/MoSe2/WS2/WSe2) layers on a conventional (BK7/Ag or Au/Bio sample) biosensor based on Si layer, aiming towards the design of a highly sensitive biosensor for the efficient detection of urine glucose concentration levels. For this analysis, the angular modulation method has been done for these two structures, viz., Structure-I (Prism/Ag/Si/Bio-sample) and Structure-II (Prism/Au/Si/Bio-sample). A 2-D nanomaterial layer with optimised thickness has been placed over the Si layer, and a case study has been done for both structures. It is shown that among the 2-day nanomaterials, the addition of a monolayer of WS2 enhances the sensitivity up to 200 °/RIU for Structure-I because the large real part of the refractive index of WS2 can absorb a huge amount of light energy. On the other hand, a monolayer of BP plays a vital role in Structure-II because of its high absorption and adsorption coefficients, which enhance the sensitivity up to 273.4 °/RIU. Additionally, the obtained DA and FOM for Structure-I are .5617 degree−1 and 112.35/RIU, respectively. However, DA and FOM for Structure-II are .134 degree−1 and 36.89/RIU, respectively. Thus, Structure-II (Bk7/Au (50 nm)/Si (3 nm)/BP (.53 nm)/Bio-sample) shows better sensing performance parameters as compared to Structure-I (BK7/Ag (56 nm)/Si (3 nm)/WS2 (.8 nm)/Bio-sample). Therefore, we expect this proposed work based on 2-D nanomaterials has the potential to be used in continuous glucose monitoring as it can detect the minute change of .001 in the refractive index of a urine sample.
Data availability statement
The original contributions presented in the study are included in the article/Supplementary Material, further inquiries can be directed to the corresponding author.
Author contributions
All authors listed have made a substantial, direct, and intellectual contribution to the work and approved it for publication.
Conflict of interest
The authors declare that the research was conducted in the absence of any commercial or financial relationships that could be construed as a potential conflict of interest.
Publisher’s note
All claims expressed in this article are solely those of the authors and do not necessarily represent those of their affiliated organizations, or those of the publisher, the editors and the reviewers. Any product that may be evaluated in this article, or claim that may be made by its manufacturer, is not guaranteed or endorsed by the publisher.
References
Aidinis, K., Goudarzi, K., Esmaeili, A. H., Aidinis, K., Goudarzi, K., and Esmaeili, A. H. (2020). Optical sensor based on two-dimensional photonic crystals for measuring glucose in urine. OptEn 59 (5), 1. doi:10.1117/1.OE.59.5.057104
Akimov, Y. A., and Koh, W. S. (2010). Resonant and nonresonant plasmonic nanoparticle enhancement for thin-film silicon solar cells. Nanotechnology 21, 235201–235223. doi:10.1088/0957-4484/21/23/235201
Barchiesi, D. (2013). Improved method based on S matrix for the optimization of SPR biosensors. Opt. Commun. 286 (1), 23–29. doi:10.1016/J.OPTCOM.2012.08.060
Ghosh, S., and Ray, M. (2015). Analysis of silicon based surface plasmon resonance sensors with different amino acids. Silicon 747 (4), 313–322. doi:10.1007/S12633-015-9293-8
Green, M. A. (2008). Self-consistent optical parameters of intrinsic silicon at 300 K including temperature coefficients. Sol. Energy Mater. Sol. Cells 92 (11), 1305–1310. doi:10.1016/J.SOLMAT.2008.06.009
Hayashi, S., and Okamoto, T. (2012). Plasmonics: Visit the past to know the future. J. Phys. D. Appl. Phys. 45, 433001–433043. doi:10.1088/0022-3727/45/43/433001
Heller, A., and Feldman, B. (2013). Electrochemical glucose sensors and their application in diabetes management. Chem. Rev. 108 (7), 2482–2505. doi:10.1007/978-1-4614-6148-7_5
Heller, A., and Feldman, B. (2008). Electrochemical glucose sensors and their applications in diabetes management. Chem. Rev. 108 (7), 2482–2505. doi:10.1021/cr068069y
Homola, J., Yee, S. S., and Gauglitz, G. (1999). Surface plasmon resonance sensors: Review. Sensors Actuators, B Chem. 54 (1), 3–15. doi:10.1016/S0925-4005(98)00321-9
Hsieh, H. V., Pfeiffer, Z. A., Amiss, T. J., Sherman, D. B., and Pitner, J. B. (2004). Direct detection of glucose by surface plasmon resonance with bacterial glucose/galactose-binding protein. Biosens. Bioelectron. 19 (7), 653–660. doi:10.1016/S0956-5663(03)00271-9
Jia, Y., Jiang, L., Guo, J., Dai, X., Xiang, Y., Wu, L., et al. (2017). Sensitivity improved SPR biosensor based on the MoS2/graphene–aluminum hybrid structure. J. Light. Technol. 3535 (11), 8282–8787. doi:10.1109/jlt.2016.2624982
Jia, Y., Li, Z., Wang, H., Saeed, M., and Cai, H. (2019). Sensitivity enhancement of a surface plasmon resonance sensor with Platinum diselenide. Sensors 20 (1), 131. doi:10.3390/S20010131
Johnson, P. B., and Christy, R. W. (1972). Optical constants of the noble metals. Phys. Rev. B 6 (12), 4370–4379. doi:10.1103/PhysRevB.6.4370
Karmakar, S., Kumar, D., Varshney, R. K., and Roy Chowdhury, D. (2022). Magnetospectroscopy of terahertz surface plasmons in subwavelength perforated superlattice thin-films. J. Appl. Phys. 131 (22), 223102. doi:10.1063/5.0090592
Kaur, A., Preet, S., Kumar, V., Kumar, R., and Kumar, R. (2019). Synergetic effect of vancomycin loaded silver nanoparticles for enhanced antibacterial activity. Colloids Surfaces B Biointerfaces 176, 62–69. doi:10.1016/J.COLSURFB.2018.12.043
Kretschmann, E., and Raether, H. (1968). Notizen: Radiative decay of non radiative surface plasmons excited by light. Z. Naturforsch 23, 2135–2136. doi:10.1515/zna-1968-1247
Kumar, A., Yadav, A. K., Kushwaha, A. S., and Srivastava, S. K. (2020). A comparative study among WS2, MoS2 and graphene based surface plasmon resonance (SPR) sensor. Sensors Actuators Rep. 2 (1), 100015. doi:10.1016/J.SNR.2020.100015
Kumar, D., Devi, K. M., Kumar, R., and Roy Chowdhury, D. (2021). Dynamically tunable slow light characteristics in graphene based terahertz metasurfaces. Opt. Commun. 491, 126949. doi:10.1016/J.OPTCOM.2021.126949
Kumar, D., Gupta, M., Srivastava, Y. K., Devi, K. M., Kumar, R., and Roy Chowdhury, D. (2022). Photoinduced dynamic tailoring of near-field coupled terahertz metasurfaces and its effect on Coulomb parameters. J. Opt. 24 (4), 045101. doi:10.1088/2040-8986/AC4D71
Kumar, D., Jain, R., Shahjahan, , Banerjee, S., Prabhu, S. S., Kumar, R., et al. (2020). Bandwidth enhancement of planar terahertz metasurfaces via overlapping of dipolar modes. Plasmonics 15 (6), 1925–1934. doi:10.1007/s11468-020-01222-7
Li, D. C., Wu, J. W., Wu, P., Lin, Y., Sun, Y. J., Zhu, R., et al. (2015). “Glucose measurement using surface plasmon resonance sensor with affinity based surface modification by borate polymer,” in 2015 Transducers - 2015 18th Int. Conf. Solid-State Sensors, Actuators Microsystems, Transducers, Anchorage, AK, USA, 1569–1572. doi:10.1109/TRANSDUCERS.2015.7181238
Liedberg, B., Nylander, C., and Lunström, I. (1983). Surface plasmon resonance for gas detection and biosensing. Sensors Actuators 4, 299–304. doi:10.1016/0250-6874(83)85036-7
Liu, Y., Liu, Q., Chen, S., Cheng, F., Wang, H., and Peng, W. (2015). Surface plasmon resonance biosensor based on smart phone platforms. Sci. Rep. 5, 12864–12869. doi:10.1038/srep12864
Malitson, I. H. (1965). Interspecimen comparison of the refractive index of fused silica. J. Opt. Soc. Am. Opt. Soc. Am. 5555 (10), 1205–1209. doi:10.1364/JOSA.55.001205
Moznuzzaman, M., Rafiqul Islam, M., Biplob Hossain, M., and Mustafa Mehedi, I. (2020). Modeling of highly improved SPR sensor for formalin detection. Results Phys. 16, 102874. doi:10.1016/J.RINP.2019.102874
Nisha, A., Maheswari, P., Anbarasan, P. M., Rajesh, K. B., and Jaroszewicz, Z. (2019). Sensitivity enhancement of surface plasmon resonance sensor with 2D material covered noble and magnetic material (Ni). Opt. Quantum Electron. 51 (1), 19. doi:10.1007/S11082-018-1726-3
Noginov, M. A., and Podolskiy, V. A. (2016). Tutorials in metamaterials. Boca Raton, FL, USA: CRC Press. doi:10.1201/b11350
Nurrohman, D. T., and Chiu, N. F. (2021). A review of graphene-based surface plasmon resonance and surface-enhanced Raman scattering biosensors: Current status and future prospects. Nanomaterials 11 (1), 216–230. doi:10.3390/NANO11010216
Oliver, N. S., Toumazou, C., Cass, A. E. G., and Johnston, D. G. (2009). Glucose sensors: A review of current and emerging technology. Diabet. Med. 26 (3), 197–210. doi:10.1111/j.1464-5491.2008.02642.x
Otto, A. (1968). Excitation of nonradiative surface plasma waves in silver by the method of frustrated total reflection. Z. für Phys. 216 (4), 398–410. doi:10.1007/BF01391532
Padilla, W. J., and Averitt, R. D. (2021). Imaging with metamaterials. Nat. Rev. Phys. 424 (2), 85–100. doi:10.1038/s42254-021-00394-3
Pal, S., Prajapati, Y. K., Saini, J. P., and Singh, V. (2016). Sensitivity enhancement of metamaterial-based surface plasmon resonance biosensor for near infrared. Opt. Appl. 46 (1), 131–143. doi:10.5277/OA160112
Raether, H. (1988). Intro_Contents. Intro_Surface Plasmons Smooth Rough Surfaces Gratings 78. doi:10.1007/BFb0048317
Rahman, M. M., Rana, M. M., Rahman, M. S., Anower, M. S., Mollah, M. A., and Paul, A. K. (2020). Sensitivity enhancement of SPR biosensors employing heterostructure of PtSe2 and 2D materials. Opt. Mater. (Amst). 107, 110123. doi:10.1016/J.OPTMAT.2020.110123
Sani, M. H., and Khosroabadi, S. (2020). A novel design and analysis of high-sensitivity biosensor based on nano-cavity for detection of blood component, diabetes, cancer and glucose concentration. IEEE Sens. J. 20 (13), 7161–7168. doi:10.1109/JSEN.2020.2964114
Scarano, S., Scuffi, C., Mascini, M., and Minunni, M. (2010). Surface plasmon resonance imaging for affinity-based biosensors. Lect. Notes Electr. Eng. 54 (2), 425–428. doi:10.1007/978-90-481-3606-3_86
Scullion, M. G., Krauss, T. F., and Di Falco, A. (2013). Slotted photonic crystal sensors. Sensors 13 (3), 3675–3710. doi:10.3390/S130303675
Shalabney, A., and Abdulhalim, I. (2010). Electromagnetic fields distribution in multilayer thin film structures and the origin of sensitivity enhancement in surface plasmon resonance sensors. Sensors Actuators, A Phys. 159 (1), 24–32. doi:10.1016/j.sna.2010.02.005
Sharan, P., Yadav, A., and Kumar, A. (2022). Sensitivity enhancement of a plasmonic biosensor for urine glucose detection by employing black phosphorous. JOSA B 3939 (11), 200–206. doi:10.1364/JOSAB.444838
Sharma, N., Joy, A., Mishra, A. K., and Verma, R. K. (2015). Fuchs sondheimer-drude lorentz model and Drude model in the study of SPR based optical sensors: A theoretical study. Opt. Commun. 357, 120–126. doi:10.1016/j.optcom.2015.08.092
Singh, S., Singh, P. K., Umar, A., Lohia, P., Albargi, H., Castaneda, L., et al. (2020). 2D nanomaterial-based surface plasmon resonance sensors for biosensing applications. Micromachines 11 (8), 779. doi:10.3390/mi11080779
Sortino, S. (2011). Photoactivated nanomaterials for biomedical release applications. J. Mater. Chem. 22 (2), 301–318. doi:10.1039/C1JM13288A
Sreekanth, K. V., Zeng, S., Yong, K. T., and Yu, T. (2013). Sensitivity enhanced biosensor using graphene-based one-dimensional photonic crystal. Sensors Actuators, B Chem. 182, 424–428. doi:10.1016/j.snb.2013.03.039
Srivastava, T., Das, R., and Jha, R. (2011). Highly accurate and sensitive surface plasmon resonance sensor based on channel photonic crystal waveguides. Sensors Actuators, B Chem. 157 (1), 246–252. doi:10.1016/j.snb.2011.03.057
Srivastava, T., and Jha, R. (2018). Black phosphorus: A new platform for gaseous sensing based on surface plasmon resonance. IEEE Photonics Technology Letters 30 (4), 319–322. doi:10.1109/LPT.2017.2787057
Teymourian, H., Barfidokht, A., and Wang, J. (2020). Electrochemical glucose sensors in diabetes management: An updated review (2010-2020). Chem. Soc. Rev. 49 (21), 7671–7709. doi:10.1039/d0cs00304b
Wu, L., Guo, J., Wang, Q., Lu, S., Dai, X., Xiang, Y., et al. (2017). Sensitivity enhancement by using few-layer black phosphorus-graphene/TMDCs heterostructure in surface plasmon resonance biochemical sensor. Sensors Actuators B Chem. 249, 542–548. doi:10.1016/J.SNB.2017.04.110
Wu, X., Li, Z., Tong, K., Jia, X., Li, W., Guo, S., and Li, X. (2021). Glucose concentration sensor based on enhanced surface plasmon resonance by ITO film using Au nanowires array and ZnO-graphene hybrid nano-sheet. J. Optoelectron. Adv. Mater. 23, 245–251.
Xu, Y., Ang, Y. S., Wu, L., and Ang, L. K. (2019). High sensitivity surface plasmon resonance sensor based on two-dimensional MXene and transition metal dichalcogenide: A theoretical study. Nanomater 9 (2), 165. doi:10.3390/NANO9020165
Yamamoto, M. (2015). Surface plasmon resonance (SPR) theory: Tutorial. Rev. Polarogr. 48 (3), 209–237. doi:10.5189/revpolarography.48.209
Yuan, H., Ji, W., Chu, S., Qian, S., Wang, F., Masson, J. F., et al. (2018). Fiber-optic surface plasmon resonance glucose sensor enhanced with phenylboronic acid modified Au nanoparticles. Biosens. Bioelectron. 117, 637–643. doi:10.1016/J.BIOS.2018.06.042
Zanon, M., Riz, M., Sparacino, G., Facchinetti, A., Suri, R. E., Talary, M. S., et al. (2011). “Assessment of linear regression techniques for modeling multisensor data for non-invasive continuous glucose monitoring,” in Annu. Int. Conf. IEEE Eng. Med. Biol. Soc. IEEE Eng. Med. Biol. Soc. Annu. Int. Conf., Boston, MA, USA, 2538–2541. doi:10.1109/IEMBS.2011.6090702
Keywords: surface plasmons, biosensors, refractive index, kretschmann configuration, silicon, 2-D nanomaterials, reflectance, sensitivity
Citation: Yadav A, Kumar S, Kumar A and Sharan P (2023) Effect of 2-D nanomaterials on sensitivity of plasmonic biosensor for efficient urine glucose detection. Front. Mater. 9:1106251. doi: 10.3389/fmats.2022.1106251
Received: 23 November 2022; Accepted: 28 December 2022;
Published: 11 January 2023.
Edited by:
Chandan Kumar, Nara Institute of Science and Technology (NAIST), JapanReviewed by:
Deepak Kumar, Panjab University, IndiaSandip Roy, SP Jain School of Global Management, Australia
Copyright © 2023 Yadav, Kumar, Kumar and Sharan. This is an open-access article distributed under the terms of the Creative Commons Attribution License (CC BY). The use, distribution or reproduction in other forums is permitted, provided the original author(s) and the copyright owner(s) are credited and that the original publication in this journal is cited, in accordance with accepted academic practice. No use, distribution or reproduction is permitted which does not comply with these terms.
*Correspondence: Shatrughna Kumar, c2hhdHJ1aXNtMTVAZ21haWwuY29t