 Wenxu Liang1,2
 Gaojian Hu
94% of researchers rate our articles as excellent or good
Learn more about the work of our research integrity team to safeguard the quality of each article we publish.
Find out more
ORIGINAL RESEARCH article
Front. Mater. , 10 January 2023
Sec. Structural Materials
Volume 9 - 2022 | https://doi.org/10.3389/fmats.2022.1095897
The bulk modulus reflects the deformation of rock macroscopically and plays a vital role in geological exploration, oilfield development, and drilling. The bulk modulus not only changes under different rock sizes, but also varies with joint roughness. Therefore, it is very important to accurately estimate the bulk modulus of rough jointed rock and evaluate its deformation. In this paper, the influence of joint roughness and rock size on bulk modulus was discussed by regression analysis of 25 sets of simulation models. The research shows that with the increase of rock size, the bulk modulus decreases exponentially, and with the rise of joint roughness, the bulk modulus increases as a power function. With the rise of joint roughness, the characteristic size of bulk modulus increases exponentially, and the characteristic bulk modulus increases as a power function. The paper gives the specific forms of these relations.
Bulk modulus is one of the key mechanical parameters of rock. It is of great significance to study this mechanical parameter to reduce the risk of drilling, rock mining and reservoir development. Most of the studies on rock elastic parameters adopt Gassmann equation or Biot theory. For example, Hou et al. (Hou et al., 2019) proposed a new physical model for calculating the dry rock bulk modulus. Some scholars determined the bulk modulus by LRM linear fitting method (Liu et al., 2019a). Huang et al. (Huang et al., 2018) proposed a method to obtain a high-precision bulk modulus. Tang et al. (Tang et al., 2020) used the second and third-order resonance mode measurements of the DARS system to estimate the bulk modulus. These research results lay a theoretical foundation for accurately obtaining the bulk modulus. In the process of geological exploration and oil-gas field development, scholars have studied the bulk modulus from the aspects of formation pressure, confining pressure, ground stress, and temperature. In terms of formation pressure, Chen et al. (Chao et al., 2022) derived and established a direct inversion method of bulk modulus, which realized the quantitative prediction of shale formation bulk modulus. Yin et al. (Yin et al., 2014) measured the full-field strain fields and time-to-fracture of the marble under static-dynamic coupling load. Based on the laboratory ultrasonic measurement results, the influence of pressure difference on static and dynamic bulk modulus was analyzed (Yan et al., 2020). Yin et al. (Yin et al., 2020) investigated the dynamic compressive behaviour of gas-containing coals with gas pressure and static axial preloading using a modified Split Hopkinson Pressure Bar (SHPB) system. In terms of confining pressure, Che et al. (Che et al., 2022) deduced the bulk modulus under different confining pressure based on the mechanism of the Gassmann model. In terms of stress, Wang et al. (Wang et al., 2021) found that there is a correlation between bulk modulus and stress, and the bulk modulus is often greater than 40 GPa in the high stress section with rock burst. Qiao et al. (Qiao et al., 2018) proposed a non-linear hyperbolic model between average stress and bulk modulus through triaxial compression test. Rajaoalison et al. (Rajaoalison et al., 2020) obtained the law of the bulk modulus and stress by ultrasonic non-destructive method under different stress conditions. In terms of temperature, Xiong et al. (Xiong et al., 2019) obtained that with the increase in temperature, the bulk modulus of shale decreased. Zou et al. (Guang et al., 2022) analyzed the influence of temperature on the bulk modulus. Yu et al. (Yu et al., 2022) conducted dynamic compression tests with four different impact rates on granite samples. In the process of underground space excavation, accurate estimation of the mechanical properties of rock is conducive to the stability analysis of underground engineering. The above studies have discussed the factors affecting bulk modulus in underground engineering, but the mathematical relationship between them has not been established.
There are defects such as joints, pores, and fissures in the rock, and the influence of porosity on the bulk modulus has attracted the attention of scholars. For example, Liu et al. (Liu et al., 2019b) concluded that the bulk modulus has a high correlation with porosity. Akbar et al. (Akbar et al., 2019) established the relationship between bulk modulus and pore geometry and structure. Khoshnevis-Zadeh et al. (Khoshnevis-Zadeh et al., 2019) obtained the law that there is the highest correlation between bulk modulus and porosity. Rock is a heterogeneous material, and the joint roughness can affects the bulk modulus. The above scholars have studied the influence of rock internal crack defects on the bulk modulus but did not consider the influence of joint roughness on bulk modulus and did not establish the relationship between joint roughness and bulk modulus.
The size effect has always been the focus of rock mechanics. Scholars have made some achievements in the size effect of bulk modulus. For example, Li (Li et al., 2021) based on the normalized results and obtained the law of the bulk modulus and diameter ratio of Berea sandstone. Abedi Reza et al. (Reza et al., 2022) studied the influence of statistical volume element size on inhomogeneity of apparent properties. Some scholars have further studied the size effect of rock mechanics parameters (Gao et al., 2018; Zhong et al., 2021; Zhang et al., 2021) obtained the REV of fractured rock mass. Hu et al. (Hu and Ma, 2021) established the size effect relationship between uniaxial compressive and parallel joint spacing. The above scholars studied the size effect of bulk modulus from different aspects and confirmed that the size effect of bulk modulus does exist. In summary, the bulk modulus with rough joints is size-dependent, and there is little research on this field. Therefore, it is particularly important in engineering to deeply analyze the law of bulk modulus changing with size and obtain the relationship between them.
Therefore, this paper explores the influence of joint roughness and rock size on rock bulk modulus. The relationship between bulk modulus and rock size, joint roughness are acquired. The relationships between the characteristic size of bulk modulus, characteristic bulk modulus and joint roughness are described.
The numerical simulations are carried out in two aspects. 1) Effect of rock size on bulk modulus, which rock sizes are set to 100, 200, 300, 400, and 500 mm, and the corresponding simulation plans are 1–5. 2) The effect of joint roughness on the bulk modulus, which the roughness values are set to 1.6, 2.6, 3.6, 4.6, and 5.6, and the corresponding simulation plans are 6–10. A total of 10 simulation plans were set up, and 25 numerical models were established in this simulation, as shown in Table 1. The rock mechanical parameters, boundary conditions, and loading conditions in these numerical simulations refer to section 2.2 in reference (Hu et al., 2021).

TABLE 1. Simulation plans.
In the paper, the elastic modulus of rock was 8,000 MPa, the compressive strength was 60 MPa, and the cohesion was 1.2 MPa; the elastic modulus of joint was .01 MPa, the compressive strength was .01 MPa, and the friction angle was 10° (Hu et al., 2021). The RFPA software was used in the study, and the numerical model was shown in Figure 1. The displacement loading method is adopted with the displacement of the upper and lower surfaces of .01 mm and the displacement of both sides of 0 mm (Hu et al., 2021).
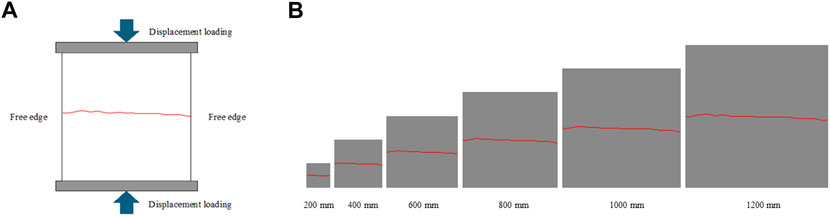
FIGURE 1. The loading and numerical models. (A) Loading method, (B) numerical models.
The stress-strain curves of rock failure under different sizes in research content 1) were shown in Figure 2, and Figures 2A–E represent different roughness. The stress-strain curves of rock failure under different joint roughness in research content 2) were shown in Figure 3, and Figures 3A–E represent different rock sizes.
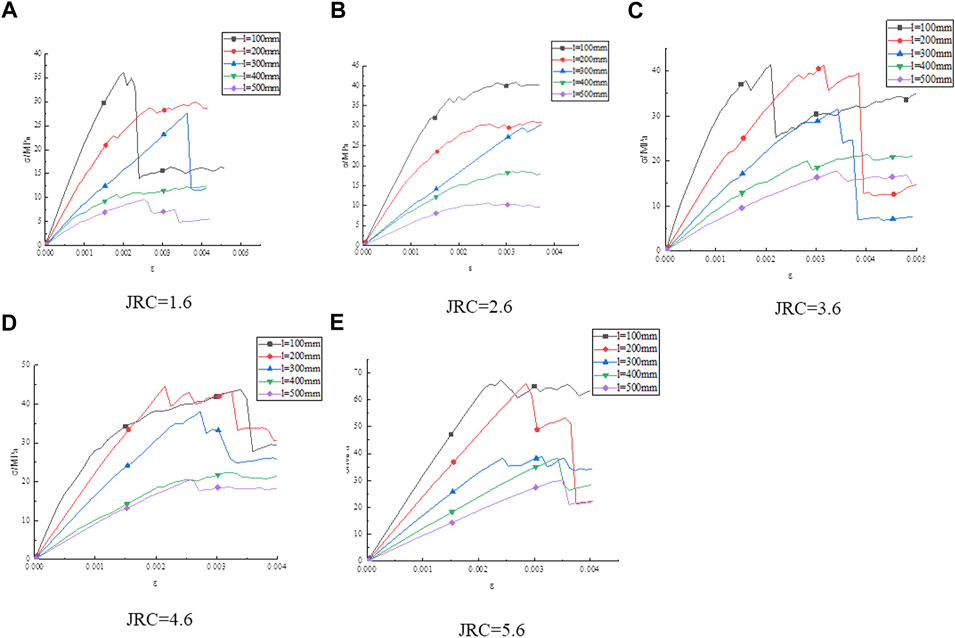
FIGURE 2. Stress-strain curves under different joint roughness coefficient.
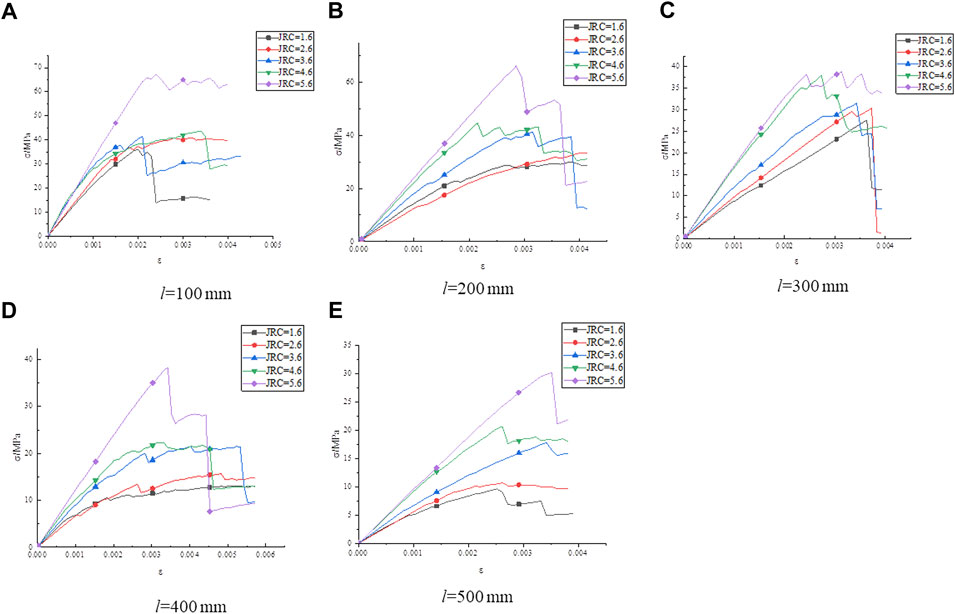
FIGURE 3. Stress strain curves of different size.
Figures 2, 3 show that the stress-strain curves have a long compaction stage, which are due to the compaction deformation caused by the closure of fracture defects in rock. The axial stress of rock increases linearly with the increase of strain and enters the stage of linear elastic deformation. This stage is elastic deformation, and the slope of the stress-strain curve corresponding to this stage can be used to characterize the elastic modulus. When the axial stress increases to a certain value, the stress-strain curve begins to show a jagged shape. At this time, many new cracks were generated inside the rock, and the deformation increased and entered the unstable deformation stage. The ratio of 50% of the peak strength of rock to its strain at this stage can be used to characterize the secant modulus. When the axial stress increases to exceed the ultimate stress of the rock, the stress-strain curve has a sharp decline stage, and brittle failure occurs.
Whether it is based on the elastic deformation stage in the stress-strain curve to obtain the elastic modulus or the elastic deformation and inelastic deformation stage to obtain the secant modulus, it is an expression of the rock deformation characteristics. The slope of the elastic stage of the stress-strain curve in Figures 2, 3 show that the elastic modulus are affected by size and joint roughness.
According to Figure 2, the peak strength varies with size. When joint roughness is constant, the peak strength is negatively correlated with the rock size. Taking Figure 2E as an example, when the rock size increases, the longitudinal distance of the stress-strain curve of rock is larger and has certain discreteness. From the variation of the peak strength of rock with joint roughness in Figure 3, under the same rock size, the peak strength of rock increases with the increase of joint roughness.
When the rock conducts uniaxial compression test, the axial and radial deformation have a certain deformation extent, and the volume also changes. The calculation of bulk modulus is related to Poisson’s ratio and the elastic modulus. The formula is as follows:
Where E is the elastic modulus, unit: GPa; ν is the Poisson’s ratio.
To study the influence of rock size on bulk modulus. Firstly, according to Figure 2, the elastic modulus E (the slope of the linear elastic on the stress-strain curve) are solved, as shown in Table 2. Secondly, the value of Poisson’s ratio ν are obtained by selecting the ratio of transverse strain and longitudinal strain within the elastic range on the stress-strain curves, as shown in Table 3. Finally, the bulk modulus K are solved according to Eq. 1, as shown in Table 4.
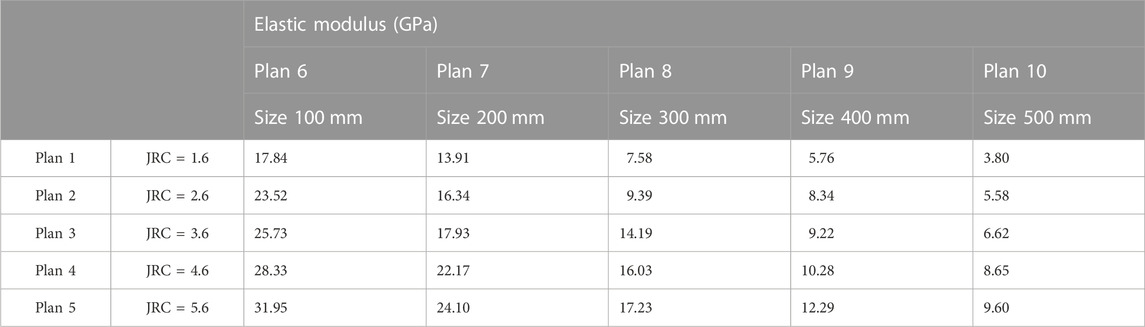
TABLE 2. Elastic modulus.
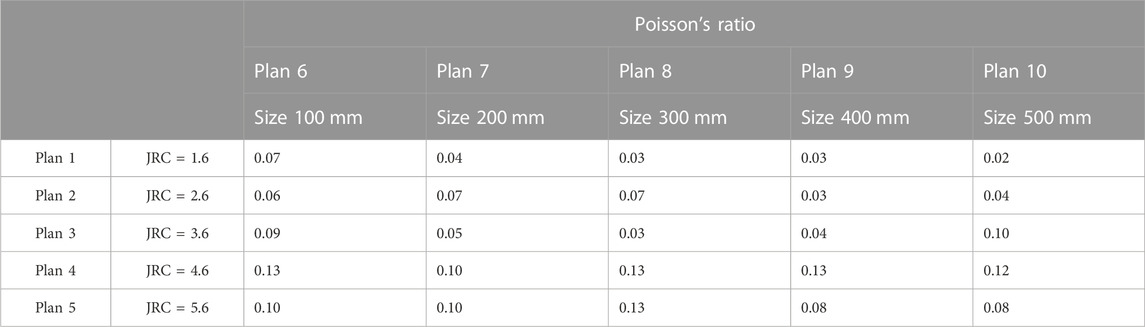
TABLE 3. Poisson’s ratio.
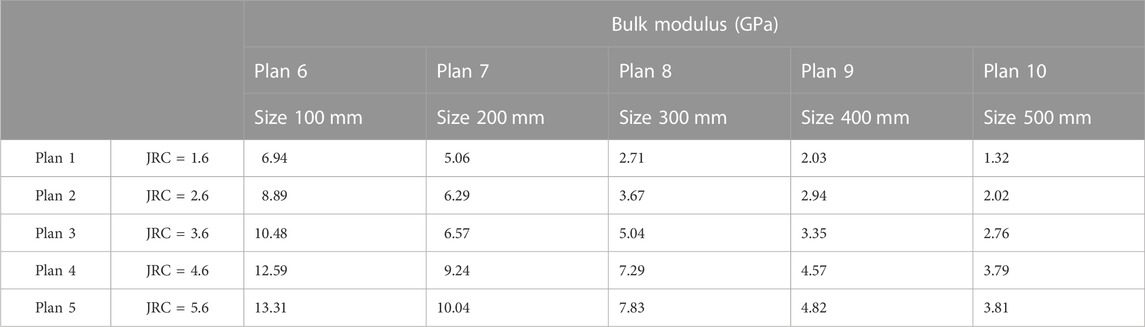
TABLE 4. Bulk modulus.
Table 2 shows that when the rock size and joint roughness changes, the elastic modulus will be affectted. When the size increases, the elastic modulus decreases, they are negatively correlated. When the joint roughness increases, the elastic modulus increases, they are positively correlated. Table 4 shows that rock size will affect the bulk modulus. According to Table 4, the scatter plots of bulk modulus and rock size were drawn, and the corresponding curves were fitted, as shown in Figure 4.
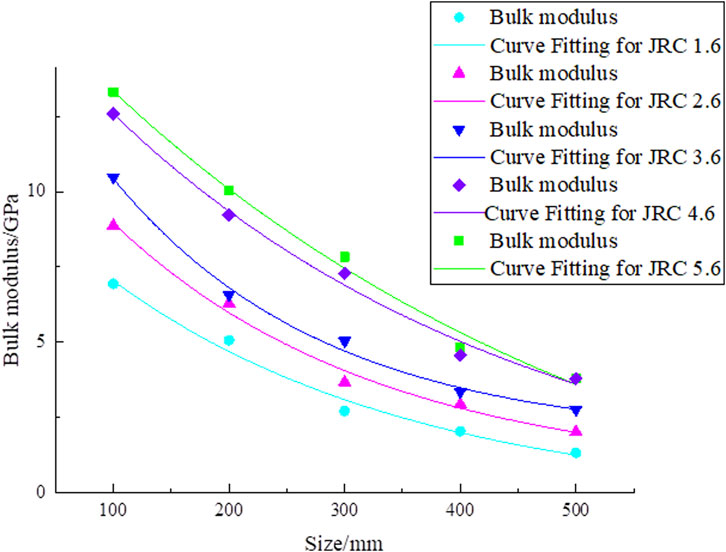
FIGURE 4. Fitting curves of rock size and bulk modulus.
Combined with Figure 4 and Table 4, the curve of the joint roughness of 3.6 were analyzed. When the rock size is 100 mm, the bulk modulus is 7.02 GPa. When the rock size increases to 500 mm, the bulk modulus decreases to 2.01 GPa, and the bulk modulus decreases by 71%. This indicates that rock size is negatively correlated with bulk modulus. With the increase in rock size, the change range of bulk modulus is smaller, and the curve tends to be stable, showing an exponential decay trend.
The regression curve formula are listed in Table 5, which can better illustrate this relationship. The coefficients of determination are all greater than .9, which prove that the fitting relationships are reasonable.
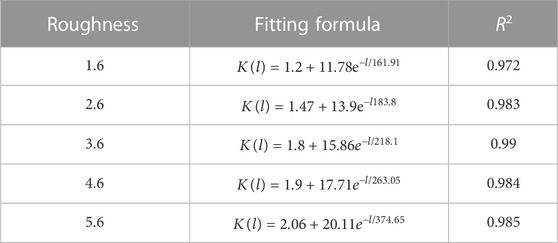
TABLE 5. Fitting Equations of bulk modulus and rock sizes.
Table 5 shows that the rock size and bulk modulus conform to the exponential function relationship, and their relationship is proposed as:
where K(l) is the bulk modulus, unit: GPa; l is the rock size, unit: mm; a, b, and c are parameters.
The parameters a, b and c in Table 5 are summarized in Table 6, and then the relationships between parameters and joint roughness are fitted, as shown in Figure 5.
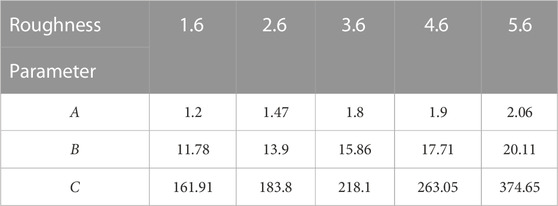
TABLE 6. Values of parameters a、b、c.
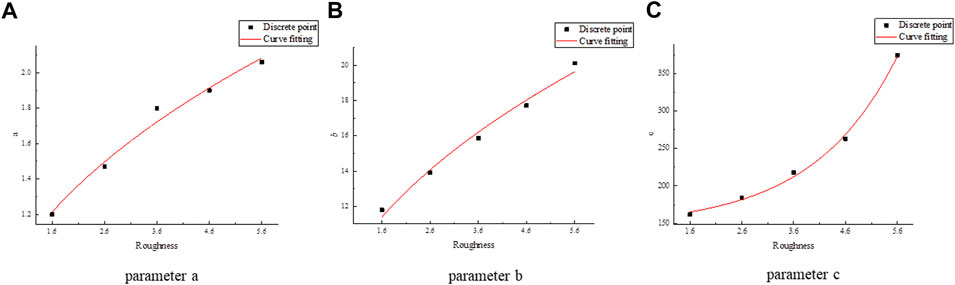
FIGURE 5. Fitting curve of parameters and joint roughness coefficient.
According to Figure 5, the relationships between parameters and joint roughness are sorted out, as follows:
The relationships between parameters and joint roughness are sorted out, and the special relationship between bulk modulus and rock size is obtained:
Eq. 6 proposes the mathematical relationship between bulk modulus and rock size, and quantitatively analyzes the size effect of joint roughness on bulk modulus. When the joint roughness is determined, the corresponding bulk modulus under any rock size can be obtained, which is beneficial to be applied in engineering practice.
According to the stress-strain curves in Figure 3, the bulk modulus were counted in Table 7.
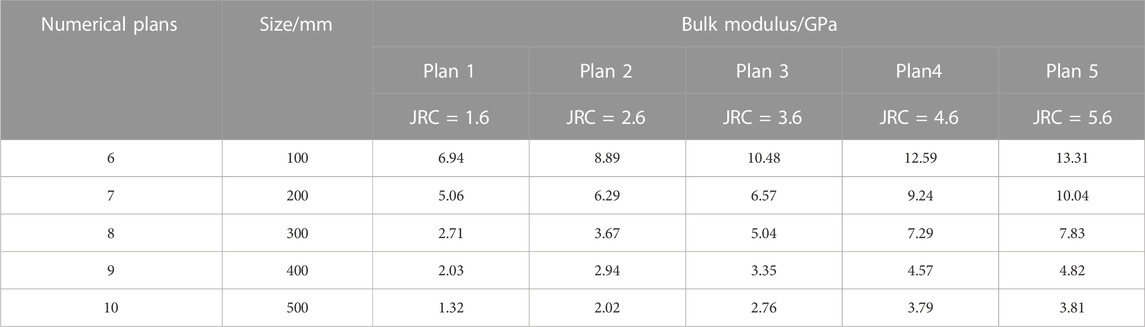
TABLE 7. Bulk modulus.
Table 7 shows that the joint roughness affects the bulk modulus. The scatter plots of bulk modulus and joint roughness are drawn by Table 7, and the corresponding curves are fitted, as shown in Figure 6.
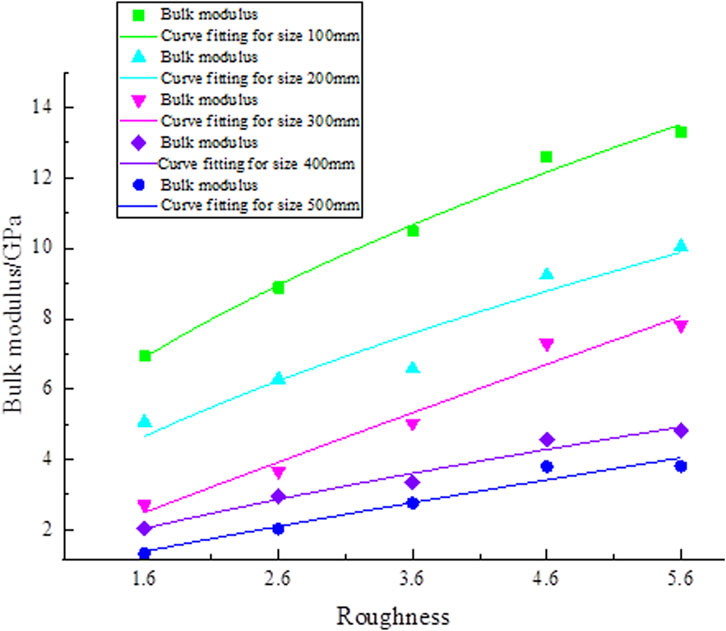
FIGURE 6. Fitting curves of bulk modulus and roughness.
Combined with Table 7 and Figure 6, the effect of joint roughness on the bulk modulus is analyzed. When the rock size is 500 mm, and the joint roughness is 1.6, the bulk modulus is 5.45 GPa. When the joint roughness increased to 5.6, the bulk modulus increased to 9.41 GPa. This shows that the bulk modulus shows an increasing trend with the increase in joint roughness, and there are positively correlated. As the rock size increases, the bulk modulus changes more, and the fitting curves show an increasing trend. The formula of the regression curves is listed in Table 8.
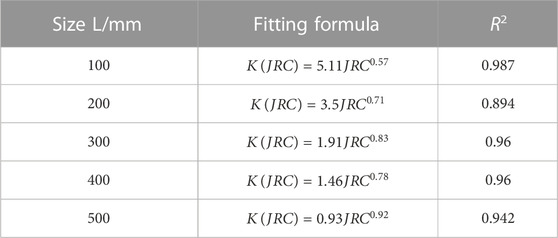
TABLE 8. Fitting relationship.
Table 8 shows that the bulk modulus and joint roughness conform to the Power function relationship, and their relationship is proposed as:
where K (JRC) is the bulk modulus, unit: GPa; JRC is the joint roughness, d and f are parameters.
The parameters d and f in Table 8 are summarized in Table 9, and then the relationships between parameters and rock size are fitted, as shown in Figure 7.
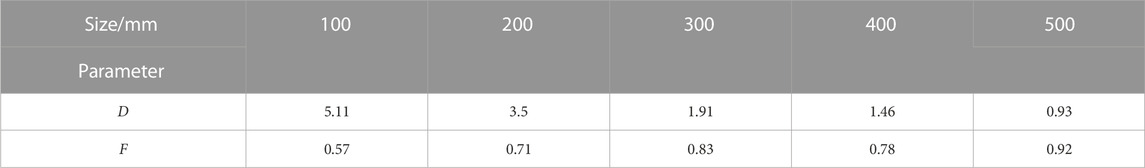
TABLE 9. Values of parameters d and f.
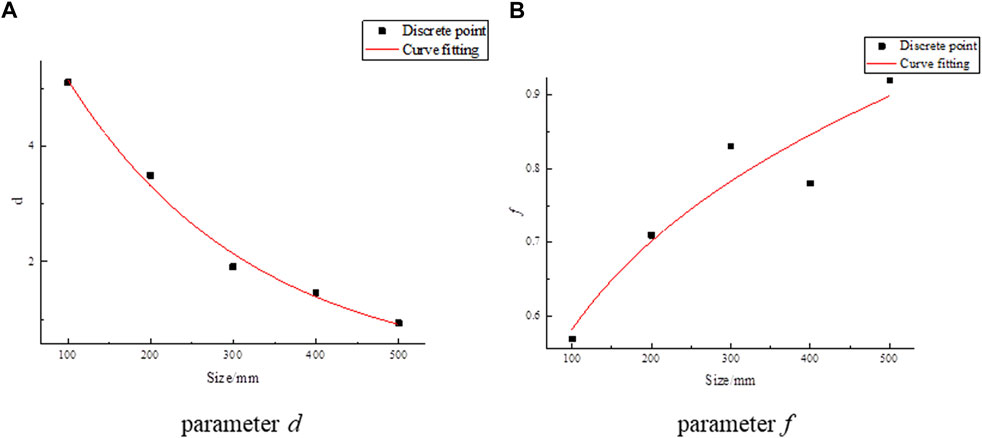
FIGURE 7. Fitting curve of parameters and rock size.
According to Figure 7, the relationship between d, f and rock size are obtained, as follows:
Where d, f are parameters, l is the rock size, unit: mm.
The relationships between parameters and joint roughness are sorted out, and the special relationship between bulk modulus and joint roughness is obtained:
Eq. 10 quantitatively describes the relationship between bulk modulus and joint roughness. When the rock size is determined, the corresponding bulk modulus under any kind of joint roughness can be obtained. It provides certain theoretical support for the evaluation of rock engineering safety and stability.
The size effect refers to the phenomenon that the mechanical parameters represented by strength decrease regularly with the increase of rock size. Scholars generally calls REV, that is, the mechanical parameters of the rock gradually tend to be stable as the rock size increases to a certain value, and it does not change significantly. In-depth study of the influence of REV provides guidances for setting rock mechanics parameters in rock engineering. The characteristic size of bulk modulus (CSBM) can be used to characterize the size effect of bulk modulus. The method of quantitative calculation of bulk modulus characteristic size and joint roughness in Reference (Liang et al., 2013). The formula is as follows:
Where r is the absolute value of the acceptable slope.
The CSBM when the joint roughness are 1.6, 2.6, 3.6, 4.6 and 5.6 were calculated. The results were summarized in Table 10. The data were fitted and the fitting curve of the CSBM and the joint roughness was drawn, as shown in Figure 8.
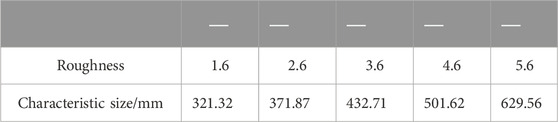
TABLE 10. Characteristic size of bulk modulus.
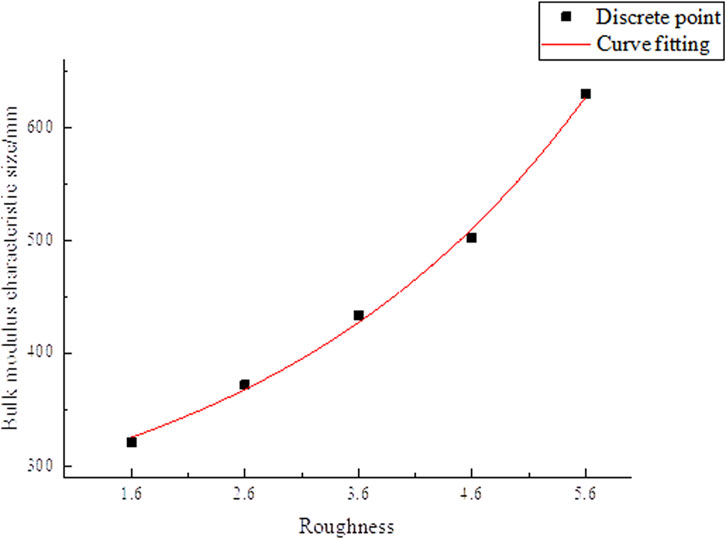
FIGURE 8. Fitting curve between the CSBM and JRC.
Figure 8 shows that the CSBM increases with the increase of joint roughness. The fitting relationship is an exponential relationship. Therefore, the following special relation is obtained:
Where L is the CSBM, unit: mm; JRC is the joint roughness.
The method of calculating the characteristic bulk modulus (CBM) is to substitute the value of the CSBM in Table 10 into Eq. 6, and the CBM with different characteristic sizes can be obtained. The calculation results were listed in Table 11. The obtained results were fitted, and the curve of the CBM and joint roughness were drawn, as shown in Figure 9.

TABLE 11. Characteristic bulk modulus.
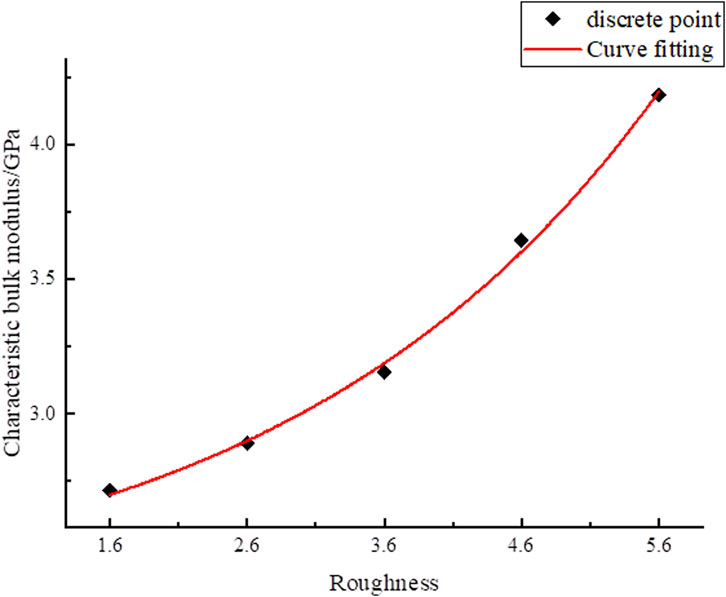
FIGURE 9. Fitting curve of CBM.
Figure 9 shows that the CBM increases with the decreases of joint roughness. The fitting relationship is a power function. Therefore, the following special relation is obtained:
where K (JRC) is the CBM, unit: GPa.
To verify the general applicability of Eq. 6, the algorithm of elastic modulus and Poisson’s ratio in Section 3.2 of Liu (Liu et al., 2018) is cited, as shown in Figure 10. The rock sizes selected in the laboratory test in Reference (Liu et al., 2018) are 80 mm, 90 mm, 100 mm and 110 mm, respectively. The height-diameter ratios are 1.0, 1.2, 1.4 and 1.6, respectively. The data in Table 1 of Section 4.1 in Reference (Liu et al., 2018) are combined and summarized in Table 12. Finally, the bulk modulus K of rock samples in Reference (Liu et al., 2018) is calculated according to the algorithm in Section 3.2 of this paper, as shown in Table 12.
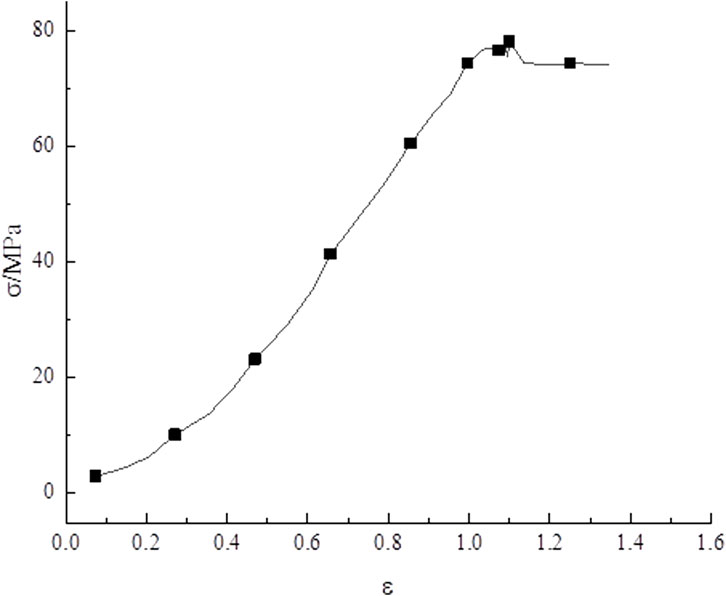
FIGURE 10. Elastic modulus and Poisson’s ratio.
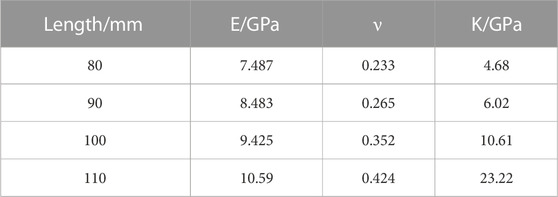
TABLE 12. Parameter values of rocks.
From the data in Table 12, a scatter plot of the bulk modulus and length to diameter ratio was drawn, and their fitted curves were drawn, as shown in Figure 11.
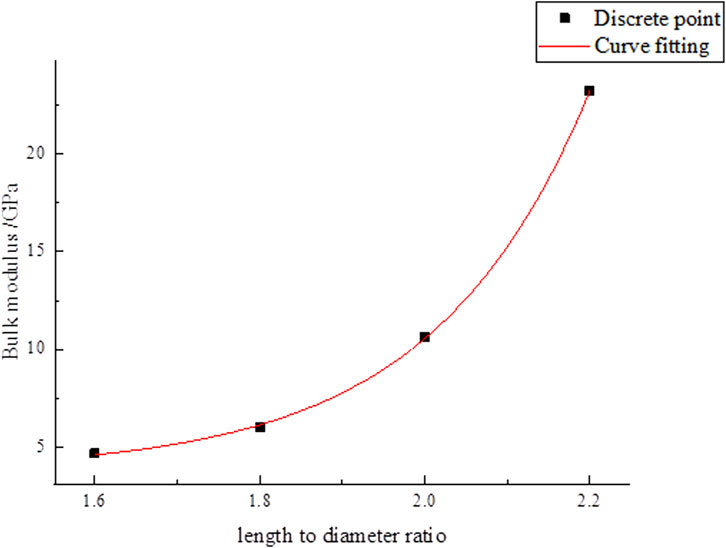
FIGURE 11. Fitting curves of bulk modulus and length to diameter ratio.
The relationship between the bulk modulus and length to diameter ratio is obtained in Figure 11 as follows:
where K (LDR) is the bulk modulus of the rock, unit: GPa; LDR is length to diameter ratio.
The functional type of Eq. 16 conforms to the mathematical model proposed in Eq. Eq. 6. Therefore, the numerical simulations are consistent with the experimental conclusion. The verification shows that the mathematical model proposed in Eq. 6 is reasonable for solving the corresponding bulk modulus under different rock size.
This chapter establishes the following four relationships based on the effect of joint roughness and rock size on bulk modulus: 1) bulk modulus and rock size; 2) bulk modulus and joint roughness; 3) CSBM and joint roughness; 4) CBM and joint roughness.
1) Relationship between the bulk modulus and rock size
Rock size affects the bulk modulus. The changes of bulk modulus after different rock sizes are analyzed, and a general formula of the relationship between bulk modulus and rock size is put forward. Then, the solution method of parameters in the general formula is given by combining the changes of joint roughness. Then the solution of the parameters in the general formula is combined with the change of joint roughness.
In the existing research, there are few studies on the influence of bulk modulus and rock size, mainly discussing the influence of aspect ratio on bulk modulus (Li et al., 2021). Reference (Li et al., 2021) obtained that the bulk modulus increases with the increase of aspect ratio. However, the relationship between bulk modulus and rock size is not established in the literature, and the influence of roughness change is rarely considered in the size effect of bulk modulus.
2)Relationship between bulk modulus and joint roughness
The joint roughness affects the bulk modulus. The changes of bulk modulus with different joint roughness are analyzed, and a general formula of the relationship between bulk modulus and joint roughness is proposed. Then, the solution method of parameters in the general formula is given by combining the changes of rock size.
In view of the influence of internal defects on the bulk modulus, scholars have mainly studied porosity (Akbar et al., 2019) and cracks (Yan et al., 2020). For example, Reference (Yan et al., 2020) established a relationship between porosity and bulk modulus. Reference (Akbar et al., 2019) studied the relationship between bulk modulus and cracks. However, the above literature has not studied the influence of joint roughness on bulk modulus and has not established the relationship between bulk modulus and joint roughness. Scholars rarely consider the influence of size effect of rough jointed rock.
At the same time, this paper also carried out a verification study based on the results of the laboratory test in literature (Liu et al., 2018). The accuracy of the formula derivation and the applicability of the formula in this paper are proved, and a solid verification foundation is provided for the popularization and application of the subsequent formula.
3) The relationship between CSBM, CBM and joint roughness
The relationships between the CSBM, CBM and joint roughness are carried out based on Eq. 1. In the existing research, few scholars have carried out in-depth study of these two relationships. The establishment of these four relationships in this study reveals the size effect law of bulk modulus of rough jointed rock, which provides a reference for the application of geological exploration, oilfield development and drilling, and has important engineering application value.
The joint roughness has influence on the size effect of the bulk modulus, which is rarely explored. In this paper, the following conclusions are obtained by numerical simulations:
1) The relationship between the bulk modulus and size of the rock with rough joints is
By solving the parameters, a, b and c, the specific formula is
2) The relationship between bulk modulus and joint roughness is
By solving the parameters d and f, the specific formula is
3) The CSBM is related to joint roughness. The following specific forms are given based on the simulation:
4) The CBM of rock is related to joint roughness. The following specific forms are given based on the simulation:
The original contributions presented in the study are included in the article/supplementary material, further inquiries can be directed to the corresponding author.
WL: Data curation, Investigation, Writing and original draft preparation. YL: Methodology, Software, Data curation. JW: Data curation, Investigation. GH: Conceptualization, Software, Funding acquisition, Writing and original draft preparation. WF: Methodology, Data curation. LS: Data curation, Investigation.
This work was supported by the Project: Yantai Blue Ocean Mine Engineering Design Co., Ltd. entrusted project (K22-01430000-011), Shenyang Research Institute of China Coal Technology and Engineering Group entrusted project (K22-01430000-002), Zhejiang Collaborative Innovation Center for Prevention and Control of Mountain Geological Hazards (PCMGH-2017-Y-05), Key Laboratory of Rock Mechanics and Geohazards of Zhejiang Province (ZGRMG-2019-07).
Author JW was employed by Shangdong Gold Design Consulting Co., Ltd.
The remaining authors declare that the research was conducted in the absence of any commercial or financial relationships that could be construed as a potential conflict of interest.
All claims expressed in this article are solely those of the authors and do not necessarily represent those of their affiliated organizations, or those of the publisher, the editors and the reviewers. Any product that may be evaluated in this article, or claim that may be made by its manufacturer, is not guaranteed or endorsed by the publisher.
Akbar, M., Salam, A., Awab, M., and Prakoso, S. (2019). “Interrelationships of rock elastics properties to petrophysical pore structure and geometric details of sandstone[C],” in SPE/IATMI Asia Pacific Oil & Gas Conference and Exhibition, Bali, Indonesia, 29 – 31 October 2019, 1–12.
Chao, C., Yin, X., Chen, Z., Liu, X., and Xie, J. (2022). Formation pressure coefficient prediction method based on rock physics equivalent model of shale [J]. Pet. Geophys. Explor. 57 (02), 367–376. + 394 + 245. doi:10.13810/j.cnki.issn.1000-7210.2022.02.013
Che, Y., Zou, G., Yin, C., Zeng, H., and She, J. (2022). Pore characteristics and pore volume modulus evolution law of overpressure coal-bearing strata in Yuwang mine field [J]. J. Min. Sci. 7, 275–285. doi:10.19606/j.cnki.jmst.2022.03.002
Gao, C., Zhong, Z., Yunjin, H. U., and Ruyi, B. (2018). Numerical simulation on size effect of single rock fracture permeability[J]. Water Resour. Hydropower Eng. 49 (12), 148–153. doi:10.13928/j.cnki.wrahe.2018.12.020
Guang, Z., Hu, Z., Fei, G., Caiyun, Y., Shengqi, L., Peng, S., et al. (2022). Effects of temperature and water saturation on the elastic moduli of sandstone and mudstone from the lufeng geothermal field: Experimental results and theoretical model. Geophys. J. Int. 230 (2), 1147–1165. doi:10.1093/GJI/GGAC120
Hou, B., Kang, H., and Cheng, T. (2019). Integrated diagenesis and pore shape rock physics model and its application [J]. Geophys. Geochem. Explor. 43 (01), 161–167. doi:10.11720/wtyht.2019.1192
Hu, G., Li, Y., and Ma, G. (2021). Research on the size effect of roughness on rock uniaxial compressive strength and characteristic strength. Sci. Eng. Compos. Mater. 28 (1), 613–627. doi:10.1515/SECM-2021-0058
Hu, G., and Ma, G. (2021). Size effect of parallel-joint spacing on uniaxial compressive strength of rock. Plos One 16 (9), e0257245. doi:10.1371/JOURNAL.PONE.0257245
Huang, S., Zou, W., He, G., Yangxiao, L., Tang, H., Zhang, D., et al. (2018). Method for obtaining bulk modulus of rock matrix: China, 10509331.B [ P].2018-07-10.
Khoshnevis-Zadeh, R., Soleimani, B., and Larki, E. (2019). Using drilling data to compare geomechanical parameters with porosity (a case study, South Pars gas field, south of Iran). Arabian J. Geosciences 12 (20), 611–710. doi:10.1007/s12517-019-4809-y
Li, H., Song, K., Tang, M., Qin, M., Liu, Z., Qu, M., et al. (2021). Determination of scale effects on mechanical properties of Berea sandstone. Geofluids 2021 (32), 1–12. doi:10.1155/2021/6637371
Liang, Z. Z., Zhang, Y. B., Tang, S. B., Li, L. C., and Tang, C. N. (2013). Size effect of rock messes and associated representative element properties[J]. Chin. J. Rock Mech. Eng. 32 (06), 1157–1166. doi:10.3969/j.issn.1000-6915.2013.06.009
Liu, G., Xiao, F., and Qin, T. (2018). Roc mechanics characteristics and acoustic emission rule under small-size effect [J]. Chin. J. Rock Mech. Eng. 37 (2), 3905–3917. doi:10.13722/j.cnki.jrme.2018.0640
Liu, J., Zhang, Y., Wang, X., Zeng, S., and Zhang, W. (2019a). Reservoir fluid mobility extraction based on the deconvolution generalized S-transform [J]. Oil Geophys. Explor. 54 (03), 617–623. doi:10.13810/j.cnki.issn.1000-7210.2019.03.015
Liu, J., Liu, J., Cao, J., Wen, X., Xu, L., Chen, R., et al. (2019b). Characteristics of reservoir and pore fluid sensitive parameters based on rock physics experiments: A case study of middle-deep clastic reservoirs in the eastern pearl river mouth basin [J]. Acta Pet. sin. 40 (1), 197–205. doi:10.7623/syxb2019S1017
Qiao, L., Zhang, Y., Yuan, L. I., and Shuangshuang, F. (2018). A non-linear elastic model and high-level biaxial loading and unloading test for CSIRO in-situ stress measurement in deep granite[J]. Chin. J. Rock Mech. Eng. 201938 (01), 40–48. doi:10.13722/j.cnki.jrme.2018.0735
Rajaoalison, H., Zlotkowski, A., and Rambolamanana, G. (2020). Mechanical properties of sandstone using non-destructive method. J. Min. Inst. 241, 113. doi:10.31897/pmi.2020.1.113
Reza, A., Justin, G., Yang, M., Katherine, A., and Soheil, S. (2022). Effect of boundary condition and statistical volume element size on inhomogeneity and anisotropy of apparent properties. Mech. Mater. 173, 104408–104421. doi:10.1016/J.MECHMAT.2022.104408
Tang, C., Dong, C., Wang, S., Zeng, X., and Ren, B. (2020). Dispersion measurement of elastic modulus based on multi-order resonance mode of a differential resonance acoustic spectrometer [J]. Petroleum Sci. Bull. 5 (04), 483–495. doi:10.13810/j.cnki.issn.1000-7210.2022.02.013
Wang, K., Mou, Y., and Xing, L. (2021). Study on correlation between rockburst and elastic parameters of TSP method[J]. Chin. J. Eng. Geophys. 18 (06), 867–872. doi:10.3969/j.issn.1672-7940.2021.06.008
Xiong, J., Huang, L., Liu, X., Zhou, W., and Liang, L. (2019). An experimental study on the effect of high temperature on the acoustic properties of the shale [J]. J. Southwest Petroleum Univ. Nat. Sci. Ed. 41 (6), 35–43. doi:10.11885/j.issn.1674-5086.2019.08.29.02
Yan, F., Han, D. H., and Chen, X. L. (2020). Simultaneous static and dynamic bulk modulus measurements under hydrostatic stress conditions and without applying strain gauge. Geophysics 85 (4), MR191–MR199. doi:10.1190/geo2019-0390.1
Yin, Z., Chen, W., Hong, H., Chang, J., Zhao, G., Chen, Z., et al. (2020). Dynamic compressive test of gas-containing coal using a modified Split Hopkinson pressure bar system. Rock Mech. Rock Eng. 53 (2), 815–829. doi:10.1007/s00603-019-01955-w
Yin, Z. Q., Ma, H. F., Hu, Z. X., and Zou, Y. (2014). Effect of static-dynamic coupling loading on fracture toughness and failure characteristics in marble. J. Eng. Sci. Technol. Rev. 7 (2), 169–174. doi:10.25103/jestr.072.25
Yu, L., Wu, D., Zhang, T., Su, H., Liu, R., and Wu, L. (2022). Study on strain rate effect of dynamic compression mechanical properties of high-temperature granite after cooling with water[J]. Chin. J. Rock Mech. Eng. 41 (1), 2615–2625. doi:10.13722/j.cnki.jrme.2021.0316
Zhang, J., Liu, R., Yu, L., and Liu, D. (2021). Impact of fracture length distribution on seepage characteristics of fractured rock masses. IOP Conf. Ser. Earth Environ. Sci. 861 (4), 042103. doi:10.1088/1755-1315/861/4/042103
Keywords: roughness, bulk modulus, size effect, mathematical model, characteristic bulk modulus
Citation: Liang W, Li Y, Wang J, Hu G, Fu W and Sun L (2023) Simulation study on the size effect of joint roughness on bulk modulus. Front. Mater. 9:1095897. doi: 10.3389/fmats.2022.1095897
Received: 11 November 2022; Accepted: 21 December 2022;
Published: 10 January 2023.
Edited by:
Jialai Wang, University of Alabama, United StatesReviewed by:
Zhiqiang Yin, Anhui University of Science and Technology, ChinaCopyright © 2023 Liang, Li, Wang, Hu, Fu and Sun. This is an open-access article distributed under the terms of the Creative Commons Attribution License (CC BY). The use, distribution or reproduction in other forums is permitted, provided the original author(s) and the copyright owner(s) are credited and that the original publication in this journal is cited, in accordance with accepted academic practice. No use, distribution or reproduction is permitted which does not comply with these terms.
*Correspondence: Gaojian Hu, aHVnYW9qaWFuOEAxNjMuY29t
Disclaimer: All claims expressed in this article are solely those of the authors and do not necessarily represent those of their affiliated organizations, or those of the publisher, the editors and the reviewers. Any product that may be evaluated in this article or claim that may be made by its manufacturer is not guaranteed or endorsed by the publisher.
Research integrity at Frontiers
Learn more about the work of our research integrity team to safeguard the quality of each article we publish.