 Yingbo Zhou
 Genlin Sheng2
94% of researchers rate our articles as excellent or good
Learn more about the work of our research integrity team to safeguard the quality of each article we publish.
Find out more
ORIGINAL RESEARCH article
Front. Mater. , 11 November 2022
Sec. Structural Materials
Volume 9 - 2022 | https://doi.org/10.3389/fmats.2022.1075310
This article is part of the Research Topic Physico-Mechanical Properties and Treatment Technology of Hazardous Geomaterials View all 23 articles
The shear strength of the soil-rock mixture (S-RM) is the primary mechanical factor influencing the stability of the deposit slope. The particle size range inside the test sample, however, is not the same as that of the S-RM in the deposit slope due to the limitations of the test device, which results in a variation in the mechanical properties. In this study, computer simulation tests were conducted to examine the impact of particle size on mechanical behaviors under the uniaxial compressive condition, and the size effect was analyzed from both macroscopic and mesoscopic perspectives. Results indicate that when the particle size increases, the anisotropy levels of the S-RM sample also rise, causing the particle displacement difference inside the sample to increase and the rounding rock effect to become more pronounced. The quantitative relationship between the uniaxial compressive strength (UCS) and the maximum particle size (dmax) was proposed, and the accuracy of the prediction formula for the UCS value of S-RM that takes the size effect into account has been confirmed. The improvement of the shear strength determination method was achieved by unifying the particle size range corresponding to the uniaxial compressive and shear test results used in the approach, and the determination method was used to evaluate the stability of a typical deposit slope. The study results can be used as a guide for estimating strength parameters of S-RM throughout the design and construction process of the deposit slope.
Soil-rock mixture (S-RM), defined as the combination of the soil matrix with rock blocks of various sizes, presents a large distribution in southwestern China (Fu et al., 2021a; Ji et al., 2021; Zhou et al., 2022). The inclination to use S-RM, for example as the fill material for the high-fill deposit slope and rock-fill dam, is growing in the geotechnical engineering projects due to the expansion of the highway and building in the mountainous region of southwestern China (Zhang et al., 2021; Du et al., 2022; Fu et al., 2022). The natural S-RM can be divided into landslide deposit, collapse deposit, residual deposit, and other categories depending on how they formed (Xu et al., 2007; Yang et al., 2021). Each of these categories exhibits various particle grading distribution characteristics, particularly the particle sizes (Xu and Hu, 2009; Zhou et al., 2017; Bai et al., 2021). Long-term geological formations and rainfall in the southwestern region of China have resulted in the development of the shallow regions near the deposit slope with considerable weathering impacts, whereas a small range of the particle grading distribution between 40 and 60 mm under weathering effect is typical to be observed in the S-RM due to landslide and residual deposit. Determining the mechanical parameters of the geo-material and the slope stability assessment has been made more difficult by the complex mechanical behaviors of S-RM with different particle size characteristics, which has been a crucial problem to be solved urgently during design and construction of the deposit slope engineering.
It is generally considered that particle size affects the mechanical properties of geotechnical materials, which is called the size effect. As a typical multi-phase material, the threshold size of the “fine” and “coarse” grain material inside S-RM should be determined first using the particle grading distribution. The coarse-grained materials are consistently categorized as rock block components, whereas fine-grained materials are consistently categorized as soil components. The size effect of S-RM has mostly so far been analyzed in terms of how the rock block size affects the mechanical properties in previous researches. The strength of the individual rock block particle and the whole material are both impacted by the size of the rock block (Hong et al., 2020; Ovalle and Dano, 2020). The former changes the pressure range that the rock block can sustain and the likelihood of breaking, while the latter involves the propagation of cracks and the development and dispersion of microcracks (Li, 2013; Lin et al., 2019), speeding up the decomposition of the sample. The S-RM triaxial tests carried out by Zhao and Liu, 2018 demonstrated that the stress-strain curve of the sample with a greater rock size is more varied because of the interaction between the large rock blocks. According to Li et al. (2008), in the triaxial compressive condition, the S-RM sample with a higher dmax value exhibits a greater strength, friction angle, and initial tangent modulus. Wu et al. (2020) also suggested the same conclusion in light of the results of the rockfill material testing. Since the widespread use of computers, numerical simulation has been extensively used to investigate how particle size affects the mechanical properties of S-RM from a mesoscopic perspective. Ueda et al. (2011) and Ding et al. (2014) proposed that the bigger size of the rock block causes a greater level of heterogeneity and exacerbates the particle’s contribution to the structure and mechanical properties of S-RM. The deformation of S-RM exhibits the size effect as well in terms of crack distribution and shear zone features. Wolinski et al. (1987) reported that the S-RM sample with the smaller dmax value (2–4 mm) has a smoother fracture surface than the sample with the greater dmax value (8–32 mm). Peng et al. (2017) found that the distribution of the S-RM microcracks with lower particle sizes is more clustered and less uniform, and the formation of the microcracks is connected to the particle size. Lv et al. (2022) and Wang et al. (2022) discovered a strong correlation between the particle size and the shear bandwidth of the granular sample. The characterization quantities of the particle size in previous studies are various, such as the maximum particle size (dmax) (Ji et al., 2011; Chaulagai et al., 2017), average particle size (d50) (Giang et al., 2007), and the ratio of the maximum to minimum particle size (dmax/dmin) (Ding et al., 2014; Vahidi-Nia et al., 2020). However, there is still a need for discussion regarding the quantitative description of the size effect and the quantitative correlations between the mechanical parameters and the representative characterization quantity.
Previous studies have demonstrated the importance of examining the size influence on the mechanical behaviors of S-RM. The maximum allowable particle size of the sample is constrained by the size restrictions of laboratory test apparatus, which also changes with the apparatus size. For example, the maximum allowable particle size of the fixed-size test apparatus often not exceeding 10 mm in certain regular-size laboratory tests, such as the uniaxial compressive test, Brazilian splitting, and compaction tests. However, the maximum allowable particle size has been raised to 40–60 mm in using the large-scale triaxial test apparatus and direct shear test apparatus. Therefore, the mechanical behaviors demonstrated utilizing various test apparatus sizes represent the S-RM samples with the corresponding particle grading properties. It is more challenging to estimate the shear strength characteristics of S-RM using laboratory tests because of the size effect due to the laboratory tests even though the particle size of the S-RM sample is within the range of the allowable size of the test apparatus.
Numerical simulation methods are rapidly being used into the research of the mechanical properties of geotechnical materials as a result of the ongoing advancements in computer technology (Guo et al., 2019; Bai et al., 2022; Bai et al., 2019). The discrete element method based on discontinuous mechanics theory, in contrast to the numerical simulation method for continuous media, can simulate the material multiphase and non-homogeneity of S-RM, providing a tool for the discussion of the mechanical properties of S-RM at various sizes in this paper. However, the low computational efficiency and high computational cost presented by the discrete element calculation method make it more challenging to use in large-size practical engineering. Researchers have lately shown a growing interest in the empirical formula to determine the strength characteristics of the geotechnical material by using the findings of several mechanical and physical tests. On the one hand, the availability of empirical formulae to describe the mechanical characteristics of geotechnical materials is ensured by the fact that the majority of the empirical formulae are given based on the test results and an established constitutive model. On the other hand, the using empirical formulae can effectively lower the cost required for mechanical tests and eliminate errors in the findings brought on by the unpredictability of the tests. The mechanical parameters can be quickly estimated using the empirical formulae with a small number of physical and mechanical parameters. The theory of the coarse-grained soil is the main source of the typical empirical formulae used to characterize the mechanical properties of S-RM, and the pending parameters are determined from the results of large-scale tests. There are few descriptions of the mechanical parameter calculation method taking the multi-phase components and size effect of S-RM into consideration.
Based on the outcomes of numerical simulation, a method for determining the shear strength of the S-RM taking the size effect into account is presented in this study. The size effect on the uniaxial compressive strength (UCS) is discussed from the macroscopic and mesoscopic views using Particle Flow Code in two dimensions (PFC2D), and a quantitative relationship between the UCS value and dmax is proposed, taking into consideration that the ranges of the particle sizes of the required test data within the formula proposed for calculating the shear strength of S-RM are not uniform. The modified calculation of the UCS value taking the size effect into account is used when determining the shear strength parameters of the S-RM. The stability evaluation of a typical deposit slope uses the determination method as a last step, and thus serves as a reference for the estimating the strength parameters of S-RM.
The multi-phase compositions and structural characteristics of natural S-RM result in complicated and varied mechanical behaviors. The weak soil-rock interface develops as a result of the increase of the rock content, which also damages the integrity of the soil matrix. However, the stronger and more rigid rock blocks can also assist in enhancing the mechanical characteristics of the S-RM. The presence of the negative and positive effects of rock blocks on S-RM make it extremely difficult to calculate its strength parameters.
The relationship between the strength parameters and the rock content, particle size, water content, and other factors has been proposed by a number of researches. The results suggest that the rock content has a significant impact on how the mechanical behaviors of S-RM changes from being comparable to those of soil to being similar to those of broken rocks. Fu et al. (2021b) suggested a method to estimate the strength parameters of S-RM in order to characterize the cooperative influence of the multi-phase compositions on the mechanical properties of the entire material. The calculation for the prediction method is as follows.
where σc-SRM is the unconfined compressive strength of the soil-rock mixture, which is used to describe the strength of the contact surface; parameters Ts and n are material constants, which are related to the rock block proportion, and strength of fine-grained soil and rock blocks; parameter As is a nonlinear strength constant of the power-law criterion.
The uniaxial compressive strength of S-RM utilized in Eq. 1 is obtained based on the prediction formula proposed by Kalender et al. (2014) calculated as follows.
where σc is the UCS value of the soil matrix; VBP is volumetric rock block proportion, %; characteristic parameter A is a constraining variable, which represents the contact strength between the soil and rock blocks and can be determined based on the value diagram using σc and the internal friction angle or the roughness of the rock blocks.
Based on Fu et al. (2021b) and Kalender et al. (2014), the precision of the UCS and shear strength prediction methods has been confirmed. In Eq. 1, the UCS value of the soil matrix and the shape index of rock blocks are used to calculated the influence of the soil-rock interface on the shear strength. The impact of the content and mechanical properties of the soil matrix, rock blocks, and soil-rock interface on the mechanical characteristics of the entire material is thus shown in the shear strength estimation method of Eq. 1. With the multi-component and non-homogeneous characteristics fully considered, the estimation method of S-RM provides a theoretical basis for the following discussions.
According to the results proposed by Kalender et al. (2014), characteristic parameter A is chosen based on the results of previous uniaxial compressive experiments. The limitations of the regular-size uniaxial compressive test apparatus result in a constrained range of particle sizes inside the S-RM sample, which typically implies that the maximum particle size of the rock blocks is less than 10 mm. The S-RM sample under regular-size test circumstances is substantially smaller than the typical size of the rock blocks in the shallow region of the deposit slope, which can reach 40–60 mm. To guarantee that the particle size applicable to the prediction technique is fairly close to the real circumstances, it is vital to understand how particle size affects mechanical behavior under the uniaxial compressive condition.
The discussions above indicate that particle size of the S-RM sample is constrained by the size of the laboratory apparatus. In this study, the maximum particle size (dmax) of the regular-size uniaxial compressive sample is 10 mm, which is even lower than the value of natural S-RM, and the size effect is numerically simulated using the discrete element method in this study using PFC2D.
The process of the PFC2D simulation test is divided into three parts: model establishment, mesoscopic parameter calibration, and simulation process. For the mesoscopic parameter calibration, the S-RM particle model of the same size as the one used in the laboratory test was constructed. The shape of the rock blocks in the natural S-RM is angular-subangular; in contrast, the rock blocks in this study are shown in Figure 1 as having a round-elliptical shape. Therefore, it is allowed to imitate the rock block using a standard disk element. For the calibration sample, the particle diameter of rock is set as 2–10 mm, and the soil particle diameter is set as 1.6–2 mm. The S-RM particle model used in the calibration procedure is shown in Figures 2A,B.

FIGURE 1. Rock blocks inside the S-RM sample used in the laboratory test.
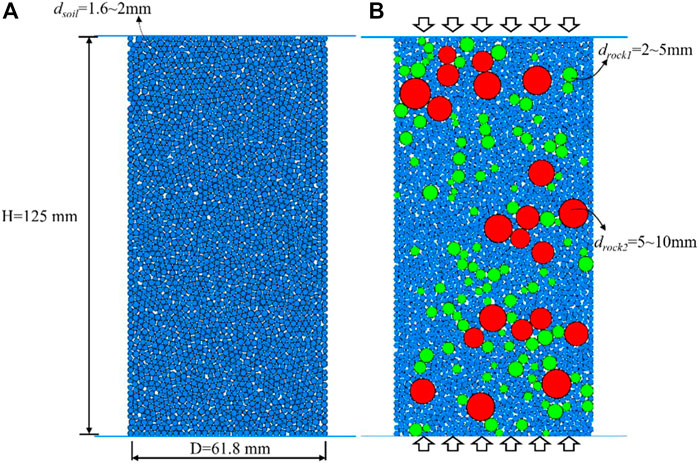
FIGURE 2. S-RM particle models for the calibration.
In PFC, the contact model is used to replace the constitutive model to represent the contact force and moment between the particles when an external force is present. An essential step of computer simulation test is the calibration of the precise mesoscopic parameters utilized in the contact models. Different from the continuous numerical calculation method, mesoscopic parameters are utilized to describe the mechanical properties and deformation characteristics. The mesoscopic parameter calibration procedure has thus so far been carried out utilizing several groups of the mesoscopic parameters to make the macro mechanical behaviors of the simulation, such as the UCS, strength parameters, and secant modulus, much closer to the test results. The uniaxial compressive test of S-RM in the regular size was carried out in this study as the reference for calibrating the mesoscopic parameters.
The S-RM sample was calibrated at 125 mm in height and 61.8 mm in width. The diameter range of the rock block was specified as 2–10 mm as shown in Figure 1 in accordance with the specification for the geotechnical test, and the dmax value of the S-RM sample should be less than 10 mm. In order to determine how the mechanical behaviors of S-RM are affected by the rock block, VBP was selected as the controlling factor. Several groups of S-RM uniaxial compressive tests were conducted with a VBP range of 0%–30%.
Figure 3 shows the curves of the axial stress and strain of the S-RM samples with various VBPs under the test and simulation conditions. The results demonstrate that simulated axial stress exhibits an increasing trend with axial strain identical to the test results, and the peak stress and stress drop are discovered throughout the simulation. As VBP increases, the simulated UCS value and secant modulus fall, which is line with the variation rule of the test findings. The calibrated mesoscopic parameters can be employed for the S-RM numerical test in this study, according on comparisons in the axial stress between the simulation and test results. The calibrated mesoscopic parameters are listed in Table 1.
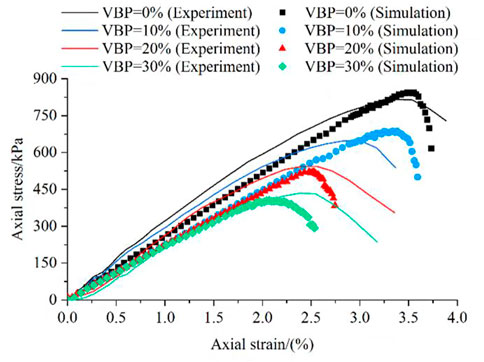
FIGURE 3. Axial stress versus strain curves of the test and simulation results.
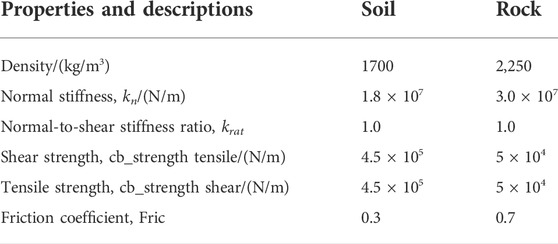
TABLE 1. Mesoscopic parameters of the soil and rock particles.
According to the earlier research, the appropriate D/dmax value (ratio of the sample diameter to dmax) must be used to avoid the negative effect due to the boundary effect on the simulation and test results. In order to choose an appropriate value range of D/dmax for the size effect simulation, the impact of the dmax value on the mechanical characteristics of S-RM is first explored.
Seven groups of S-RM samples were constructed at a height and width of 600 and 300 mm, with various dmax values. The results of the uniaxial compressive simulation tests show that when the dmax is larger than 25 mm, it appears that the variation of UCS value is more sensitive to particle size. The relative ratio of UCS, denoted by the symbol ασrat, is determined in order to better understand the variation law of the UCS under various particle size conditions. The calculation of the relative ratio of UCS is as follows.
where UCSdmax = 10mm and UCSdmax is the UCS value of the S-RM sample with a dmax value of 10 mm and the other value.
The lower value of ασrat indicates that the UCS value is substantially closer to that of the S-RM sample with dmax = 10mm, which means that the particle size effect and boundary effect area relatively less significant. The fluctuation of ασrat with various D/dmax values under different VBP conditions is obvious. In contrast to the wave trend of ασrat value in the sample with 60% and 90% VBP, the comparisons show that the ασrat exhibits a decreasing tendency when D/dmax increases from 5 to 8 by 15% and 10% with VBP = 20% and 40%. With the exception of the sample with VBP = 90%, the ασrat only fluctuates within a limit range of −2.5%–5% as D/dmax increases from 8 to 30, indicating that the particle size only little affects the UCS value when D/dmax is more than 8.0. In this study, an appropriate value of D/dmax for the simulation test was determined to be 8, and seven S-RM samples with the corresponding size were carried out. The detailed numerical test scheme is listed in Table 2.

TABLE 2. Numerical simulation test scheme.
Figure 4A displays the UCS values for S-RM samples with various particle sizes (using dmax as the size description index) under different VBP conditions. As dmax increases from 10 mm to 25 mm, it seems that the UCS value almost maintains a value of 800 kPa, and the quick fall in UCS appears until dmax reaches 25 mm for the soil sample (VBP = 0%). In S-RM sample with VBP = 20% and 40%, the UCS initially rises and then falls with dmax, with the maximum UCS appearing at a dmax value of 12.5 mm. Under a 60% VBP condition, the variation range of UCS values of the S-RM samples with various dmax values is significantly less, and the value is in the range of 179.21–210.07 kPa. The sample with VBP = 90% exhibits the most pronounced decreasing trend of UCS variation, with the value decreasing from 107.45 to 86.56 kPa as dmax increases from 10 mm to 40 mm.
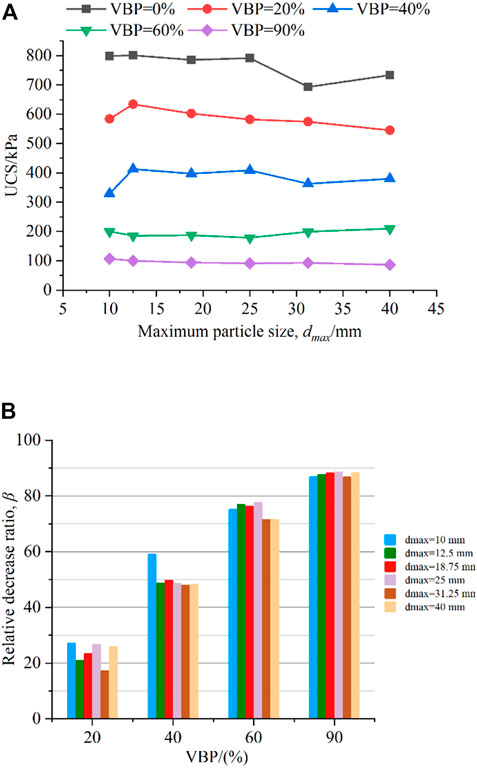
FIGURE 4. (A) UCS and (B) relative disturbance UCS ratio values of S-RM samples with different dmax values.
Previous studies indicate that the presence of rock blocks weakens the stability of the soil matrix and reduces the UCS value. However, little is yet known about the impact of the different-sized rock blocks. To determine the negative impact of tock block on the soil matrix, the relative disturbance UCS ratio, β, is proposed. It is calculated as follows.
The β values of samples with different dmax values under different VBP conditions are shown in Figure 4B. Under the VBP condition of 20%, the β values of samples are sensitive to changes in the dmax value, and are basically greater than 20%. The detrimental effect of the rock block becomes much more apparent when VBP reaches to 40% as dmax = 10 mm, whereas the β values of samples are close to 50% with a dmax range of 12.5–40 mm. The negative influence on the UCS value of rock blocks with various dmax values under the high VBP condition (such as VBP = 90%) is virtually the same, and the β value is about 85%–90%. The sample with the lower dmax value has a considerably more pronounced detrimental impact of the rock block on the UCS in the low VBP stage (20% and 40%). Because there are more rock particles and soil-rock interfaces with the same VBP due to the smaller rock size, the soil integrity and UCS value are more severely damaged. The influence of size differences on the disruption of mechanical behaviors eventually diminishes as VBP increases.
Figure 5 depicts the horizontal displacement distribution of the S-RM samples with various dmax values under different VBPs at the destruction stage, and the destruction stage refers to the stage in which the axial stress reduces to the stress that is 0.7 times peak stress in the post-peak stage. The result demonstrates that when the dmax value increases from 10 to 40 mm, a boarder distribution area of blue and red colored particle displacement appears and an increase in the difference in the horizontal displacement as shown in Figure 5A. The phenomenon of soil particle detachment was discovered as a result of the weak soil-rock contact strength, and the increase in dmax value causes a larger degree of anisotropy. On both sides of the sample, the evident destructions in the irregular form were discovered.
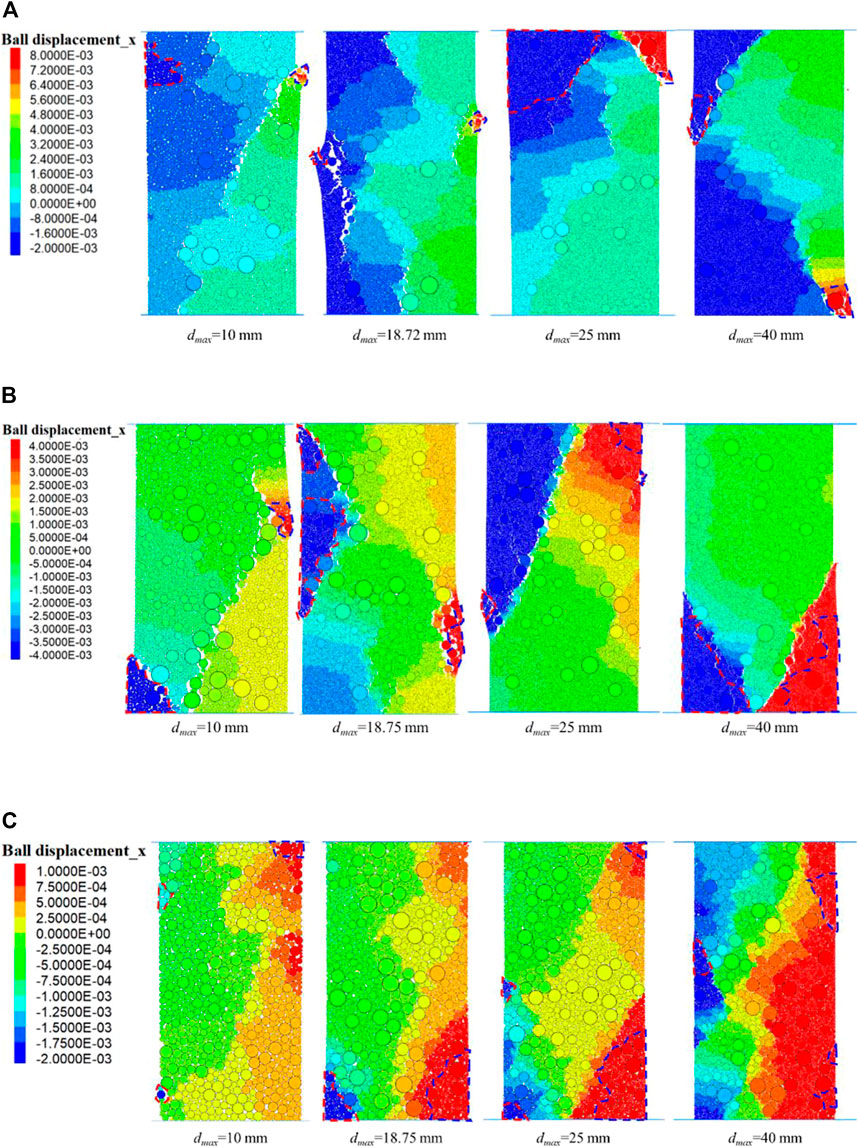
FIGURE 5. Horizontal displacement distribution of samples with different dmax values with (A) 20%; (B) 40%; (C) 90% VBP at the destruction stage.
The noteworthy region in Figure 5 is shown by a blue and red dotted line that delineates the region of which the horizontal displacement more or less than 0.6 times the greatest displacement. Particularly in the sample with dmax = 25 mm–40 mm, the position of the rock blocks is connected to the shape of the noteworthy region. The separation of the soil-rock aggregates has become more obvious as VBP increases, and in Figures 5B,C, the area of the noteworthy region has grown significantly. The contact failure within the sample is caused by an increase in both the VBP and dmax values because the contact strength between the rock-rock and rock-soil is significantly lower than that between the soil particles. As a result, the local destruction within the sample usually occurs in the area around the large size rock blocks.
The shear and tension micro-crack are indicated as black and red line segments between particles in Figure 6, which shows the micro-crack distribution of the sample with various dmax values at the destruction stage. The results show that the distributions of the tension and shear micro-crack are comparatively dispersed in the sample with dmax = 10 mm. The micro-crack gradually spreads parallel to the diagonal from the top or bottom of the sample, and more micro-crack are present as the dmax value increases as shown in Figure 6A. In Figures 6B,C the difference in the micro-crack distribution in the samples with dmax = 10 mm and 40 mm is more pronounced. When VBP reaches 40%, the micro-cracks in the sample with dmax = 10 mm were primarily found close to the larger rock blocks, and did not clearly link to one another. The micro-cracks mostly begin in the contact region of the sample with the wall when the dmax within the specimen is 40 mm. The micro-cracks are more widely spaced out and seem to be clearly connected when VBP is 90%. The failure of the rock-rock and rock-soil contact models, as discussed above, is the main cause of the deformation and failure of the sample. The ‘rounding rock effect’ is well presented as the extension of the micro-crack occurs along the weak soil-rock interface, and the increasing unevenness of the crack as the rock block size increases. The shear and tension micro-cracks can be found around the rock block particles in Figure 6C, which indicates that when the VBP is relatively large, the failure modes of the contact model inside the sample appear to less connected to the particle size.
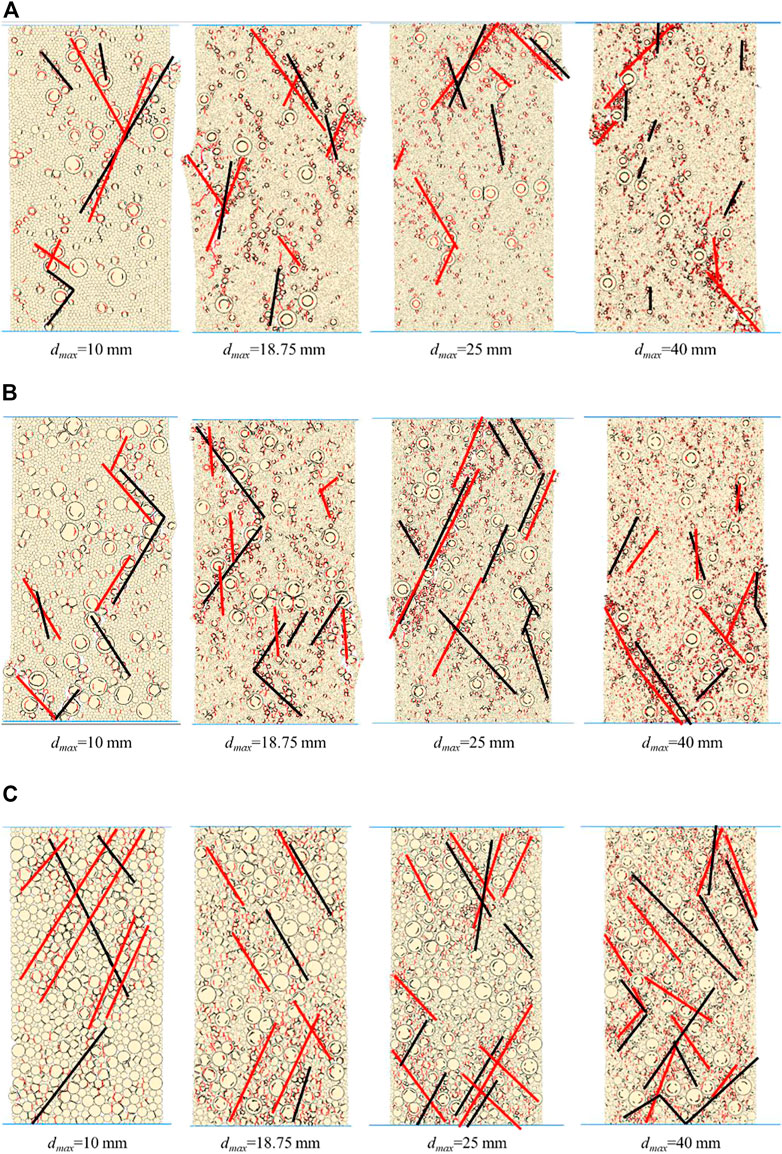
FIGURE 6. Micro-crack distribution of the sample with different dmax values with (A) 20%; (B) 40%; (C) 90% VBP at the destruction stage.
The force chain distributions of the S-RM sample with various dmax values and VBPs at the peak stress stage are displayed in Figure 7. The wider cyan and red force chains with the higher contact force were identified between the rock-rock with a bigger size, while the blue force chains with low contact force are extensively dispersed between the soil-soil particles. As the dmax value increases, there are more strong force chains, which suggests that there is a more evident transformation of the external force between the rock blocks (Figure 7A). The anisotropy in the contact force between the particles results in the local destruction and the decrease of UCS value. The difference in the contact force between rock-rock and rock-soil becomes more noticeable as VBP increases. In Figure 7B, the red and cyan force chains that have a reasonably strong contact force and are situated close to rock blocks with a relatively big size have been linked together. The rock blocks make contact with one another to form the rock skeleton under the high VBP condition, and they play the dominant role in transforming and bearing the external force under this circumstance. Due to the additional external force, the sample is more likely to be destroyed because of the poor strength of the rock-rock and rock-soil contact models.
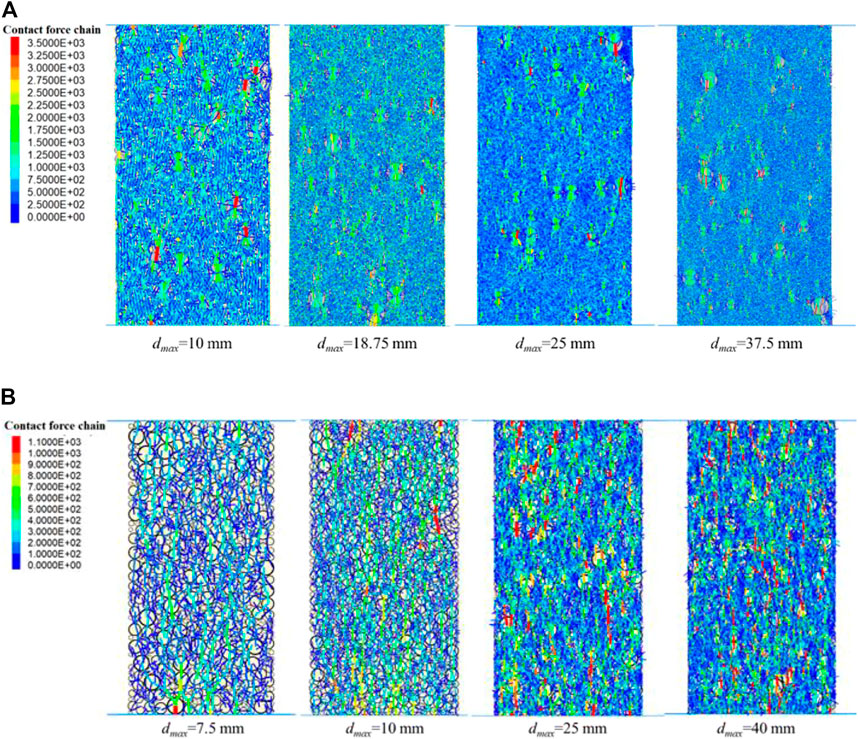
FIGURE 7. Force chain distributions of the S-RM sample with different dmax values with (A) 20%; (B) 90% VBP at the peak stress stage.
Researchers have also undertaken quantitative discussions regarding the size effect, and numerous theories have been put out to explain and predict the variance of the mechanical properties as the sample size increases.
Băzant theory (Bažant and Oh, 1983; Bažant, 1997) is one of the typical theories that is frequently utilized in the investigation of the quasi-brittle material size effect. Bažant (1997) indicates that the size effect was caused by the dissipation of strain energy during the macro crack growth. The unified nominal strength calculation formula function of the characteristics size D is shown in Eq. 5.
where ft is the tensile strength of the standard sample; B and D0 are empirical constants determined by test results.
Figure 8 displays the UCS simulated results and the fitting curves using Băzant theory. The obvious inaccuracy is identified as the S-RM sample with a VBP range of 60%–90% and greater dmax values based on the disparities between the simulated and fitted values. According to the simulation results above, the UCS value of the sample at VBP = 40% exhibits a declining trend with respect to the dmax value, however, it appears that at VBP = 90% the UCS value is less impacted by particle size. The peak stress and stress drop are no longer discernible, and the continuous deformation can be detected once the axial stress exceeds the yield stress, according to the axial stress-strain curves of S-RM with various dmax values as VBP = 90%. The increases in VBP and dmax lead to the ductility feature appearance of S-RM, and it is improper to use the size effect theory based on the test results of the quasi-brittle material.
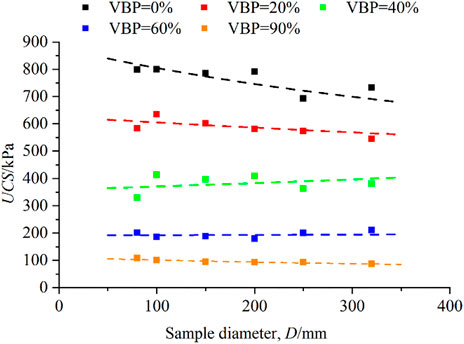
FIGURE 8. Comparisons between the simulation and calculation based on Băzant theory.
Even though the connections between the sample (or particle) size and mechanical parameters have been discussed by many researchers in recent years, the study about the effect of particle size on the UCS value of S-RM is still few. According to the empirical formula of UCS with various VBPs presented by Kalender et al. (2014) as Eq. 2, the presence of rock blocks destroys the integrity of the soil matrix, and the occurrence of the weak soil-rock interface increases the failure possibility of the sample, resulting in a decrease in strength. The characteristic parameter A is utilized to describe the role in the material strength played by the soil-rock interface, and a larger value of A indicates a stronger strength of the interface. The form and roughness of the rock blocks as well as the UCS value of the soil matrix all influence the value of characteristic parameter A; however, the size effect has not been taken into account so far. Based on the non-linear fitting, the characteristic parameter A of the S-RM with various dmax values is derived, and the results suggest that the particle size has an impact on parameter A as shown in Figure 9A. Based on the compositions of the test samples mentioned above, the dmax value of the sample in regular-size is generally less than 10 mm. In this study, the standard dmax value of the S-RM sample is set to 10 mm, which is named d10. The normalized Am (relative to the A10 of the sample with the standard dmax) and dmax value is shown in Figure 9B, and the result shows that when the dmax value is less than 25 mm, the normalized Am remains constant at around 1.5, and the size effect is evident in the sample within the dmax range of 25 mm–40 mm. According to Figure 4B, the relative disturbance UCS ratio (β) of the S-RM samples with various dmax values shows that the β values of the samples with a dmax range of 12.5 mm–25 mm under different VBPs appear to be similar and are in a relatively narrow variation range when compared with that of the sample with dmax = 10 mm. However, the β value exhibits a distinct connection with the dmax value when the dmax value is larger than 25 mm. It is suggested that the normalized Am and dmax value have the following connection.
where Am and A10 are characteristic parameters of the sample with a certain dmax value and standard dmax (d10), and the standard dmax value is 10 mm in this study.
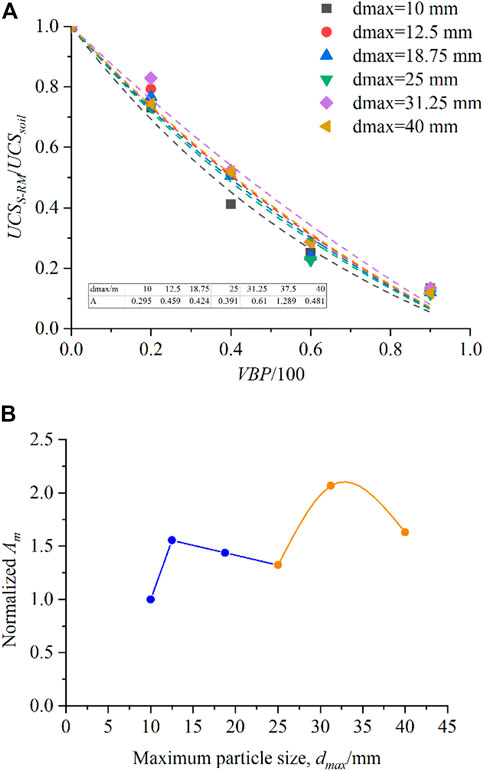
FIGURE 9. (A) Normalized UCS; (B) characteristic parameter A of S-RM with different dmax values.
The characteristic parameter A10 of the sample with the d10 can be obtained based on the parameter value table, and the characteristic parameter Am of the sample with a certain dmax value can be obtained using A10 and Eq. 6. The UCS value of S-RM with dmax value smaller than 40 mm under various VBP conditions is calculated based on characteristic parameter Am and UCS of the soil matrix, and the following prediction formula is suggested.
Figure 10 displays the comparisons between the predicted and simulated UCS values. The fitting functions suggested in this work may be used as a prediction reference for the UCS and shear strength of the engineering S-RM material taking the size effect into account since the error between the predicted and simulated values is acceptable.
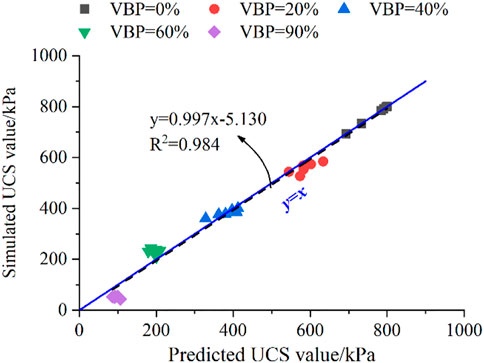
FIGURE 10. Comparison of the predicted and simulated UCS values.
A prediction method to determine the UCS value of the S-RM material with a dmax less than 10 mm, which is much smaller than the rock block size of the natural S-RM on the deposit slope, has been described in the existing work. As a result, the particle size range of the mechanical parameters in the prediction method for the shear strength of S-RM involved UCS value has not been consistent, of which the corresponding dmax value of the UCS and shear strength value is 10 mm and 40 mm–60 mm, respectively. Therefore, the aforementioned discussions above offer an empirical method to determine the UCS value of the S-RM material with a dmax ranging from 10 to 40 mm, which can fulfill the majority of the particle size range of the deposit slope of weathered origin. The typical large-scale apparatus used to determine the shear strength of natural S-RM has a maximum allowable dmax value of less than 40 mm. It is now feasible to utilize the same material with the same particle size range for all the experimental data used in the shear strength prediction formula (Eq. 1) due to the expansion of the relevant particle size range. The flow chart for the shear strength prediction of the S-RM with a dmax value smaller than 40 mm is shown in Figure 11. Based on the strength envelope, it is possible to determine the shear strength parameters of S-RM with a dmax value less than 40 mm can be obtained, which serves as a guide for the parameter selection during the assessment of the stability of deposit slope and the design of reinforcement engineering.
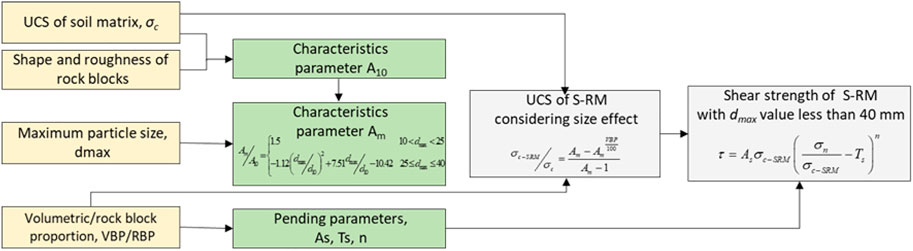
FIGURE 11. Flow chart of the shear strength determination method of S-RM considering size effect.
In this study, a typical deposit slope located in Shiyan City, Hubei Province, is chosen as the engineering application for the shear strength determination method of S-RM to take the size effect into consideration. The study slope is a high fill deposit slope, and the S-RM in the shallow region is made up of reddish brown cohesive soil and strongly weathered maroon argillaceous siltstone rock blocks of different sizes. The size of the rock block in the S-RM material inside the slope ranges from 2 mm to 50 mm, and occasionally there are even large rock blocks with a particle size of up to 100 mm. The internally cohesive structure of the moderately weathered glutenite strata underneath is comparatively complete, and the strength of the moderately weathered layer is significantly higher than that of the shallow strongly weathered region. The results of the in-situ sieving test used to determine the particle size distribution of S-RM material are displayed in Figure 12. Given that the particle size of S-RM is 5 mm, the fractal dimension clearly displays the multiple fractal characteristic, meaning that the properties of the particle size distribution are very distinct in the region above and below this particle size. Therefore, the soil-rock threshold of the S-RM in this study is chosen at 5 mm, and the rock content of S-RM is around 60%.
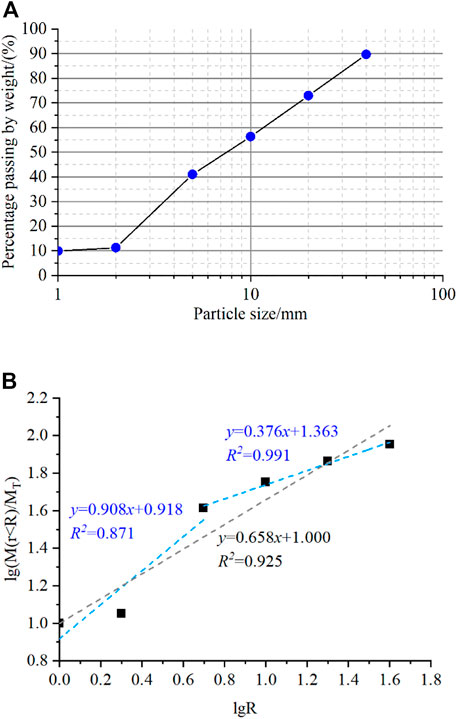
FIGURE 12. (A) Particle grain-size distribution and (B) fractal dimension curve of the S-RM material.
The shear strength parameters of the S-RM in the shallow region of the deposit slope are obtained using the determination method proposed in this study. The calculation steps are as follows.
(a) The soil matrix sample was collected from the construction site, and the UCS value of the soil matrix was determined to be 245 kPa based on the laboratory uniaxial compressive test. The friction angle of the rock block with the sub-round form is about 27°, and the characteristic parameter A10 was selected based on the value selection table proposed by Kalender et al. (2014) as around 1.2.
(b) The particle size distribution as illustrated in Figure 12 indicates that the dmax value of the material is larger than 40 mm. However, the rock content of the particle larger than 40 mm is fewer than 10%, which is only a small part of the total. The focus of this study was on the particle size range of 10 mm–40 mm, and a 40 mm dmax value was chosen. The characteristic parameter Am taking into account the size effect can be obtained using Eq. 6 as 2.304.
(c) The UCS value of S-RM with 60% rock content was obtained using the UCS value of soil matrix and characteristic parameter Am as 122.87 kPa based on Eq. 7. The resulting test and physical property parameters might be used to calculate the remaining pending parameters in Eq. 1. The cohesion of the S-RM is 72.88 kPa and the friction angle is 17.5°.
The image data of the target slope was captured using multi-rotor UAV equipment. A typical geological profile was selected to build a numerical model of the deposit slope in a two-dimensional plane, as illustrated in Figure 13A. The high-filled deposit slope was assessed for the stability under self-weight. The surface of the slope is assigned as the free boundary for the mechanical analysis of excavation, whereas only vertical displacement is allowed on the left and right boundaries, and the bottom boundary is restrained from movements.
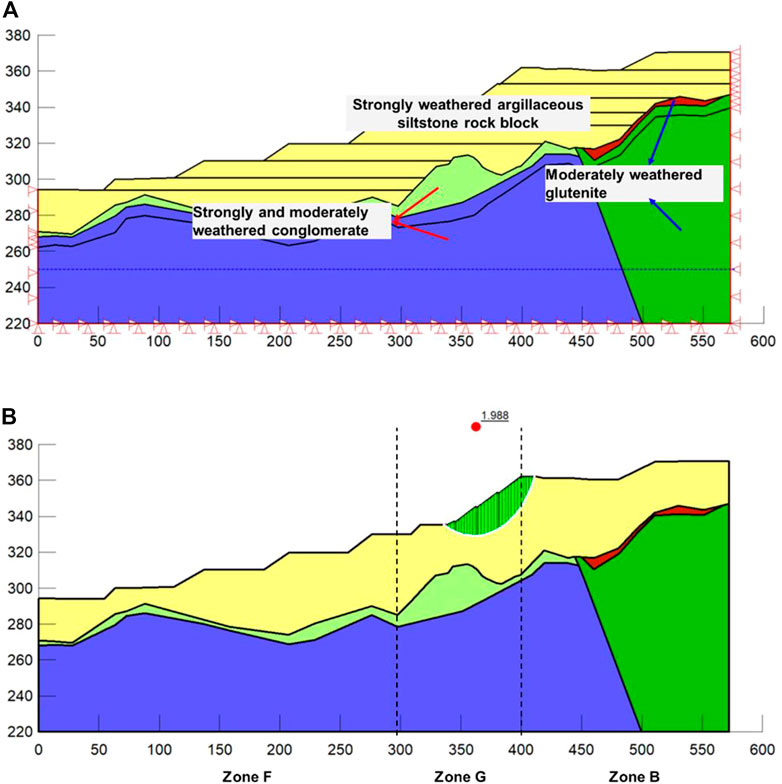
FIGURE 13. (A) Numerical model and the (B) potential sliding surface of the deposit slope.
Figure 13B shows that potential sliding surface of the deposit slope is mostly found in Zone G and extends to a maximum depth of 20.29 m. The safety factor was calculated based on the finite element-limit equilibrium method as 1.988, and no evident plastic zone was observed. According to the Technical code for building slope engineering, when the safety factor is larger than 1.25, the slope can be considered to be in a stable state under normal condition. Because the smallest safety factor in this study meets the stability criteria, the high-filled deposit slope is in a stable state, which is also compatible with the field monitor data. The shear strength determination method taking the size effect into consideration that is proposed in this study is expected to serve as a reference for the values of the mechanical parameters during the deposit slope engineering design and construction process.
In this study, a shear strength determination method was presented while taking into account how size affects the mechanical behaviors of S-RM. The uniformity of the particle size range of the material according to the required test data within the determination technique was attained with careful attention paid to fluctuations in the UCS value of S-RM with varied dmax values. The conclusion are summarized as follows.
1. The uniaxial compressive computer simulation tests of the S-RM sample in the same size with various dmax values reveal that the UCS value exhibits a decreasing trend as the dmax value increases, and the influence of the size effect on the S-RM sample in the same size decreases gradually. Based on the simulation results, a appropriated D/dmax value of 8 was suggested, which indicates that the particle motion inside the sample is not limited by boundaries.
2. The size effect simulation test results show that the UCS value decreases as the dmax value increases, and the disturbance caused by the rock block on the soil matrix has a connection with dmax of VBP = 20%–60%. The contact failure is more likely to occur close to the large-size rock blocks as the particle size increases, leading to rounding rock effect of the damaged surface. The distributions of the particle displacement and micro-crack are proportional to the particle size. As the dmax value increases, the rock blocks inside the sample begin to interact with one another and build a rock skeleton than can bear and transform the external force, especially when the VBP is high.
3. A modified method to estimate the UCS value taking the size effect into account was presented following the quantitative discussions. The relationship between the Am and dmax value was proposed after an analysis of the characteristic parameter Am within the formula under different particle size conditions. By comparing the predicted and simulated values, it has been demonstrated that the accuracy of the predicted equation. The shear strength was calculated using the modified UCS and shear strength estimation methods and the stability of a typical deposit slope was assessed using the determination method as the engineering application. The study results can be used as a guide for estimating the strength parameters of S-RM and assessing the deposit slope stability as well as for understanding the impact of rock size on the mechanical behaviors of the S-RM under the uniaxial compressive condition.
The original contributions presented in the study are included in the article/supplementary material, further inquiries can be directed to the corresponding author.
YZ and LZ contributed to the conception of the study; GS proposed the methodology of the study; GS and SQ helped perform the validation of the analysis results; YZ and JC contributed significantly to the original draft preparation; GS and HX contributed to the review and editing of the manuscript. All authors have read and agreed to the published version of the manuscript.
Authors YZ, SQ, LZ, JC, and HX were employed by the company State Grid Hubei Electric Power Company Limited Economic Research Institute and author GS was employed by the company State Grid Hubei Electric Power Co. Ltd.
The authors declare that the research was conducted in the absence of any commercial or financial relationships that could be construed as a potential conflict of interest.
All claims expressed in this article are solely those of the authors and do not necessarily represent those of their affiliated organizations, or those of the publisher, the editors and the reviewers. Any product that may be evaluated in this article, or claim that may be made by its manufacturer, is not guaranteed or endorsed by the publisher.
Bai, B., Wang, Y., Rao, D., and Bai, F. (2022). The effective thermal conductivity of unsaturated porous media deduced by pore-scale SPH simulation. Front. Earth Sci. (Lausanne). 10, 943853. doi:10.3389/feart.2022.943853
Bai, B., Yang, G. C., Li, T., and Yang, G. S. (2019). A thermodynamic constitutive model with temperature effect based on particle rearrangement for geomaterials. Mech. Mater. 139, 103180. doi:10.1016/j.mechmat.2019.103180
Bai, B., Zhou, R., Cai, G. Q., Hu, W., and Yang, G. C. (2021). Coupled thermo-hydro-mechanical mechanism in view of the soil particle rearrangement of granular thermodynamics. Comput. Geotechnics 137 (8), 104272. doi:10.1016/j.compgeo.2021.104272
Bažant, Z. P., and Oh, B. H. (1983). Crack band theory for fracture of concrete. Mat. Constr. 16 (3), 155–177. doi:10.1007/bf02486267
BaŽAnt, Z. P. (1997). Scaling of quasibrittle fracture: Asymptotic analysis. Int. J. Fract. 83 (1), 19–40.
Chaulagai, R., Osouli, A., Salam, S., Tutumluer, E., Beshears, S., Shoup, H., et al. (2017). Influence of maximum particle Size, fines content, and dust ratio on the behavior of base and subbase coarse aggregates. Transp. Res. Rec. 2655 (2655), 20–26. doi:10.3141/2655-04
Ding, X. B., Zhang, L. Y., Zhu, H. H., and Zhang, Q. (2014). Effect of model scale and particle size distribution on PFC3D simulation results. Rock Mech. Rock Eng. 47 (6), 2139–2156. doi:10.1007/s00603-013-0533-1
Du, W. J., Sheng, Q., Fu, X. D., Chen, J., and Zhou, Y. (2022). A TPDP-MPM-based approach to understanding the evolution mechanism of landslide-induced disaster chain. J. Rock Mech. Geotechnical Eng. 14 (4), 1200–1209. doi:10.1016/j.jrmge.2022.03.004
Fu, X. D., Ding, H. F., Sheng, Q., Zhang, Z., Yin, D., and Chen, F. (2022). Fractal analysis of particle distribution and scale effect in a soil–rock mixture. Fractal Fract. 6 (2), 120. doi:10.3390/fractalfract6020120
Fu, X. D., Du, Y. X., and Sheng, Q. (2021a). Geo-engineering descriptions and damage characteristics assessment for Xigeda formation, Yunnan Province, China. Environ. Earth Sci. 80 (19), 670. doi:10.1007/s12665-021-09982-z
Fu, X. D., Zhang, Z. P., Sheng, Q., Zhou, Y., Huang, J., Wu, Z., et al. (2021b). Applications of an innovative strength parameter estimation method of the soilrock mixture in evaluating the deposit slope stability under rainfall. Front. Earth Sci. (Lausanne). 9, 768757. doi:10.3389/feart.2021.768757
Giang, P. H. H., Van Impe, P. O., Van Impe, W. F., Menge, P., and Haegeman, W., (2007). Small-strain shear modulus of calcareous sand and its dependence on particle characteristics and gradation. Soil Dyn. Earthq. Eng. 100, 371–379. doi:10.1016/j.soildyn.2017.06.016
Guo, Z. Z., Chen, L. X., Gui, L., Du, J., Yin, K. L., and Minh, D. H., (2019). Landslide displacement prediction based on variational mode decomposition and WA-GWO-BP model. Landslides 17, 567–583. doi:10.1007/s10346-019-01314-4
Hong, C. J., Huang, M., Zhang, D. Y., Shou, P., and Zhu, Z. (2020). Characteristics of direct shear and particle breakage of pebble gravel materials. Geofluids 2020, 1–13. doi:10.1155/2020/8820045
Ji, T., Chen, B. C., and Zhuang, Y. Z. (2011). “Effects of sand particle size and gradation on strength of reactive powder concrete,” in Paper presented at the international conference on civil engineering and building materials (CEBM), kunming, PEOPLES R China. <Go to ISI>://WOS:000306441600040.
Ji, X., Lu, H., Dai, C., Ye, Y., Cui, Z., and Xiong, Y. (2021). Characterization of properties of soil–rock mixture prepared by the laboratory vibration compaction method. Sustainability 13 (20), 11239. doi:10.3390/su132011239
Kalender, A., Sonmez, H., Medley, E., Tunusluoglu, C., and Kasapoglu, K. (2014). An approach to predicting the overall strengths of unwelded bimrocks and bimsoils. Eng. Geol. 183, 65–79. doi:10.1016/j.enggeo.2014.10.007
Li, C., He, C., Wang, C., and Zhao, H. F. (2008). Study of scale effect of large-scale triaxial test of coarse-grained materials. Rock Soil Mech. 29 (S1), 563–566. doi:10.3969/j.issn.1000-7598.2008.z1.114
Li, Y. (2013). Effects of particle shape and size distribution on the shear strength behavior of composite soils. Bull. Eng. Geol. Environ. 72 (3), 371–381. doi:10.1007/s10064-013-0482-7
Lin, H., Wang, H., Fan, X., Cao, P., and Zhou, K. (2019). Particle size distribution effects on deformation properties of graded aggregate base under cyclic loading. Eur. J. Environ. Civ. Eng. 23 (3), 269–286. doi:10.1080/19648189.2016.1276480
Lv, X. L., Xue, D. W., Ma, Y. Y., Zeng, S., and Huang, M. S. (2022). Microscopic and macroscopic numerical simulation of the progressive failure of granular materials. Sci. Sin. -Tech. 52, 1022–1034. doi:10.1360/sst-2021-0326
Ovalle, C., and Dano, C. (2020). Effects of particle size–strength and size–shape correlations on parallel grading scaling. Géotechnique Lett. 10, 191–197. doi:10.1680/jgele.19.00095
Peng, J., Wong, L., and Teh, C. (2017). Effects of grain size-to-particle size ratio on micro-cracking behavior using a bonded-particle grain-based model. Int. J. Rock Mech. Min. Sci. 100, 207–217. doi:10.1016/j.ijrmms.2017.10.004
Ueda, T., Matsushima, T., and Yamada, Y. (2011). Effect of particle size ratio and volume fraction on shear strength of binary granular mixture. Granul. Matter 13 (6), 731–742. doi:10.1007/s10035-011-0292-1
Vahidi-Nia, F., Bayesteh, H., and Khodaparast, M. (2020). Effect of initial packing density, stress level and particle size ratio on the behavior of binary granular material: A micromechanical approach. Granul. Matter 22 (3), 68. doi:10.1007/s10035-020-01036-8
Wang, Z. Y., Wang, P., Yin, Z. Y., and Wang, R. (2022). Micromechanical investigation of the particle size effect on the shear strength of uncrushable granular materials. Acta Geotech. 17, 4277–4296. doi:10.1007/s11440-022-01501-z
Wolinski, S., Hordijk, D. A., Reinhardt, H. W., and Cornelissen, H. A. (1987). Influence of aggregate size on fracture mechanics parameters of concrete. Int. J. Cem. Compos. Lightweight Concr. 9 (2), 95–103. doi:10.1016/0262-5075(87)90025-x
Wu, L. Q., Ye, F., and Qing, L. W. (2020). Experimental study on scale effect of mechanical properties of rockfill materials. Chin. J. Geotechnical Eng. 42, 141–145. doi:10.11779/CJGE2020S2025
Xu, W. J., and Hu, R. L. (2009). Conception, classification and significations of soil-rock mixture. Hydrogeology Eng. Geol. 36 (4), 50–56+70. doi:10.3969/j.issn.1000-3665.2009.04.012
Xu, W. J., Hu, R. L., and Tan, R. J. (2007). Some geomechanical properties of soil-rock mixtures in the Hutiao Gorge area, China. Geotechnique 57 (3), 255–264. doi:10.1680/geot.2007.57.3.255
Yang, Y. T., Chen, T., Wu, W. A., and Zheng, H. (2021). Modelling the stability of a soil-rock-mixture slope based on the digital image technology and strength reduction numerical manifold method. Eng. Analysis Bound. Elem. 126, 45–54. doi:10.1016/j.enganabound.2021.02.008
Zhang, Z. P., Fu, X. D., Sheng, Q., Zhou, Y., and Huang, J. (2021). Effect of rainfall pattern and crack on the stability of a red bed slope: A case study in yunnan province. Adv. Civ. Eng. 21, 1–21. doi:10.1155/2021/6658211
Zhao, Y. X., and Liu, Z. X. (2018). Study of material composition effects on the mechanical properties of soil-rock mixtures. Adv. Civ. Eng. 2018, 1–10. doi:10.1155/2018/3854727
Zhou, Y. Q., Sheng, Q., Li, N. N., and Fu, X. (2022). The dynamic mechanical properties of a hard rock under true triaxial damage-controlled dynamic cyclic loading with different loading rates: A case study. Rock Mech. Rock Eng. 55, 2471–2492. doi:10.1007/s00603-021-02756-w
Keywords: size effect, soil-rock mixture, uniaxial compressive strength, shear strength, deposit slope
Citation: Zhou Y, Sheng G, Qiao S, Zhou L, Cai J and Xu H (2022) A determination method for the shear strength of soil-rock mixture considering the size effect and its application. Front. Mater. 9:1075310. doi: 10.3389/fmats.2022.1075310
Received: 20 October 2022; Accepted: 27 October 2022;
Published: 11 November 2022.
Edited by:
Bing Bai, Beijing Jiaotong University, ChinaReviewed by:
Zhenping Zhang, Shenyang University of Technology, ChinaCopyright © 2022 Zhou, Sheng, Qiao, Zhou, Cai and Xu. This is an open-access article distributed under the terms of the Creative Commons Attribution License (CC BY). The use, distribution or reproduction in other forums is permitted, provided the original author(s) and the copyright owner(s) are credited and that the original publication in this journal is cited, in accordance with accepted academic practice. No use, distribution or reproduction is permitted which does not comply with these terms.
*Correspondence: Yingbo Zhou, eWluZ2JvemhvdUAxMjYuY29t
Disclaimer: All claims expressed in this article are solely those of the authors and do not necessarily represent those of their affiliated organizations, or those of the publisher, the editors and the reviewers. Any product that may be evaluated in this article or claim that may be made by its manufacturer is not guaranteed or endorsed by the publisher.
Research integrity at Frontiers
Learn more about the work of our research integrity team to safeguard the quality of each article we publish.