
94% of researchers rate our articles as excellent or good
Learn more about the work of our research integrity team to safeguard the quality of each article we publish.
Find out more
ORIGINAL RESEARCH article
Front. Mater., 12 December 2022
Sec. Polymeric and Composite Materials
Volume 9 - 2022 | https://doi.org/10.3389/fmats.2022.1068261
This article is part of the Research TopicECCM Research Topic on Advanced Manufacturing of CompositesView all 14 articles
 Igor Zhilyaev1*
 Stefan Grieder1Marco Küng1
 Christian Brauner1Michael Akermann2Jonas Bosshard2Petra Inderkum2João Francisco2Martin Eichenhofer2
Substitution of conventional metal structures with fiber-reinforced polymers is possible because of their sustainable performance. One of the primary disadvantages of these composite materials is their high cost due to labor-intensive manufacturing. Because the fiber path can be steered directly along the load path, structures can be manufactured in a near-net shape, and a high degree of reproducibility with low scrap rates can be achieved. Additive manufacturing of these composite structures could enable cost efficiency with a high degree of complexity. However, the high degree of porosity and high void content between the printed fiber filaments results in unacceptable structural performance. Following the printing process, a post-consolidation process (additive fusion) can be performed to improve the mechanical performance of the part and use fiber-reinforced polymers for load-bearing applications. Numerical simulation of the consolidation process enables the production of these complex parts without expensive prototyping iterations. Because of the rapid and local changes in material stiffness, the simulation of the consolidation process is combined with a set of numerical model convergence problems. An advanced finite-element numerical model for simulating the consolidation process of additive manufactured continuous fiber composite parts is presented in this paper. The additive fusion step simulation allows for the evaluation of process-induced deformations, final engineering constants, and porosity. The simulation workflow is demonstrated and validated using experimental data from the manufacturing process of a typical aerospace part, specifically a helicopter hinge element.
The enhanced properties of continuous carbon fiber-reinforced polymers, such as high stiffness, high strength, and a good stiffness-to-weight ratio, can be used in additive manufactured composite structures (Gebhardt et al., 2019). Various surveys and scientific publications on the performance of these highly optimized structures can be found based on the available printing technology from companies such as Markforged, Anisoprint, 2021, Arevo, 2021, and 9 T Labs to manufacture thermoplastic composite parts (Gregory and Gonzdz 2016; Blok et al., 2018; Goh et al., 2018; Iragi et al., 2019; Borowski et al., 2021).
These companies use a modified version of the FFF method, which combines polymer and pre-impregnated carbon fiber printing. Because of its low cost and ease of use, the FFF method is one of the most widely used processes in additive manufacturing. Pre-impregnated fiber-reinforced materials are used in continuous fiber additive manufacturing, similarly to conventional composite manufacturing methods such as automated fiber placement, automated tape laying, or custom fiber placement. The disadvantage of any additive manufacturing method is that, as the print speed increases, the level of porosity increases, and the requirements for a load-bearing part are no longer fulfilled. Therefore, a consolidation step was required. To address this problem, various approaches such as heat treatment during printing (Bhandari et al., 2019) and annealing or compaction during post-processing can be used (Meng et al., 2019; Zhang et al., 2020). Compaction is the subject of two developments. Using additional rollers to integrate a compaction unit into the printing process. This is the state-of-the-art automated tape-laying method. However, the part can be consolidated using a press and solid mold. The second approach also allows for the addition of more complexity to the part. Eguemann et al. (2013) combined several 3D printed preforms and metallic inserts into a single part using consolidation. The Airbus Helicopters former Eurocopter Germany GmbH application case is a machined steel hinge from rotorcraft model EC 135, weighing 135 g and mounted on a carbon fiber-reinforced polymer door structure. Eguemann et al. (2013) demonstrated the load case, and various composite-related manufacturing processes, such as injection molding, compression molding, and hand lamination, were evaluated and compared to the steel baseline.
This study demonstrates a novel method for simulating the additive fusion (consolidation) process of a complex-shaped composite part to investigate the dependence of the final mechanical properties and residual stresses on the process conditions. The method is presented by the authors as a sequential thermo-mechanical coupled, transient implicit analysis in ANSYS R2022 based on user material subroutines (Grieder et al., 2022). The phase transition behavior of the polymer from solid to molten and back to solid was modeled. Temperature, fiber volume content, porosity, and crystallization all influence the engineering properties of composite materials. The validation of the model for process-induced deformations and porosity in an aerospace part, namely, the helicopter hinge and a bracket to assemble the helicopter door, is the focus of this study. Figure 1 depicts the composite parts under consideration and the manufacturing workflow.
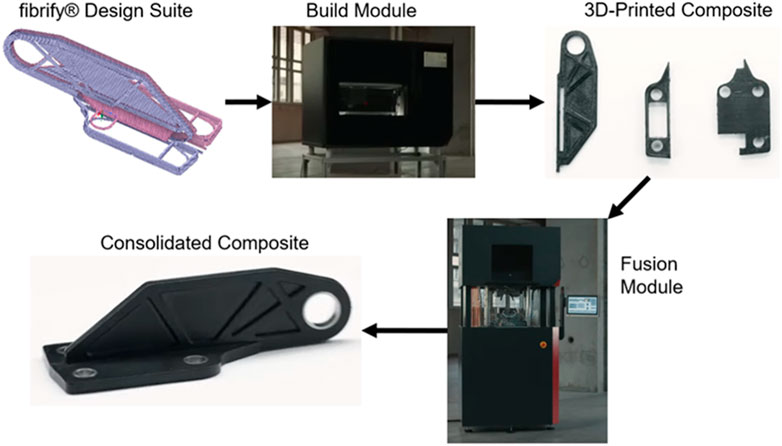
FIGURE 1. 9T Labs’ production cycle of the composite part (Grieder et al., 2022).
Wijskamp (2005) presented a sequentially coupled thermo-mechanical transient simulation approach that couples relative crystallization with phase transitions from the molten to the solid phase. It is possible to accurately calculate process-induced deformations by making the stiffness during a mechanical simulation dependent on the phase change by using relative crystallization as a status variable. Wijskamp (2005) assumed that when a material’s relative crystallization exceeds 50%, it starts to behave as a solid. This transition point is known as the solidification point, and it is critical for calculating process-induced deformations because after a material passes this point, thermal loads caused by the cooling process can cause deformations.
This approach has also been used in the literature by researchers such as Wijskamp (2005) and Brauner et al. (2014) to analyze process-induced deformation during the thermoforming process of composites. The Nakamura model is used in both models (Nakamura et al., 1972; Nakamura et al., 1973). The cooling phase crystallization kinetics are demonstrated by
where
where
Based on the experimental data, the parameters
Similarly, melting behavior can be represented by a phase change from 1 (solid state) to 0 (molten state) according to Wijskamp (2005), Greco and Maffezzoli (2003), Brenken et al. (2018).
The values of the coefficients
Using the relative crystallization and the definition of the solidification point, the Young’s modulus of the polymer was discovered to be temperature dependent during the process. This approach is considered the standard for thermoset-related processes that use the degree of cure. The resin modulus can be linear or nonlinear in its dependence (Wijskamp 2005; Brauner et al., 2011). The polymer modulus can also be used to determine the engineering properties of a unidirectional composite ply. Schürmann (2007) and Halpin and Kardos (1976) provided different homogenization approaches for composite materials, and Brauner (2013) provided an overview. The process-induced deformation and residual stress can be determined using this incremental elastic approach (Zobeiry 2006). These methods are capable of accurately simulating process-induced deformation stresses. However, residual stresses could be overestimated because stress relaxation was not considered. However, the effect of relaxation is irrelevant for thermoplastic composites that are additively manufactured because Young’s modulus is very low compared to that of a thermoset resin.
The transition between the solid and molten material states used in this study is nonstepwise and nonlinear, which improves numerical robustness. This transition was calculated in Grieder et al. (2022) using dynamic mechanical analysis (DMA) and rheometer measurements. This is illustrated in Supplementary Figure S1.
The transverse isotropic mechanical properties were evaluated in this study using the homogenization approach from Halpin-Tsai (Halpin and Kardos 1976; Schürmann 2007). The elastic modulus in the fiber direction
The elastic moduli in the transverse and thickness directions are defined as (Schürmann 2007)
In this case,
Poisson’s ratio is defined as (Grieder et al., 2022).
Shear moduli are defined as follows (Halpin and Kardos 1976; Schürmann 2007):
In this case,
In the solid state, the mixing rules (5–10) are applied to the PA12-CF filament, whereas in the molten state, the material is considered isotropic, with material properties corresponding to pure polyamide 12 (PA12).
The mixing rules for orthotropic coefficients of thermal expansion (CTE) and crystallization shrinkage could be introduced to the model. The coefficients of thermal expansion in the transverse and longitudinal directions are calculated using the following equations (Schürmann 2007):
Here,
Shrinkage is a crucial consolidation process-induced effect that has a significant impact on the final warpage of a part. The shrinkage of the PA12 composite was shown to be temperature and printed lay-up dependent (Negi and Rajesh 2016; Li et al., 2020). The shrinkage of composite materials is defined via the following mixing rules (Wijskamp 2005; Schürmann 2007):
where
For the investigated additive-manufactured composite materials, porosity exhibits the greatest impact. Blok et al. investigated porosity during FFF manufacturing for SFR and CFR (Blok et al., 2018). The void content exhibits a significant negative impact on the composite properties. A high void ratio reduces strength, durability, and fatigue resistance, increases moisture absorption, and causes composite properties to vary within one part (Cable 1991; Ghiorse 1993; Mahoor et al., 2018). Therefore, void content should be minimized in bear-loading applications.
Zingraff et al. (2005) and Zingraff (2004) addressed void-process-induced formation in the composite processing literature. Voids may form in autoclave processing when the resin shrinks during thermoplastic crystallization (Eom et al., 2001). Grieder et al. (2022) demonstrated that the level of porosity of additively manufactured composites can reach 20–30% for simple geometry. Leterrier and G’sell, (1994) demonstrated that free heating of the composite specimen could result in an increase of up to 60% in the initial void content. This indicates the need for a consolidation step, which must be incorporated into the process simulation method.
During solidification, specific pressure and temperature regimes can be used to avoid void formation (Long et al., 1995; Lundstrom and Gebart (1994). Eom et al. (2001) proposed process conditions that yield void-free composites while requiring a minimum amount of pressure (0.2 MPa). Specially designed molds can minimize void formation and process-induced deformation (Eguemann et al., 2013). In this study, a similar approach was developed and implemented in which an advanced mold design was provided to minimize part porosity and warpage.
Experimental and numerical studies on void formation mechanisms in mesostructures and the influence of pores on the mechanical properties of 3D-printed composites have been presented in the literature (Bellehumeur et al., 2004; Wang et al., 2016). Multiscale finite element modeling methods for studying the influence of micro- and mesoporosity and process parameters on the mechanical properties of composites are illustrated in Calneryte et al. (2018), Rodriguez et al. (2000), and Xue et al. (2019). The power law empirical relationship can express stiffness-porosity dependence (Jaroslav 1999).
Here, E represents the effective Young’s modulus of the porous medium,
The power-law porosity dependence (18) was successfully implemented in the finite element model for non-polymer materials with a relatively low initial porosity (Hardin and Beckermann 2007; Morrissey and Nakhla 2018). However, this definition necessitates experimental measurements to tune the stiffness of the porosity function. Moreover, most of the presented approaches only allow for robust numerical simulation for a small range of void content change, failing in the case of rapid porosity evolution from 20 to 30% to almost zero void content.
In this study, a similar approach is presented in which the stiffness is determined using the local porosity content via a power law. Temperature, crystallization degree, and porosity all affect the matrix elastic modulus
Here,
Composite material properties are defined according to the mixing rules (5)–(15), which determine the proportion of pure fiber to pure matrix properties based on the fiber volume ratio
where
Many phenomena occur concurrently during consolidation, including bulk compaction, intimate contact between adjacent plies, interlaminar adhesion, fiber deformation, movement, and molecular diffusion (Koerdt et al., 2022). These phenomena interact in complex ways and are influenced by process parameters such as time, temperature, and pressure. The resin pressure must be evaluated to model void formation. This can be accomplished by simplifications or Darcy’s law when modeling a flow problem. Grieder et al. (2022) developed a simplified porosity model based on the approach of Barari et al. (2020). In the model, porosity
According to Barari et al. (2020), the hydrostatic pressure,
where
The volume of dissolved air is a dimensionless variable with values in the range of 0–1, with 0 indicating that the air occupies 100% of its initial volume and one indicating that the air is completely dissolved in the surrounding matrix. Because it is assumed that air traps have spherical shapes, the volume can be defined as
The fundamental mechanisms of air bubble formation and reduction in thermoplastic composites remain unknown. Early models incorporated diffusion into the isothermal growth of spherical gas bubbles in a viscous fluid (Moris and Costel 1984). Further studies expanded the model to include many bubbles in highly viscous fluids (Arefmanesh et al., 1990; Arefmanesh 1991). These models were then applied to thermoplastic composites for structural applications (Roychowdhury 1995; Roychowdhury et al., 2001; Yohann et al., 2008; Jin et al., 2020).
Gas diffusion into molten polymer was considered in the literature (Wood and Bader 1994; Zingraff 2004; Zingraff et al., 2005), where the diffusion coefficient for the polymer material was measured. However, the dimensionless diffusion coefficient in the present approach represents not only the diffusion and dissolution processes but also the air evacuation through the void channels along the filament’s printing path. Therefore, the diffusion coefficient D is a model design parameter that cannot be directly measured but must be adjusted for each new material, composite structure, and printing condition (Grieder et al., 2022).
In Grieder et al. (2022), it was assumed that every finite element contains an air bubble that evolves independently of the surrounding medium and other bubbles. The relative bubble radius was calculated as follows (Wood and Bader 1994; Advani and Sozer 2010):
where
A general description of hydrodynamics is required for polymer melts (Joel et al., 1997). This description considers viscoelasticity, die swelling, and shear thinning. These properties necessitate nontrivial modifications to the hydrodynamic formulation of the fluid, resulting in advanced constitutive equations that significantly increase the complexity of the problem and computational effort. Because of the limitations of the finite-element software ANSYS and the aforementioned issue, this study considers a simplified model of the squeeze flow.
The simplified orthotropic squeeze pressure
where
where
where
where a and w represent the height and width of the rectangular duct, respectively, evaluated according to the following:
where
As a function of the bulk strain
where
The physics of rapid bubble collapse and its impact on the surrounding viscous medium have been discussed in terms of fluid mechanics for liquid media (Flynn 1975; Brujan and Vogel 2006). The bubble collapse process was studied for the solid or molten material state in Jin et al. (2020), where it was demonstrated that violent bubble collapse causes significant changes in material properties. When a porous material is subjected to large deformation, the failure threshold is predicted not directly by the total stress applied but by a certain difference between the total compressive stress and pore pressure. Skempton (1960) investigated the effective stress for volumetric deformation. The pore pressure should be considered in the constitutive equations (Skempton 1960; Barari et al., 2020), but a simple calculation of the pore stress using the ideal gas law results in rapid growth of the internal void pressure during fast void collapse (Grieder et al., 2022), which causes convergence problems when using the finite element method. For a more accurate description of bubble collapse in polymer melt, advanced viscoelastic models are required (Gaudron et al., 2015). Because of the simplicity of the proposed hydrodynamic model, the evaluated void pressure was not considered in the constitutive equations in the current study. However, the pressure indirectly influences the process-induced stresses via stiffness, which is a function of porosity 17) and changes owing to the compaction degree and air diffusion. The stiffness-porosity relationship is controlled by the model design parameters S and M. Therefore, the model can be tuned to compensate for the influence of internal void pressure on the surrounding resin medium (Grieder et al., 2022).
This section introduces the material and provides detailed characterizations. The following experimental characterizations were used: differential scanning calorimetry (DSC) was used to determine the crystallization/melting behavior, and thermomechanical analysis (TMA) was used to measure the coefficient of thermal expansion. The computer was used to determine the final shape and the porosity content of the consolidated composite part.
Carbon fiber-reinforced material with a PA12 matrix, high tensile fibers with a fiber volume content of 57%, and a PA12 material provided by 9 T Labs were used in this study. Table 1 summarizes the engineering properties of the composite, which were previously presented by the authors (Grieder et al., 2022).
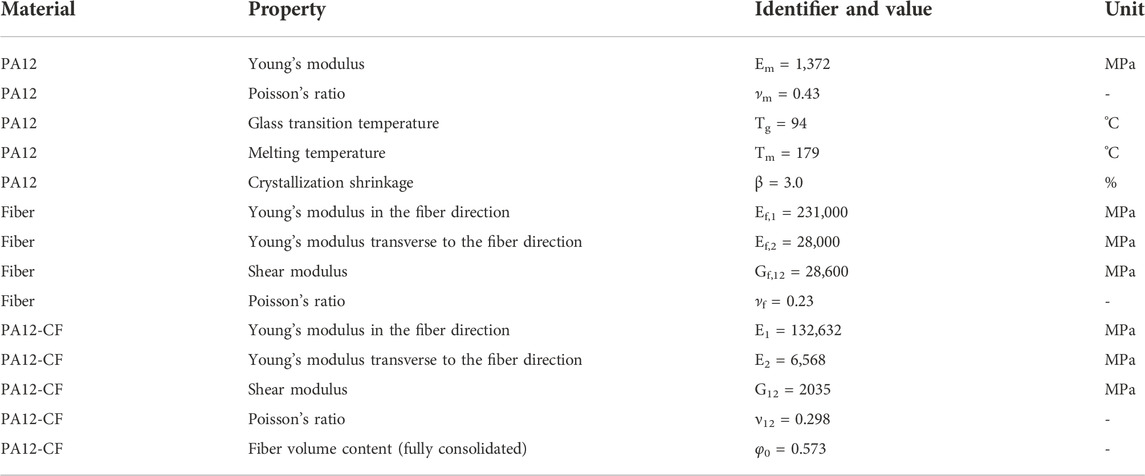
TABLE 1. Material properties at room temperature (Grieder et al., 2022).
The hinge subparts used in the study were printed separately (Figure 1) using the 9T Labs Build Module. The list of the printing parameters is presented in Supplementary Table S2. The composite design tool was used to determine the location and orientation of the reinforcing plies (Figure 1). The free space in the part volume where there are no fibers is filled with pure PA12. The build module has two nozzles: one for the unreinforced material, similar to the nozzle of another Fused Deposition Modeling (FDM), and a more complex nozzle for fibers, which has a patented cutting unit that allows for the printing of complex fiber paths.
Following printing, the hinge parts are assembled in the fusion module and consolidated. In this study, two different process conditions were used for model validation (samples A and B). An average temperature of 240°C was used as the baseline for the sample, resulting in an average heat rate of 8 °C/min. The temperature baseline for sample B was set at 184°C, resulting in a heating rate of 2 °C/min. Because the initial temperature of the mold pre-heating in both cases was 80°C. The part was actively cooled to 80°C and then demolded after approximately 4 min of consolidation at the maximum applied temperature and pressure.
A consolidation force of 30 kN was applied to both samples. After the final temperature was reached, the force was then increased to 45 kN. By applying pressure from the bottom, the hinge’s base plate consolidated. The force was transferred to the sides of the vertical plate for consolidation using a sliding system. The consolidation force application and process conditions are presented in Supplementary Figure S2.
Temperature-dependent changes in materials, such as melting or crystallization, can be detected using DSC. The endothermic heat flow in the case of melting and exothermic heat flow in the case of crystallization can be measured and interpreted using this method, with the assumption that the measured heat flow is proportional to the change in crystallization. The relative crystallization
DSC experiments were performed using a DSC 25 instrument (TA Instruments, New Castle, DE United States). A small probe (approximately 13 mg) was extracted from the composite material and the neat polymer. The fibers serve as the initial nuclei during crystallization, influencing the formation of the crystalline network. Therefore, the composite material was directly used as the sample material, and the mass correction was performed with only the matrix component. The material was heated in the DSC oven to 70°C above melting temperature (Tm = 180°C), resulting in a final temperature of Tmax = 250°C at a heating rate of 10 K/min. The sample was kept at isothermal temperatures for 5 min to ensure that it was completely molten. The sample was then cooled at various rates: 1, 5, 10, 20, and 50 K/min. Each measurement was performed three times, and the average results are presented. Figure 2 demonstrates the scheme of DSC measurement.
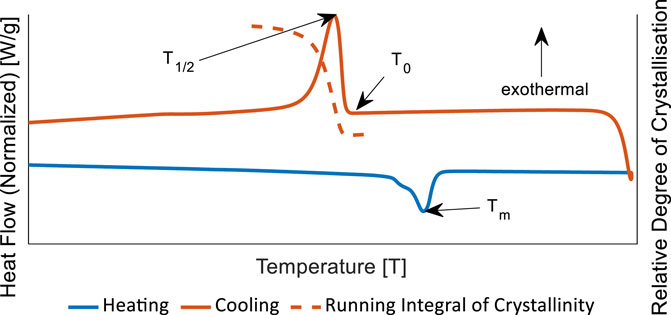
FIGURE 2. Scheme of DSC heating and cooling cycles for crystallization and melting kinetics.
The melting kinetics were determined by integrating the endothermal heat flow over a sigmoidal baseline in the temperature range between 145°C and 190°C to determine the degree of melting between 0 (solid-state) and 1 (molten state). The model parameters
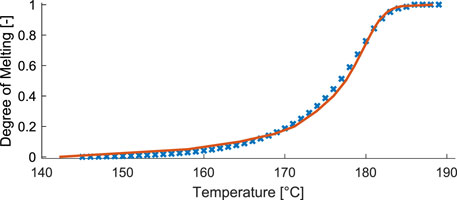
FIGURE 3. Measurement and fit for the melting kinetics.
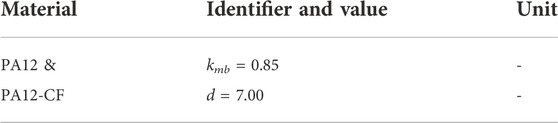
TABLE 2. Parameters for the melting kinetics equations.
To determine crystallization kinetics, the exothermal heat flow peak that occurs during the cooling process can be integrated over a sigmoidal baseline. The parameters for Nakamura Equations 1–3 were determined using a fitting procedure for PA12 and PA12-CF materials, they are presented in Table 3. Figure 4 depicts a comparison of the developed kinetic model predictions with the measured relative crystallinity for various cooling rates.
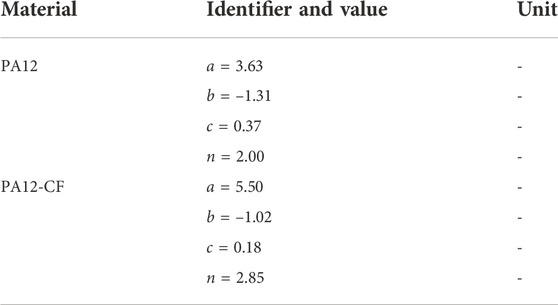
TABLE 3. Parameters for the crystallization kinetics equations.
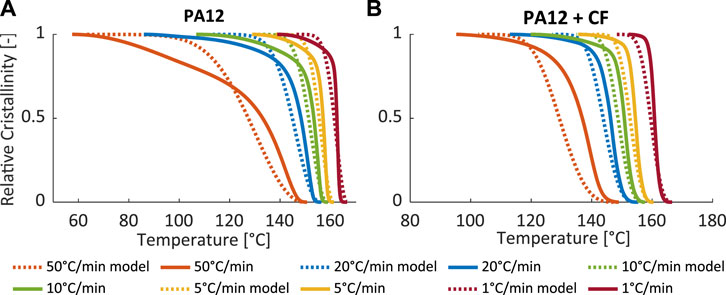
FIGURE 4. Diagram of relative crystallization measurements and fit according to different constant cooling rates (A) PA12 and (B) PA12-CF.
TMA can be used to determine the coefficient of thermal expansion of a material. The thermal expansion was directly measured in a small oven with a small tip on the surface of the specimen using this method. The coefficient of thermal expansion can be calculated using TMA measurements to predict expansion as a function of temperature.
TMA experiments were performed on a Q400 TMA instrument (TA Instruments). A small cubic specimen (approximately 5 mm in edge length) was taken from the consolidated composite material and neat polymer. The cube was positioned in the TMA oven and heated to 15°C below melting temperature (Tm = 180°C), resulting in a final temperature of Tmax = 165°C at a heating rate of 2°C/min. Each measurement was repeated three times. The average measured data and the model fit are shown in Figure 5.
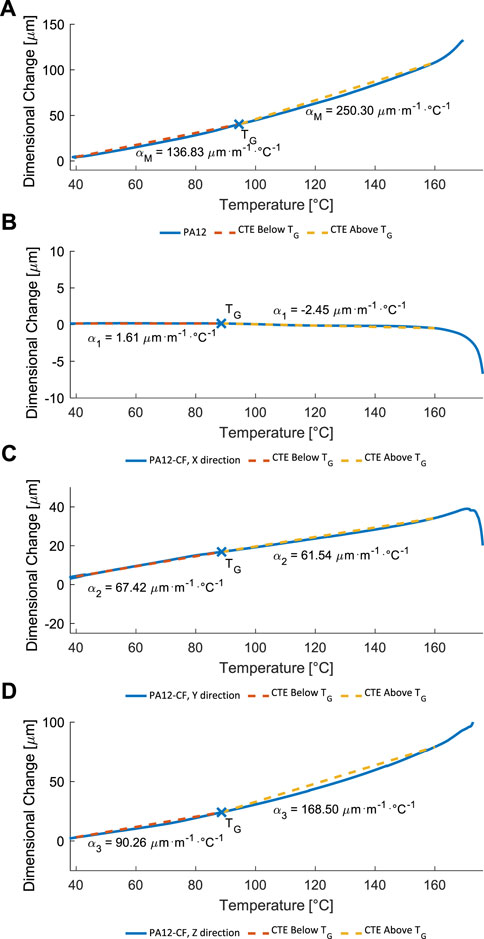
FIGURE 5. TMA results and model fit for the thermal expansion for (A) PA12 and for PA12-CF in (B) fiber (C) transverse, and (D) thickness direction.
In the scope of this study, the CTEs of the fiber in the printing and transverse to the printing directions were not measured. Schürmann (2007) provided a range of possible values for various fiber types. Therefore, from the range of possible values,
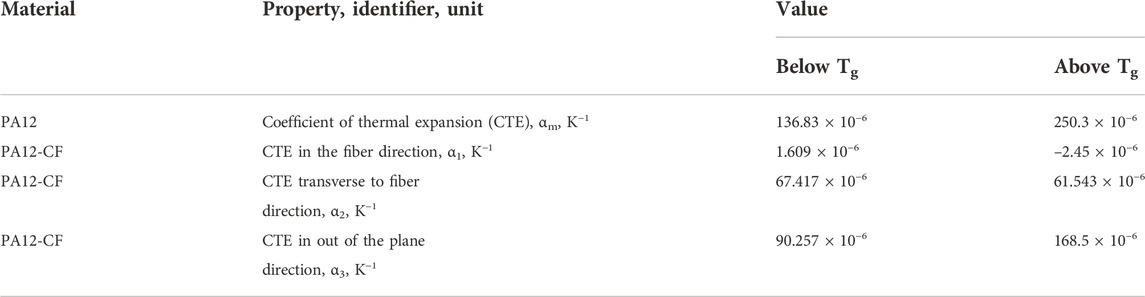
TABLE 4. Measured values of the CTE.
According to the TMA measurements, the CTE of PA12
The material model incorporates the correction coefficients
The authors previously presented the methodology for the computed tomography (CT) measurements (Grieder et al., 2022). The hinges were analyzed by Maxerial (2022). A Waygate v¦tome¦x M300 X-ray computed tomography system with a long-life X-ray source, a high-flux target, and a dynamic 41¦200 Csl scintillation detector was used. The scan parameters were: 60 μm voxel size, 150 kV acceleration voltage, 500 μA tube current, and 75 W power.
The CT analysis was performed on three hinges in total. Two of the hinges (Samples A and B) were consolidated using two different heating parameter sets, whereas the third (Sample U) was not consolidated and therefore consisted of four individual 3D-printed sub-parts (two subparts from the so-called base plate and two others from the vertical plate of the hinge. Sample A was consolidated according to the established 9 T Labs workflow, while Sample B was consolidated at a lower temperature to investigate the void evolution process and the developed model’s ability to detect improper part consolidation. Table 5 contains information regarding the consolidation setup, initial and final thicknesses of the vertical and base plates, and weight.
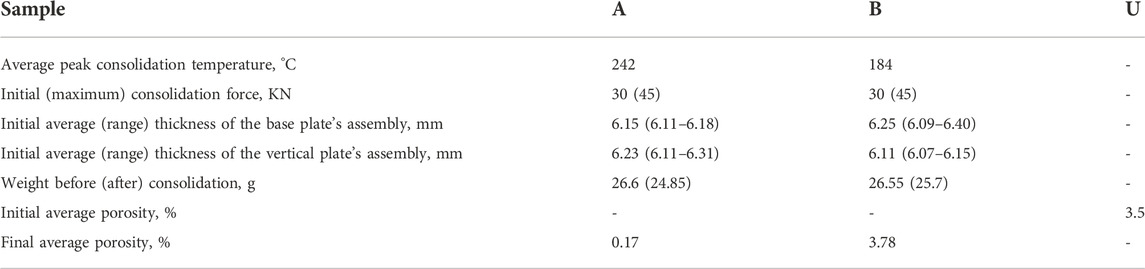
TABLE 5. Process setup and results of the CT analysis.
The general porosity identification algorithm does not capture open porosity (porosity that is not enclosed in the material) and does not properly estimate the void ratio correctly for elongated void channels, which are the most common ones in additive manufacturing. Therefore, the CT analysis of the unconsolidated specimen yielded an unreliably low porosity value (Table 5). Therefore, the initial porosities assigned to the PA12 and PA12-CF materials in the developed numerical model are 15% and 35%, respectively. The initial porosity values assumed were based on previous estimates for simple unidirectional samples (Grieder et al., 2022).
Figure 6 shows 3D overviews of the CT scan results for all three samples. The primary focus of this research is on Sample A, while Sample B is of less interest due to the low consolidation level resulting in poor part quality. 3D overviews of CT scans for Sample B and C are presented in (Supplementary Figures S3,S4).
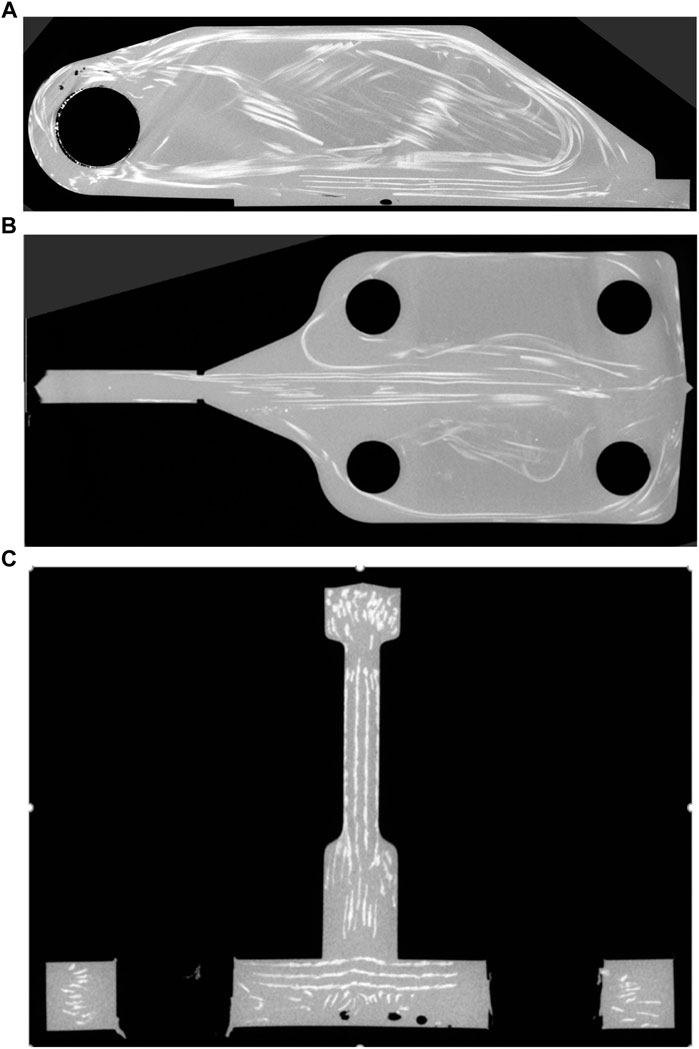
FIGURE 6. Sample (A) CT material density analysis results (A) side view cross-section (B) plane view cross-section, and (C) front view cross-section.
The final void contents of samples A and B are illustrated in Table 5. Figure 7 depicts an overview of the porosity analysis of these samples. The four zones in sample A are denoted by using red rectangles. The CT algorithm detects most of the final porosity in these zones.

FIGURE 7. CT porosity analysis (A) Sample A and (B) Sample (B)
The GD&T flatness method was used to calculate the process-induced deformations of the hinges, where the flatness tolerance refers to two parallel planes that define the zone where the entire reference surface must lie (GD&T, 2022). Figure 8 depicts four pairs of parallel planes that are defined on the base plate. Table 6 compares the CT warpage analysis results to the simulation results in the following model application and validation section.
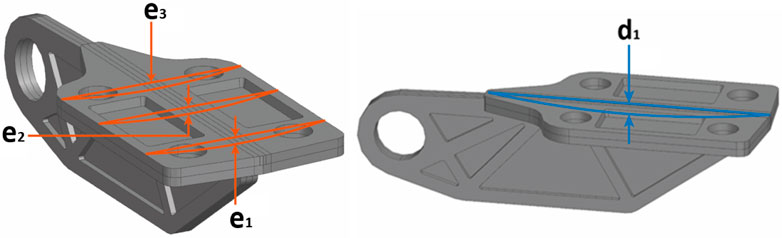
FIGURE 8. Process-induced deformations measurement scheme.
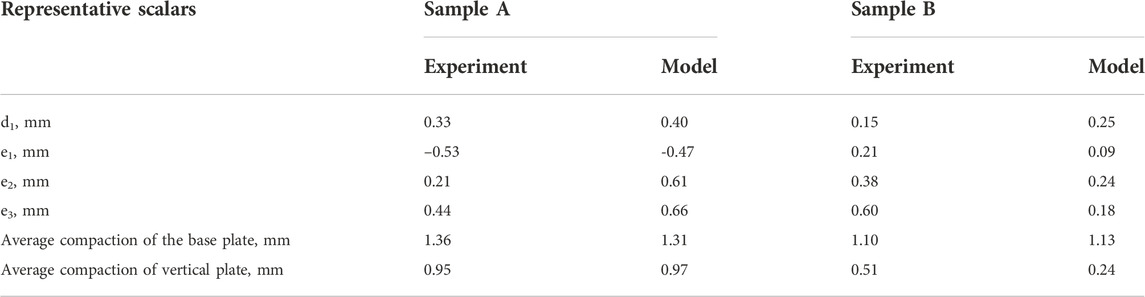
TABLE 6. Measured and simulated the final deformation of the consolidated hinge.
The developed numerical approach was implemented using a user material subroutine in the commercial finite-element software ANSYS (v. 2022 R1). The layup was created using the SpaceClaim plugin Fibrify® and then mapped to 3D finite elements. Data exchange with the using hierarchical data format five ACP.
The results of the developed numerical approach for samples A and B are presented in this section, as demonstrated in the previous section. The crystallization, process-induced deformations, residual stresses, porosity, and squeeze pressure results of the sequentially coupled thermal and mechanical solutions are presented. The model was validated using CT porosity and process-induced deformation analysis results.
The finite-element thermal model considers all three phases of the consolidation: heating, melting, and cooling. The proportional–integral–derivative controllers attached to the heating and cooling channels in the mold provided a temperature regime corresponding to the experimental setup. After 4,000 s, the free convection of the hinge with air was simulated. The boundary conditions for the thermal model are the convection of all the outer mold surfaces with the surrounding air and the radiosity of the outer walls.
The mechanical model only solves this problem for the composite part. The proposed approach involves performing a sequentially coupled thermal-stress analysis in which the temperature field is independent of the stress field. Figure 9 shows the boundary conditions. The release from the mold was simulated by removing all applied forces (after 3,000 s) and displacement constraints (after 4,000 s) and providing a 3-point fixation of the hinge, which allowed simulation of free shrinkage during cooling.
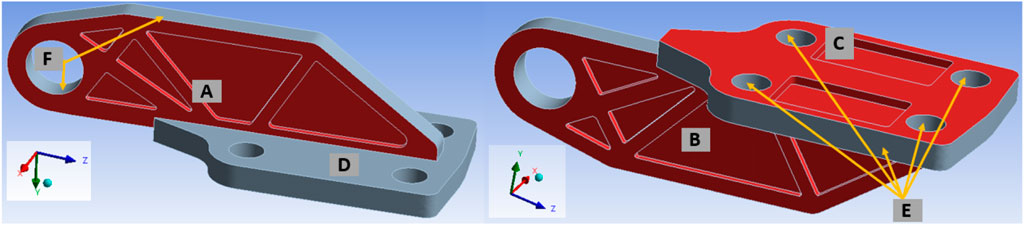
FIGURE 9. Boundary conditions for the mechanical problem: Pressure is applied to the sets of surfaces (A–C) (marked in red). Surface (E) has free displacement only in the y-direction, and Surfaces (D,F) have free displacement only in the x-direction.
The entire tool was modeled in the thermal model using 2′686′092 tetrahedral elements. Only the composite part in the mechanical part was modeled with 84′389 hexahedral elements. The solution is calculated in approximately 24 h and 6 h for the thermal model and the mechanical model, respectively, using four Intel Xeon Gold 2.7 GHz processors and 64 GB of RAM on a 64-bit operating system. The relatively long calculation time of the thermal problem is due to the use of four proportional–integral–derivative thermal controllers using the Ansys Parametric Design language. These controllers could be replaced with the heating flow BC fitted to the experimental data without a significant loss in solution accuracy, resulting in approximately 2 h of calculation.
Figure 10 shows the temperature and crystallization solution. The maximum temperature variation for samples A and B was approximately 90°C and 60°C, respectively. In contrast to Sample A, where all the finite elements reached a fully molten state, Sample B did not reach a fully molten state (the average crystallization degree for all elements was 0.3 at the moment of maximum melting). Because the material state does not change stepwise, the semi-molten state can be considered (Wijskamp 2005; Brauner et al., 2014); it evolves according to the proposed melting kinetics 4) (Grieder et al., 2022). This allowed us to calculate the porosity evolution in the transitional phase, whereas the porosity was assumed to be constant in the solid state.
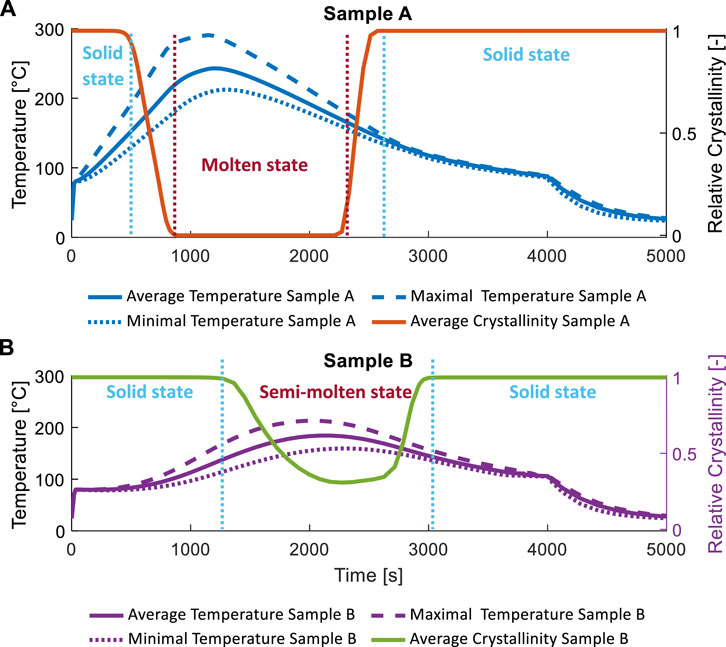
FIGURE 10. Average in domain temperature and crystallization degree (A) Sample A and (B) Sample B.
The base plates of the hinge were subjected to a higher temperature than the vertical plates due to the mold construction. This was true of both samples. In Sample A, however, the melting temperature was reached for all subparts, whereas in Sample B, the vertical plates were not completely molten. The temperature distribution in samples A and B at the maximum temperature is presented in (Supplementary Figures S5,S6).
The evolution of the average fiber volume content ratio in the PA12-CF layup is shown in Figure 11. Both samples started with the same fiber volume ratio because they exhibited the same initial degree of porosity. The final application should have a fiber volume ratio of 0.573, which corresponds to a fully consolidated fiber filament. Sample A achieved this, whereas Sample B was only partially consolidated, resulting in an average fiber volume content of 0.47.
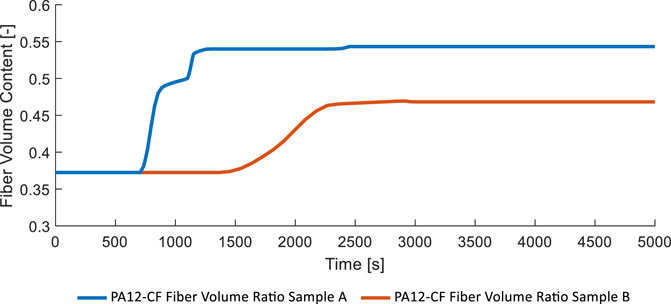
FIGURE 11. PA12-CF fiber volume ratio for Samples (A) and (B)
Figure 12 depicts the process-dependent elastic moduli of the composite in the fiber and transverse directions, as well as the elastic modulus of the pure resin matrix. The initial and final stiffnesses also changed during the process as the fiber volume content changed. According to the proposed mixing rules (5)–(10), porosity influences the final stiffness depending on the fiber volume ratio 18) (Wijskamp 2005; Schürmann 2007; Brauner et al., 2014; Grieder et al., 2022).
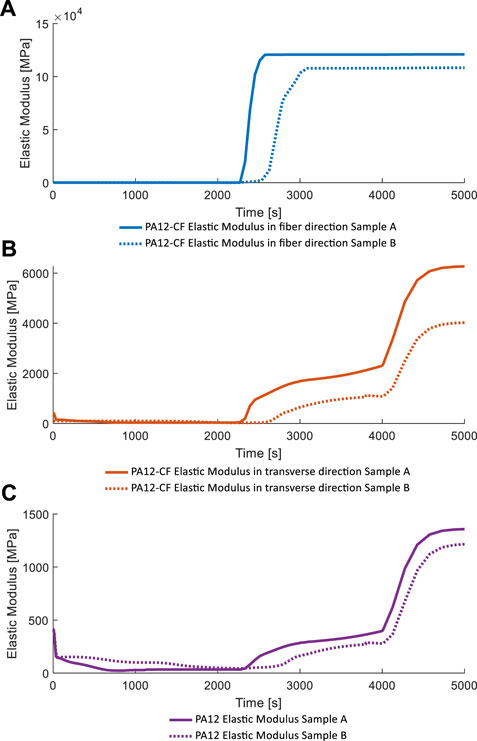
FIGURE 12. Elastic moduli for Samples A and B in (A) fiber direction (B) transverse direction, and (C) for a neat PA12 matrix.
Sample B has not been completely consolidated. It exhibits large gaps between the assembled and nonconsolidated subparts. Therefore, the developed finite-element model fails to accurately predict process-induced deformations because it lacks gaps. Therefore, the following plots only show the results for Sample A. Nonetheless, Table 6 provides a summary of the simulated compaction and warpage for Sample B.
Figure 13 depicts the final deformation of sample A. The original hinge shape is depicted using black contour lines (except for the scaled deformation in Figure 13D). The largest deformation occurred in the base plate based on the printed lay-up and consolidation process conditions. Because of the non-uniform and non-symmetrical temperature distribution during the cooling phase and the non-symmetrical initial assembly of the sub-parts, these deformations are not symmetrical relative to the yz-plane.
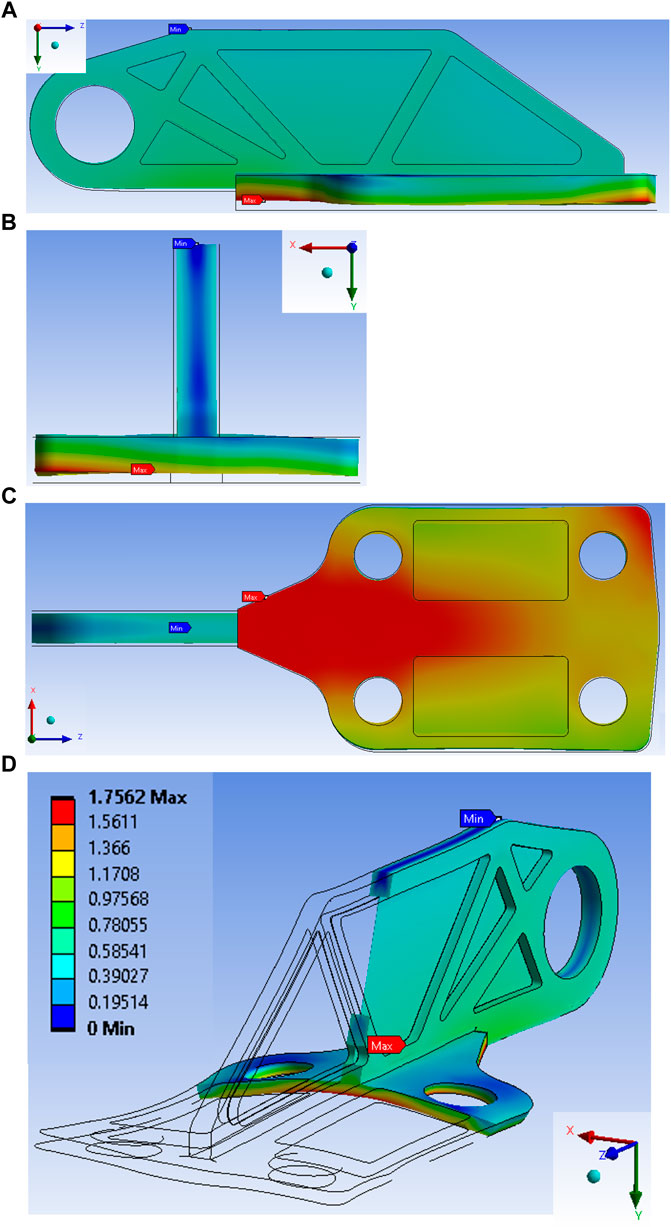
FIGURE 13. Sample (A) Simulated final process-induced deformations in mm (color legend is the same for all the figures) (A) (B) (C) plane views (D) isometric cross-section, the deformation is scaled 3.5 times, the black contour represents the deformed shape of the hidden domain.
Table 6 compares process-induced deformations simulated and experimentally observed at representative points on the base plate (Figure 8). The developed model predicted the average final compaction for the base and vertical plates accurately (the error relative to the initial plate thickness is less than 1% for Sample A and less than 5% for Sample B). The simulated process-induced deformation follows the same trend as the measured deformation: e2 and e3 are bent symmetrically in the middle (Figure 13D), whereas e1 is bent in a more complex manner, with the middle of the representative scalar deformed by less than one of the outer points, resulting in a negative value of e1 (Figure 13C, where the negative sign represents the bending direction).
Table 6 shows that in the case of the fully consolidated hinge, the model provides more accurate predictions. It is explained by the uncertainty in material properties in the semi-molten state, which cannot be measured. Therefore, they were interpolated using the measured values for the solid and molten states and the developed stiffness function 17) (Grieder et al., 2022). Other possible causes of the inaccuracy of the process-induced deformation simulation can be summarized as follows:
• The developed approach has limitations such as the implementation of the elastic model; no pressure gradient is considered in the part due to the simplified porosity approach; insufficient quality of the finite element mesh; and/or relatively large time steps (the average model time step is 15 s). Consideration of advanced viscoelastic models in conjunction with the full Darcy equations and further investigation of the dependence of the model sensitivity on the mesh could improve the model predictions.
• Inaccurate measurement and consideration of the initial thickness and porosity of the hinge parts: the thicknesses of the base and vertical plates varied slightly in the experiment, whereas the model assumed they were uniform. Furthermore, the model assumes zero initial warpage and stresses, whereas the printed hinge sub-parts have process-induced local deformations due to manufacturing. Some important features (such as air gaps between the subparts) were overlooked, which could be critical for predicting the final warpage.
Figure 14 depicts the directional stresses in the PA12-CF layup. The provided finite-element mesh resolution was insufficient for mapping the composite layup without sharp edges and breaks in the fiber path. Therefore, the maximum and minimum observable stresses are discovered at the finite-element singularity points, which do not accurately represent the final stress states at these locations.
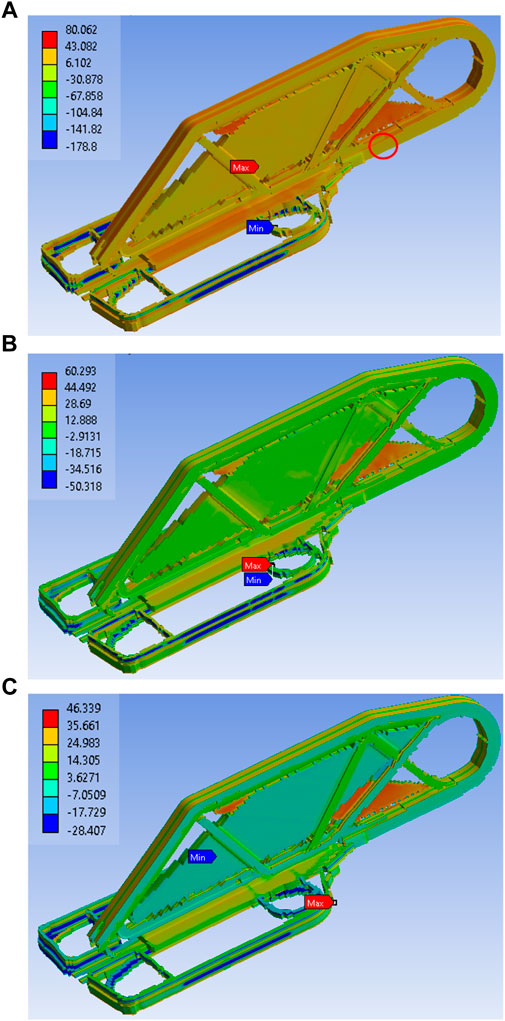
FIGURE 14. Final stress distribution in Sample A in (A) fiber (B) transverse, and (C) thickness direction.
Figure 15 depicts the directional stresses in the PA12-CF element (the element is marked with a red circle in Figure 14A). Because the considered fiber filament element is where hinge failure starts during mechanical tests, residual stresses in this location are critical for hinge performance.
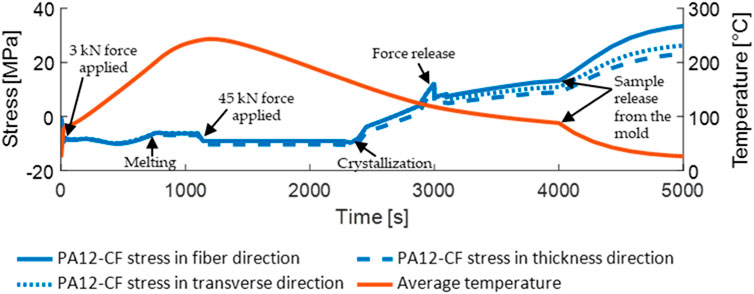
FIGURE 15. Process-induced stress in fiber, transverse, and thickness direction for the vertical plate’s PA12-CF element in Sample A.
The developed model predicts local process-induced void reduction using Eqs 19–30. Figure 16 depicts the average porosity evolution for Samples A and B. In both cases, the void change occurs only after melting. However, before the additional pressure was applied, Sample A exhibited a decrease in porosity (with 30 kN pressure applied, before 1–100 s). The porosity decreased below 0.1% after the additional pressure (up to 45 kN, after 1–100 s). In contrast, sample B exhibited a lower porosity reduction. Therefore, a two-step pressure application did not influence the porosity reduction because no melting state was reached before the application of 45 kN. The final simulated average void content was 0.43% for sample A and 4.3% for sample B, which are close to CT values of 0.17% and 3.78%, respectively (Table 5).
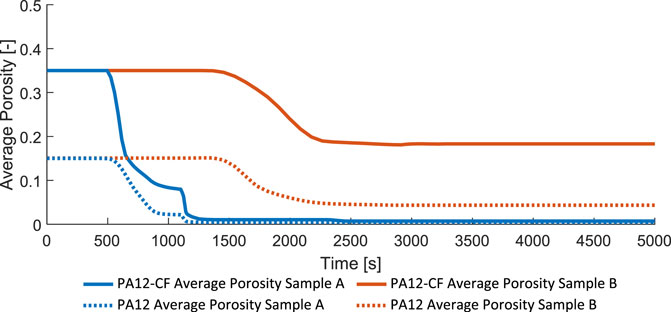
FIGURE 16. Average porosity in PA12 and PA12-CF finite elements for Samples (A) and (B)
Figure 17A B depicts cross-sections of Sample A, with zone 1–5 markers indicating the local final porosity. Because there was only porosity in the internal elements of Sample A, cross-sections are shown. Therefore, the porosity was not visible on the surface of the hinge (which fits the CT data, Figure 7A). Five zones were defined based on the cross-sectional analysis to represent the parts of the hinge where the void content reached maximum values (or did not fully reach the consolidated state). For zones 1–4, the simulation results showed the same local void content distribution as the CT scans. However, the model predicts nonzero porosity for zone five, although the CT scan is fully consolidated.
In contrast to Sample A, the porosity evolution in Sample B resulted in a non-zero void content throughout the vertical plate and in specific locations throughout the base plate. The porosity distribution on the outer surface of Sample B is depicted in Figure 17C. Such local void formation is caused by the observed low temperature in the vertical plate and corresponds to the porosity determined using CT analysis (Figure 7B).
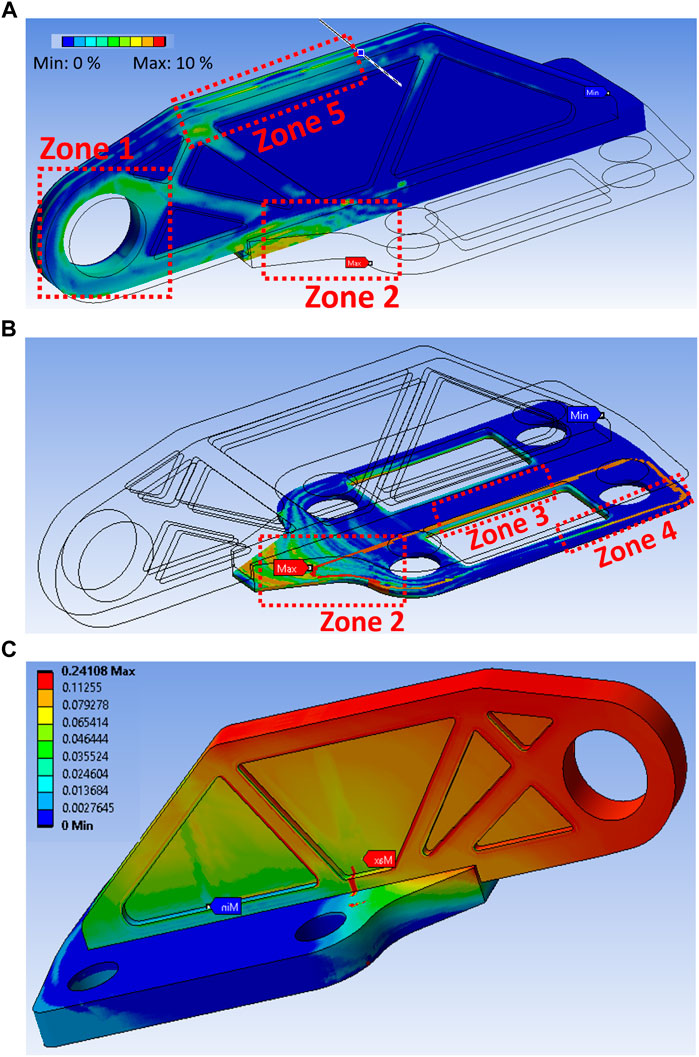
FIGURE 17. Porosity distribution (A) Sample A vertical plate cross-section (B) Sample A base plate cross-section and (C) Sample (B)
The approach presented here does not allow for the simulation of material redistribution and fiber movement in the molten state. However, directional squeeze flows can be numerically analyzed. The results of this analysis can be compared to the fiber movement visualized using CT. Figure 18 shows the calculated directional squeeze pressures for the entire domain of Sample A.
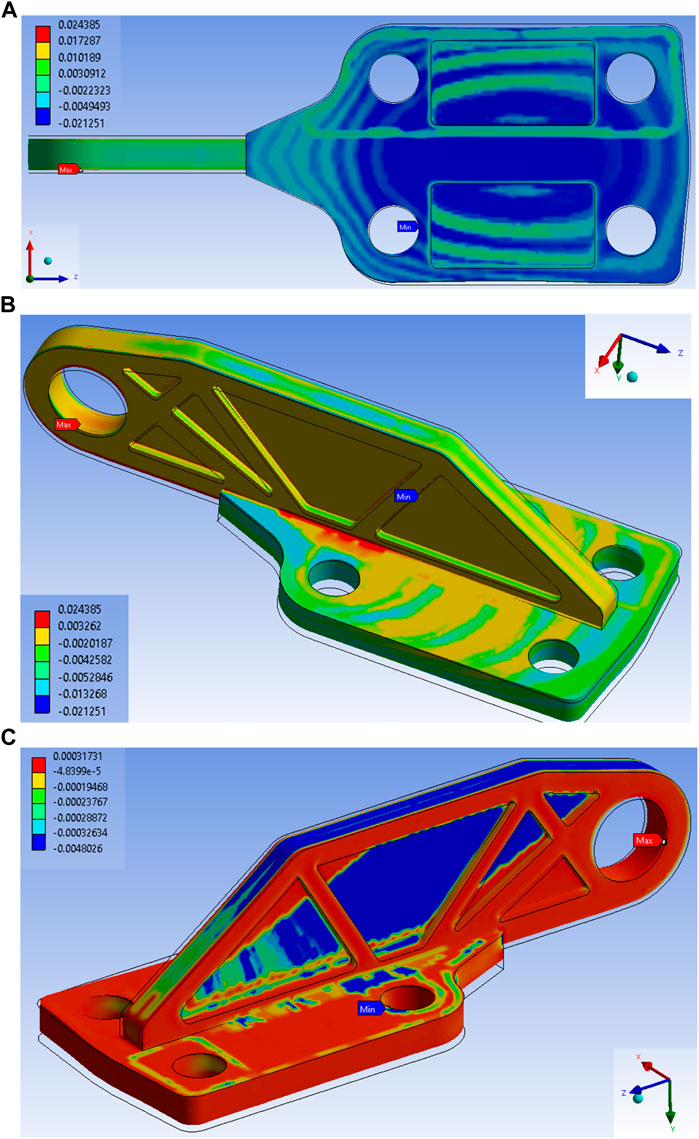
FIGURE 18. Squeeze pressure Sample A: (A) (B) in transverse direction (C) in thickness direction.
The simulation results agree well with the CT-analysis presented above.
• Figure 20A shows that the minimum negative values of the transverse squeeze pressure in the direction were reached at the center of the base plate. This indicates that a significant amount of material flows to this region, resulting in a strong fiber outflow. Figure 6B depicts this, with the fiber movement of the base plate visible.
• Figure 20B shows the maximum positive squeeze flow between the two round inserts in the center of the base plate. This causes material to flow out of this area (zone 2). Therefore, this area exhibits a relatively high void content. (Figure 7A).
• Figure 20C shows that the majority of the squeeze pressure was achieved in the vertical plate lay-up and in zones 2, 3, and 4, which exhibited the highest degree of porosity.
Detailed analysis of squeeze pressure distribution in selected layups is given in (Supplementary Figure S9). Such an analysis allows prediction of the fiber flow, which is essential for structural performance of consolidated composites.
In this study, the composite consolidation process was investigated experimentally and numerically. The initial and final porosities, CTEs, and crystallization and melting kinetics of the pure PA12 and composite PA12-CF materials were determined experimentally. On the basis of these findings, a mathematical model for the consolidation process was developed and numerically solved using the finite element method. By considering the orthotropic composite properties, the proposed finite-element model predicts the final process-induced deformations of the consolidated part. Temperature, crystallization, and porosity all influence these deformations. The proposed model can predict the final composition of a part with high accuracy. The predicted warpage followed the same trend as the observed warpage. However, their absolute values differed. This difference could be caused by various factors, including inaccuracy of the thermal simulation, limitations in the simplified porosity model, defined homogenization mixing rules, imprecision in the initial data provided to the model, and inaccuracy in the CT measurements. The developed approach includes a set of design variables that must be adjusted for each material and composite structure. Furthermore, due to the ACP fiber filament mapping method, the model is extremely sensitive to the finite element mesh. Nonetheless, the developed approach enables rapid simulation of the consolidation process considering multiple physical and structural effects. The final residual stresses and porosity are predicted by the model. This is an important step toward achieving “first time right” composite production. The proposed approach provides a digital model of the consolidation process, which reduces the number of expensive prototyping iterations. The combination of highly accurate 3D-printing and post-printing consolidation, as well as the ANSYS finite-element model and fiber filament layup design, allows for the transition to serial production of additively manufactured continuous fiber composite parts.
The authors intend to use a local initial porosity distribution that depends on the printing process parameters and layup in a future study. Furthermore, novel measurement techniques to investigate porosity and crystallization are required.
The original contributions presented in the study are included in the article/Supplementary Material, further inquiries can be directed to the corresponding author.
CB conceptualization, writing—review and editing, supervision, and project administration. MA conceptualization, methodology, software, writing—editing, project administration. SG and IZ methodology, software, investigation, formal analysis, writing—original draft, writing—review and editing, and visualization. MK methodology. JB, PI, and JF methodology, software, writing—editing. ME conceptualization and supervision. All the authors have read and agreed to the published version of the manuscript.
This research was supported by the national funded project AddFu (Grant Number 38729.1 IP-ENG), which was supported by Innosuisse, Swiss Innovation Promotion Agency.
The CT-analysis of the material distribution, the local porosity, and process-induced warpage was performed by the maXerial company. The authors thank maXerial for accurate analysis, attention to detail, and consideration of the authors’ requests.
The authors declare that the research was conducted in the absence of any commercial or financial relationships that could be construed as a potential conflict of interest.
All claims expressed in this article are solely those of the authors and do not necessarily represent those of their affiliated organizations, or those of the publisher, the editors and the reviewers. Any product that may be evaluated in this article, or claim that may be made by its manufacturer, is not guaranteed or endorsed by the publisher.
The Supplementary Material for this article can be found online at: https://www.frontiersin.org/articles/10.3389/fmats.2022.1068261/full#supplementary-material
Advani, S., and Sozer, E. (2010). Process modelling in composites manufacturing. 2nd ed. Abingdon, UK: CRC Press.
Anisoprint, (2021). Stop metal thinking! Start anisoprinting. Available online: https://anisoprint.com/solutions ((accessed on March 25, 2021).
Arefmanesh, A., Advani, S. G., and Michaelides, E. E. (1990). A numerical study of bubble growth during low-pressure structural foam molding process. Polym. Eng. Sci. 30, 1330–1337. doi:10.1002/pen.760302011
Arefmanesh, A. (1991). Numerical and experimental study of bubble growth in highly viscous fluids. Delaware: University of Delaware ProQuest Dissertations Publishing.
Arevo (2021). Making the world lighter. https://arevoinc.com/products?lang=en ([accessed on March 25, 2021).
Authour Anumous, (2022). Your all-in-one solution for digital composite production. https://www.9tlabs.com (accessed on August 29, 2022).
Barari, B., Simacek, P., Yarlagadda, S., Crane, R., and Advani, S. G. (2020). Prediction of process-induced void formation in anisotropic fiber-reinforced autoclave composite parts. Int. J. Mat. Form. 13, 143–158. doi:10.1007/s12289-019-01477-4
Bellehumeur, C., Li, L., Sun, Q., and Gu, P. (2004). Modeling of bond formation between polymer filaments in the fused deposition modeling process. J. Manuf. Process. 6, 170–178. doi:10.1016/S1526-6125(04)70071-7
Benedetti, L., Brulé, B., Decreamer, N., Evans, K. E., and Ghita, O. (2019). Shrinkage behaviour of semi-crystalline polymers in laser sintering: PEKK and PA12. Mat. Des. 181, 107906. doi:10.1016/j.matdes.2019.107906
Bhandari, S., Lopez-Anido, R. A., and Gardner, D. J. (2019). Enhancing the interlayer tensile strength of 3D printed short carbon fiber reinforced PETG and PLA composites via annealing. Addit. Manuf. 30, 100922. doi:10.1016/j.addma.2019.100922
Blok, L. G., Longana, M. L., Yu, H., and Woods, B. K. S. (2018). An investigation into 3D printing of fibre reinforced thermoplastic composites. Addit. Manuf. 22, 176–186. doi:10.1016/j.addma.2018.04.039
Borowski, A., Vogel, C., Behnisch, T., Geske, V., Gude, M., and Modler, N. (2021). Additive manufacturing-based in situ consolidation of continuous carbon fibre-reinforced polycarbonate. Materials 14, 2450. doi:10.3390/ma14092450
Brauner, C. (2013). Analysis of process-induced distortions and residual stresses of composite structures. Berlin, Germany: Logos Verlag Berlin GmbH.
Brauner, C., Block, T. B., and Herrmann, A. S. (2011). Meso-level manufacturing process simulation of sandwich structures to analyze viscoelastic-dependent residual stresses. J. Compos. Mat. 46 (7), 783–799. doi:10.1177/0021998311410498
Brauner, C., Peters, C., Brandwein, F., and Herrmann, A. (2014). Analysis of process-induced deformations in thermoplastic composite materials. J. Compos. Mat. 48, 2779–2791. doi:10.1177/0021998313502101
Brenken, B., Barocio, E., Favaloro, A., Kunc, V., and Pipes, R. (2018). Development and validation of extrusion deposition additive manufacturing process simulations. Addit. Manuf. 25, 218–226. doi:10.1016/j.addma.2018.10.041
Brujan, E. A., and Vogel, A. (2006). Stress wave emission and cavitation bubble dynamics by nanosecond optical breakdown in a tissue phantom. J. Fluid Mech. 558, 281–308. doi:10.1017/S0022112006000115
Cable, C. W. (1991). The effect of defects in glass-reinforced plastic (GRP). Mar. Technol. SNAME News 28 (2), 91–98. doi:10.5957/mt1.1991.28.2.91
Calneryte, D., Barauskas, R., Milasiene, D., Maskeliunas, R., Neciunas, A., Ostreika, A., et al. (2018). Multi-scale finite element modeling of 3D printed structures subjected to mechanical loads. Rapid Prototyp. J. 24 (1), 177–187. doi:10.1108/RPJ-05-2016-0074
Eguemann, N., Giger, L., Roux, M., Dransfeld, C., Thiebaud, F., and Perreux, D. (2013). “Compression moulding of complex parts for aerospace with discontinuous novel and recycled thermoplastic composite materials,” in 19th International conference on composite materials, Paris, France, January 23 - 24, 2017, 1–11.
Eom, Y., Boogh, L., Michaud, V., and Manson, J-A. (2001). A structure and property-based process window for void-free thermoset composites. Polym. Compos. 22 (1), 22–31. doi:10.1002/pc.10512
Flynn, H. G. (1975). Cavitation dynamics. I. A mathematical formulation. J. Acoust. Soc. Am. 57, 1379–1396. doi:10.1121/1.380624
Gaudron, R., Warnez, M. T., and Johnsen, E. (2015). Bubble dynamics in a viscoelastic medium with nonlinear elasticity. J. Fluid Mech. 766, 54–75. doi:10.1017/jfm.2015.7
GD&T (2022). Flatness method. https://www.gdandtbasics.com/flatness (accessed on August 29, 2022).
Gebhardt, A., Kessler, J., and Thurn, L. (2019). 3D printing: Understanding additive manufacturing. 2nd ed. Munich, Germany: Carl Hanser Verlag.
Ghiorse, S. R. (1993). Effect of void contents on the mechanical properties of carbon/epoxy laminates. SAMPE Q. 24 (2), 54–59.
Goh, G. D., Dikshit, V., Nagalingam, A. P., Goh, G. L., Agarwala, S., Sing, S. L., et al. (2018). Characterization of mechanical properties and fracture mode of additively manufactured carbon fiber and glass fiber reinforced thermoplastics. Mat. Des. 137, 79–89. doi:10.1016/j.matdes.2017.10.021
Greco, A., and Maffezzoli, A. (2003). Statistical and kinetic approaches for linear low-density polyethylene melting modeling. J. Appl. Polym. Sci. 89, 289–295. doi:10.1002/app.12079
Gregory, T. M., and Gonzdz, A. S. (2016). Methods for composite filament fabrication in three dimensional printing. US20160346998A1,
Grieder, S., Zhilyaev, I., Küng, M., Brauner, C., Akermann, M., Bosshard, J., et al. (2022). Consolidation of additive manufactured continuous carbon fiber reinforced polyamide 12 composites and the development of process-related numerical simulation methods. Polymers 14, 3429. doi:10.3390/polym14163429
Halpin, J. C., and Kardos, J. L. (1976). The halpin-tsai equations: A review. Polym. Eng. Sci. 16, 344–352. doi:10.1002/pen.760160512
Hardin, R. A., and Beckermann, C. (2007). Effect of porosity on the stiffness of cast steel. Metall. Mat. Trans. A 38, 2992–3006. doi:10.1007/s11661-007-9390-4
Iragi, M., Pascual-González, C., Esnaola, A., Lopes, C. S., and Aretxabaleta, L. (2019). Ply and interlaminar behaviors of 3D printed continuous carbon fiber-reinforced thermoplastic laminates; effects of processing conditions and microstructure. Addit. Manuf. 30, 100884. [CrossRef].
Jaroslav, K. (1999). Correlation between Young's modulus and porosity in porous materials. J. Mat. Sci. Lett. 18 (13), 1007–1010. doi:10.1023/A:1006669914946
Jin, Y., Harry, C. C., and Christian, F. (2020). Extracting non-linear viscoelastic material properties from violently-collapsing cavitation bubbles. Extreme Mech. Lett. 39, 100839. doi:10.1016/j.eml.2020.100839
Joel, D. S., David, R., Luc, P., Celeste, S., and Martin, G. (1997). Flow of polymer melts. Montreal, QC: Physics in Canada.
Koerdt, M., Koerdt, M., Grobrüg, T., Skowronek, M., and Herrmann, A. S. (2022). Modelling and analysis of the thermal characteristic of thermoplastic composites from hybrid textiles during compression moulding. J. Thermoplast. Compos. Mater. 35, 127–146. doi:10.1177/0892705719875204
Leterrier, Y., and G’sell, C. (1994). Formation and elimination of voids during the processing of thermoplastic of matrix composites. Polym. Compos. 15, 101–105. doi:10.1002/pc.750150203
Li, J., Yuan, S., Zhu, J., Li, S., and Zhang, W. (2020). Numerical model and experimental validation for laser sinterable semi-crystalline polymer: Shrinkage and warping. Polymers 12, 1373. doi:10.3390/polym12061373
Long, S. D., Dawood, I., Coates, P. D., and Johnson, A. F. (1995). Influence of reaction injection moulding (RIM) processing variables on the mechanical properties of a commercial linear segmented polyamide. Plast. ubber Compos Process Appl. 23 (3), 161–174.
Lundstrom, T. S., and Gebart, B. R. (1994). Influence from process parameters on void formation in resin transfer molding. Polym. Compos. 15 (1), 25–33. doi:10.1002/pc.750150105
Mahoor, M., Larissa, G., Ignaas, V., and Stepan, V. L. (2018). Voids in fiber-reinforced polymer composites: A review on their formation, characteristics, and effects on mechanical performance. J. Compos. Mat. 53, 1579–1669. doi:10.1177/0021998318772152
Maxerial (2022). https://www.maxerial.io/(accessed on August 29, 2022).
Meng, L., Xiaoyong, T., Junfan, S., Weijun, Z., Dichen, L., and Yingjie, Q. (2019). Impregnation, and interlayer bonding behaviours of 3D-printed continuous carbon-fiber-reinforced poly-ether-ether-ketone composites. Compos. Part A Appl. Sci. Manuf. 121, 130–138. doi:10.1016/j.compositesa.2019.03.020
Moris, A., and Costel, D. D. (1984). A study of the dynamics of foam growth: Analysis of the growth of closely spaced spherical bubbles. Polym. Eng. Sci. 24, 1026–1034. doi:10.1002/pen.760241306
Morrissey, L. S., and Nakhla, S. (2018). A finite element model to predict the effect of porosity on elastic modulus in low-porosity materials. Metall. Mat. Trans. A 49, 2622–2630. doi:10.1007/s11661-018-4623-2
Nakamura, K., Katayama, K., and Amano, T. (1973). Some aspects of nonisothermal crystallization of polymers II - consideration of the isokinetic condition. J. Appl. Polym. Sci. 17, 1031–1041. doi:10.1002/app.1973.070170404
Nakamura, K., Watanabe, T., Katayama, K., and Amano, T. (1972). Some aspects of nonisothermal crystallization of polymers I - relationship between crystallization temperature, crystallinity, and cooling conditions. J. Appl. Polym. Sci. 16, 1077–1091. doi:10.1002/app.1972.070160503
Negi, S., and Rajesh, S. (2016). Study on shrinkage behaviour of laser sintered PA 3200GF specimens using RSM and ANN. Rapid Prototyp. J. 22, 645–659. doi:10.1108/rpj-08-2014-0090
Rodriguez, J. F., Thomas, J. P., and Renaud, J. E. (2000). Characterization of the mesostructure of fused-deposition acrylonitrile-butadiene-styrene materials. Rapid Prototyp. J. 6 (3), 175–186. doi:10.1108/13552540010337056
Roychowdhury, S., Gillespie, J. W., and Advani, S. G. (2001). Volatile-induced void formation in amorphous thermoplastic polymeric materials: I. Modeling and parametric studies. J. Compos. Mat. 35, 340–366. doi:10.1177/002199801772662208
Roychowdhury, S. (1995). Void formation and growth in amorphous thermoplastic polymeric materials. Delaware: University of Delaware ProQuest Dissertations Publishing.
Schürmann, H. (2007). Konstruieren mit Faser-Kunststoff-Verbunden 2. Auflage. Berlin, Germany: Springer-Verlag.
Skempton, A. W. (1960). “Terzaghi’s discovery of effective stress,” in From theory to practice in soil mechanics. Editors L. Bjerrum, A. Casagrande, R. B. Peck, and A. W. Skempton (New York: Wiley), 42–53.
Wagh, A. S., Poeppel, R. B., and Singh, J. P. (1991). Open pore description of mechanical properties of ceramics. J. Mat. Sci. 26, 3862–3868. doi:10.1007/BF01184983
Wang, J., Xie, H., Weng, Z., Senthil, T., and Wu, L. (2016). A novel approach to improve mechanical properties of parts fabricated by fused deposition modeling. Mat. Des. 105, 152–159. doi:10.1016/j.matdes.2016.05.078
Wijskamp, S. (2005). “Shape distorsion in composite forming,”. [PhD thesis] ([Enschede, Netherlands]: University of Twente).
Wood, J. R., and Bader, M. G. (1994). Void control for polymer-matrix composites (1): Theoretical and experimental methods for determining the growth and collapse of gas bubbles. Compos. Manuf. 5, 139–147. doi:10.1016/0956-7143(94)90023-X
Xue, W., Liping, Z., Jerry, Y. H. F., and Heow, P. L. (2019). Effect of porosity on mechanical properties of 3D printed polymers: Experiments and micromechanical modeling based on X-ray computed tomography analysis. Polymers 11 (7), 1154. doi:10.3390/polym11071154
Yohann, L., Robert, P., Fabrice, S., Laurent, M., and Gérard, B. (2008). “Modeling of void growth mechanisms during the manufacturing of composite laminates,” in 9th International Conference on Flow Processes in Composite Materials - FPCM-9, Montréal, Canada, 1–9.
Zhang, J., Zhou, Z., Zhang, F., Tan, Y., Tu, Y., and Yang, B. (2020). Performance of 3D-printed continuous-carbon-fiber-reinforced plastics with pressure. Materials 13, 471. doi:10.3390/ma13020471
Zingraff, L., Michaud, V., Bourban, P.-E., and Manson, J.-A. E. (2005). Resin transfer moulding of anionically polymerised polyamide 12. Compos. Part A Appl. Sci. Manuf. 36, 1675–1686. doi:10.1016/j.compositesa.2005.03.023
Zingraff, L. (2004). “Void formation and transport during liquid composite molding and forming of reactive thermoplastic composites,”. [PhD Thesis] (Lausanne, Switzerland: EPFL).
Keywords: additive manufacturing, fiber-reinforced composites, additive fusion, consolidation, process-induced deformations, porosity evaluation, consolidation simulation
Citation: Zhilyaev I, Grieder S, Küng M, Brauner C, Akermann M, Bosshard J, Inderkum P, Francisco J and Eichenhofer M (2022) Experimental and numerical analysis of the consolidation process for additive manufactured continuous carbon fiber-reinforced polyamide 12 composites. Front. Mater. 9:1068261. doi: 10.3389/fmats.2022.1068261
Received: 12 October 2022; Accepted: 23 November 2022;
Published: 12 December 2022.
Edited by:
Lode Daelemans, Ghent University, BelgiumReviewed by:
Zoltan Major, Johannes Kepler University of Linz, AustriaCopyright © 2022 Zhilyaev, Grieder, Küng, Brauner, Akermann, Bosshard, Inderkum, Francisco and Eichenhofer. This is an open-access article distributed under the terms of the Creative Commons Attribution License (CC BY). The use, distribution or reproduction in other forums is permitted, provided the original author(s) and the copyright owner(s) are credited and that the original publication in this journal is cited, in accordance with accepted academic practice. No use, distribution or reproduction is permitted which does not comply with these terms.
*Correspondence: Igor Zhilyaev, emhpbHlhZXZAZmhudy5jaA==
Disclaimer: All claims expressed in this article are solely those of the authors and do not necessarily represent those of their affiliated organizations, or those of the publisher, the editors and the reviewers. Any product that may be evaluated in this article or claim that may be made by its manufacturer is not guaranteed or endorsed by the publisher.
Research integrity at Frontiers
Learn more about the work of our research integrity team to safeguard the quality of each article we publish.