 Memduh Karalar
 Murat Çavuşlu
 Hakan Ozturk
 Necati Mert2
 Mahmood Ahmad
 Mohanad Muayad Sabri Sabri
95% of researchers rate our articles as excellent or good
Learn more about the work of our research integrity team to safeguard the quality of each article we publish.
Find out more
ORIGINAL RESEARCH article
Front. Mater. , 08 December 2022
Sec. Mechanics of Materials
Volume 9 - 2022 | https://doi.org/10.3389/fmats.2022.1066129
This article is part of the Research Topic Experimental and Computational Mechanics of Engineering Materials and Structures View all 4 articles
In this study, it is aimed to reveal how anchored and unanchored non-structural elements (NEs) in reinforcement concrete (RC) library structures change the earthquake behaviors of these structures. A library structure is selected for three-dimensional (3D) analysis. First, seismic shake table tests are performed for selected NEs modeled with/without anchorage to the structure. Owing to these seismic tests, the largest seismic displacement values that occurred during 10 different earthquakes on each anchored and unanchored NE are acquired. Then, special seismic loads (e.g., high bookcase loads and heavy table loads) of anchored and unanchored NEs are calculated, taking into account the ASCE/SEI 7-16 seismic design code and the 2018 Turkish Building Earthquake Code (TBEC). Seismic spring values of NEs are calculated using the obtained seismic forces and maximum seismic displacements for the NEs. Then, these spring values are applied to the base of the NEs in the 3D model of the structure, and 10 different earthquake analyses are conducted for the library structures with anchored and unanchored NEs. According to the numerical results, the seismic effects of NEs on the earthquake behavior of RC library structures are evaluated for two different seismic design codes in detail, and it is concluded that NEs should not be neglected while modeling and analyzing RC library structures. It is seen from the seismic analyses that for the TBEC, 37, 56, and 126 mm maximum seismic displacements are observed on the library structure for structures without NEs, structures with unanchored NEs, and structures with anchored NEs, respectively. Moreover, for the ASCE code, 32, 45, and 119 mm maximum displacements are seen on the library structure for structures without NEs, structures with unanchored NEs, and structures with anchored NEs, respectively. It is clearly understood that anchored or unanchored NEs have different seismic effects on the 3D earthquake behavior of library structures.
Recently, it has become very important that structural and non-structural elements (NEs) in library structures are in harmony with each other during an earthquake. Considering the earthquakes that occurred in the past, it has been observed that many deaths occurred due to NEs being damaged during ground motions. If NEs are damaged, evacuating from structures becomes difficult for people. In addition, damage to NEs in less strong earthquakes limits the functionality of critical structures (e.g., hospitals, library buildings, and fire stations). As a result, considering that NEs constitute 70%–80% of the total construction cost and can cause great loss of property and life damage, the investigation of the seismic behavior of these elements is of great importance in terms of earthquake engineering. Moreover, the failure of NEs can affect the operational capacity of critical facilities, such as libraries, hospitals, and fire stations, which can cause an increase in the number of deaths (Cicek and Sar, 2020). In the literature, there are no studies on the seismic behavior of NEs in library structures. Consistent floor response spectra for the performance-based seismic design of NEs were observed in detail, and an improved procedure was developed for estimating consistent floor response spectra for building structures subjected to low and medium-high seismic intensities (Merino et al., 2019). Then, the seismic performance of NEs during the 2016 central Italy earthquake was investigated, and it highlighted the need to introduce seismic regulations devoted to improving the seismic performance of NEs and reducing the associated economic losses, loss of functionality, and potential threats to life safety (Perrone et al., 2019). In addition, relative displacement floor spectra for the seismic design of NEs were assessed, and a new method was proposed to predict the floor spectra on the single-degree-of-freedom supporting structures (Calvi, 2014). Seismic acceleration demands on building NEs were evaluated in detail, and the results showed that even low levels of non-linearity in the NEs or their attachment to the structure lead to significant reductions in acceleration demands (Kazantzi et al., 2020). Earthquake damages to NEs in the RC buildings during the 2011 Van earthquake were observed, and it was shown that to limit the failure of NEs enclosed within an RC frame, design and construction requirements should be included in the seismic code by adopting suitable solutions for both in-plane and out-of-plane behavior (Yön et al., 2019). Then, strength-reduction factors for the design of light NEs in buildings were investigated, and approximate equations to estimate component strength-reduction factors computed through non-linear regression analyses were proposed (Kazantzi et al., 2020). Floor response spectra for moderately heavy NEs attached to ductile frame structures were evaluated in detail, and it was evidenced that the proposed methodology delivers sufficiently accurate predictions of the seismic peak response of simple vibration-prone NEs on ductile load-bearing structures (Adam et al., 2013). The seismic behavior of NEs in recent earthquakes was investigated, and it was indicated that in Haiti, structural and non-structural damages were widespread after the 2010 earthquake, and much of the structural damage was caused by the unintended interaction between rigid non-structural infill walls and light RC frames (Fierro et al., 2012). Moreover, the automated seismic design of NEs was evaluated, and the effectiveness of using building information models in the seismic design of NEs was discussed (Perrone and Filiatrault, 2017). The cost-based design of NEs for tall buildings under extreme wind environments was assessed in detail, and a systematic comparative cost-based analysis was proposed considering the damage on the NE level induced by extreme wind loads (Lerimonti et al., 2019). Then, damage to NEs in the 2016 Kaikōura earthquake was evaluated. Damage to NEs in multi-story commercial buildings was the focus, in particular, damage to the following: suspended ceilings, suspended services, glazing, precast panels, internal linings, seismic gaps, and contents (Baird and Ferner, 2017). The seismic behaviors of NEs during the 2003 Iran earthquake were observed. Some recommendations were made that will be useful for modification of the “Guidelines for the Seismic Retrofit of Existing Buildings,” which is the only official reference used currently in Iran (Hosseini, 2005). Furthermore, a comparison of the building code for the design of NEs was carried out, and it was indicated that damages to NEs such as access floors, telecommunication equipment, and others have caused the interruption of operations and large economic losses (Kug-Kwan et al., 2013). In another study, the performance of steel buildings and NEs during the 27 February 2010 Maule (Chile) earthquake was observed, and a summary of structural and non-structural damages in the buildings and a comparison of Chilean and Canadian design practices for steel buildings were presented (Saatcioglu et al., 2013). The seismic performance of NEs in the wood frame structures was investigated, and it was concluded that the allowable seismic mass can be significantly increased when NEs are included in the design, in some cases, to more than 70% (Lindt and Liu, 2007). Braga et al. examined the performance of non-structural components in RC buildings, considering strong ground motions. According to numerical analyses, it was concluded that a comprehensive approach to NSE, including infills and partitions in RC-framed buildings, is currently not available (Braga et al., 2011). Mosqueda et al. performed experimental tests of non-structural components under full-scale floor motions. The new testing capabilities provided by the University at Buffalo non-structural component simulator (UB-NCS) are described to demonstrate the improved and more realistic qualification procedures that can be achieved (Mosqueda et al., 2009). Challagulla et al. assessed the seismic response of structures with sliding NEs. A numerical model that describes the response of the single-degree-of-freedom (SDOF) structure supporting two rigid blocks with a possibility to slide was developed (Challagulla et al., 2020). Moreover, Sullivan (2020), Berto et al. (2020), Gabbianelli et al. (2020), Filiatrault et al. (2021), Merino et al. (2020), Zhai et al. (2016), Hofer et al. (2018), and Cicek and Sar (2020) investigated the effects of NEs on the earthquake behavior of the structures.
These studies in the literature show that there are no studies on the seismic performance of anchored and unanchored NEs during earthquakes in library structures. In addition, according to seismic design codes, seismic effects of anchored and unanchored NEs on 3D earthquake performances of RC library buildings have not been observed in the past in detail. Therefore, one of the most important objectives of this study is to determine the behavior of anchored and unanchored library NEs during earthquakes using the ASCE 7-15 seismic design code and the 2018 Turkish Building Earthquake Code (TBEC). Furthermore, in the literature, it is observed that seismic spring values of NEs are not used for modeling or are considered a random value. For this reason, another aim of this study is to calculate the spring values of library NEs as a near-real value using shake table tests and special seismic design codes. Consequently, this research study is very significant to fill these absences in the literature.
In this study, the non-linear seismic behavior of an RC library building is observed in view of different NEs and fault distances. All structural elements (beams, columns, and foundations) are modeled according to the original project. First, seismic shake table tests are conducted for selected library NEs under 10 different near-fault and far-fault earthquakes. Due to these seismic tests, the largest seismic displacement values that occurred during these various earthquakes on each anchored and unanchored NE are acquired. Then, special seismic design loads of library NEs are calculated using seismic design codes (TBEC and ASCE) specially derived for selected NEs. The ASCE regulation is used by many countries of the world for the design of structures. Furthermore, Turkey is located in a very important earthquake zone, and the TBEC is used for modeling and analysis of structures in Turkey. For this reason, these two important regulations are considered for the seismic analysis of RC library structures in this study. By using the maximum seismic displacement values obtained as a result of the shake table tests and the calculated seismic design codes, specific seismic spring values are calculated for each NE. Moreover, in this study, it is aimed to reveal that the seismic behaviors of anchored and unanchored NEs are different from each other and that anchored and unanchored NEs have different seismic effects on the seismic behaviors of library structures. For this purpose, an RC library structure is analyzed only by considering the structural elements (without NEs). Then, NEs are modeled in the RC structure by considering calculated seismic spring values, and the building is analyzed considering anchored and unanchored NEs. According to the 3D numerical analysis results, seismic displacements, seismic moments, and spectral accelerations for buildings with/without NEs and buildings with anchored/unanchored NEs are compared in detail. As a result of numerical analyses, it is aimed to investigate how anchored or unanchored NEs change the seismic behavior of RC structures.
In the literature, it is observed that NEs have not been taken into account in structural modeling. The assumption that NEs do not carry any force is the main reason for this. However, many recent studies show that NEs meaningfully affect the seismic behaviors of the structures, and the importance of NEs has just begun to be understood consistently with these studies (Cavuslu, 2022). Ensuring the safety of humans and other creatures is the main purpose of designing the seismic behavior of NEs. To this end, efforts are made to fix NEs to the supporting structure and to minimize the possibility of internal damage to NEs, especially in critical facilities. The seismic design requirements used in many countries have shown that NEs are designed based on the basic assumption that they can be dynamically separated from the structural system to which they are anchored (Cavuslu, 2022). When the standards for the seismic design of NEs in places such as the United States, Turkey, Europe, and New Zealand are observed, it is observed that the seismic design of anchored NEs begins with the calculation of the design forces of the elements in the horizontal and/or vertical directions (Figure 1).
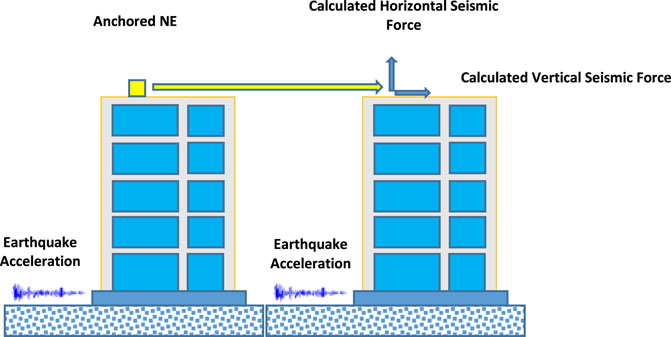
FIGURE 1. Application of calculated seismic design loads to the structure (Murty et al., 2012; Cavuslu, 2022).
Lately, many countries have made a particular provision about the seismic force design of NEs (such as the 2018 Turkish Building Earthquake Code (TBEC), ASCE/SI 7-30, Eurocode 8, International Building Code, Uniform Building Code, and New Zealand Code). Anchored NEs can be modeled according to these force-based seismic design codes (Cavuslu, 2022). While anchored NEs are modeled according to the seismic design method, it is proposed that NEs should be modeled in the structure as if these are horizontal/vertical forces (Figure 1). Within these requirements, separate formulations have been formed for each NE. While ground motion affects the structure base, it is evident that each floor level has variable earthquake acceleration values (Figure 2). To put it another way, seismic design forces of anchored NEs are calculated separately for each floor of the structure (Cavuslu, 2022). Also, while modeling unanchored NEs, special spring elements are defined under the element. Unanchored NEs are modeled by defining a special spring at their base (Figure 3).
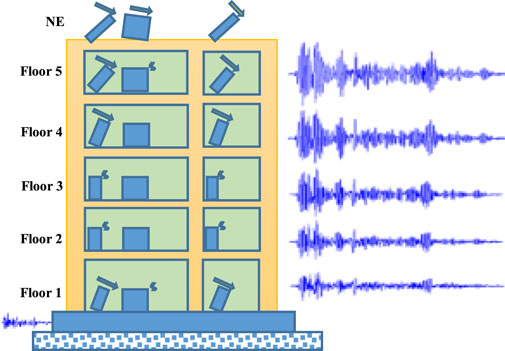
FIGURE 2. Acceleration histories acting on different floors (Murty et al., 2012; Cavuslu, 2022).
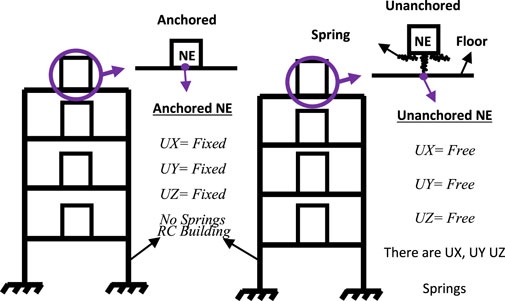
FIGURE 3. Modeling of anchored and unanchored NEs in seismic analyses (Cavuslu, 2022).
Non-structural elements (NEs) have enormous structural effects on the seismic behavior of library structures (Cavuslu, 2022). However, NEs are not given sufficient importance in structural engineering, and these elements are not included in structural modeling and structural analyses. For this reason, to eliminate this deficiency in the literature, the seismic behavior of NEs is determined using shake table tests (Cavuslu, 2022). In the shake table tests, two different library NEs (table and bookcase) are used, and a total of 10 different earthquake analyses are performed for shake table tests PEER, NGA (2010). The earthquakes used in the experiments are important earthquakes that occurred in different parts of the world (Cavuslu, 2022). Seismic tests are started by defining the earthquake accelerations to the shake table. Shake table tests are performed for situations with anchored and unanchored NEs (Cavuslu, 2022). Special anchor rods are manufactured to anchor NEs to the shake table, as seen in Figure 4.
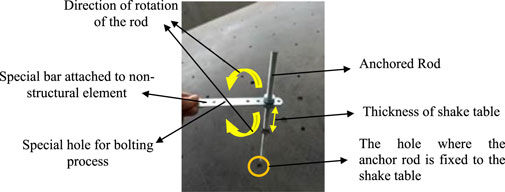
FIGURE 4. View of the anchorage rod for NEs (Cavuslu, 2022).
In the experimental tests, one end of the anchor rods is fixed to the shake table and the other end is fixed to the feet of the NEs. To understand whether the anchoring is carried out correctly or not, two accelerometers are used on the feet of the NEs and the shake table. The results of the earthquake analyses show that the seismic accelerations on the feet of the NEs and the shake table are the same (Cavuslu, 2022). For this reason, it is concluded that the anchoring process of NEs to the shake table is carried out correctly. As a result of the earthquake analyses, time-dependent acceleration and displacements that occurred during the earthquake on the anchored and unanchored NEs are acquired in detail (Cavuslu, 2022). Then, using different seismic design codes (ASCE 7-15 and the 2018 TBEC) produced for NEs, seismic design loads are calculated for two different NEs. The 2018 TBEC is based on the “Italian Building Instruction for Construction in Earthquake Region” developed in 1940. Later, “Italian Building Instruction for Construction in Earthquake Region” was revised in 1944, 1949, 1953, 1962, 1968, 1975, 1998, 2007, and 2018, and finally, the 2018 TBEC Disaster and Emergency Management Presidency (2018) is used for modeling and analysis of structures in Turkey (Bilgin et al., 2022; Işık, 2022; Yel et al., 2022). Moreover, ASCE standards are updated or reaffirmed by the same process every 5–10 years. These seismic loads are calculated for all floors of the library building (Cavuslu, 2022). Finally, seismic stiffness parameters are calculated for each NE using the direct stiffness method (Figure 5), and these stiffness parameters are used for the three-dimensional modeling of NEs.
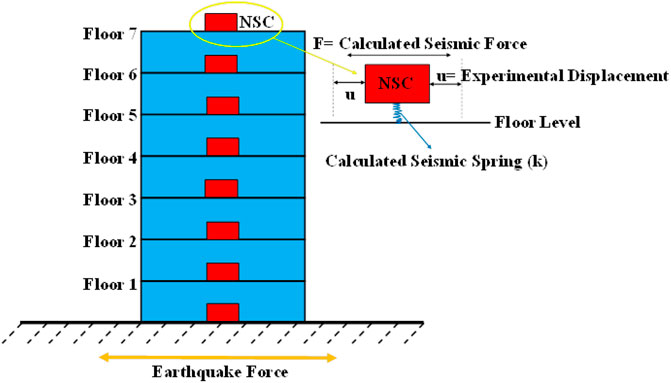
FIGURE 5. Placing spring elements of NEs to the library structure (Cavuslu, 2022).
In this section, the geometric properties of NEs used in experimental tests are explained in detail (Cavuslu, 2022). The view of NEs used in experimental tests is shown in Figure 6. Figure 6 shows that the selected NEs for the experimental tests are the elements that are often used in the RC library structures (Cavuslu, 2022). Moreover, the height, width, and depth of the elements are shown in Table 1. Table 1 shows that the height of the bookcase and table is 2.2 and 0.9 m, respectively.
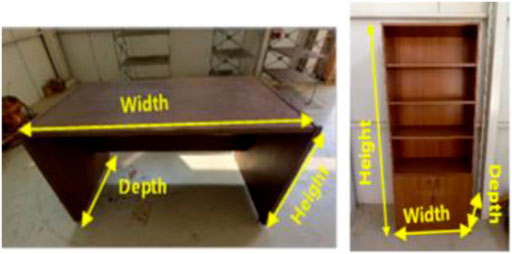
FIGURE 6. View of NEs in library buildings: (A) table and (B) bookcase (Cavuslu, 2022).
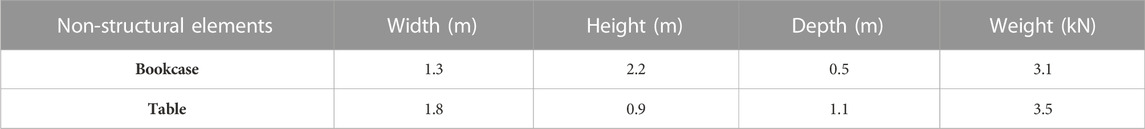
TABLE 1. Geometrical properties of NEs (Cavuslu, 2022).
The shake table used in the experimental tests has six different degrees of freedom. The general view of the shake table test is shown in Figure 7 (Cavuslu, 2022). The size of the shake table is 2.5 × 2.5 m. The surge position/rotation of the shake table is ± 0.34 m. The surge velocity/angular velocity of the shake table is ± 0.7 m/s. The surge acceleration/angular acceleration of the shake table is ± 6 m/s2 (Cavuslu, 2022). Furthermore, the sway position/rotation of the shake table is ± 0.34 m. The sway velocity/angular velocity of the shake table is ± 0.7 m/s. The sway acceleration/angular acceleration of the shake table is ± 6 m/s2 (Cavuslu, 2022). Then, the roll position/rotation of the shake table is ± 18°. The roll acceleration/angular acceleration of the shake table is ± 220°/s2. The pitch and yaw position/rotation of the shake table are ±18° and ± 24°, respectively. The pitch acceleration/angular acceleration of the shake table is ± 220°/s2. These numerical properties of the shake table are shown in Table 2 in detail. There are four SeNEBox 7021 single-axis accelerometers and four SeNEBox 7023 triaxial accelerometers in the shake table device (Cavuslu, 2022). Due to their low noise and high resolution, they can be used in seismic measurements, strong ground motion measurements, building control, building health monitoring, and modal analysis applications (Cavuslu, 2022). These accelerometers are very effective sensors that have 130 ng/Hz ultra-low noise and force/electro-dynamic feedback. All accelerometers are capable of receiving data in the range of ± 3 g and 2,400 mV/g sensitivity (Cavuslu, 2022). Then, in the shake table device, there are four position meters (LVDT) that can measure with 77 µm precision in order to measure position data. In addition, the characteristic properties of earthquakes used for shake table tests of NEs are given in Table 3 (Cavuslu, 2022).
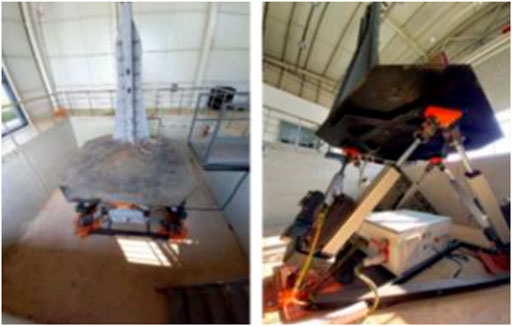
FIGURE 7. General view of a shake table (Cavuslu, 2022).
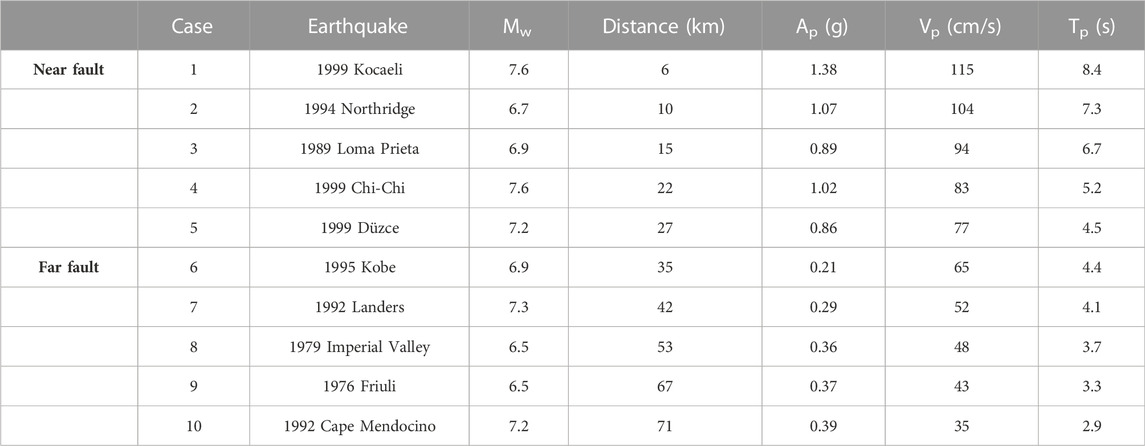
TABLE 2. Mechanical properties of a shake table (Cavuslu, 2022).
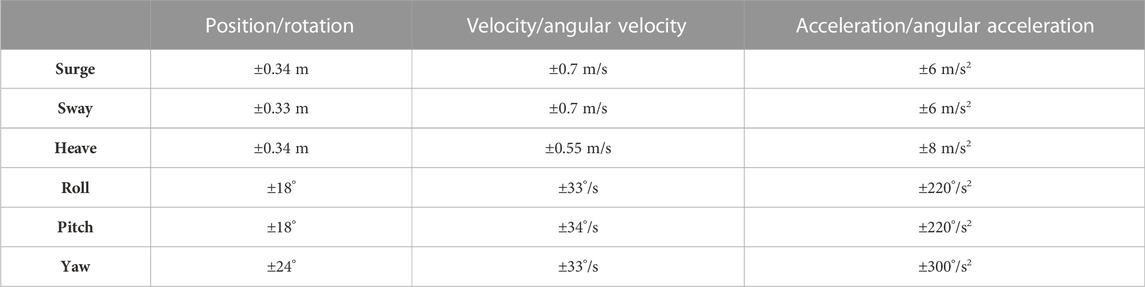
TABLE 3. Mechanical properties of earthquakes (Cavuslu, 2022).
In this section, views of the seismic test of the heavy table which is an NE frequently used in library structures are shown in Figures 8A–F (Cavuslu, 2022). Figures 8A, E show the placement of the table on the shake table and the general view of the accelerometers. In Figures 8B,C, a view of the connection cables of accelerometers connected to the table is shown (Cavuslu, 2022). Due to these connection cables, acceleration values are defined from the computer to the shake table. In addition, views of the accelerometers placed on the table and views of LVDT placed to acquire displacement measurements are shown in Figure 8F. Additionally, Figure 8D shows the view of the table being anchored to the shake table (Cavuslu, 2022).
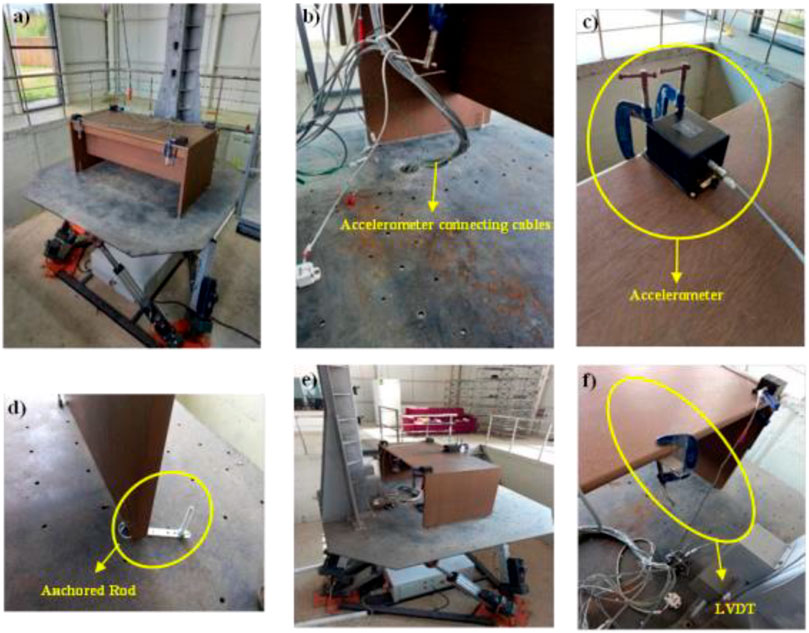
FIGURE 8. View of a table NE on the shake table (Cavuslu, 2022).
In Tables 4, 5, the shake table test results of the table are assessed by considering 10 different earthquakes. According to Table 4, an acceleration value of 5.38 m/s2 is observed on the anchored NE (Cavuslu, 2022). In addition, for case 1, a maximum acceleration value of 1.26 m/s2 is found on the unanchored NE. For case 2, it is observed that the peak acceleration values (PAVs) on anchored and unanchored NEs are 5.66 m/s2 and 2.53 m/s2, respectively (Cavuslu, 2022). Moreover, the highest acceleration value that occurred on the anchored NE for case 3 is 6.81 m/s2, and the PAV observed on the unanchored NE is 1.35 m/s2. It is understood that for case 4, maximum accelerations of 8.89 m/s2 and 2.41 m/s2 occurred on anchored and unanchored NEs, respectively (Cavuslu, 2022). For case 5, a maximum acceleration of 5.92 m/s2 is found on the anchored NE. It is concluded that the highest acceleration value observed on the unanchored NE for case 6 is much smaller than that on the anchored NE. The PAVs for case 7 on the anchored and unanchored tables are 8.64 m/s2 and 2.86 m/s2, respectively (Cavuslu, 2022). For case 8, it is observed that the highest acceleration value on the anchored NE is 7.61 m/s2. Moreover, for cases 9 and 10, the highest acceleration values on the anchored NE are 7.63 m/s2 and 6.19 m/s2, respectively. For case 10, the largest acceleration value on the unanchored NE is 1.86 m/s2 (Cavuslu, 2022). From these results, important information is acquired about seismic effects that may occur in the library structure if a table, which is frequently used in library buildings, is anchored to the structure or not anchored. In Table 5, the seismic displacement test results of the table, which is frequently used in library structures, are presented. For case 1, the largest displacement which occurred on the anchored NE is 2.3 mm (Cavuslu, 2022). In addition, the peak displacement value obtained on the unanchored NE is 36.3 mm. It is observed that for case 2, the highest displacement values on anchored and unanchored NEs are 2.5 mm and 32.1 mm, respectively. For case 3, the maximum displacement acquired on the anchored NE is 2.6 mm (Cavuslu, 2022). Moreover, if maximum displacements obtained on anchored and unanchored NEs for case 3 are compared with each other, it is understood that the unanchored NE has more displacement during the earthquake. Furthermore, for case 4, it is observed that anchored and unanchored NEs moved 2.26 and 29.7 mm during the earthquake, respectively (Cavuslu, 2022). For case 5, the highest displacement value gained on the unanchored NE is 24.1 mm. According to Table 5, for case 6, it is determined that the anchored NE has a maximum displacement of 4.1 mm during the earthquake. Furthermore, the largest displacement value on the unanchored NE is 28.6 mm. For case 7, anchored and unanchored NEs have maximum displacements of 4. and 31.6 mm during the earthquake, respectively (Cavuslu, 2022). Then, it is observed that the peak displacement value obtained on the anchored NE for case 8 is 3.2 mm. Also, for case 8, it is observed that the unanchored NE moved 28.7 mm during the earthquake. The highest displacement value acquired on the anchored NE for case 9 is 3.9 mm (Cavuslu, 2022). Moreover, according to Table 5, it is observed that the unanchored NE has a maximum displacement of 27.8 mm for case 9. Finally, for case 10, it is seen that the largest displacements of the anchored and unanchored tables are 3.4 mm and 23.6 mm, respectively. From these results, it is concluded that the unanchored table has much more displacement during the earthquake than the anchored table. These results show the researchers the importance of anchoring the table to the structure.
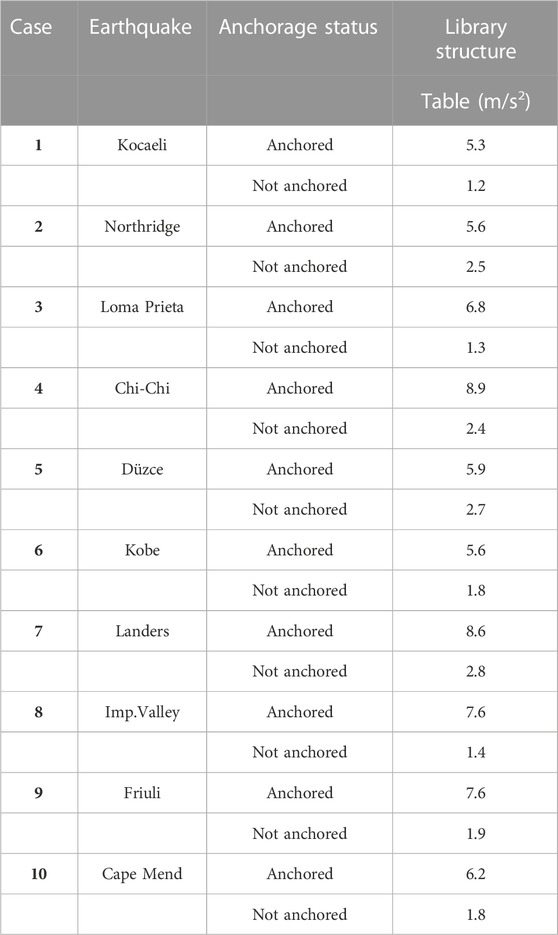
TABLE 4. Maximum seismic acceleration results for different NEs (Cavuslu, 2022).
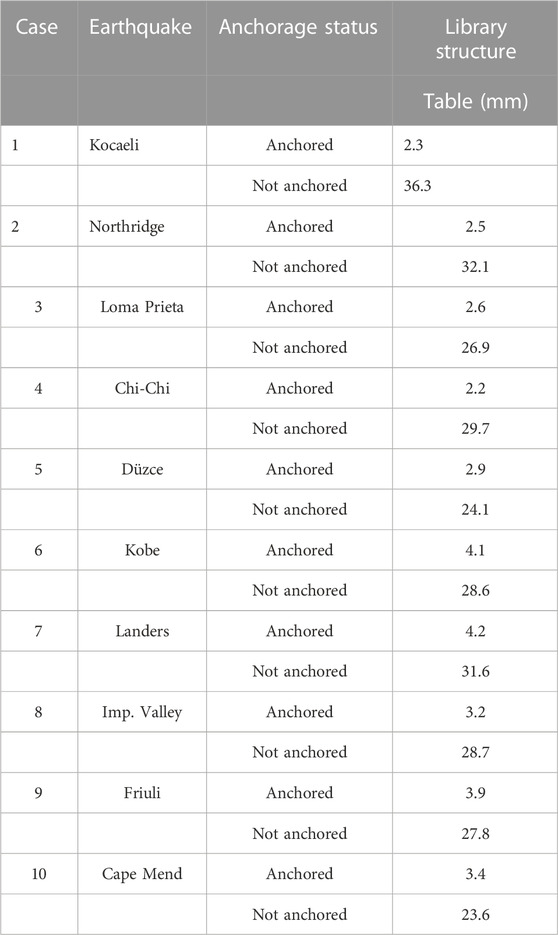
TABLE 5. Maximum seismic displacement results for different NEs (Cavuslu, 2022).
Another NE used in library structures that people frequently use is bookcases. Bookcases are one of the NEs that need to be anchored within library structures. During an earthquake, the most important NEs destroyed in the library structures are bookcases (Cavuslu, 2022). For this reason, it is vital to examine the seismic behavior of NEs in library structures such as bookcases. In this study, earthquake behaviors of bookcases are investigated using shake table tests and 10 different earthquakes. General views of bookcases used for shake table tests are shown in Figures 9A–H (Cavuslu, 2022).
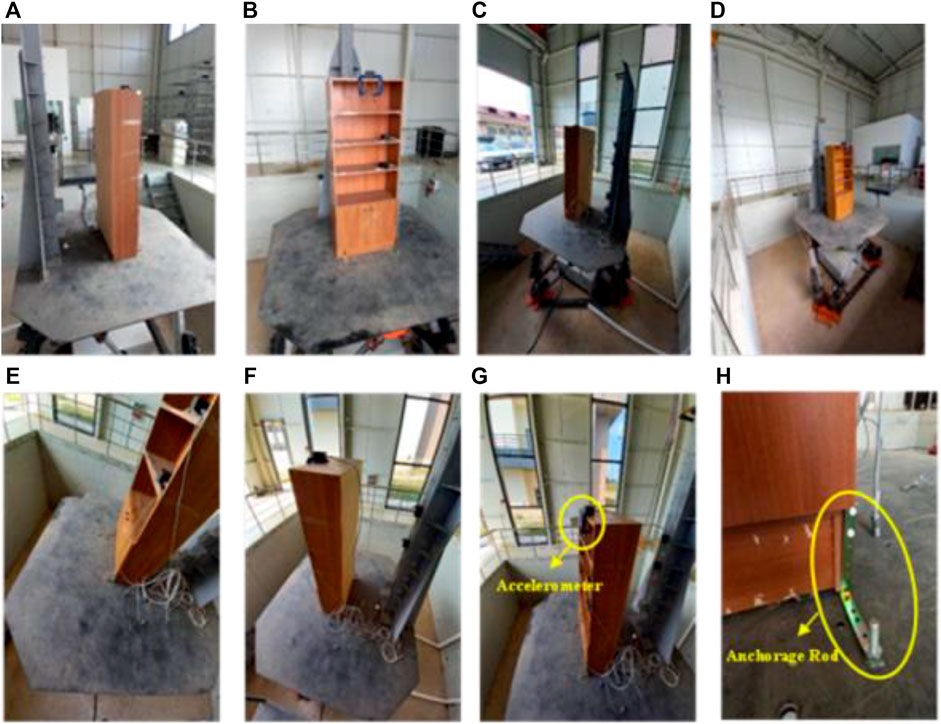
FIGURE 9. View of a bookcase NE on the shake table (Cavuslu, 2022).
Seismic acceleration values obtained during the shake table tests on the bookcase are presented depending on time. When Table 6 is assessed in detail, it is clearly observed that there are great differences in the highest acceleration values acquired on anchored and unanchored NEs for case 1 (Cavuslu, 2022). For case 2, the greatest acceleration value observed on the anchored NE is 19.3 m/s2. Moreover, the peak acceleration value obtained on the unanchored NE is 11.4 m/s2. Then, it is observed that the acceleration values for the anchored NE for case 3 are much greater than those for the unanchored NE. For case 3, maximum acceleration values of 18.4 m/s2 and 13.7 m/s2 are observed for anchored and unanchored NEs, respectively. Moreover, the highest acceleration value gained on the anchored NE for case 4 is 13.8 m/2 (Cavuslu, 2022). According to Table 6, for case 4, it is clearly understood that the unanchored NE has a maximum acceleration of 7.9 m/s2 during the earthquake. For case 5, the greatest acceleration values observed on the anchored and unanchored NEs are 19.1 m/s2 and 9.3 m/s2, respectively (Cavuslu, 2022). In Table 6, it is observed that the maximum acceleration value measured on the anchored bookcase is 18.8 m/s2. In addition, the peak acceleration value acquired for the unanchored NE is 12.2 m/s2 for case 6. When case 7 is assessed in detail, the maximum acceleration values measured on the anchored and unanchored bookcases are 19.8 m/s2 and 8.6 m/s2, respectively. The largest acceleration values gained on the anchored NE for cases 8 and 9 are 13.9 m/s2 and 17.2 m/s2, respectively. Moreover, the highest acceleration values measured on the unanchored bookcase for both cases are 8.4 m/s2 and 10.1 m/s2, respectively (Cavuslu, 2022). For case 10, the peak acceleration value obtained on the anchored NE is 29.4 m/s2. In Table 7, displacement results of the shake table test that was conducted on the bookcase for 10 different earthquakes are presented. According to Table 7, the highest displacement values measured on the bookcase for case 1 are presented considering the anchored and unanchored conditions of the NE. For case 1, it is openly understood that a maximum displacement of 16.1 mm is obtained on the anchored NE during the earthquake (Cavuslu, 2022). However, it can be observed that a maximum displacement of 94.1 mm occurred for case 1 on the unanchored NE. According to Table 7, the peak displacement values measured on anchored and unanchored NEs for case 2 are 8.3 mm and 88.7 mm, respectively. The highest displacement value acquired on the anchored bookcase for case 3 is 11.8 mm. Moreover, the largest displacement value obtained on an unanchored bookcase is 91.6 mm for case 3 (Cavuslu, 2022). It is clear from these results that for anchored NEs, the anchor material explodes during the earthquake and bookcases topple over. In addition, it is clearly understood that unanchored bookcases have great displacements during the earthquake, and these NEs fall over. For this reason, high bookcases should be carefully anchored to the library structures both vertically and horizontally to prevent them from tipping over during strong ground motion. According to case 4, the peak displacement value gained on the anchored NE is 12.6 mm (Cavuslu, 2022). In addition, the largest displacement on the unanchored NE for case 4 is 93.8 mm. When Table 7 is assessed in detail, it is observed that the highest displacement values observed on the anchored and unanchored bookcases for case 5 are 13.6 mm and 87.3 mm, respectively (Cavuslu, 2022). For case 6, the largest displacement value observed on the anchored bookcase is 12.7 mm. Furthermore, the highest displacement value acquired on the unanchored NE for case 6 is 93.5 mm. For case 7, the peak displacement values obtained for anchored and unanchored bookcases are 11.1 and 105.9 mm, respectively. The maximum displacement values observed on the anchored NE for cases 8 and 9 are 13.7 and 10.1 mm, respectively. Finally, the greatest displacement values obtained on the anchored and unanchored bookcases for case 10 are 9.6 and 97.4 mm, respectively (Cavuslu, 2022).
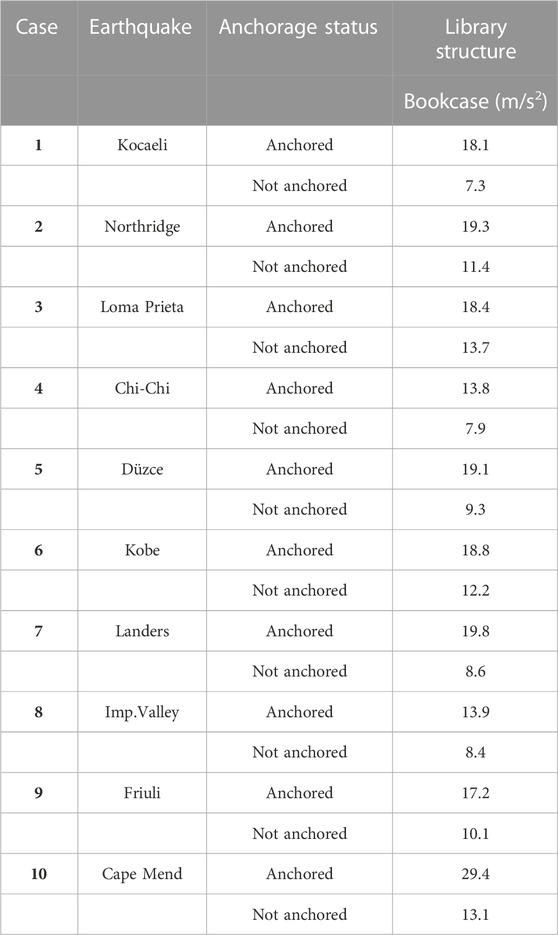
TABLE 6. Maximum seismic acceleration results for different NEs (Cavuslu, 2022).
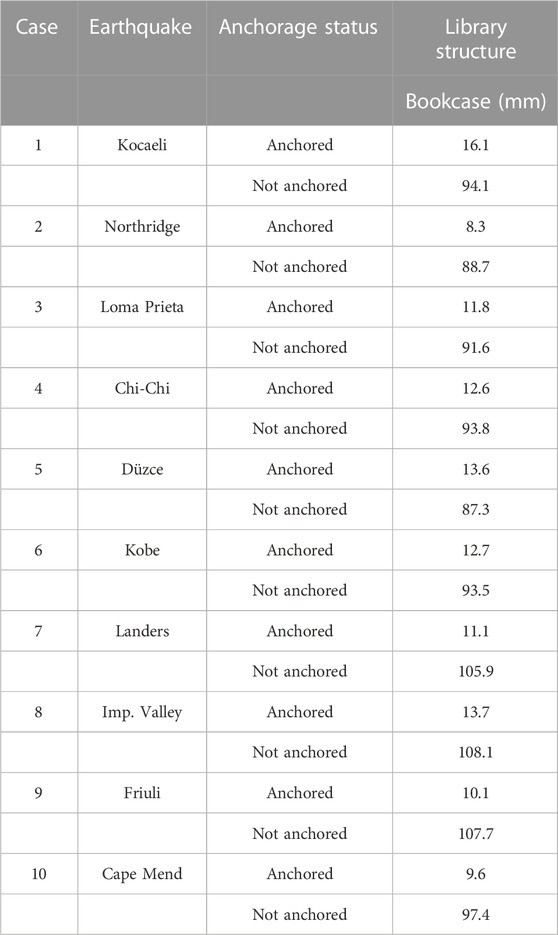
TABLE 7. Maximum seismic displacement results for different NEs (Cavuslu, 2022).
When the literature is observed in general, it is clearly understood that the seismic stiffness parameters of NEs are included in the numerical analysis as a random value (Cavuslu, 2022). In this study, the seismic stiffness parameters of NEs are obtained from experimental tests. After shake table tests for NEs in a library building are performed, earthquake accelerations and displacements obtained for each NE are summarized in Tables 4–7 (Cavuslu, 2022). When Tables 4–7 are evaluated in detail, it is observed that the maximum acceleration and displacement values on each NE are different from each other. Moreover, it has been understood that the maximum acceleration and displacement values obtained in anchored and unanchored NEs are very different from each other (Cavuslu, 2022). The seismic stiffness parameters of each NE are acquired by considering the largest displacement values that occurred according to the shake table tests. While calculating the seismic stiffness parameters, the direct stiffness method is used. According to this method, stiffness parameters are calculated according to the following formula (Eq. 1) (Cavuslu, 2022):
In Eq. 1, the symbol F is the seismic force on the NE. Moreover, k and u shown in Eq. 1 are the seismic stiffness parameter of the NE and the displacement values obtained from the shake table tests, respectively, and the seismic forces of the NEs shown with F in the formulation are calculated by considering two different seismic design standards (Cavuslu, 2022). These standards are the ASCE 7-16 ASCE/SI 7-16 (2017) code and 2018 TBEC. Standards have produced seismic design formulations for NEs and the seismic design forces calculated according to these standards are shown in Table 8 and Table 9. When Table 8 and Table 9 are examined, different force values are obtained by using different variables for each NE. In addition, calculations are performed for four floors of a library building, and it is observed that the seismic NE loads that occurred on each floor are very different from each other (Cavuslu, 2022). NE loads increase from the lower floors of the building to the upper floors. The seismic stiffness parameters of each NE are calculated according to 10 different earthquakes considering the calculated seismic loads and the largest displacements on the NEs obtained from the shake table tests. These calculated stiffness parameters are shown in detail in Tables 10, 11. In addition, in Figure 10, 11, the stiffness values obtained for anchored and non-anchored NEs are shown graphically.
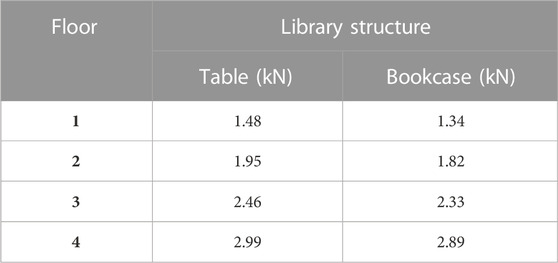
TABLE 8. Seismic design forces of NEs for the ASCE 7-16 code (Cavuslu, 2022).
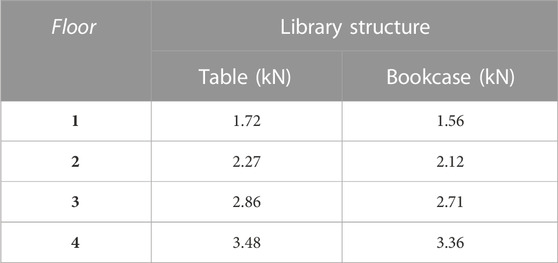
TABLE 9. Seismic design forces of NEs for TBEC-2018 (Cavuslu, 2022).
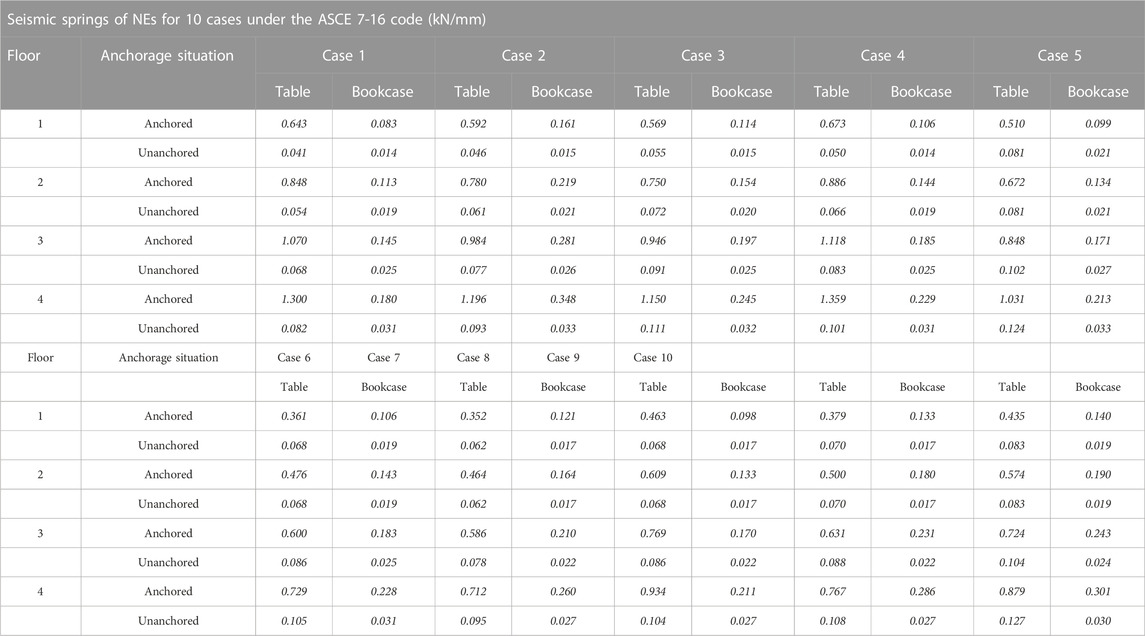
TABLE 10. Calculated seismic stiffness parameters of NEs for 10 different cases under the ASCE 7-16 code (Cavuslu, 2022).
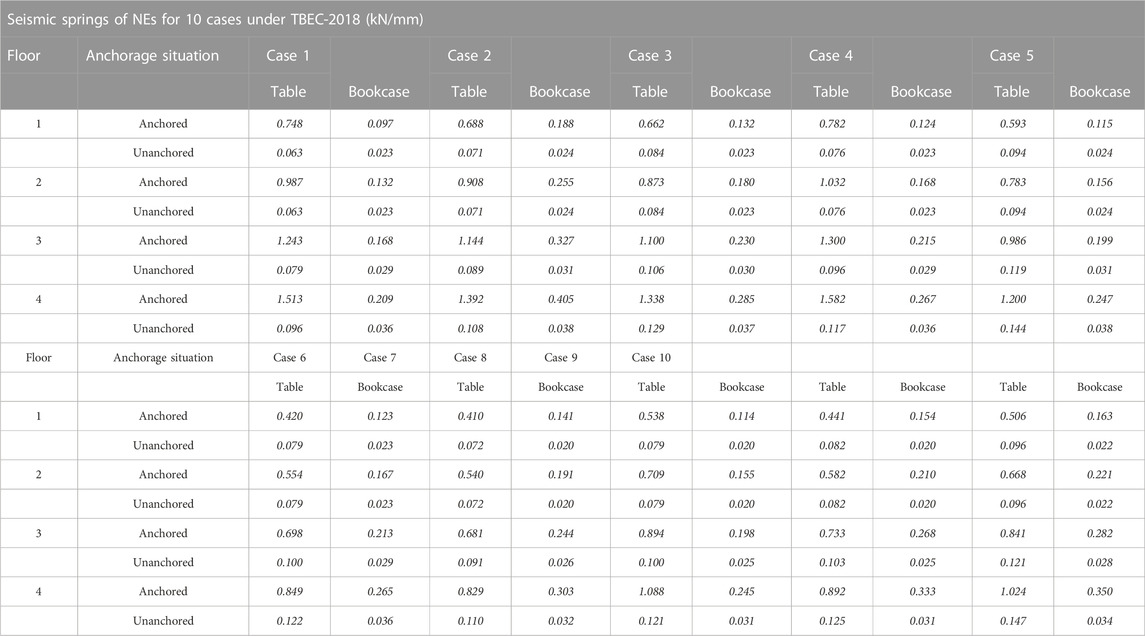
TABLE 11. Calculated seismic stiffness parameters of NEs for 10 different cases under TBEC-2018 (Cavuslu, 2022).
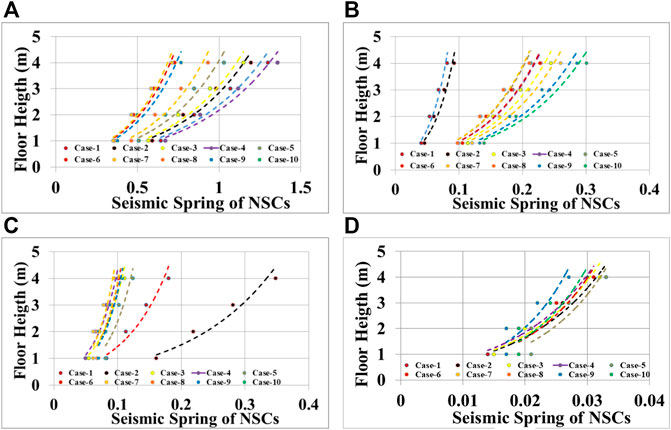
FIGURE 10. Seismic springs of an NE for the ASCE 7-16 code: (A) anchored—table, (B) unanchored—table, (C) anchored—bookcase, and (D) unanchored—bookcase (Cavuslu, 2022).
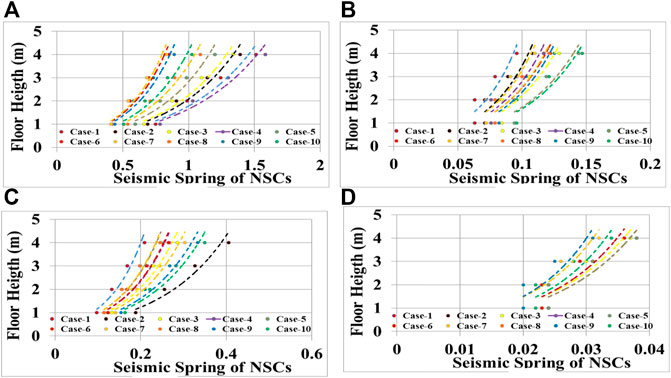
FIGURE 11. Seismic springs of an NE for the TBEC-2018: (A) anchored NE, (B) unanchored table, (C) anchored bookcase, and (D) unanchored bookcase (Cavuslu, 2022).
In this section, four multi-story RC library buildings constructed in Zonguldak, Turkey, are chosen for 3D modeling, and SAP2000 software based on the finite element method is used. In the modeling of this RC structure, three different columns are described to the SAP2000, and the width and height of these columns are described as 50 × 50, 60 × 60, and 70 × 70 cm, correspondingly. Additionally, there is an annular column in the structure and its size is described as 65 cm. Then, the width–height of the beams used in the 3D model is described as 35 × 70, 30 × 70, and 40 × 60 cm, correspondingly. The type of concrete of the foundation, columns, and beams is described as C35, and this value is found in the original structure project.
In this RC structure, there are, in total, two different shear walls, and their widths are modeled as 20 and 25 cm. Furthermore, the thickness of floor covering is selected as 20 cm for all floors. The height of each floor is modeled as 4 m, and there are, in total, four floors in the structure. The general view of this structure is shown in Figure 12. Primarily, structural elements are created according to the original structure project, and then, NEs are defined to the structure. The general view of NEs in the library building is given in Figure 13. While modeling structural elements, the mass source is defined to software using super dead and live loads.
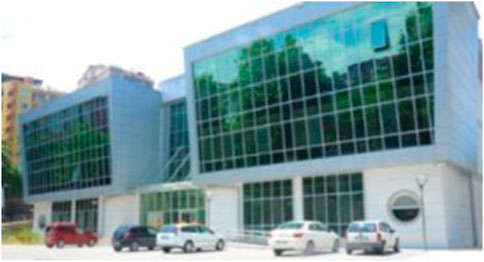
FIGURE 12. General view of a library building (Zonguldak Bulent Ecevit University, 2019).

FIGURE 13. General view of NEs in the library building (Zonguldak Bulent Ecevit University, 2019).
Additionally, rigid diaphragms are created in the structure, considering the constraint z axis. Then, non-linear time history analyses are carried out, consistent with a direct integration solution type. For that purpose, the Hilber–Hughes–Taylor method is chosen in the 3D analyses, and its gamma and beta values are selected as 0.5 and 0.25, respectively. The 3D model of the structure is given in Figure 14. Second, NEs are formed according to the original place of non-structural building elements. After calculating these loads, non-structural loads are defined to SAP2000, considering the original places of NEs in the structure. NE spring element values calculated from the shake table tests are defined under NE loads, considering the original building project. Non-structural spring element values are defined to the structure for both anchored and unanchored situations. Thus, the seismic behavior of the library structures has been calculated realistically.
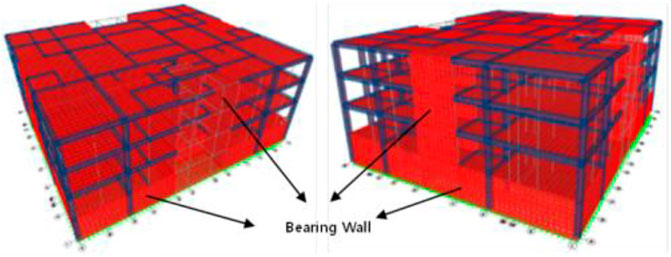
FIGURE 14. 3D model of a library building: (A) right view and (B) left view.
In this section, 3D nonlinear seismic displacement, moment, and spectral acceleration results of the library building are presented according to earthquake analyses in detail. Numerical analysis results are presented for three different situations of the building. These situations are given in Table 12.
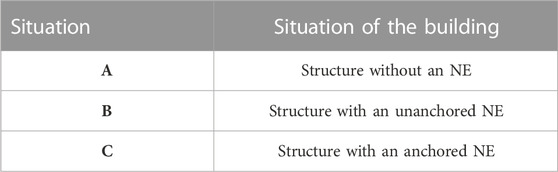
TABLE 12. Different situations of a library building.
The graphics are compared for the 2018 TBEC and ASCE/SEI 7-16 code. The displacement results of the structure are given in Figure 15 in detail. There are two different graphics in each figure. In Figure 15A, the maximum displacements which occurred on each floor of the building during the earthquake are presented for the 2018 TBEC. According to Figure 15A, a maximum displacement of 0.9 mm occurred for situation A on the first floor of the building. Also, for situations B and C, maximum displacements of 1.1 and 2.7 mm are observed on the first floor of the structure, respectively. On the second floor of the building, maximum displacements of 3.2, 4.6, and 12.1 mm are acquired for situations A, B, and C, respectively. In addition, a maximum displacement of 6.7 mm is observed for situation A on the third floor of the building. For situations B and C, a maximum displacement of 11.3 and 26.3 mm is obtained, respectively. On the last floor of the library structure, maximum displacements of 9.4, 16.1, and 37.2 mm are observed for situations A, B, and C, respectively. As shown in Figures 15A–T, the lowest displacements are obtained for the empty situation of the building. From this result, the effects of anchoring or not anchoring NEs to the structure on the seismic behavior of the structure are clearly observed. On the other hand, in Figure 15B, the largest displacements which occurred on all floors during the earthquake in the building are presented by considering the ASCE/SEI 7-16 code. According to Figure 15B, for situations B and C, maximum displacements of 1.0 and 2.1 mm, respectively, are observed on the first floor of the structure. According to the ASCE/SEI 7-16 code, on the second floor of the structure, maximum displacements of 3.9 and 10.7 mm are obtained for situations B and C, respectively. A maximum displacement of 22.03 mm occurred for situation C on the third floor of the structure. In addition, a maximum displacement of 31.9 mm is observed for situation C on the last floor of the structure. Also, when situations C and B are compared, the importance of anchoring or not anchoring NEs to the structure is clearly observed. In Figures 15C,D, the maximum displacements which occurred in the library building for case 2 are presented in detail, taking into account the 2018 TBEC and ASCE/SEI 7-16 code. When Figure 15C is observed, it is concluded that the maximum displacements that occurred on each floor of the building are very different from each other. The largest displacement on the first floor of the building is 1.2 mm for situation A. For situations B and C, the largest displacements on the first floor of the structure are 1.3 and 1.6 mm, respectively. On the second floor of the structure, maximum displacements of 5.6, 9.3, and 15.6 mm are obtained for situations A, B, and C, respectively. Also, maximum displacements of 32.01 and 49.03 mm are observed for situation C on the third and fourth floors of the structure, respectively.
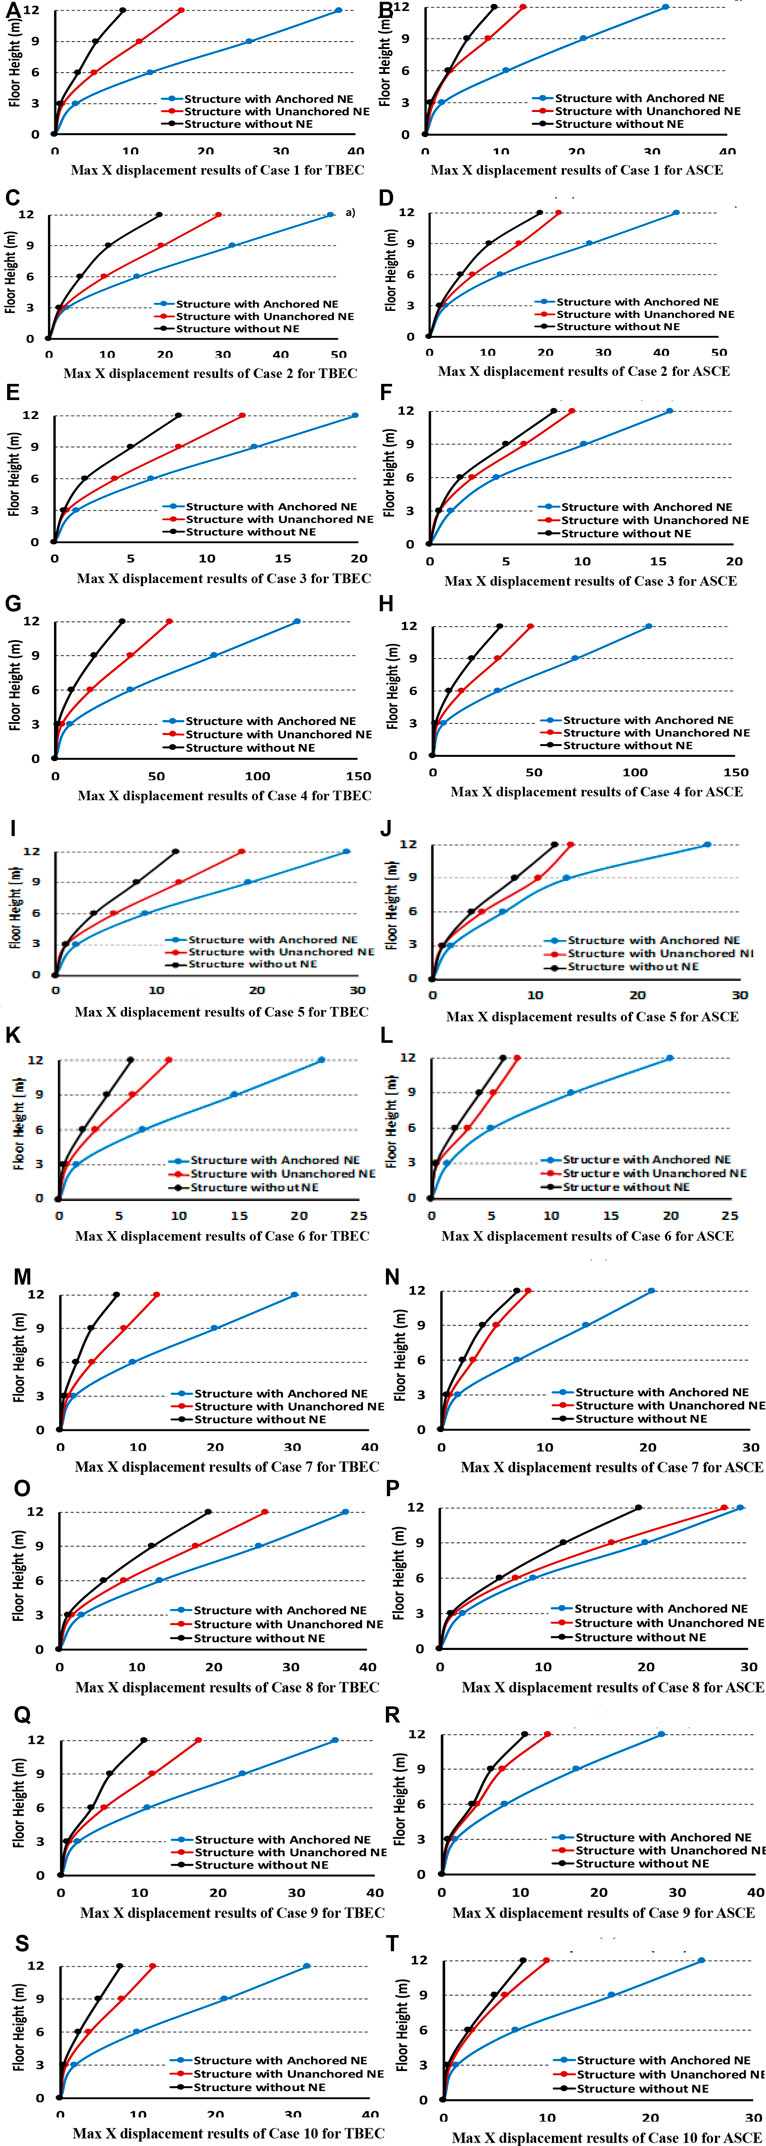
FIGURE 15. (Continued).
Smaller displacements occurred in situation B than in situation C on the third and fourth floors of the structure. The smallest displacements along the four floors of the structure are obtained in situation A. In Figure 15D, for case 2, the largest displacements which occurred along all floors of the building are presented by considering the ASCE/SEI 7-16 code. According to Figure 15D, very similar displacements occurred in three different situations of the building on the first floor of the building. When compared to the other floors, the biggest displacements occurred on the top floor of the building. For situations B and C, maximum displacements of 21.8 and 43.4 mm are observed at the top floor of the structure, respectively. When Figures 15C,D are compared with each other, it is concluded that the 2018 TBEC and ASCE/SEI 7-16 codes have different effects on the earthquake behavior of the structure. This result is of great importance in revealing the differences between these two different codes. In Figures 15E,F, the displacements in the structure for case 3 are given in detail. According to Figures 15E,F, the largest displacements which occurred in all floors of the building are observed for situation C. Moreover, the smallest displacements for all floors of the building are obtained for situation A. When Figure 15E is observed, it shows that displacements for situations A, B, and C are very close to each other on the first floor of the structure. On the second floor of the building, a maximum displacement of 3.2 mm is obtained for situation A. On the second floor of the structure, maximum displacements of 4.4 and 6.9 mm are observed for situations B and C, respectively. In addition, the smallest displacement in the third and fourth floors of the structure is obtained for situation A, and the displacement values which occurred on these floors are 5.2 and 7.3 mm, respectively. On the last floor of the structure, the largest displacement (19.4 mm) is acquired for situation C and the smallest displacement (7.8 mm) is obtained for situation A. When three different situations of the building are compared with each other, the smallest displacements which occurred on the top floor of the building are observed for situation A. Taking into account the ASCE/SEI 7-16 code, the highest displacement values which occurred on all floors of the building are presented in detail. When Figures 15E,F are compared, it is observed that the maximum displacement values obtained from the structure analyzed with the ASCE/SEI 7-16 code are smaller than the numerical values acquired according to the 2018 TBEC. For situations B and C, maximum displacements of 8.9 and 15.8 mm are observed at the top floor of the structure, respectively. In Figures 15G,H, displacement results that occurred on all floors of the building for case 4 are given in detail. According to Figure 15G, it is observed that displacements for situations A, B, and C are close to each other at the lowest floor of the building for the 2018 TBEC. On the second floor of the building, a maximum displacement of 13 mm occurred for situation A. On the same floor, maximum displacements of 23 mm and 41 mm are obtained for situations B and C, respectively. A maximum displacement of 126 mm for situation C is observed at the top floor of the structure. In addition, the smallest displacement (37 mm) on the top floor of the structure occurred for situation A. In Figure 15H, time-dependent results of the displacements occurring on the top floor of the building are presented. The largest displacements for situation C occurred 25.1 seconds after the earthquake. When Figures 15G,H are compared, it is observed that larger displacements occurred along all floors of the building in Figure 15G. This result clearly reveals the displacement differences in the structures analyzed with the ASCE/SEI 7-16 code and the 2018 TBEC. In Figures 15I,J, the displacement results for case 5 in the library building are presented. Moreover, in Figures 15I,J, the displacement results of the analyzed structure taking into account the TBEC are presented. In Figure 15I, very close displacement values are acquired for situations A, B, and C at the bottom floor of the building. Compared to the other floors of the building, higher displacement values are observed for three different situations of the building on the top floor. A maximum displacement of 10.7 mm occurred for situation A at the top floor of the building. For situations B and C for the same floor, maximum displacements of 17.9 and 28.6 mm are observed, respectively. In Figure 15J, the displacement values which occurred at the top floor of the building are presented depending on time. According to Figure 15J, it is observed that the maximum displacement for situation C occurred 14.9 seconds after the earthquake when three different states of the structure are compared with each other. In addition, when Figures 15I, J are compared, it is observed that the maximum displacements obtained from the building analyzed with the ASCE/SEI 7-16 code are smaller than those acquired from the building analyzed with the 2018 TBEC. It is observed that the maximum displacements which occurred on the top floor of the building are obtained for situation C. In Figures 15K,L, the 2018 TBEC and ASCE/SEI 7-16 codes are compared in detail. In addition, for case 6, the results of the maximum displacement which occurred on all floors of the building are presented. According to Figure 15K, a maximum displacement of 1.1 mm occurred for situation A at the lowest floor of the building. Moreover, maximum displacements of 1.3 and 1.9 mm are obtained for situations B and C at the bottom floor of the structure, respectively. On the top floor of the building, a maximum displacement of 21.2 mm is observed for situation C according to the TBEC. In Figure 15L, the analysis results acquired by considering the ASCE/SEI 7-16 code are presented. According to Figure 15L, it is observed that the greatest displacements along the height of the building occurred at the top floor of the building. For situations B and C, maximum displacements of 7.8 and 22.1 mm occurred at the top floor of the building. It is observed that the maximum displacements obtained in the structure analyzed with the ASCE/SEI 7-16 code are less than those obtained in the library structure analyzed with the 2018 TBEC. In Figures 15M,N, the maximum displacement results which occurred in the building for case 7 are presented for the 2018 TBEC and ASCE/SEI 7-16 code. The 3D numerical results for the 2018 TBEC are shown in Figure 15M. According to Figure 15M, the largest displacements in the building occurred on the top floor of the building. The smallest displacements are observed on the lowest floor of the building. A maximum displacement of 7.3 mm occurred for situation A at the top floor of the building. In addition, maximum displacements of 10.9 and 30.8 mm are acquired for situations B and C on the same floor, respectively. Furthermore, the maximum displacements which occurred at the top floor of the building are presented depending on time. The largest displacements are obtained for situation C 28.3 seconds after the earthquake. In addition, the smallest displacements are observed for situation A according to the time-dependent analysis results. The displacement results of the structure analyzed according to the ASCE/SEI 7-16 code are given in Figure 15N. According to Figure 15N, very close displacement results were obtained for three different situations of the building at the bottom floor of the building. On the top floor of the structure, maximum displacements of 7.9 and 19.8 mm are observed for situations B and C, respectively. The displacement results which occurred at the top floor of the building are presented depending on time. According to this, the largest displacement which occurred at the top floor of the building is observed in situation C. In addition, the effects of anchoring or not anchoring the NEs to the structure on the seismic behavior of the structure are clearly observed. In Figures 15O,P, for case 8, the maximum displacements that occurred on all floors of the building during the earthquake are presented in detail. In addition, in Figure 15O, the seismic analysis results of the building analyzed taking into account the 2018 TBEC are shown. According to Figure 15O, it is observed that the greatest displacements in the building during the earthquake occurred on the top floor. A maximum displacement of 1.1 mm is obtained for situation A on the first floor of the structure. On the same floor, maximum displacements of 1.3 and 1.6 mm are acquired for situations B and C, respectively. Larger displacements occurred for situation C on the second floor than for situations A and B. Maximum displacements of 26.1 and 37.3 mm are observed for situation C on the third and fourth floors, respectively. The time-dependent displacement results which occurred at the top floor of the library building are presented taking into account the 2018 TBEC. The maximum displacement occurred for situation C at the top floor of the building 17.3 seconds after the earthquake. Figure 15P shows the maximum displacements which occurred along the building height, taking into account the ASCE/SEI 7-16 code. According to Figure 15P, very close displacement results are observed for three different situations of the building at the bottom floor of the building. In addition, close displacement results for situations B and C occurred at the top floor of the structure. The displacement results which occurred at the top floor of the building are presented according to the ASCE/SEI 7-16 code. According to this, when three different conditions of the structure are compared, it is concluded that the maximum displacement for situation C occurred 18.3 seconds after the earthquake. In Figures 15R,S, the displacement results that occurred during the earthquake for case 9 are presented. Moreover, in Figure 15R, the displacement results of the analyzed structure taking into account the 2018 TBEC are presented, and in Figure 15S, the seismic analysis results of the analyzed structure taking into account the ASCE/SEI 7-16 code are shown in detail. When Figures 15R,S are compared with each other, the differences of seismic differences between the ASCE/SEI 7-16 code and 2018 TBEC are clearly observed. Despite the fact that a maximum displacement of 34.4 mm is observed for situation C at the top floor of the building according to the 2018 TBEC, a maximum displacement of 26.2 mm occurred at the top floor of the structure according to the ASCE/SEI 7-16 code. It is evident that the maximum displacement at the top floor of the structure is obtained for situation C in both graphs. In addition, the smallest displacements which occurred at the top floor of the structure for both graphs are observed for situation A. Earthquake analysis results for case 10 are given in Figures 15T,U. Figure 15T shows the seismic results obtained by considering the TBEC. According to Figure 15T, very close displacements occurred in three different situations of the building on the first floor of the building. On the second floor of the structure, a maximum displacement of 2.1 mm is observed for situation A. In addition, maximum displacements of 3.4 and 8.9 mm are obtained for situations B and C, respectively. On the top floor of the building, larger displacements occurred for situation C. It is observed that larger displacements for situation C occurred during the earthquake. In Figure 15U, a maximum displacement of 9.4 mm occurred for situation B at the top floor of the building according to the ASCE/SEI 7-16 code. Moreover, a maximum displacement of 26.2 mm is obtained for situation C on the same floor. In Figures 16A–T, the maximum moment values that occurred in the library building analyzed for 10 different fault distances of the earthquake are shown in detail. The beam with the highest moment value in the building is taken into account while examining the maximum moment values which occurred in the building. During the earthquake analysis, the greatest moments occurred in beams on the first floor. In Figures 16A,B, the largest moment values which occurred in the structure analyzed for case 1 are shown depending on time. When Figures 16A,B are compared with each other, it is understood that the maximum moment values that occurred in the structure, analyzed according to the 2018 TBEC, are higher than those which occurred in the analyzed structure considering the ASCE/SEI 7-16 code. In Figure 16A, a maximum moment value of 112 kN m is observed on the first floor of the building for situation A. For situations B and C, on the first floor of the building, maximum moment values of 238 kN m and 492 kN m are obtained, respectively. In Figure 16B, it is clearly observed that maximum moment values of 194 kN m and 419 kN m occurred for situations B and C, respectively. From these results, the effects of the 2018 TBEC and ASCE/SEI 7-16 codes on the earthquake behavior of the structures are understood. Moreover, the earthquake analysis results for case 2 are shown in Figures 16C,D. In Figure 16C, a maximum moment of 186 kN m is observed on the first floor of the building for situation A according to the 2018 TBEC. For situations B and C, maximum moment values of 342 kN m and 481 kN m are obtained on the same floor, respectively. Moreover, according to the ASCE/SEI 7-16 code, maximum moments of 286 kN m and 431 kN m are observed for situations B and C, respectively. Seismic analysis results for case 3 are graphically shown in Figures 16E,F. According to the analysis results, the differences between the 2018 TBEC and the ASCE/SEI 7-16 code are obviously observed. In Figure 16E, a maximum moment of 74 kN m is observed at the lowest floor of the building for situation A. In addition, for situations B and C, maximum moment values of 103 kN m and 298 kN m occurred on the same floor, respectively. In Figure 16F, the largest moment values which occurred in the structure according to the ASCE/SEI 7-16 code are observed for situation C. In addition, the smallest moment values are acquired for situation A. In Figures 16G,H, the 3D seismic analysis results obtained for case 4 are shown. According to Figure 16G, the maximum moment values obtained for situation C are larger than those for situations A and B. For situation C, the maximum moment value which occurred in the beams at the lowest floor of the building is 972 kN m. In Figure 16H, the seismic moment results of the building, analyzed according to the ASCE/SEI 7-16 code, are shown. According to the ASCE/SEI 7-16 code, maximum moment values of 204 kN m, 608 kN m, and 649 kN m are observed for situations A, B, and C at the lowest floor of the structure, respectively. In Figures 16I,J, seismic analysis results of the library structure analyzed for case 5 are shown. When Figures 16I,J are observed in detail, the effects of the 2018 TBEC and the ASCE/SEI 7-16 code on the earthquake behavior of the library structures are clearly observed in detail. For both codes, the highest moment values during the earthquake are obtained for situation C. In addition, the smallest moment values which occurred in the library structure are observed for situation A. From these results, the effects of anchoring or not anchoring NEs to the structure on the three-dimensional seismic moment behavior of the library structures are clearly observed.
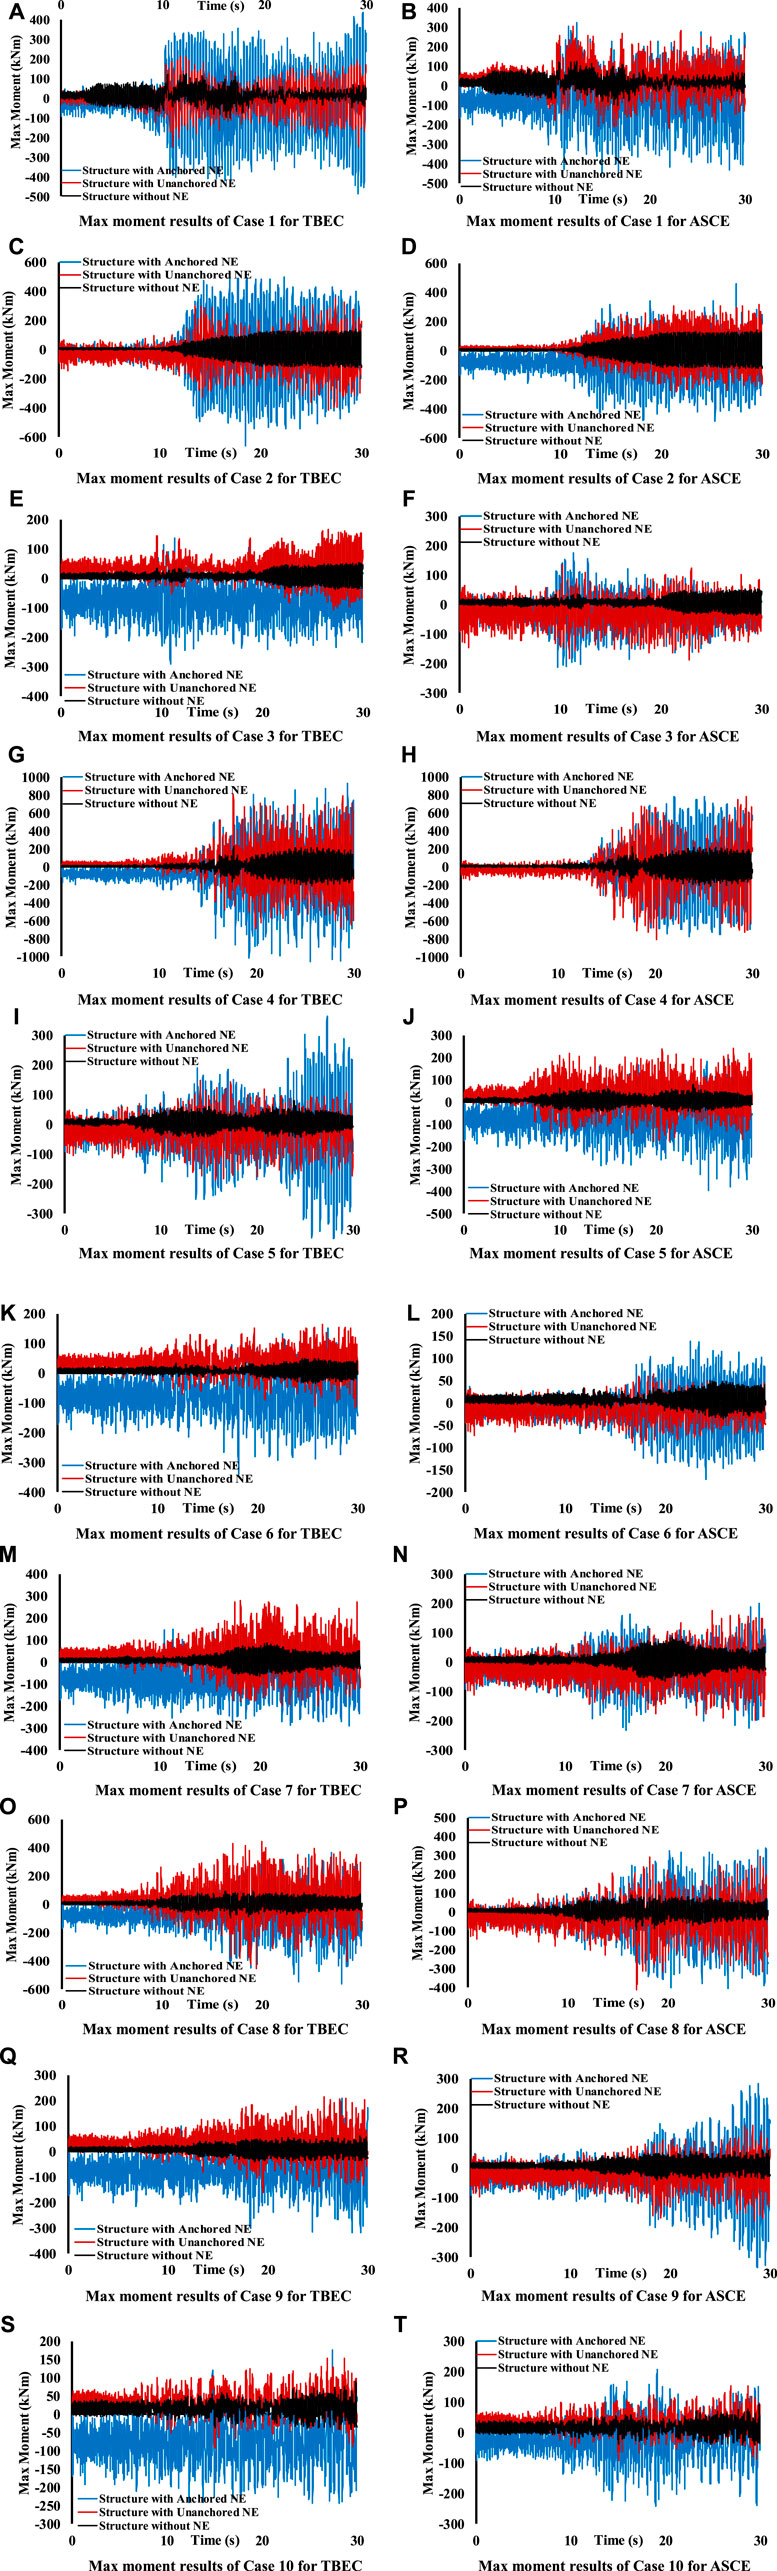
FIGURE 16. (Continued).
Earthquake analysis results for case 6 are shown in Figures 16K,L in detail. When Figures 16K,L are compared with each other, it is concluded that NEs are very important for the earthquake behavior of library structures. In Figure 16K, the analysis results of the structure analyzed according to the 2018 TBEC are shown, and for situation A (the structure without an NE), a maximum moment value of 74 kN m is obtained in the beams at the lowest floor of the building. In addition, maximum moment values of 148 kN m and 328 kN m are observed for situations B and C in the beams on the lowest floor of the structure, respectively. In addition, in Figure 16L, maximum moment values of 128 kN m and 186 kN m are obtained for situations B and C in the beams at the lowest floor of the building according to the ASCE/SEI 7-16 code, respectively. From Figures 16M,N, it is concluded that the maximum moment values obtained from the structure analyzed according to the 2018 TBEC for case 7 are greater than those acquired from the library structure analyzed according to the ASCE/SEI 7-16 code. This result enables researchers to see the differences between the 2018 TBEC and ASCE/SEI 7-16 codes. The 3D seismic analysis results obtained for case 8 are shown in Figures 16O,P. According to Figures 16O,P, a maximum moment value of 548 kN m is obtained in the beams at the lowest floor of the building for situation A according to the 2018 TBEC. Moreover, a maximum moment of 371 kN m occurred in the beams at the lowest floor of the building according to the ASCE/SEI 7-16 code on the same floor. In Figures 16R,S and Figures 16T,U, seismic moments which occurred in the structure analyzed for cases 9 and 10 are presented, respectively. When Figures 16R,S and Figures 16T,U are compared, the effects of the earthquake fault distance on the earthquake behavior of the library structures are clearly observed. In addition, when Figures 16R,S and Figures 16T,U are observed in detail, the effects of anchoring and not anchoring the NEs to the structure on the earthquake behavior of the library structures are clearly understood.
In this study, the effects of NEs on the seismic behavior of RC library structures are observed, taking into account the ASCE/SEI 7-16 code and 2018 TBEC. A total of 10 different fault distances of the earthquakes are taken into consideration while performing 3D seismic analyses. In addition, the effects of anchoring or not anchoring NEs to the structure on the seismic behavior of library structures are observed in detail. The following points are observed in 3D nonlinear seismic analysis results.
• In this study, the seismic behavior of NEs is calculated differently from the literature and in accordance with reality. NEs used in library buildings are subjected to shake table tests, and the real spring values of these elements are obtained. These spring values are affected by the 3D modeled structure. The spring values of the NEs obtained as a result of this study should be used by researchers and included in the building modeling.
• It is concluded that the earthquake fault distance has great effects on RC library structures. As the fault distance decreases, the damage that may occur in the library structures increases, and when the distance of the fault increases, the damage that may occur in the library structures decreases. For this reason, before modeling RC library structures, the distance of the earthquake fault to the structure should be observed and not be ignored.
• In this study, it is clearly observed that analysis results performed by taking into account the ASCE/SEI 7-16 code and 2018 TBEC are very different from each other. Although the same NE is used in the library structure, different maximum displacements and moment values are observed in the structure for two different standards. It is concluded that the seismic numerical values acquired considering the 2018 TBEC are greater than those obtained for the ASCE/SEI 7-16 code. This result reveals the difference between both codes and guides researchers on which standard to choose when modeling NEs.
• It is recommended that NEs should be anchored to the structure to prevent loss of life and property during an earthquake. However, it has been concluded that the maximum seismic displacements and moments which occurred in the structure when the NEs are anchored to the structure are greater than those which occurred in the structure if they are not anchored. From this result, it is observed that anchoring NEs to the structure has greater seismic effects than not anchoring them to the structure.
• In this study, it is strongly recommended that if an RC library structure is modeled, it should be modeled taking into account the results obtained from this study, and if the NEs are anchored to the structure, the library buildings should be modeled considering the effects of NEs on the structure.
• When NEs are anchored to the library structures, larger spectral acceleration values occur in the library structures. In other words, the anchoring of the NEs to the structure enables the NEs to move with the structure during an earthquake, and in this case, these structures oscillate more.
• NEs are of great importance for the seismic behavior and structural safety of RC structures. It is highly recommended to never neglect NEs when modeling an RC structure.
The original contributions presented in the study are included in the article/Supplementary Material; further inquiries can be directed to the corresponding author.
Conceptualization, MK; methodology, MK; data curation, MÇ, MK, and HO; investigation, MÇ, MK, and HO; writing—original draft preparation, MÇ, MK, NM, MA, and MS; writing—review and editing, MÇ, MK, MA, and MS; and funding acquisition, MA and MS. All authors read and agreed to the published version of the manuscript.
The research was partially funded by the Ministry of Science and Higher Education of the Russian Federation under the strategic academic leadership program “Priority 2030” (agreement 075-15-2021-1333 dated 30 September 2021).
The authors declare that the research was conducted in the absence of any commercial or financial relationships that could be construed as a potential conflict of interest.
All claims expressed in this article are solely those of the authors and do not necessarily represent those of their affiliated organizations, or those of the publisher, the editors, and the reviewers. Any product that may be evaluated in this article, or claim that may be made by its manufacturer, is not guaranteed or endorsed by the publisher.
Adam, C., Furtmüller, T., and Moschen, L. (2013). Floor RespoNE spectra for moderately heavy non-structural elements attached to ductile frame structures. Comput. Methods Earthq. Eng. 2013, 69–89. doi:10.1007/978-94-007-6573-3_4
ASCE/SI 7-16 (2017). Minimum design loads and associated criteria for buildings and other structures. Reston, Virginia, USA: The American Society of Civil Engineers.
Baird, A., and Ferner, H. (2017). Damage to non-structural elements in the 2016 Kaikōura earthquake. Bull. N. Z. Soc. Earthq. Eng. 50 (2), 187–193. doi:10.5459/bnzsee.50.2.187-193
Berto, L., Bovo, M., Rocca, I., Saetta, A., and Savoiac, M. (2020). Seismic safety of valuable non-structural elements in RC buildings: Floor RespoNE Spectrum approaches. Eng. Struct. 205. doi:10.1016/j.engstruct.2019.110081
Bilgin, H., Hadzima-Nyarko, M., Işık, E., Ozmen, H. B., and Harirchian, E. (2022). A comparative study on the seismic provisions of different codes for RC buildings. Struct. Eng. Mech. 83 (2). doi:10.12989/sem.2022.83.2.195
Braga, F., Manfredi, V., Masi, A., Salvatori, A., and Vona, M. (2011). Performance of non-structural elements in RC buildings during the L’Aquila, 2009 earthquake. Bull. Earthq. Eng. 9, 307–324. doi:10.1007/s10518-010-9205-7
Calvi, P. M. (2014). Relative displacement floor spectra for seismic design of non structural elements. J. Earthq. Eng. 18 (7), 1037–1059. doi:10.1080/13632469.2014.923795
Cavuslu, M. (2022). Seismic designing of non-structural components considering shake table test and 3D modelling. PhD Thesis. Zonguldak, Turkey: Zonguldak Bulent Ecevit University, Institute of Science and Technology.
Challagulla, S. P., Parimi, C., Mohan, S. C., and Farsangi, E. N. (2020). Seismic response of building structures with sliding non-structural elements. IJE Trans. B Appl. 33 (2), 205–212. doi:10.5829/IJE.2020.33.02B.04
Cicek, K., and Sar, A. (2020). A novel risk assessment approach for data center structures. Earthquakes Struct. 19 (6), 471–484. doi:10.12989/eas.2020.19.6.471
Disaster and Emergency Management Presidency (2018). Turkey building earthquake code, disaster and emergency management presidency. March 18, 2018.
Fierro, E. A., Miranda, E., and Perry, C. L. (2012). “Behavior of non-structural components in recent earthquakes,” in Architectural Engineering Conference (AEI). doi:10.1061/41168(399)44
Filiatrault, A., Perrone, D., Merino, R. J., and Calvi, G. M. (2021). Performance-based seismic design of non-structural building elements. J. Earthq. Eng. 25 (2), 237–269. doi:10.1080/13632469.2018.1512910
Gabbianelli, G., Perrone, D., Brunesi, E., and Monteiro, R. (2020). Seismic acceleration and displacement demand profiles of non-structural elements in hospital buildings. Buildings 10 (12), 243. doi:10.3390/buildings10120243
Hofer, L., Zanini, M. A., Faleschini, F., and Pellegrino, C. (2018). Profitability analysis for assessing the optimal seismic Retrofit strategy of industrial productive processes with business-interruption consequences. J. Struct. Eng. (N. Y. N. Y). 144 (2). doi:10.1061/(asce)st.1943-541x.0001946
Hosseini, M. (2005). Behavior of non-structural elements in the 2003 bam, Iran, earthquake. Earthq. Spectra 21 (1), 439–453. doi:10.1193/1.2098829
Işık, E. (2022). Comparative investigation of seismic and structural parameters of earthquakes (M≥6) after 1900 in Turkey. Arab. J. Geosci. 15, 971. doi:10.1007/s12517-022-10255-7
Kazantzi, A. K., Miranda, E., and Vamvatsikos, D. (2020). Strength-reduction factors for the design of light non-structural elements in buildings. Earthq. Eng. Struct. Dyn. 49, 1329–1343. doi:10.1002/eqe.3292
Kazantzi, A. K., Vamvatsikos, D., and Miranda, E. (2020). Evaluation of seismic acceleration demands on building non-structural elements. J. Struct. Eng. (N. Y. N. Y). 146 (7). doi:10.1061/(ASCE)ST.1943-541X.0002676
Kug-Kwan, C., Young-Chul, L., and Dae-Won, S. (2013). Comparison of building code for design of non-structural elements for buildings. J. Archit. Inst. Korea Struct. Constr. 29 (1), 33–30. doi:10.5659/JAIK_SC.2013.29.1.23
Lerimonti, L., Venanzi, I., Caracoglia, L., and Materazzi, A. L. (2019). Cost-based design of non-structural elements for tall buildings under extreme wind environments. J. Aerosp. Eng. 32 (3). doi:10.1061/(ASCE)AS.1943-5525.0001008
Lindt, J. W. v. d., and Liu, H. (2007). Non-structural elements in performance-based seismic design of wood frame structures. J. Struct. Eng. 133 (3). doi:10.1061/(ASCE)0733-9445(2007)133:3(432)
Merino, R. J., Perrone, D., and Filiatrault, A. (2019). Consistent floor response spectra for performance-based seismic design of nonstructural elements. Earthq. Eng. Struct. Dyn. 49, 261–284. doi:10.1002/eqe.3236
Merino, R. J., Perrone, D., and Filiatrault, A. (2020). “Equivalent viscous damping for nonstructural building elements,” in 17th World Conference on Earthquake Engineering, Sendai, Japan.
Mosqueda, G., Retamales, R., Filiatrault, A., and Reinhorn, A. (2009). Testing facility for experimental evaluation of non-structural components under full-scale floor motions. Struct. Des. Tall Spec. Build. 18, 387–404. doi:10.1002/tal.441
Murty, C. V. R., Goswami, R., Vijayanarayanan, A. R., Kumar, R. P., and Mehta, V. V. (2012). Introduction to earthquake protection of non-structural elements in buildings. Gujarat, India: Gujarat State Disaster Management Authority, Government of Gujarat.
Perrone, D., Calvi, P. M., Nascimbene, R., Fischer, E. C., and Magliulo, G. (2019). Seismic performance of non-structural elements during the 2016 Central Italy earthquake. Bull. Earthq. Eng. 17, 5655–5677. doi:10.1007/s10518-018-0361-5
Perrone, D., and Filiatrault, A. (2017). Automated seismic design of non-structural elements with building information modelling. Automation Constr. 84, 166–175. doi:10.1016/j.autcon.2017.09.002
Saatcioglu, M., Tremblay, R., Mitchell, D., Ghobarah, A., Palermo, D., Simpson, R., et al. (2013). Performance of steel buildings and non-structural elements during the 27 February 2010 Maule (Chile) Earthquake. Can. J. Civ. Eng. 40 (8), 722–734. doi:10.1139/cjce-2012-0244
Sullivan, T. J. (2020). Post-earthquake reparability of buildings: The role of non-structural elements. Struct. Eng. Int. 30, 217–223. doi:10.1080/10168664.2020.1724525
Yel, N. S., Arslan, M. H., Aksoylu, C., Erkan, I. H., Arslan, H. D., and Işık, E. (2022). Investigation of the earthquake performance adequacy of low-rise RC structures designed according to the simplified design rules in TBEC-2019. Buildings 12 (10), 1722. doi:10.3390/buildings12101722
Yön, B., Onat, O., and Öncü, M. E. (2019). Earthquake damage to non-structural elements of reinforced concrete buildings during 2011 van seismic sequence. J. Perform. Constr. Facil. 33 (6). doi:10.1061/(ASCE)CF.1943-5509.0001341
Zhai, C. H., Zheng, Z., Li, S., Pan, X., and Xie, L. L. (2016). Seismic response of nonstructural components considering the near-fault pulse-like ground motions. Earthquakes Struct. 10 (5), 1213–1232. doi:10.12989/eas.2016.10.5.1213
Zonguldak Bulent Ecevit University (2019). Zonguldak bulent Ecevit university. Available at: https://w3.beun.edu.tr/arsiv/tum-haberler.html (Accessed February 19, 2019).
Keywords: ASCE/SEI 7-16 code, non-structural element, fault distance, 2018 Turkish earthquake code, shake table test
Citation: Karalar M, Çavuşlu M, Ozturk H, Mert N, Ahmad M and Sabri MMS (2022) Assessing the 3D structural behavior of RC library buildings with/without non-structural elements considering shake table tests and 3D numerical analyses. Front. Mater. 9:1066129. doi: 10.3389/fmats.2022.1066129
Received: 10 October 2022; Accepted: 21 November 2022;
Published: 08 December 2022.
Edited by:
Atefeh Karimzadeharani, Leibniz Institute for Solid State and Materials Research Dresden (IFW Dresden), GermanyReviewed by:
Ercan Işık, Bitlis Eren University, TurkeyCopyright © 2022 Karalar, Çavuşlu, Ozturk, Mert, Ahmad and Sabri. This is an open-access article distributed under the terms of the Creative Commons Attribution License (CC BY). The use, distribution or reproduction in other forums is permitted, provided the original author(s) and the copyright owner(s) are credited and that the original publication in this journal is cited, in accordance with accepted academic practice. No use, distribution or reproduction is permitted which does not comply with these terms.
*Correspondence: Memduh Karalar, bWVtZHVoa2FyYWxhckBiZXVuLmVkdS50cg==
Disclaimer: All claims expressed in this article are solely those of the authors and do not necessarily represent those of their affiliated organizations, or those of the publisher, the editors and the reviewers. Any product that may be evaluated in this article or claim that may be made by its manufacturer is not guaranteed or endorsed by the publisher.
Research integrity at Frontiers
Learn more about the work of our research integrity team to safeguard the quality of each article we publish.