 L. Cabras
 M. Serpelloni
 A. Salvadori
- Department of Mechanical and Industrial Engineering, University of Brescia, Brescia, Italy
This note is about a novel, thermodynamically consistent formulation for small strains continuum electro-chemo-mechanics applied to all solid state batteries, which are claimed to be the next-generation battery system in view of their safety accompanied by high energy densities. The response of a cell, made of a lithium metal foil, a solid electrolyte, and a porous LiCoO2 cathode, has been investigated in terms of quantities of interest such as the electric potential, the lithium concentrations profiles, displacements, and stresses. The plating and stripping of the lithium has been considered together with the volumetric evolution of the porous cathode. Together they contribute to the outbreak of mechanical stresses, which may influence the life cycle of a battery.
1 Introduction
All solid state batteries (ASSBs) are claimed to be the next-generation battery system, since they combine superior thermal and electrochemical stability and avoid hazardous liquid electrolyte leakage Schnell et al. (2018); Zheng et al. (2018); Boz et al. (2021). In spite of these promising features, ASSBs still present a number of chemo-mechanical issues, pointed out extensively in Bistri et al. (2021). Accurate and rigorous models may contribute to understanding the physics behind those pitfalls, incorporating several processes that are interconnected at different scales during batteries operations Li and Monroe (2020). Numerical simulations may provide insights into battery degradation, by reproducing capacity fade in charge/discharge cycles.
Here, we focus on the effect of plating and stripping Carter et al. (2019); Zhang et al. (2022) in the state of stress of a battery. An approach to describe the evolution of such processes at the anode/electrolyte interface was presented, for small strain theory, in Liu and Lu (2017) using the meshing capabilities of Matlab. The detrimental effects of plating and stripping at the lithium metal/solid electrolyte interface in ASSB have been modeled in Narayan and Anand (2020), mimicking the process of addition of new layers of Li at the anode interface with a conforming interphase layer, avoiding the fact that physical quantities evolve and hence there is no fixed reference configuration. In this note, we describe the thickening of the lithium foil during galvanostatic charge and determine the state of stress in the cell, together with fundamental quantities of interest such as the electric potential and the lithium concentrations profiles. Internal stresses arise after imposing that the battery case is extremely stiff, hence preventing the expansion of the cell at the two current collectors.
The modeling of a solid, Lithium phosphorus oxynitride (LiPON henceforth) electrolyte, stems from a previous paper Cabras et al. (2022), where the authors proposed a two-mechanisms and multiscale compatible approach. The paper is organized as follows. The fundamental statements for the electrochemical modeling of the solid electrolyte and plating evolution are described in Section 2, while the balance equations and the thermodynamics prescriptions have been derived in Section 3. Governing equations include the deposition and extraction of lithium from the anode, which have been considered together with the expansion and shrinkage of the porous cathode. Eventually, the simulation of charge and discharge of a whole cell has been carried out via the finite element method in Section 4. Although we approximated numerically the solution of a one-dimensional problem, the governing equations have been stated in a general form. Outcomes are profoundly discussed in Section 4.3, before drawing conclusions and further developments.
2 Electrochemical modeling of the solid electrolyte and plating evolution
2.1 Electrochemical modeling
A multiphysics, two-mechanisms model of ionic conduction in LIPON has been recently formulated in Cabras et al. (2022). The developed continuum theory for coupled electro-chemistry advances Raijmakers et al. (2020) in modeling the replenishment of vacancies and is thermodynamically consistent as well as multi-scale-compatible.
The amorphous structure of the LiPON electrolyte is schematically shown in Figure 1. It highlights two types of nitrogen bonds, either triply- or doubly coordinated. Li0 denotes the (ionic) lithium bound to the non-bridging oxygen atoms, Li+ is a lithium ion and n− is the uncompensated negative charge associated with a vacancy formed in the LiPON matrix at the place where Li+ was originally bound. The maximal concentration of host-sites, denoted with c0, is established by the stoichiometric composition of the electrolyte material and it is reached in the ideal case of absolute zero temperature, when all available host sites are fully filled with lithium ions and the ionic conductivity vanishes because all ions are immobile. In standard conditions some of the Li-ions are thermally excited and the chemical ionization reaction
occurs,
is the equilibrium constant of the ionization Eq. 1. Some ions, denoted henceforth with
where
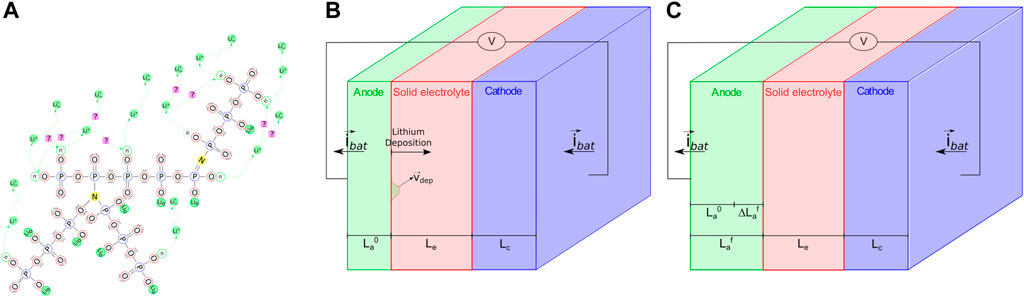
FIGURE 1. (A) Representation of the LiPON matrix with triply- and doubly coordinated nitrogen and with lithium ions Li+. (B) Initial configuration of the cell made of three different domains: a metal lithium anode, a solid electrolyte and a porous cathode. (C) Configuration of the cell during a process of charging with visible the lithium deposition on the anode surface at the interface with the solid electrolyte.
2.2 Mechanical modeling
The lithium plating is modeled in accordance with Liu and Lu (2017), where the normal velocity of lithium deposition at the anode interface with the solid electrolyte,
ΩLi is the molar volume of the lithium, F the Faraday constant and
Figure 2 depicts the behaviour of the cell during the lithium deposition. If we focus on Figure 2B, which depicts a stress-free, intermediate configuration in which the cell is free to expand, at a generic instant tf an increment of the initial thickness of the anode
In operative conditions the cell is confined by a stiff case. The displacements of the two ends of the cell are therefore fixed and the thickening of the anode due to deposition is influenced by the mechanical response, as illustrated in Figure 2C. The swelling–shrinking response of the cathode also plays a role in the definition of the stresses in a confined cell, depending on the material response upon intercalation/extraction.
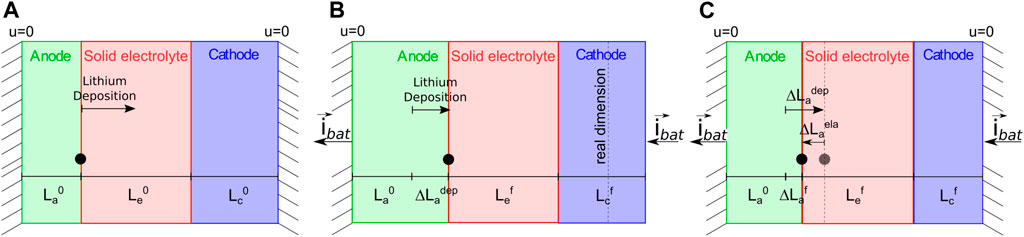
FIGURE 2. (A) A pictorial view of the cell in its initial state, before current is applied. (B) Free expansion of the cell induced by the lithium deposition
3 Governing equations
3.1 Balance equations
3.1.1 Solid electrolyte
In the multiphysics picture illustrated in Section 2.1, positive ions are the only moving species, and the relocation of vacancies is the outcome of the ionic transport1. Denote with cα the concentration (i.e. the number of moles per unit volume) of a generic species α and with
where the overall rate of the charge carrier generation is given by the mass action laws (3). The set of 4 mass balance Eqs 6a, 6b, 6c, 6d, contains five unknowns, the concentrations cLi0, cn−,
To conclude the set of balance equations, we introduce the usual balance of forces in small strains:
3.1.2 Electrodes
The anode is a foil of pure metal lithium, a continuous reservoir of ions. Balance equations depict the conservation of charge and linear momentum, in the two unknowns electric potential ϕ and displacements
During intercalation in the cathode, the lithium keeps its ionic nature “shielded” by its own electron. Such a species will be denoted with Li⊕ to distinguish it from mobile charges Li+ in the electrolyte. Balance equations characterize the chemo-diffusive migration transport of Li⊕, the electronic motion, and mechanical stress:
3.2 Constitutive theory
Governing equations emanate from balance equations, provided that appropriate constitutive laws are given. For the sake of limiting the length of this note, we do not indulge in details on the thermodynamic analysis, which can be derived from Salvadori et al. (2015a,b, 2018).
3.2.1 Electrolyte
The constitutive laws for the electric displacement
where ɛ |el = ɛ |r ɛ |0 is the electric permittivity and its value is ɛ |r times the electric permittivity in vacuum, denoted with ɛ |0 = 8.85 × 10⁻¹² C/(V m). A linear dependence on the gradient of the electrochemical potential
equipped with the thermodynamic specification
where R is the universal gas constant, D |α is the diffusivity of species α,
LiPON is an inorganic solid electrolyte, a glass ceramic which assumes an amorphous state instead of a regular crystalline structure. Its brittle, mechanical response is here described as for an homogeneous and isotropic material in small strains:
where Kel, Gel are the bulk and shear modulus respectively. The governing equations for the solid electrolyte at all points
3.2.2 Electrodes
For the anode, an Ohmic behaviour models the electron flow
where kan represents the electric conductivity. Although we are well aware that complex visco-plastic models exist for the lithium metal, see Anand and Narayan (2019); Sedlatschek et al. (2021) among others, in this note we limit ourselves to investigate the elastic response of the foil, i.e.
with Kan, Gan the bulk and shear modulus respectively.
The constitutive equations result more involved for the cathode, since swelling-shrinking upon intercalation are accounted for in the definition of the small strain tensor ɛ and of the chemical potential
and in the De Saint Venant–Kirchhoff constitutive model of the stress
with the pressure
and
The Fickian flux of lithium Li⊕ is defined as usual:
The electron flow in the active and conductive material obeys Ohm’s law (14) with parameters that refer to the cathode. The governing equations for the electrodes incorporate Eqs 14, 15 into Eqs 9a, 9b for the anode and Eqs 14, 17, 19 into Eqs 10a, 10b, 10c for the cathode.
4 Simulations
The problem formulated above is applied to a planar, thin film all-solid-state battery with LiPON electrolyte. A one-dimensional geometry is suitable for this problem, since the ratio between the lateral dimension and the thickness is large enough for the former to be considered as infinite. Figure 3 depicts the battery as consisting in a positive LiCoO2 electrode with thickness Lc = 0.50 μm, a metallic lithium Li foil with thickness La = 0.50 μm and a layer of LiPON with thickness Le = 1.50 μm.
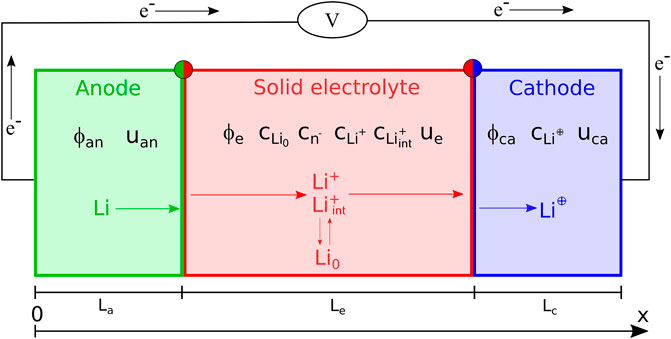
FIGURE 3. A pictorial view of the all-solid-state electrochemical cell used to validate the solid electrolyte model proposed, together with the unknown fields.
Li-ions are extracted from the positive electrode during charge, when the Li ions move across the solid electrolyte and are reduced into metallic Li at the lithium foil surface; vice versa during discharge. Charge-transfer kinetics at both electrode/electrolyte interfaces, diffusion, and migration of mobile lithium ions in the electrolyte (Li+) have been accounted for. Double layers at both electrode/electrolyte interfaces have been considered, too. The process is isothermal, invoking thermal equilibrium; volume changes of the solid electrolyte during cycling are neglected, whereas the swelling and shrinking of the cathode are modeled. Furthermore the model encompasses the evolution of the lithium deposition/remotion on the anode/electrolyte surface.
The surface area of the electrodes is A = 10−4 m2 and the theoretical storage capacity of the battery amounts at 1.53 ⋅ 10−5Ah. A galvanostatic process of charge followed by discharge, under a temperature-controlled condition of 25°C, is applied with current density ibat = 0.035 A/m2. The equilibrium constants for the two reactions have been assumed as follows:
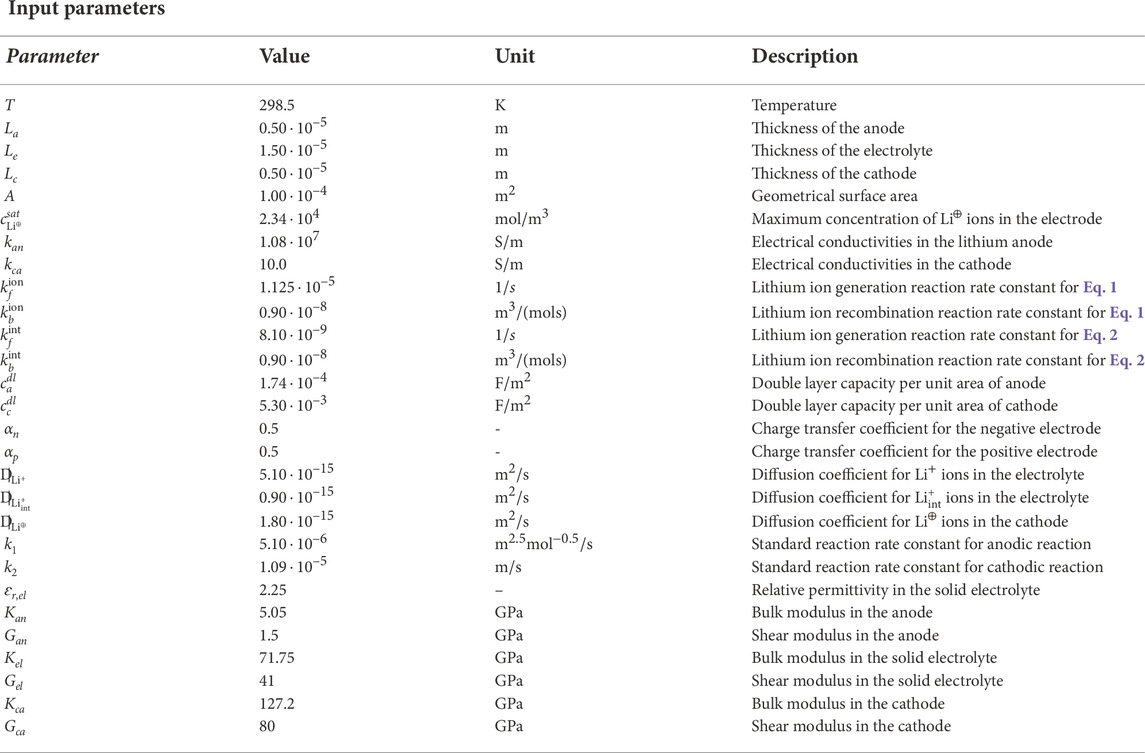
TABLE 1. Model parameters for the numerical simulations of a all-solid-state electrochemical cell.
4.1 Initial and boundary conditions
Concentrations of species are uniform and satisfy thermodynamic equilibrium at time t = 0. They hold:
The electric potential of the lithium foil at the interface between the anode and the solid electrolyte is fixed as:
To simulate the presence of a stiff, protective case, which confines the displacements at the two ends of the cell, two Dirichlet boundary conditions are imposed:
where L0 is the total length of the cell in the reference configuration at the initial time and L(t) is the total length of the cell in the current configuration at time t.
Boundary conditions for the galvanostatic process are imposed as:
Where
Where the mass fluxes
The traction continuity is imposed:
4.2 Solution schemes
The governing equations are numerically solved with the finite element method, with an in house implementation of weak forms in the commercial numerical software Matlab. The geometry and the unknown fields are discretized with 80 linear elements, 40 of them covering the electrolyte and 20 tessellating each electrode. The time marching is dealt with the backward Euler method, with fixed time increments of Δt = 1.0 s. Since we are dealing with a problem of deposition, the reference configuration of the system is not established in time. Rather, it is updated at each time step. The evolution of the reference configuration is driven by the (one-dimensional) increment of the thickness, which is defined in Eq. 5. If the cell is not confined, no mechanical stresses are generated (see Figure 4B). When the cell is confined, as in the proposed case-study, to restore compatibility a displacement is imposed in the intermediate configuration at the right end of the cell,
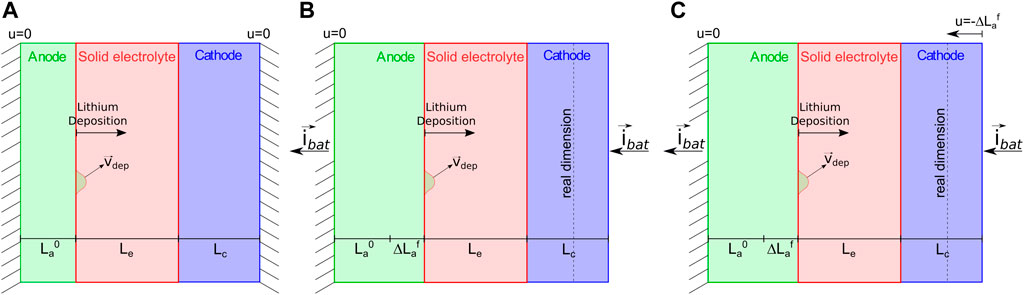
FIGURE 4. (A) A pictorial view of the cell in the reference configuration, when no current is applied. (B) The cell in the intermediate configuration, after the current is applied. The configuration corresponds to a cell free to expand, where the elongation of the cell is induced by the deposition
During the numerical simulation the reference configuration of the system has been updated at each time step, increasing or reducing the thickness of the anode because of the deposition or extraction of the lithium from its surface.
4.3 Numerical results
4.3.1 Discharge curves
Initial and boundary conditions are made compatible with thermodynamic equilibrium at t = 0, tuning the current density ibat(t) in time. Figure 5A shows the applied current density ibat(t), modeled via a logistic curve, as a function of time. After a short steep transient, the current reaches a plateau, which corresponds to a steady current density |ibat| = 0.035 [A/m2]. It is kept fixed for about 40 h. The cell is discharged afterwards. In Figure 5B, the charge/discharge curves are plotted against the extracted charge: the voltage of the cell increases up to its maximum value 4.2 [V] while charging. The discharge process starts afterwards, the voltage reduces and a voltage drop becomes evident when the saturation concentration of the lithium in the cathode (the limiting factor) is approached.
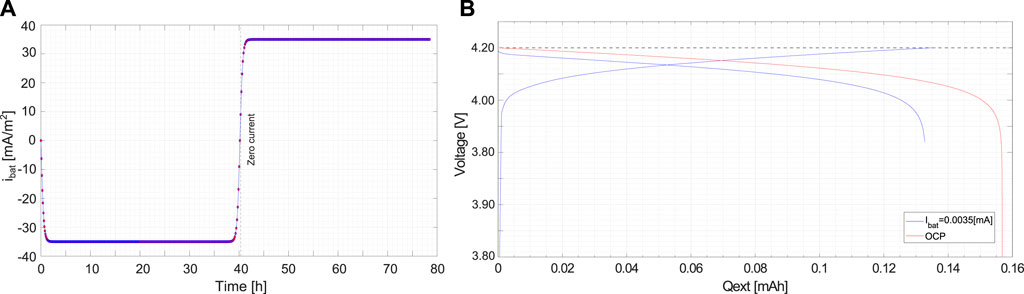
FIGURE 5. (A) Applied current density as a function of time ibat(t). (B) Charge/Discharge curves as a function of the extracted charge.
Charging and discharging cause the deposition and remotion of lithium at the anode surface in contact with the solid electrolyte. No degradation models are introduced, hence the hysteresis diagram of Figure 5B is replicated during further cycles. The open circuit potential (OCP) used in the simulations has been calculated analytically, following the approach proposed in Purkayastha and McMeeking (2012).
4.3.2 Electric potential profiles
The electric potential profile ϕ(x) in the battery at different times is depicted in Figure 6A, in the current configuration. The blue curve corresponds to the initial condition, when no current is applied. The black one to the maximum value after charging. At full charge, the electric potential discontinuities at the interfaces make Butler-Volmer currents vanishing. Based on the measured battery OCP, at full charge state
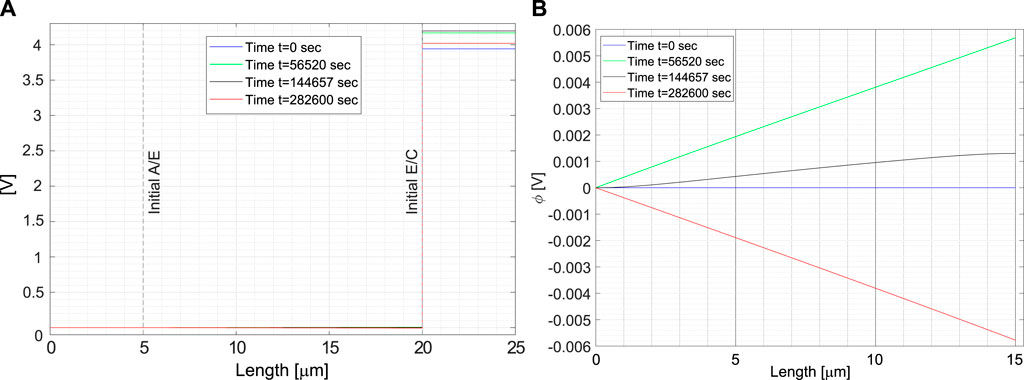
FIGURE 6. (A) Electric potential profile in the cell at different time steps. (B) Electric potential in the electrolyte at different time steps.
Complete discharging, when the concentration of lithium Li⊕ inside the cathode is close to the saturation limit of the cathode
4.3.3 Lithium concentrations profiles
The evolution of lithium concentration in the current configuration of the cell at different time steps is given in Figure 7A. Note the interface motion due to deposition. The anode is an unlimited reservoir of lithium. The concentration of lithium (i.e. its density) does not change while the thickness does. The blue curve corresponds to the initial condition, at thermodynamic equilibrium, with the concentration of lithium inside the cathode equal to the saturation limit
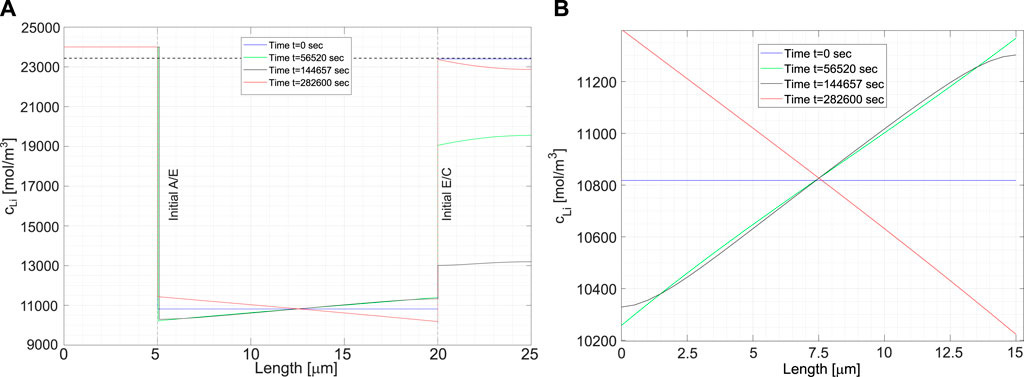
FIGURE 7. (A) Lithium concentration profiles at different time steps. The blue line corresponds to the initial time step, at thermodynamic equilibrium. Cathode is fully saturated. The black line corresponds to full charge, while the red line to the final values of the concentrations after the discharge. (B) The lithium concentration in the solid electrolyte: the sum
Figure 7B magnifies Figure 7A and highlights the evolution of the lithium concentration in the electrolyte. Since two ionic concentrations are concurrently present, only their sum
The concentrations of species cLi_{0},
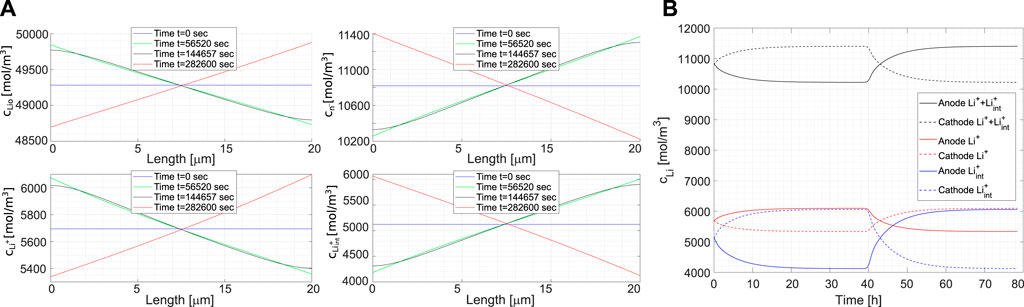
FIGURE 8. (A) Lithium concentration profiles of the different species cLi0,
4.3.4 Mechanical response
Figure 9A depicts the displacement of the anode/electrolyte and electrolyte/cathode interfaces as a function of time. They are induced by the thickening of the anode during charge (and vice versa during discharge), by the elastic deformation due to the lateral constraints, and by the swelling/shrinking of the cathode upon extraction/intercalation. Since the adopted model is one dimensional and no bulk forces are applied along the cell, the Cauchy stress is uniform. It is plotted in Figure 9B as a function of time.
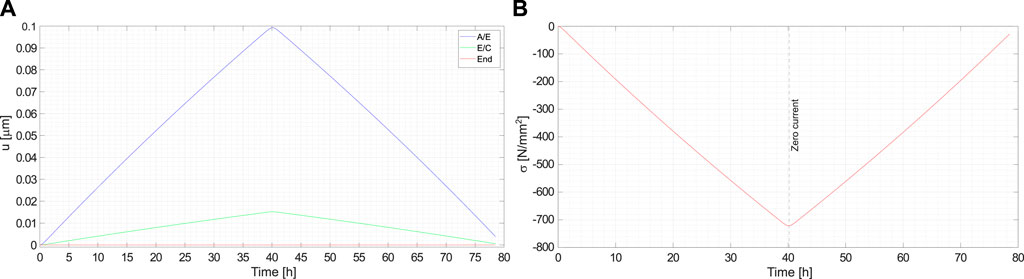
FIGURE 9. (A) Displacements of the interfaces anode/electrolyte, electrolyte/cathode and of the right end of the cell are shown as a function of time. (B) Mechanical stress in the cell as a function of time.
The swelling-shrinking of the cathode upon intercalation/extraction can sharpen or reduce the stress in the cell, depending upon the cathodic change in volume with the lithium ions concentration. For LiCoO2, a loss of lithium causes a volumetric expansion, as reported by Mendoza et al. (2016) and Reimers and Dahn (1992). Delithiation induced swelling during battery charge is governed by the molar volume (three times the chemical expansion coefficient)
Define as usual displacement as the difference between the location in the current configuration and the point position in the reference, i.e.
Such a field is shown in Figure 10 at different time steps, in the current configuration. The initial configuration (t = 0), assumed at thermodynamic equilibrium, is taken to be displacement and stress free (blue curve). To better figure out the motion scenario within the cell, consider the reference and the intermediate configuration. All points that belong to the anode in the initial (referential) state do no undergo any configurational change, i.e. their position is unchanged in the intermediate configuration. Consider a point
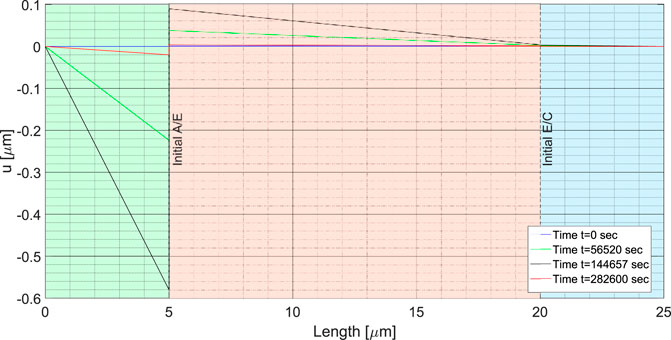
FIGURE 10. Displacements of the pre-existing lithium foil, electrolyte and cathode at different time steps. The blue line corresponds to the initial time step, when no external forces and currents are applied. The black line corresponds to the end of the charge phase, and the red line to the end of the discharge, when the saturation limit of the lithium concentration in the electrolyte-cathode interface is reached.
The definitions (26) and (27) are identical for the anode, but different for electrolyte and cathode. We will thus base the notion of strain from definition (26) for the latter, and from definition (27) for the anode. It is trivial to show that the definition of all strain measures is consistent with the classical ones within each material. The same conclusion can therefore be inferred for the constitutive laws. Since we assumed that the response of all materials in the cell is linear elastic, a straight line depicts the displacement field in Figure 10. The displacement jump at the electrolyte/lithium foil interface corresponds to the effect of thickening due to plating, followed by the elastic deformation of the freshly deposited lithium. The blue line refers to the initial time step: since no external force is applied, no displacement is observed. Once the charging process takes place, an elastic displacement arises concurrently with deposition and cathode swelling. At the full charge, identified by the black line in Figure 10, the displacement (26) discontinuity ΔLa = ΔLela + ΔLdep at the electrolyte/lithium foil interface is clearly visible. Being constrained by
To emphasize the role of plating, the mechanics of charging/descharging has been plotted in Figure 11 neglecting the effects of deposition, as per anodic intercalation without swelling. The consequences on the electro-chemical response are small, but from a mechanical prospective, outcomes largely differ. Displacements are plotted in Figure 11A, to be compared with Figure 10. The extraction of lithium from the cathode causes an expansion of the latter, which induces compressive stresses due to the fully restrained boundary conditions at the two ends of the battery. The maximum displacements are reached on full charge, depicted with a black curve in Figure 11A, which is one order of magnitude smaller than the one with plating–see Figure 10. The stress arising from the mere cathodic expansion is very small compared to the one due to plating.
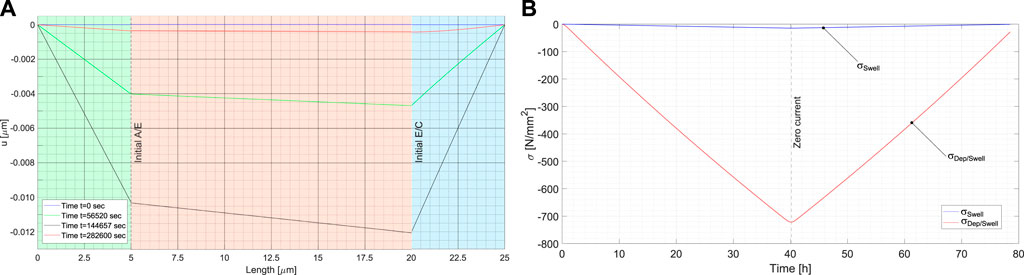
FIGURE 11. (A) Displacement inside the cell at different time steps, neglecting the lithium deposition at the anode surface. The blue line corresponds to the initial time step, when no external forces and currents are applied. The black line corresponds to the end of the charge phase, and the red line to the end of the discharge, when the saturation limit of the lithium concentration in the electrolyte-cathode interface is reached. (B) Mechanical stress inside the cell as a function of time. In black the stress induced by the mere cathode swelling, compared to the stresses in Figure 9, here reprinted in red.
5 Conclusion
In this note we thoroughly investigated battery cells made of a metal lithium foil, a solid electrolyte, and a porous cathode. The overall response of a cell is evaluated in terms of quantities of interest, such as the electric potential, the lithium concentrations profiles, displacements, and stresses. A thermodynamically consistent formulation for coupled continuum electro-chemo-mechanics has been developed. The plating and stripping of the lithium has been considered, together with the expansion and shrinking of the porous cathode. Together, these two processes contribute to the outbreak of mechanical stresses inside the cell, which can lead to fracturing the components and delaminating the interfaces.
The formulation has been applied to a thin film battery with LIPON electrolyte. This easy yet real geometrical configuration is amenable of a one-dimensional modeling, which greatly simplifies the numerical simulations. The fully coupled problem has been solved numerically via the finite element method, using a monolithic scheme Grazioli et al. (2016); Fang et al. (2019). Major outcomes of the simulations have been discussed in section 4.3.
In being one-dimensional, though, the surface area of the lithium anode, where extraction/deposition of lithium occurs, remained unaltered over cycling. After each cycle of charging/discharging, degradation phenomena occur. Accordingly, lithium is not deposited and extracted in the same amounts, in-homogeneity in the interface surface arises together with accumulation of material. Furthermore, stresses are reduced by lithium plasticity. We recognize these events, which will be removed in future works, as the most severe limitations of the present scientific effort.
Author contributions
Conceptualization, LC and AS; methodology, MS, LC, and AS; resources, MS and AS; data curation, writing—original draft preparation, LC and AS; writing—review and editing, MS, LC, and AS; supervision, AS; project administration, AS; funding acquisition, AS and LC All authors have read and agreed to the published version of the manuscript.
Funding
MS expresses his gratitude to the Ferriera Valsabbia company for the liberal donation given in order to fund studies in the field of Mechanobiology. AS and LC acknowledge the funding from BMW Group through the project “Modelling and Simulation of 2-Way Interactions between Mechanics and Electro-Chemistry for Lithium Plating in ASSB” (TIMECLiP).
Conflict of interest
The authors declare that the research was conducted in the absence of any commercial or financial relationships that could be construed as a potential conflict of interest.
Publisher’s note
All claims expressed in this article are solely those of the authors and do not necessarily represent those of their affiliated organizations, or those of the publisher, the editors and the reviewers. Any product that may be evaluated in this article, or claim that may be made by its manufacturer, is not guaranteed or endorsed by the publisher.
References
Anand, L., and Narayan, S. (2019). An elastic-viscoplastic model for lithium. J. Electrochem. Soc. 166, A1092–A1095. doi:10.1149/2.0861906jes
Bistri, D., Afshar, A., and Di Leo, C. (2021). Modeling the chemo-mechanical behavior of all-solid-state batteries: A review. MECCANICA 56, 1523–1554. doi:10.1007/s11012-020-01209-y
Boz, B., Dev, T., Salvadori, A., and Schaefer, J. (2021). Review—electrolyte and electrode designs for enhanced ion transport properties to enable high performance lithium batteries. J. Electrochem. Soc. 168, 090501. doi:10.1149/1945-7111/ac1cc3
Cabras, L., Danilov, D., Subber, W., Oancea, V., and Salvadori, A. (2022). A two-mechanism and multiscale compatible approach for solid state electrolytes of (li-ion) batteries. J. Energy Storage 48, 103842. doi:10.1016/j.est.2021.103842
Carter, R., Klein, E., Kingston, T., and Love, C. (2019). Detection of lithium plating during thermally transient charging of li-ion batteries. Front. Energy Res. 7, 144. doi:10.3389/fenrg.2019.00144
Fang, R., Kronbichler, M., Wurzer, M., and Wall, W. A. (2019). Parallel, physics-oriented, monolithic solvers for three-dimensional, coupled finite element models of lithium-ion cells. Comput. Methods Appl. Mech. Eng. 350, 803–835. doi:10.1016/j.cma.2019.03.017
Grazioli, D., Magri, M., and Salvadori, A. (2016). Computational modeling of Li-ion batteries. Comput. Mech. 58, 889–909. doi:10.1007/s00466-016-1325-8
Li, G., and Monroe, C. W. (2020). Multiscale lithium-battery modeling from materials to cells. Annu. Rev. Chem. Biomol. Eng. 11, 277–310. doi:10.1146/annurev-chembioeng-012120-083016
Liu, G., and Lu, W. (2017). A model of concurrent lithium dendrite growth, SEI growth, SEI penetration and regrowth. J. Electrochem. Soc. 164, A1826–A1833. doi:10.1149/2.0381709jes
Magri, M., Boz, B., Cabras, L., and Salvadori, A. (2022). Quantitative investigation of the influence of electrode morphology in the electro-chemo-mechanical response of li-ion batteries. Electrochimica Acta 405, 139778. doi:10.1016/j.electacta.2021.139778
Mendoza, H., Roberts, S. A., Brunini, V. E., and Grillet, A. M. (2016). Mechanical and electrochemical response of a licoo2 cathode using reconstructed microstructures. Electrochimica Acta 190, 1–15. doi:10.1016/j.electacta.2015.12.224
Narayan, S., and Anand, L. (2020). On modeling the detrimental effects of inhomogeneous plating-and-stripping at a lithium-metal/solid-electrolyte interface in a solid-state-battery. J. Electrochem. Soc. 167, 040525. doi:10.1149/1945-7111/ab75c1
Purkayastha, R., and McMeeking, R. (2012). An integrated 2-D model of a lithium ion battery: The effect of material parameters and morphology on storage particle stress. Comput. Mech. 50, 209–227. doi:10.1007/s00466-012-0724-8
Raijmakers, L., Danilov, D., Eichel, R., and Notten, P. (2020). An advanced all-solid-state li-ion battery model. Electrochim. Acta 330, 135147. doi:10.1016/j.electacta.2019.135147
Reimers, J. N., and Dahn, J. R. (1992). Electrochemical and in situ x-ray diffraction studies of lithium intercalation in li x coo2. J. Electrochem. Soc. 139, 2091–2097. doi:10.1149/1.2221184
Salvadori, A., Grazioli, D., Geers, M., Danilov, D., and Notten, P. (2015a). A multiscale-compatible approach in modeling ionic transport in the electrolyte of (lithium ion) batteries. J. Power Sources 293, 892–911. doi:10.1016/j.jpowsour.2015.05.114
Salvadori, A., Grazioli, D., Magri, M., Geers, M., Danilov, D., and Notten, P. (2015b). On the role of saturation in modeling ionic transport in the electrolyte of (Lithium ion) batteries. J. Power Sources 294, 696–710. doi:10.1016/j.jpowsour.2015.06.061
Salvadori, A., McMeeking, R., Grazioli, D., and Magri, M. (2018). A coupled model of transport-reaction-mechanics with trapping. Part I - small strain analysis. J. Mech. Phys. Solids 114, 1–30. doi:10.1016/j.jmps.2018.02.006
Schnell, J., Günther, T., Knoche, T., Vieider, C., Köhler, L., Just, A., et al. (2018). All-solid-state lithium-ion and lithium metal batteries – paving the way to large-scale production. J. Power Sources 382, 160–175. doi:10.1016/j.jpowsour.2018.02.062
Sedlatschek, T., Lian, J., Li, W., Jiang, M., Wierzbicki, T., Bazant, M. Z., et al. (2021). Large-deformation plasticity and fracture behavior of pure lithium under various stress states. Acta Mater. 208, 116730. doi:10.1016/j.actamat.2021.116730
Zhang, S., Yang, G., Li, X., Li, Y., Wang, Z., and Chen, L. (2022). Controlled lithium deposition. Front. Energy Res. 10, 837071. doi:10.3389/fenrg.2022.837071
Keywords: electro-chemo-mechanics of materials, materials modeling and simulations, solid state batteries, solid electrolytes, lithium plating
Citation: Cabras L, Serpelloni M and Salvadori A (2022) Electro-chemo-mechanics of solid state batteries with lithium plating and stripping. Front. Mater. 9:1052617. doi: 10.3389/fmats.2022.1052617
Received: 24 September 2022; Accepted: 04 November 2022;
Published: 30 November 2022.
Edited by:
Nicola Maria Pugno, University of Trento, ItalyReviewed by:
Francesco Dal Corso, University of Trento, ItalyYongxing Shen, Shanghai Jiao Tong University, China
Copyright © 2022 Cabras, Serpelloni and Salvadori. This is an open-access article distributed under the terms of the Creative Commons Attribution License (CC BY). The use, distribution or reproduction in other forums is permitted, provided the original author(s) and the copyright owner(s) are credited and that the original publication in this journal is cited, in accordance with accepted academic practice. No use, distribution or reproduction is permitted which does not comply with these terms.
*Correspondence: A. Salvadori, YWxiZXJ0by5zYWx2YWRvcmlAdW5pYnMuaXQ=