 Abdolah Gafti1
 Reza Taherian
94% of researchers rate our articles as excellent or good
Learn more about the work of our research integrity team to safeguard the quality of each article we publish.
Find out more
ORIGINAL RESEARCH article
Front. Mater., 28 October 2022
Sec. Polymeric and Composite Materials
Volume 9 - 2022 | https://doi.org/10.3389/fmats.2022.1024730
This article is part of the Research TopicPolymer Composites Based on Nanofillers: Design, Properties, and ApplicationsView all 5 articles
Outdoor 24-kV power transmission insulators include two main pieces, namely, the shed and core. In this study, these pieces were manufactured separately by roll/hot pressing and hand lay-up methods, respectively. Both shed and core were formed from polymer-based composites due to their low weight, high strength-to-weight ratio, and higher moisture and pollution resistance compared to those of ceramic and glass sheds. The sheds were made from silicone rubber as the matrix and alumina trihydrate (ATH) and TiO2 as additives in single- and double-filler composites. The characterization tests of the sheds included variable (max stability voltage) and constant (dry, wet, and notched max endurance voltage, as well as erosion) voltage tests, in addition to contact angle tests. The results of these analyses demonstrated that silicone rubber reinforced with 5 wt.% TiO2 was the best shed material based on its hydrophobicity. The core of the insulator was made of epoxy reinforced with different glass fiber percentages (10, 13, and 15 wt.%). The manufacturing method was hand lay-up. Tensile strength and scanning electron microscopy (SEM) were used for characterization.
Outdoor high-voltage power transmission insulators experience many stresses. These stresses are classified into three categories: 1) environmental (ultra-violet [UV] radiation, moisture, ice, snow, rain, high/low temperature, and chemical attacks); 2) electrical stresses (dry band arcing, partial discharge, and corona); and 3) mechanical stresses (fatigue due to cyclic loads, and thermal shock) (Huang et al., 2011).
An ideal insulator has properties including high electrical resistance, high mechanical durability, lack of impurities and internal holes, low thermal expansion coefficient, resistance to temperature variations, high reliability, self-cleaning property, low insulation coefficient, resistance to water penetration and contamination, and low cost (Licari, 2003; Askeland et al., 2011; Huang et al., 2011; Taherian and Kausar, 2019).
As shown in Figure 1, a high-voltage transmission insulator contains two parts: the shed and the core. The shed is attributed to the housing of the insulator that inhibits flashover. The core is the central bar that bears the insulation weight. We separately present a literature review on the materials and production of shed and core.
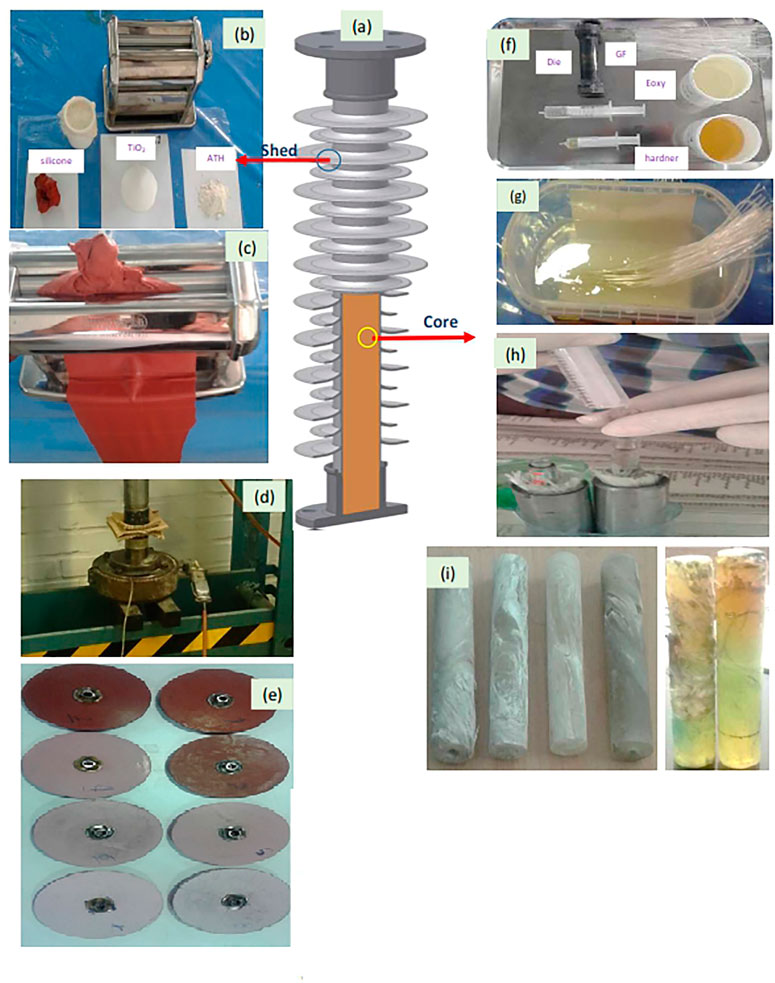
FIGURE 1. (A) Schematic of a high-voltage insulator containing the shed (left side) and core (right side). (B) Raw materials (silicone rubber, TiO2, and ATH powders) and roll milling apparatus. (C) Roll milling of the raw materials to produce the paste. (D) Hot pressing the paste. (E) Samples manufactured with different fillers for the high-voltage tests. (F) Raw materials (two-component epoxy and die). (G) Epoxy resin impregnation of the glass fibers. (H) Resin injection into the die. The fibers are initially aligned along the die length. The resin is then injected into the die (I) cores.
The ability of shed insulators to resist the stresses described above can be enhanced by changing their design and materials. The current materials used in sheds include ceramics, glasses, polymers, and composites (Kumosa, 2004; Andersson et al., 2007; Gubanski, 2008; Papailiou and Schmuck, 2013). Ceramics and glass have high density, about three times those of polymer and composite; moreover, they are brittle and sensitive to cracking (Lockhart, 2006; Andersson et al., 2007; Gubanski, 2008; Global Composite Insulators Market, 2019; Bayliss and Hardy, 2022). Ceramic and glass-type sheds have high hydrophilic properties (Andersson et al., 2007; Gubanski, 2008; Schmuck, 2013; Marchi, 2014) that lead to the accumulation and adherence of pollutants, snow, and rain on their surfaces, thereby leading to partial discharge, corona discharge, or dry band arcing.
Compared to glass and ceramic sheds, the benefits of polymer-based composite sheds have merits include lower weight, lower cost, higher strength-to-weight ratio, lower sensitivity of the mechanical properties to impurities, self-cleaning, lower absorption of contaminants, and lower wettability with moisture (Papailiou and Schmuck, 2013). The self-cleaning feature of these insulators and their decontamination are the main disadvantages of power lines. The accumulation of contamination on the shed can lead to discharging and firing, similar to the events in the Khoozestan state of Iran in 2016. Moreover, polymer-based composite sheds have long-term pollution resistance and more hydrophobicity against rain, ice, and snow compared to other materials (Askeland et al., 2011).
The first use of a polymer as an electrical insulator was reported in 1940 when the polymer was cast using a cycloaliphatic epoxy resin (Noori, 2007; Aman, 2011; Gorur et al., 2012). Among polymers, silicone rubber and ethylene propylene diene monomer (EPDM) show better properties compared to other polymers (Askeland et al., 2011). However, because of the abundance of low surface energy groups (CH3), silicone rubber has a higher hydrophobicity than those of EPDM and other polymers (Askeland et al., 2011). Extremely polluted and wet areas such as deserts and sultry regions show no electrical arc with silicone rubber sheds (Licari, 2003; Singh, 2011; Hosung et al., 2014; Narayanan, 2014).
Despite the advantages of silicone rubber, it has a low resistance to surface electrical stresses. The use of inorganic fillers such as TiO2, SiO2, BaTiO3, Al2O3.3H2O (ATH), and ZnO nanoparticles can compensate for this deficiency by enhancing the homogeneity and distribution of the electric field on their surface and diminishing the electrical stresses on high-voltage outdoor insulators (Cherney, 2005). The fillers create self-cleaning surfaces on the insulators, which inhibit contaminant adherence, thereby efficiently removing the dust from the shed surface. These fillers increase the surface tension of silicone rubber. In the self-cleaning surfaces, dirt particles, snow, and drops are removed from the insulator surface. Fillers such as ATH and silica powders are commonly imparted into silicone rubber to increase the tracking and erosion resistance, leading to increased surface hydrophobicity, relative permittivity, and electric field distribution and homogeneity (Cherney, 2005).
The weaknesses of composite sheds include their lower compressive strength and higher thermal expansion coefficient compared to those of glass and ceramic sheds. These defects can be improved by adding fillers such as ATH to increase the anti-abrasive properties of TiO2 to enhance the photocatalytic features (Lockhart, 2006; Andersson et al., 2007; Gubanski, 2008; Mikiya and Kazukiyo, 2008; Gafti, 2017; Verma and SubbaReddy, 2017; Guruprasad et al., 2018; Global Composite Insulators Market, 2019; Bayliss and Hardy, 2022). ATH significantly increases the resistance of silicone rubber to aging resulting from thermal-ionized partial discharges such as pre-arcs. ATH increases the resistance of silicone rubber against high UV radiation and salt deposition (Mavrikakis et al., 2014). However, the addition of ATH can increase viscosity, leading to the hardening of the composite injection to the mold. To solve this problem, the present study developed a new method, including a rolling process, to mix silicone rubber with ATH and TiO2 as filler (Papailiou and Schmuck, 2013).
The insulating properties and hydrophobicity of these composite sheds depend on factors including shed shape, filler type, resin type, polymer surface roughness, mixing method, and production conditions (Owen et al., 1986; Chateauminois et al., 1994; Kumosa et al., 2005; Raji et al., 2006; Naebe et al., 2016).
The rod-shaped core is also called a fiber-reinforced polymer (FRP) bar. This bar should act as an insulator and is the major component bearing the insulator weight and other mechanical stresses, such as wind and snow weight (Papailiou and Schmuck, 2013). E-glass fibers and polymer resin as the reinforcing and matrix phases, respectively, are used to build a composite core (Amini and Khavandi, 2018). These bars can be produced by pultrusion or filament winding methods (Raymond and Meyer, 1985; Armentrout et al., 2003; Venkatesh and Praveen, 2017). Pultruded rods use a particular form of glass fiber-reinforced polymer (GFRP) in which a bundle of glass fibers is wetted with epoxy or polyester resins and then slowly pulled through a heated die to cure the resin. The rod contains fibers embedded in resin aligned along the rod. The fiberglass content may be as much as 80 wt.%, and the cured material has a very high axial strength and modulus due to the aligned fibers. Such rods are relatively cheap, can bear very high mechanical loads, and have excellent environmental and electrical resistance. Therefore, they are useful in high-voltage electrical installations (Owen et al., 1986).
Armentrout et al. (2003) described water diffusion into and electrical testing of unidirectional glass-reinforced polymer GRP composite rods used as load-bearing components in high-voltage composite non-ceramic insulators. Amini and Khavandi (2018) investigated the acid absorption, breakdown voltage, and tensile strength of rod-like GFRP composites for use in insulator cores in power transmission lines. Venkatesh and Praveen (2017) exposed these FRP bars to high temperatures and investigated the tensile strength and Young’s modulus at different temperatures.
This study formed and assessed two essential components of outdoor 24-kV transmission insulators, the shed and core, made of nanocomposites. The shed used silicon rubber as the polymer matrix and ATH and TiO2 as nanofillers. The effect of filler type and filler value on the dielectric properties, including maximum (max) stability voltage, dry max endurance voltage, wet max endurance voltage, notched max endurance voltage, erosion, and contact angle, was investigated. The novelty of this study is the use of different single and hybrid nanofillers for the shed composition and the series of high-voltage analyses of the samples. The core included an epoxy matrix and E-glass fiber filler. The effect of the fiberglass value on the mechanical properties of manufactured cores was investigated. Moreover, this study also used a hand lay-up method to produce the cores and compared its properties to those of the common pultrusion method for core production.
Table 1 lists the materials to construct the shed and the core of the insulator. The compositions of the samples are described in Table 2.
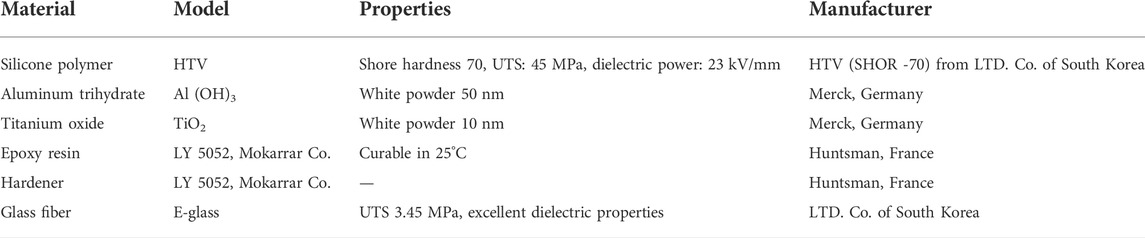
TABLE 1. Materials used for the preparation of the composite insulators.
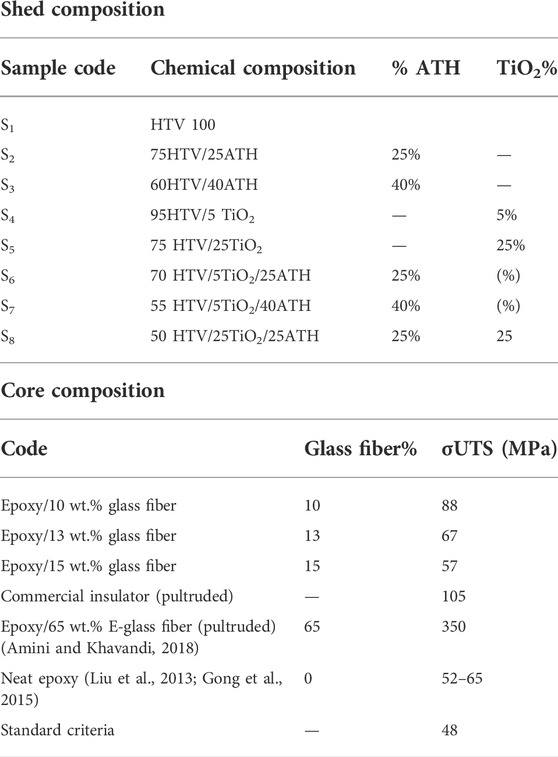
TABLE 2. Compositions and codes of the prepared shed and core composite samples.
High-temperature vulcanized (HTV) silicone rubber has a high resistance at high and low temperatures (−70 to 200°C). HTV has low wettability to water drops, soil, and contamination. Silicone rubber has a volumetric resistivity as high as 10–16 cmΩ. ATH increases erosion and aging resistance, as well as performance against pollution and harsh climates. TiO2 increases hydrophobicity, self-cleaning properties, and UV resistivity of the shed surface.
To manufacture the insulator core, epoxy resin with hardener was used as a binder, with E-glass fiber used as reinforcement (Table 2).
For perfect mixing and uniform distribution of materials in the field, a roller mixer consisting of two cylindrical rollers rotating in opposite directions was used through a convenient two-roll milling/hot-pressing process. Due to the high viscosity of HTV silicone rubber, mixing ATH and TiO2 into the polymer was impossible. Moreover, ATH and TiO2 are nano-sized; thus, they require high shear forces to separate agglomerated particles. Rolling is the only method that can create high shear forces on the silicone rubber paste. The mixing steps were such that the silicone was rolled at approximately 0.5 revolutions per second. At each level, certain percentages of the ATH and TiO2 fillers were distributed uniformly on the silicon surface and the rolling process was repeated until the composition was completely homogeneous and the color of the discs was uniform, as shown in Figure 1A. Next, the materials were hot-pressed using a steel cylindrical die 12 cm in diameter. The pressing pressure and temperature were 100 bar and 150°C, respectively. The produced discs were 12 cm in diameter and 5 mm in thickness. Aluminum electrode conductors were placed in the discs for the electrical tests, as shown in Figures 2A–D.
FIGURE 2. Setup of the high-power voltage tests for sheds in (A) maximum stability, (B) dry max endurance, and (C) wet max endurance voltage tests, as well as (D) the notched max endurance voltage and (E) erosion-resistance test. (F) High-power voltage tests for a real high-voltage insulator containing a shed and core.
To make the cores using the hand-layup method, the resin and hardener were first mixed. Next, some holes were embedded in a cylindrical die containing two caps. A release agent was then drawn on the die to release the composite from the die. The fibers were impregnated with a resin mixture and passed from the die’s holes. Afterward, a syringe was used to inject the extra resin into the die to fill vacant spaces and porosities. The resin was cured at environment temperature for 24 h. Figure 1 shows the steps of the preparation of the sheds and cores.
SEM was used to analyze the fracture surface of the core samples. The SEM apparatus, a Sigma 300-HV Zeiss field emission model made in Germany, was used to image the core composites. Gold layer coating was required to evaluate the insulator samples.
The max stability voltage is defined as the maximum voltage that can be induced on the sample without any discharge (Figure 2A). This test was performed based on the IEC 60-1, IEC 383-1, and IEC 61109 standards. In this test, the power was applied to each sample until discharge occurred. All electrical tests were repeated at least two times. As the atmospheric conditions strongly affect this voltage, all tests were performed under standard atmospheric conditions (20°C, 760 mmHg, and 11 gr water/m3). The sample surfaces were polished and dried with alcohol. A linearly incremented electrical potential was applied to both sides of the samples. The voltage was increased linearly until the first spark was observed. This voltage was defined as the maximum power frequency stability voltage (Figure 1A).
According to the IEC 60-1 standard, the obtained discharge voltage was multiplied by a coefficient to consider the effect of temperature and pressure changes from the standard conditions (20°C and 760 mmHg) (IEC, 2010). This coefficient is as follows:
where p is pressure in mmHg and T is the temperature in °C.
The dry max endurance voltage is defined as the maximum voltage endured for 60 s (Figure 2B). The test was performed in dry and wet conditions according to the IEC 60-1, IEC 383-1, and IEC 61109 standards. The voltage was applied to the insulator and increased by 2% per second to reach the test voltage and remained constant for 1 min. The voltage at which the first spark or arc was detected was recorded. In the results, a laboratory test coefficient was also applied.
The wet max endurance voltage (based on IEC 60-1, IEC 383-1, and IEC 61109 standards) is defined as the maximum voltage the sample can endure for 60 s, in the state that water is sprayed to the surface at 15°C, by a water spraying rate of 3 ± 0.3 mm/mm under a 45° spraying angle (Figure 2C). Then, the voltage was applied to the insulator, increased by 2%/s to reach the test voltage, and remained constant for 1 min. When the first spark or arc was detected, it was recorded at the level of the voltage collector. In the results, the laboratory test coefficient was also applied.
One challenge in outdoor power transmission insulators is the probability of creating scratches on the shed surface of composite insulators. In this test, the condition is as same as the dry and wet max endurance voltage tests. The notches are inserted according to Figure 2D.
Figure 2 shows different standard setups (based on the IEC 60-1, IEC 383-1, and IEC 61109 standards), for max stability, dry, wet, and notched max endurance voltages, as well as erosion tests. A real 24-kV insulator is also shown for comparison to the manufactured samples.
Insulator erosion was evaluated according to the IEC 60587 standard (Figure 2E). The sample dimension was 120 × 50 × 6 mm3. The surfaces were polished with 1200-grit sandpaper and then washed with deionized water and alcohol. Finally, the samples were dried in the atmosphere for 24 h at 25°C. After weighing, the samples were subjected to a voltage of 6 kV for 6 h. The weight difference before and after applying the voltage indicated the erosion rate of each sample (IEC, 2007).
Figure 2F shows the testing setup of an assembled high-voltage insulator containing a shed and core.
The wetting angle of water drops on the shed surface indicates the hydrophobicity property of the insulator and, thus, the self-cleaning degree. Wetting angles were determined using the IFTS tensiometer apparatus.
Tensile tests of the core samples were performed based on the IEC 61109 standard on a hydraulic INSTRON 8802 apparatus to draw σ-ε curves until the fracture point (Abu-Danso et al., 2019). The cylindrical sample was 22 mm in diameter and 100 mm in height.
Figure 1 shows the preparation steps for the shed samples and core composite. Afterward, the shed samples were subjected to the following experimental tests: max stability voltage, dry max endurance voltage, wet max endurance voltage, notched max endurance voltage, erosion, and wetting angle tests. The core samples were subjected to the following experiments: tensile strength and SEM.
The results of the max stability voltage test showed the highest voltage for the 95HTV/5TiO2 sample, in which the first spark occurred at 72.89 kV (Figure 3). This working voltage is excellent for application in high-voltage insulators. Increasing ATH >25 wt.% led to a significant decrease in the max stability voltage. Hybrid samples containing both TiO2 and ATH fillers showed worse results and lower max stability voltages. These findings indicated the uniform dispersion and distribution of reinforcing TiO2 nanoparticles in low-TiO2 loading. However, increasing TiO2 or ATH nanoparticles causes agglomeration which created flow through interconnected nanoparticles. Nanoparticles such as TiO2 and ATH in high filler loading tend to clump together due to van der Waals forces, thereby agglomerating the particles together. This force is significant in nanoparticles compared to micro-fillers. The probability of agglomeration in nanofillers is much higher than that for micro-fillers due to the higher surface area, and thus van der Waal’s forces between nanoparticles, in nanofillers.
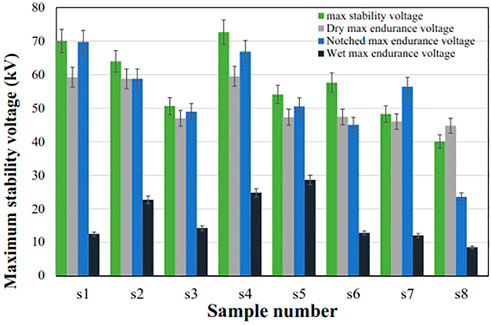
FIGURE 3. Maximum power voltages in different composite samples.
After the test, the shed surface was free of voids or defects, and only electrical failure occurred. High filler loads resulted in particle agglomeration or surface voids, leading to electrical breakdown, thereby perforating the surface.
The results of the dry max endurance voltage test showed the best dry-state sample duration at a voltage for 60 s for the 95HTV/5TiO2 sample, which withstood up to 59.5 kV for 60 s min without any spark or voltage increase/decrease. The worst sample was 50HTV/25TiO2/25ATH containing 50 wt.% (45.11 kV). These results verified the hypothesis that increasing the filler percentage >5 wt.% decreased the ability to withstand voltage compared to bare HTV silicone. After testing, the sample surface was perfect and without defects.
The dry max endurance voltages are shown in Figure 3. Samples S1, S2, and S4 were able to withstand a voltage of 50 kV for 60 s, meeting the standard requirements. No trace of arcing, voltage change, and surfaces defect were observed. A similar test on the factory-made 24 kV insulator showed a max endurance voltage of 35.5 kV for 60 s. S4 showed a higher voltage than that for S8 because the latter sample contained 50 wt.% filler. The high filler loads create agglomeration, which forms paths for flashover and discharge.
The results of the wet max endurance voltage test showed a higher voltage for sample S5 (75HTV/25TiO2) (28.6 kV) compared to that for S4 (24.77 kV). This result may be because TiO2 increases hydrophobicity, thereby increasing the ability to withstand voltage. The samples containing ATH had a lower voltage (22.66 kV). The weakest performance (8.5 kV) was observed for the hybrid samples (50HTV/25TiO2/25ATH). These findings verified the hypothesis that high-filler loading leads to nanoparticle agglomeration, thereby creating an interconnected path for discharge. Decreasing nanoparticles size showed an increasing tendency to agglomeration because of van der Waals’s forces.
Since the partial discharge phenomenon is one of the most critical problems of insulators in areas with high humidity and pollution, max endurance voltage tests were also performed in wet conditions, the results of which are shown in Figure 3. The best effect was observed for the addition of up to 25% TiO2 nanoparticles. The max endurance voltage in the wet state increased from 12.5 kV in sample S1 to 25.5 kV in sample S5. Due to its self-cleaning properties, the use of this composite as a shed on the insulators would make the surfaces immune to pollution and moisture. Thus, other pollutants susceptible to the presence of water will disappear from the surface. It should be noted that if this shed is used, there is no need to wash the insulators in different seasons because these sheds are self-cleaning.
The results of the notched max endurance voltage test showed the best results for the notched sample S1 (69.73 kV), followed by S4 (66.88 kV). Therefore, in the notched state, the addition of both ATH and TiO2 nanofillers decreased the voltage tolerance by creating an interconnected path for discharge. The creation of any notch or hole within polymer-based composite sheds does not cause power failure, while any groove can lead to the failure of ceramic or glass sheds, thereby discharging or cutting off the power network. In general, creating such a problem while working on polymer composite insulators in power lines will not lead to a shutdown; however, this problem occurring in ceramic insulators will rapidly lead to breaks and power outages.
The results of the max stability voltage and three types of max endurance voltage tests showed that the addition of TiO2 nanofiller above 5 wt.% and ATH generally had negative effects due to the agglomeration of nanofillers and the creation of the flashover passage of electrons via the composite. High ATH percentages showed a particular drop in working voltage, as the excess filler caused the filler particles to not be well covered by silicone, resulting in agglomeration of filler particles and consequent the loss of performance of the specimens. Thus, the better distribution of low-filler composites resulted in better performance compared to high-filler composites, with worse filler distributions as high filler loading leads to agglomeration and, ultimately, flashover and discharge.
Khan et al. (Hidayatullah et al., 2017) investigated the effect of micro-ATH and SiO2 particles on the stability voltage of silicone-based insulators. They reported that the distribution of filler particles was more important than the weight percentage of the fillers. They assessed a composite containing silicone rubber as a matrix and 15, 20 wt.% ATH and 5 and 15 wt.% SiO2. The composite containing 15% ATH showed the highest flashover voltage. Consistent with the findings of the present study, increasing the ATH from 15 to 20% decreased the stability voltage. Khan reported that SiO2 (similar to TiO2 in the present study) increased voltage stability. The resistance voltages for the present research are somewhat higher than those reported by Khan et al.
One of the negative factors of polymer-based composite insulators is chemical degradation due to environmental factors such as UV irradiation and acid rain, as well as electrical factors such as corona or discharge of dry bonding and their thermal effects. The results showed the lowest weight loss for S8 (50HTV/25TiO2/25ATH), with the highest weight loss in S1, similar to that for bare silicone rubber. The simultaneous addition of TiO2 and ATH assessed in S6–S8 indicated that the erosion mainly occurred on the polymer matrix and the higher the amount of nanofiller, the better the wear resistance. The lowest erosion value was observed for the 75% HTV/25% TiO2 composite. Compared to pure silicone rubber, this sample showed a >80-fold improved erosion value.
Two factors are useful in interpreting the results of tests of variable voltage (max stability voltage) and constant voltage (dry, wet, and notched max endurance voltage) tests. The first is the weight percentage of TiO2 and ATH; the second is the good dispersion of the particles of fillers in silicone rubber. The results showed no defect in the surface of the samples, indicating the uniform distribution of the reinforcing particles in the matrix. If the particles are not distributed uniformly throughout the structure, or if the sample has porosity, electrical breakdown will occur. During the test, the samples had holes in the surface.
Figure 4 shows that the ceramic nanoparticles increased wear and erosion resistance and, thus, weight loss. The polymer has weak mechanical strength. Therefore, reinforcing the polymer matrix with ceramic, especially nano-sized ceramic powders, can increase erosion and wear resistance in composite insulators. However, nanofillers have a strong tendency to agglomerate, which results in a sharp reduction in mechanical strength. Brostow et al. (2017) also manufactured polymer-based composites reinforced with nano-ceramic fillers, with similar findings. Chakerwarti et al. (2015) also reported that alumina nanoparticles improved erosion resistance even at a small weight fraction (3%). Thus, they concluded that the silicone rubber composites reinforced with nano-sized alumina showed better resistance to tracking and erosion. Meyer et al. (2006) investigated the erosion properties of a silicone rubber composite reinforced with SiO2 micro- and nanoparticles. They reported that nanofillers showed a lower surface roughness and higher erosion resistance compared to micro-fillers. However, nano-SiO2 showed a worse impact on hydrophobicity compared to SiO microparticles, and both showed weaker hydrophobicity compared to bare silicone rubber. This effect may result from the fact that SiO2 particles decrease hydrophobicity.
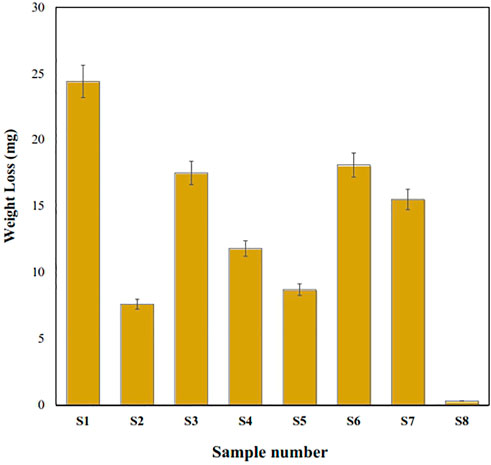
FIGURE 4. Sample weight loss after the erosion test.
Venkatesulu and Thomas (2010) observed that the performance of 4 wt.% nano-alumina in a silicone rubber insulator was comparable to that of 30 wt.% ATH in silicone rubber. They also found that the thermal stability of the nanocomposites was better than those of the micro-composites even at the low concentration of the nanofillers due to the large number and higher dispersion of nanofillers in the insulator bulk, a significant quantity of polymer chains with restricted mobility at the interface between the polymer and the fillers, and better physical bonding between the nanofillers and the polymer matrix. More barriers in front of traveling electrons or phonons can increase thermal and electrical resistivities in the composites containing nanofillers compared to composites containing micro-fillers (Li et al., 2017).
Thomas and Thomas et al. (2010) reported that nanofillers significantly improved the corona in the long run. Only 3 wt. % of filler loading reduced the surface roughness by at least one order, reduced the crack width seven-fold, and reduced the loss of hydrophobicity by seven-fold compared to unfilled samples. The amount of eroded material also decreased with filler loading. Therefore, nanofillers such as ATH and TiO2 can reduce physical degradation in terms of surface erosion and surface roughness, and also improve hydrophobicity. However, the percentage of these nano-sized fillers requires optimization to prevent agglomeration.
Under standard pressure and a temperature between 180°C and 200°C, ATH is converted directly into Al2O3 and water droplets without the intermediate stage of boehmite formation AlO(OH) (Papailiou and Schmuck, 2013). ATH has erosion and cracking resistance. Han et al. (2003) reported that ATH in silicone rubber increased the erosion resistivity even at 60 wt.% ATH loading. However, ATH loading >60 wt.% increases viscosity such that processing based on low-pressure cavity casting is no longer possible. Therefore, in the present study, the maximum ATH was 40 wt.%. The addition of ATH also increases the thermal conductivity of the composite. Loading with 50 wt.% ATH increases the thermal conductivity from 0.2 to 0.5 W/mK and increases the aging resistance of the composite by dissipating heat produced in the insulator (Meyer et al., 1996; Meyer et al., 2004). However, the electrical resistivity of ATH compared to silicone rubber, and the increased viscosity of ATH loading are two limitations of ATH in composites.
Wetting angle test: Hydrophobicity is the most important property of high-voltage insulators, especially in polluted environments. Pollutants such as dust settling in the insulator lead to discharge and firing. The events in 2016 in the Khoozestan state of Iran occurred due to the settling of fine dust on the insulators. A hydrophobic insulator surface will shed dust from the surface through the actions of wind or rain. Nanoparticles such as TiO2 or ATH increase the contact angle or hydrophobicity.
As shown in Figure 5, the addition of both TiO2 and ATH increased the wetting angle or hydrophobicity compared to bare silicone rubber. However, TiO2 showed a stronger effect as the highest wetting angle (113°) was observed for S5, which contained 25 wt.% TiO2, while S3 containing 40 wt.% ATH had an angle of approximately 103°. By simultaneously adding ATH and TiO2 to the matrix, samples S6–S8 showed higher wetting angles compared to that for bare silicone. The lower hydrophobicity of ATH compared to TiO2 may be because ATH has three water molecules that can increase its wettability with water drops. Liu et al. (2015) reported a surface free energy of ATH of 29.02 mJm−2 and a contact angle of water drops on pure ATH as low as 58.1°. The highest hydrophobicity was observed for 75% HTV/25% TiO2. Compared to pure silicone rubber, 25% TiO2 increased the wetting angle by >15%.
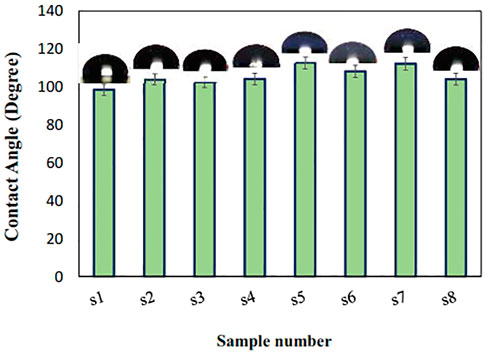
FIGURE 5. Results of contact angle tests for different shed samples.
Table 2 shows that all samples had ultimate tensile strengths (σUTS) above the standard criteria (48 MPa based on standard 61109) (Liu et al., 2013; Gong et al., 2015). The best results were obtained in the sample containing 10 wt.% fiberglass. Moreover, increasing glass fiber percentage resulted in decreased σUTS due to increased fiber agglomeration, which prevents correct resin wetting of the fibers. The SEM image in Figure 6 illustrates fiber wetting by epoxy resin. Another difference between the hand-made composite in this study and the pultruded sample as a commercial sample is that in hand-made composite, especially those with higher fiber percentages, some of the fibers may bend and cannot align along the core length due to the limited capacity of the die. Some fibers are placed at an angle to other fibers. Therefore, when a load is applied to the composite, the fibers are involved one by one and fail, separately, not simultaneously, thereby decreasing the maximum withstanding force. The singular tearing of fibers during the tensile test supports this phenomenon. In pultrusion, the fibers are aligned along the core length without distortion. Therefore, all fibers withstand tearing, which increases σUTS.
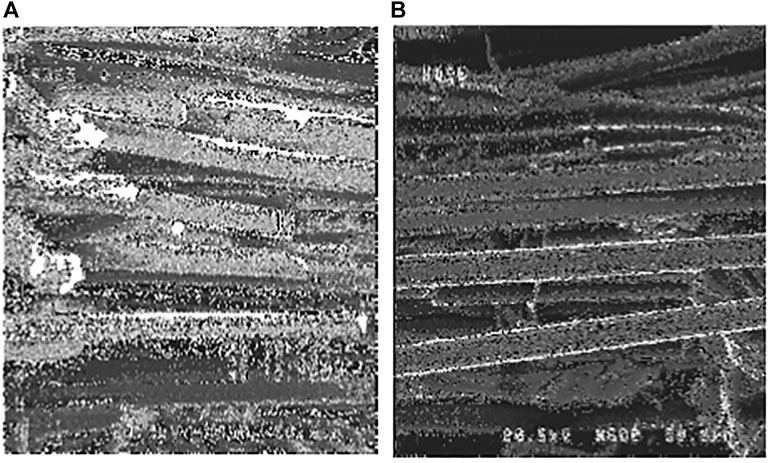
FIGURE 6. SEM image of (A) epoxy/10 fiberglass and (B) epoxy/15 fiberglass.
If the fibers do not rotate and align along the die length, the fiber value can be increased, thereby increasing the composite strength. Amini et al. (2018) reported that the addition of 65% E-glass to epoxy resin resulted in tensile strength of 350 MPa. They used a pultrusion apparatus for composite preparation. Therefore, the fibers aligned along the die without agglomeration.
This study of sheds and cores of 24-kV insulators developed and tested some polymer-based composites. The effects of TiO2 and ATH as additives to silicone rubber sheds and the properties of the hand-layup epoxy-reinforced fiberglass composite as the core were compared to those of pultruded composite. The following results were obtained:
1. Assessment of max stability voltage and max endurance voltages in dry, wet, and notched states for the shed samples showed that the addition of 5 wt.% TiO2 improved the properties by about 5% and that the addition of ATH significantly decreased the best features.
2. The erosion test of shed samples showed better performances of both single- and double-filler composites compared to pure silicone rubber. The least erosion and highest hydrophobicity values were observed for the composite of HTV reinforced with 25% TiO2. Compared to pure silicone rubber, 25% TiO2 improved the erosion value by >300% and increased the wetting angle by >15%.
3. Assessment of the hydrophobicity, which is critical for inhibiting the absorption of pollution and dust, which can cause discharge and firing demonstrated the best results for the HTV/5TiO2 shed candidate.
4. Regarding the core sample, the hand lay-up method passed the standard criteria, comparable to the pultruded commercial core. The optimum filler loading value was 10 wt.% fiberglass, as higher values led to filler agglomeration, thereby decreasing the maximum tensile strength.
The original contributions presented in the study are included in the article/Supplementary Material. Further inquiries should be directed to the corresponding author.
AG contributes in: performing the experimental tests. RT contributes in: Writing, performing the experimental tests, discussion the data SRK: Writing, discussion the data.
The authors appreciate the scientific support for the electrical tests provided by Barzegar, the head of the Insulators and High-voltage Laboratory.
The authors declare that the research was conducted in the absence of any commercial or financial relationships that could be construed as a potential conflict of interest.
All claims expressed in this article are solely those of the authors and do not necessarily represent those of their affiliated organizations, or those of the publisher, the editors, and the reviewers. Any product that may be evaluated in this article, or claim that may be made by its manufacturer, is not guaranteed or endorsed by the publisher.
Abu-Danso, E., Bagheri, A., and Bhatnagar, A. (2019). Facile functionalization of cellulose from discarded cigarette butts for the removal of diclofenac from water. Carbohydr. Polym. 219, 46–55. doi:10.1016/j.carbpol.2019.04.090
Aman, A. (2011). Dielectric strength of waste tyre dust-polypropylene (WTD-PP) for high voltage application. Aust. J. Basic Appl. Sci. 5, 1578–1583.
Amini, M., and Khavandi, A. (2018). Evaluation of the electrical properties and mechanical behavior of insulator’s composite core in harsh environments. Mat. Res. Express 5 (11), 115306. doi:10.1088/2053-1591/aadde1
Andersson, J., Gubanski, S. M., and Hillborg, H. (2007). Properties of interfaces in silicone rubber. IEEE Trans. Dielectr. Electr. Insul. 14 (1), 137–145. doi:10.1109/tdei.2007.302882
Armentrout, D., Kumosa, M., and Kumosa, L. (2003). Water diffusion into and electrical testing of composite insulator GRP rods. IEEE Trans. Dielectr. Electr. Insul. 11 (3), 306–322. doi:10.1109/tdei.2004.1306729
Askeland, D. R., Fulay, P. P., and Wright, W. J. (2011). The science and engineering of materials. USA ed. Boston, MA, USA: Cengage Learning.
Bayliss, C. R., and Hardy, B. J. (2022). Chapter 6 - insulators, in transmission and distribution electrical engineering (Fourth edition. Vol. 171-188). London, UK: Newnes.
Brostow, W., Lobland, H., Hnatchuk, N., and Perez, J. (2017). Improvement of scratch and wear resistance of polymers by fillers including nanofillersfillers. Nanomaterials 7 (66), 66. doi:10.3390/nano7030066
Chakerwarti, H. K., Agarwal, A., Kumar, P., and Gupta, N. (2015). Study of silicone rubber based composites with nano sized fillers. Mater. Sci. Forum 830-831, 600–603. doi:10.4028/www.scientific.net/msf.830-831.600
Chateauminois, A., Vincent, L., Chabert, B., and Soulier, J. (1994). Study of the interfacial degradation of a glass-epoxy composite during hygrothermal ageing using water diffusion measurements and dynamic mechanical thermal analysis. Polymer 35 (22), 4766–4774. doi:10.1016/0032-3861(94)90730-7
Cherney, E. A. (2005). Silicone rubber dielectrics modified by inorganic fillers for outdoor high voltage insulation applications. IEEE Trans. Dielectr. Electr. Insul. 12 (6), 1108–1115. doi:10.1109/tdei.2005.1561790
Gafti, A. (2017). Manufacturing of composite insulators coated with silicone (HTV) reinforced by aluminum hydrate and TiO2 nanoparticles in chemical and materials engineering department. Shahrud, Iran: Shahrood university of Technology.
Global Composite Insulators Market (2019). Report, global composite insulators Market 2019 – SEVES, lapp insulators, pfisterer, INAEL elactrical, gruppo bonomi, ABB, saver group, MR.
Gong, L. X., Zhao, L., Tang, L. C., Liu, H. Y., and Mai, Y. W. (2015). Balanced electrical, thermal and mechanical properties of epoxy composites filled with chemically reduced graphene oxide and rubber nanoparticlesfilled with chemically reduced graphene oxide and rubber nanoparticles. Compos. Sci. Technol. 121, 104–114. doi:10.1016/j.compscitech.2015.10.023
Gorur, R., et al. (2012). in Evaluation of epoxy nanocomposites for high voltage insulation. Editor F. P. Report (Chandigarh, USA: PSERC).
Gubanski, M. S. (2008). Ageing of composite insulators in ageing of composites. Sawston, UK: Woodhead Publishing, 421–447.
Guruprasad, A., Yaxue, L., and Guiyin, F. (2018). Thermal and electrical characterization of polymer/ceramic composites with polyvinyl butyral matrix. Mater. Chem. Phys. 205, 401–415. doi:10.1016/j.matchemphys.2017.11.046
Han, D. H., Cho, H. G., and Han, S. W. (2003). “Effects of alumina trihydrate on the electrical insulation properties of HTV silicone rubber,” in Proceedings of the 7th international conference on properties and applications of dielectric materials.
Hidayatullah, K., Muhammad, A., Ayaz, A., and Muhammad, Y. (2017). Impact of alumina trihydrate and silica on mechanical, thermal and electrical properties of silicone rubber composites for high voltage insulations. Res. Dev. Material Sci. 2 (3), 1–8.
Hosung, J., Park, C., Lee, J., and Park, Y. S. (2014). Tribological and electrical properties of TiO2 thin films for polymer insulator as the dielectric coating of electric railroad. Mater. Res. Bull. 58, 44–48. doi:10.1016/j.materresbull.2014.04.054
Huang, X., Jiang, P., and Tanaka, T. (2011). A review of dielectric polymer composites with high thermal conductivity. IEEE Electr. Insul. Mag. 27 (4), 8–16. doi:10.1109/mei.2011.5954064
IEC (2010). IEC 60060-1, in High voltage test techniques-part1: General definitions and test requirements. Geneva, Switzerland: IEC.
IEC (2007). In electrical insulating materials used under server ambient conditions-test methods for evaluating resistance to tracking and erosion in IEC. Geneva, Switzerland: IEC.
Kumosa, L., Armentrout, D., Benedikt, B., and Kumosa, M. (2005). An investigation of moisture and leakage currents in GRP composite hollow cylinders. IEEE Trans. Dielectr. Electr. Insul. 12 (5), 1043–1059. doi:10.1109/tdei.2005.1522197
Kumosa, L. (2004). Moisture absorption properties of unidirectional glass/polymercomposites used in composite (non-ceramic) insulators. Compos. Part A Appl. Sci. Manuf. 35, 1049–1063. doi:10.1016/j.compositesa.2004.03.008
Li, A., Zhang, C., and Zhang, Y. F. (2017). Thermal conductivity of graphene-polymer composites: Mechanisms, properties, and applications. Polymers 9 (437), 437. doi:10.3390/polym9090437
Licari, J. J. (2003). Coating materials for electronic applications polymers, processes, reliability, testing. New York: William Andrew.
Liu, G., Zhou, B. h., Li, Y. f., Qi, T. g., and Li, X. b. (2015). Surface properties of superfine alumina trihydrate after surface modification with stearic acid. Int. J. Min. Metall. Mat. 22 (5), 537–542. doi:10.1007/s12613-015-1104-0
Liu, L., Zhou, Y., and Pan, S. (2013). Experimental and analysis of the mechanical behaviors of multi-walled nanotubes/polyurethane nanoweb-reinforced epoxy composites. J. Reinf. Plastics Compos. 32 (11), 823–834. doi:10.1177/0731684413480007
Lockhart, B. (2006). California glass insulator Co. Long Beach, California: California Glass Insulator Co.
Marchi, S. (2014). “Preparation and characterization of silicone nanocomposites by UV-induced hydrosilation for outdoor polymeric insulators,” in Materials science and Technology (Turin, Italy: Polytechnique Di Torino).
Mavrikakis, N., Siderakis, K., and Mikropoulos, P. N. (2014). “Laboratory investigation on hydrophobicity and tracking performance of field aged composite insulators,” in 49th International Universities Power Engineering Conference (UPEC).
Meyer, H. L., Cherney, E. A., and Jayaram, S. H. (1996). The role of inorganic fillers in silicone rubber for outdoor insulation-alumina tri-hydrate or silica. IEEE Electr. Insul. Mag. 20 (4), 13–21. doi:10.1109/mei.2004.1318835
Meyer, L. H., Cabral, S. H. L., Araujo, E., Cardoso, G., and Liesenfeld, N. (2006). Use of nano-silica in silicone rubber for ceramic insulators coatings in coastal areas. IEEE Int. Symposium Electr. Insulation 2006. doi:10.1109/ELINSL.2006.1665359
Meyer, L., Jayaram, S., and Cherney, E. A. (2004). Thermal conductivity of filled silicone rubber and its relationship to erosion resistance in the inclined plane test. IEEE Trans. Dielectr. Electr. Insulation 2004, 620–630.
Mikiya, I., and Kazukiyo, N. (2008). Degradation issues of polymer materials used in railway field. Polym. Degrad. Stab. 93 (10), 1723–1735. doi:10.1016/j.polymdegradstab.2008.07.011
Naebe, M., Abolhasani, M. M., Khayyam, H., Amini, A., and Fox, B. (2016). Crack damage in polymers and composites: A review. Polym. Rev. 56 (1), 31–69. doi:10.1080/15583724.2015.1078352
Narayanan, V. J. (2014). Analysis ofsSurface condition of polymeric insulators for high voltage power transmission line applications using partial discharge analysis. Int. J. Eng. Sci. 2014, 31–40.
Noori, N. R. (2007). Effect of materials design on properties of porcelain insulators. Am. Ceram. Soc. Bull. 86 (3).
Owen, M. J., Harris, S. J., and Noble, B. (1986). Failure of high voltage electrical insulators with pultruded glass fibre-reinforced plastic cores. Composites 17 (3), 217–226. doi:10.1016/0010-4361(86)91005-0
Raji, S., Soundarajan, E., Mohammed, A., and Graves, J. (2006). Multistress accelerated aging of polymer housed surge arresters under simulated coastal Florida conditions. IEEE Trans. Dielectr. Electr. Insul. 13 (1), 211–226. doi:10.1109/tdei.2006.1593419
Raymond, W., and Meyer, B. S. Ch.E. (1985). Handbook of pultrusion technology. New York, London: Chapman & Hall.
Schmuck, F. (2013). Silicone composite insulators .materials, design, applications. Vol. 1860-4676. Berlin, Germany: Springer.
Singh, P. (2011). Polymer condenser bushing with composite air and silicone insulator. Zürich, Switzerland: Abb Inc.
Taherian, R., and Kausar, A. (2019). “Electrical conductivity in polymer-based composites, experiments, modelling, and applications,” in Plastic design library (PDL), PDL Handbook, ed. s. Edition (Norwich, NY, USA: William Andrew is an imprint of Elsevier).
Thomas, B. V., and Thomas, M. (2010). Corona aging studies on silicone rubber nanocomposites. IEEE Trans. Dielectr. Electr. Insul. 17 (2), 625–634. doi:10.1109/tdei.2010.5448120
Venkatesh, M. K., and Praveen, H. Y. (2017). Review on behaviour of FRP composites subjected to elevated temperatures. Int. J. Innovative Res. Adv. Eng. 4 (4).
Venkatesulu, B., and Thomas, M. J. (2010). Erosion resistance of alumina-filled silicone rubber nanocomposites. IEEE Trans. Dielectr. Electr. Insul. 17, 615–624. doi:10.1109/tdei.2010.5448119
Keywords: composite insulators, shed and core, manual hand layup, withstanding voltage, insulator
Citation: Gafti A, Taherian R and Kiahoseini SR (2022) Chemical composition optimization of nanocomposites used for shed and core of outdoor composite insulators. Front. Mater. 9:1024730. doi: 10.3389/fmats.2022.1024730
Received: 22 August 2022; Accepted: 12 October 2022;
Published: 28 October 2022.
Edited by:
Lik-ho Tam, Beihang University, ChinaReviewed by:
Xing Quan Wang, City University of Hong Kong, Hong Kong SAR, ChinaCopyright © 2022 Gafti, Taherian and Kiahoseini. This is an open-access article distributed under the terms of the Creative Commons Attribution License (CC BY). The use, distribution or reproduction in other forums is permitted, provided the original author(s) and the copyright owner(s) are credited and that the original publication in this journal is cited, in accordance with accepted academic practice. No use, distribution or reproduction is permitted which does not comply with these terms.
*Correspondence: Reza Taherian, cmV6YXRhaGVyaWFuQGdtYWlsLmNvbQ==
Disclaimer: All claims expressed in this article are solely those of the authors and do not necessarily represent those of their affiliated organizations, or those of the publisher, the editors and the reviewers. Any product that may be evaluated in this article or claim that may be made by its manufacturer is not guaranteed or endorsed by the publisher.
Research integrity at Frontiers
Learn more about the work of our research integrity team to safeguard the quality of each article we publish.