 Bowen Wang
 Yang Liu1,2
- 1School of Civil Engineering, Changsha University of Science and Technology, Changsha, China
- 2School of Civil Engineering, Hunan University of Technology, Zhuzhou, China
Corrosion of reinforced bars and the fatigue effect in concrete structures significantly impact the bond performance of reinforced bars. The current research mainly focuses on the effect of fatigue or corrosion on the bonding properties of steel bars, which is still quite different from the service environment of the structure. The degradation law of the bond performance, failure characteristics, and changing trend of bond stress along the anchorage length of reinforced concrete specimens were analyzed under the combined action of fatigue and corrosion in this test. Under the combined action of corrosion and fatigue, the specimens’ bond stress and slip limit are significantly reduced, and the steel bars may fracture during the loading process. There are two peaks in the longitudinal distribution curve of the combined stress of the specimen under the combined action of fatigue and corrosion.
1 Introduction
Concrete has low tensile strength and is easy to crack due to shrinkage, hydration heat, and other reasons (Huang et al., 2021). The corrosive media, such as water, chloride, and oxygen, enter the concrete from the cracks to cause the corrosion of the reinforced bars in reinforced concrete (RC) structures, resulting in the degradation of the bond performance of the reinforced bars. The bond strength of the reinforced bars is also damaged under the fatigue load cycles. Furthermore, concrete structures’ bearing capacity and service life are affected (Luo et al., 2021). Most practical projects such as highway bridges and other reinforced concrete structures have long-term service in harsh environments, not only the corrosion of steel bars but also the fatigue problems caused by repeated loading such as vehicle loads (Guo et al., 2020).
The bond stress distribution along the length direction of reinforced bars depended on the cycle number of fatigue loading and was closely related to the loading amplitude (Morris et al., 2015). In the initial loading stage, the concrete in front of the cross ribs of the reinforced bars becomes dense with the loading cycles, and the bond strength could increase in some contexts (Ye et al., 2016). However, the bond strength will decrease when loading to a critical value (Murcia-Delso et al., 2013). If the bond stress exceeds its bond strength of monotonic loading during the first cycles of fatigue loading, the bond stress will degrade very seriously in the subsequent loading cycles. The bond strength is more sensitive to the degree of corrosion than the fatigue loading. Almusallam et al. (Almusallam et al., 1996) found that the bond strength of reinforced bars is increased when the corrosion loss of the reinforced bars in concrete is less than 5%. However, when the corrosion loss reaches 9%, the bond strength is only one-third of the uncorroded specimens (Feng et al., 2016). As the corrosion loss further increases, the bond strength of the reinforced bars will decrease rapidly (Cabrera, 1996; Yalciner et al., 2012). The slip value in the reinforced bars’ free end and loading end gradually decreases with the corrosion loss (Lin et al., 2017). Afterwards, the slip value no longer changes obviously with the corrosion loss.
In addition, the bond strength model has been established through the pull-out test (Auyeung et al., 2000; Chung et al., 2004; Bhargava et al., 2007; Tondolo, 2015) and the bending test (Stanish, 1999; Tondolo, 2015). Feng et al. (Feng et al., 2016) and Kivell (Kivell, 2012) obtained a three-segment curve related to the bond stress and slip by the regression analysis on the existing test database. Generally, the bond stress-slip relationship between the reinforced bar and concrete usually refers to the relationship between the average bond stress and the slip at the free end. Moreover, some researchers have studied bond stress distribution along the length direction in the anchorage zone of RC specimens (Jokūbaitis et al., 2014; Jokūbaitis et al., 2017). It is shown that the distribution curve of bond stress in the bond section gradually becomes flat with the corrosion of the reinforced bars (Zhao et al., 2013). In addition, Ma et al. (Ma et al., 2017) found that the peak value of bond stress appeared near the specimen end of free and pull-out. The peak value moved to the free end in the bond stress distribution as the load increased. Based on the test results, Blomfors et al. (Blomfors et al., 2018) established an evaluation model for the anchorage performance of corroded RC. The experimental results of Shang (Shang et al., 2022) showed that the bond strength of beam specimens under the coupled repeated loading and chloride ion attack was lower than that of the specimens under repeated loading or chloride ion attack alone.
The above research mainly involved the corrosion test of reinforcement. Namely, accelerated corrosion of the reinforced bars was carried on, and the pull-out test of the RC specimens was conducted. There are few studies on the effect of combined corrosion and fatigue on the bond properties of reinforced concrete. This study investigated the statics bond performance of reinforcement-concrete interface after the combined action of corrosion and fatigue. It has important practical meanings for the prediction of bridge life and the improvement of bridge assessment.
2 Experimental program
2.1 Test specimens
Eccentric pull-out specimens with ten groups were tested in this study. The size of the pull-out specimens is designed to be 150 mm × 150 mm × 150 mm. The reinforced bar with Chinese grade HRB335 is selected in the pull-out test, and its diameter is 18 mm. The thickness of the protective layer of the reinforced bars is 30 mm. To avoid the concrete crack by local squeezing, a PVC pipe with an inner diameter of 22 mm and a length of 50 mm was set in the bond zone at the end of the loading end to achieve a reasonable bond length. The effective bond length is 100 mm, which belongs to the short anchorage specimens. The gap between the PVC pipe and concrete was filled with epoxy resin to prevent the concrete from entering the gap. The exposed part of the reinforced bars was coated with epoxy resin to prevent corrosion during the concrete curing process. The design of the specimens is shown in Figure 1.
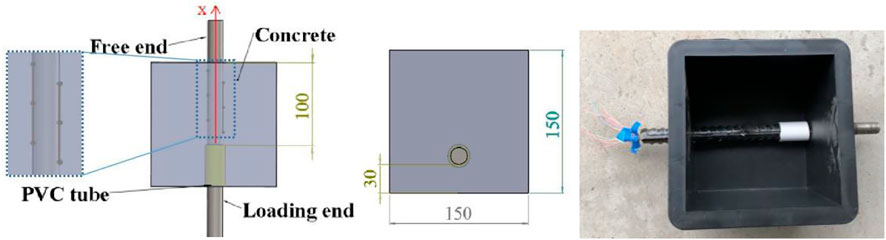
FIGURE 1. Dimension of pull-out specimens (unit: mm).
To accurately measure the change of bond stress along the anchorage zone of the reinforced bar, the reinforced bar was cut in half, and then a groove for a built-in strain gauge was cut with a size of 3 mm × 6 mm at the axis position, shown in Figure 2. After the inner surface of the groove was wiped with the alcohol, the strain gauges were evenly fixed in the groove and sealed with the epoxy resin to improve the accuracy of strain gauges. The strain gauges were arranged with a spacing of 15 mm along the length direction of the reinforced bar. The strain gauge at the loading end was 15 mm away from the PVC tube.
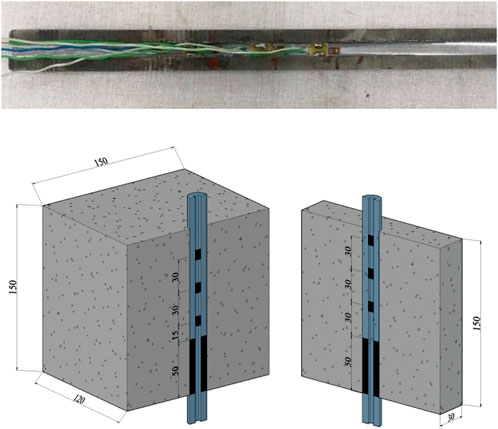
FIGURE 2. Interior strain gauge of test specimens.
2.2 Material properties
The concrete specimens were made of ordinary Portland cement, tap water, fine and coarse aggregates. The mix-proportion is Cement: Sand: Stone: Water = 1: 1.82: 3.16: 0.50. Three concrete test blocks with a side length of 150 mm were reserved. After curing for 28 days, the average compressive strength of concrete at 28 days is tested at 31.86 MPa. The HRB335 reinforced bar will be placed in the chuck of the universal testing machine, the specimen will be aligned with the center of the chuck, and then the tensile test will be performed to determine the yield strength and tensile strength. The yield strength of the HRB335 reinforced bar is 285.7 MPa, and its tensile strength is 397.1 MPa. The Young’s modulus of HRB335 reinforcement was 200 GPa.
2.3 Test set-up
This test designed ten groups related to fatigue, corrosion, and combined action, shown in Table 1. The preset damage of these groups is listed in Table 1.
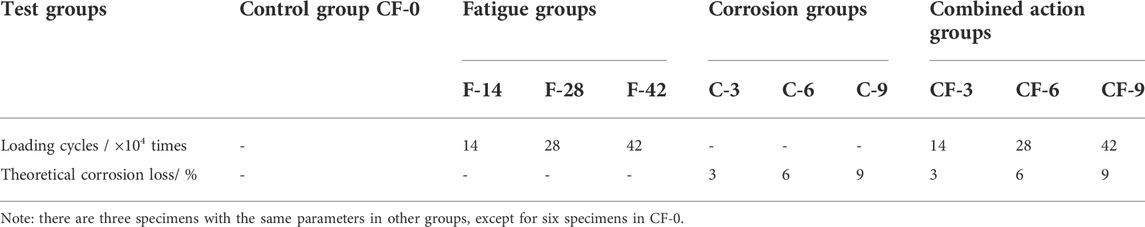
TABLE 1. Preset damage of specimens.
An MTS fatigue testing machine was conducted for the fatigue loading. Based on the ultimate load average value obtained from the pull-out test of the three CF-0 specimens is 51.4 kN. The loading range of the fatigue load is 10–30 kN, and the frequency of the fatigue load is selected as 1 Hz. According to the fatigue test result of the three CF-0 specimens in Table 2, the mean of ultimate fatigue life Nf was measured to be 936,413. This test study selected 0.15 Nf, 0.3 Nf, and 0.45 Nf as the preset fatigue times.
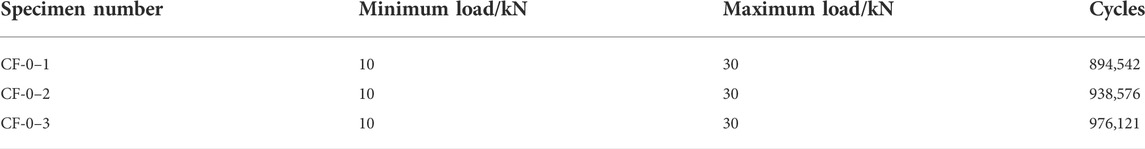
TABLE 2. Fatigue test results.
The reinforced bar in the specimens of the corrosion group was corroded by energizing to accelerate corrosion, as shown in Figure 3. The specimens were immersed in a 5% sodium chloride solution for a week before test. The research (Ma et al., 2017) shows that, according to Faraday’s law, the loss of mass of reinforced bars can be well estimated to reach the design corrosion amount, which is expressed as
where
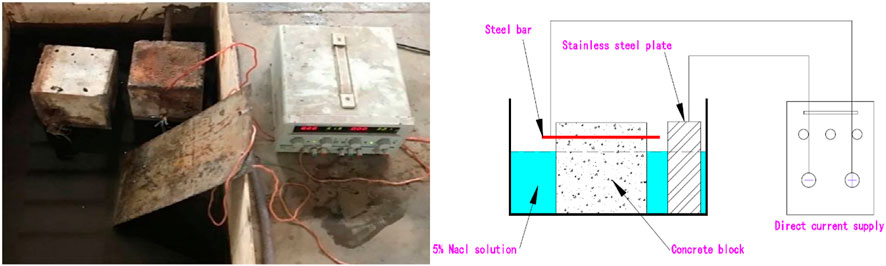
FIGURE 3. Accelerated corrosion test.
As shown in Figure 4, corrosion grooves are added around the specimen to achieve the combined action of corrosion and fatigue. By adjusting the current size, the corrosion loss and fatigue effects can reach the preset value almost simultaneously. A self-made anchorage was designed at the reinforced bar loading end for fatigue and pull-out tests. A displacement meter was placed on the loading end of the reinforced bar. When the preset conditions of the test group were reached, the method of single-end pulling and loading was used to measure the relative slip and bond stress between the steel bar and the concrete. When the specimen is loaded, the load of each stage is 5kN, and when obvious cracks appear, the load of each stage is changed to 1 kN. After maintaining the load for 3–5 min, the readings of the displacement sensor, and strain gauge, are collected. The bond stress can be calculated according to the literature (Ma et al., 2017) and the test results. Table 3 records the specimens’ failure mode, bond stress, and corrosion rate measurements.
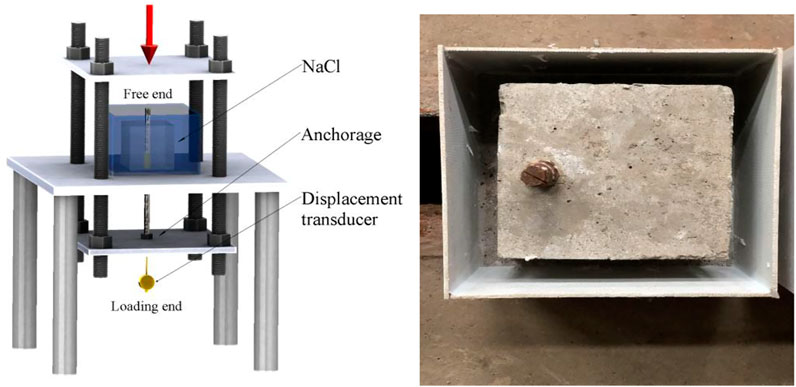
FIGURE 4. Combined action loading device.
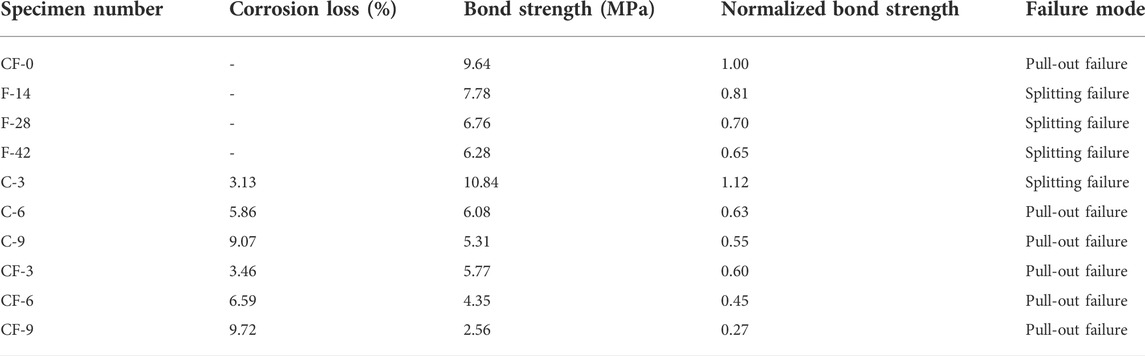
TABLE 3. Pull-out test for different types of steel bar specimens.
3 Results and discussion
3.1 Failure modes
3.1.1 Action of fatigue
During the test, it was found that the failure modes of the reference specimen and the specimen after fatigue load were mostly splitting failure, and the bonding force gradually increased with the load. Cracks first appeared in the concrete protective layer at the loading end, as shown in Figure 5A. Then, with the gradual load increase, the cracks expanded steadily. Eventually, a bottom-up through the crack is formed on the concrete surface. Since there is no lateral restraint, the failure crack radiates from the steel bar to the surrounding, and the specimen is divided into 2–3 pieces after failure, which belongs to brittle failure, as shown in Figure 5B and Figure 5C. The splitting failure of the specimen is relatively sudden, and the failure is accompanied by a loud sound, which is a brittle failure.
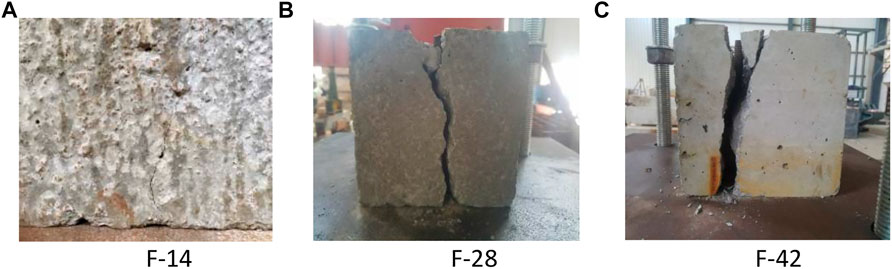
FIGURE 5. Failure mode of fatigue specimens.
3.1.2 Action of corrosion
In the accelerated corrosion test, corrosion-induced microcracks can be observed. Next, the longitudinal cracks of the corroded specimens start at the loading end. As the loading level increases, the longitudinal cracks extend along the corrosion-induced microcracks to the free end. This phenomenon is particularly evident in C-9, which has the highest corrosion, as shown in Figure 6C. The main reason for the difference in failure modes between the corrosion and fatigue specimens is that the cyclic loading causes the concrete before the cross ribs of the reinforced bar to be crushed (Shen et al., 2020). However, the expansion effect of corrosion products in the corrosion specimens makes the concrete produce micro-cracks on the interface of the reinforced bar and the concrete. Moreover, the cross ribs of the reinforced bar were corroded and peeled, resulting in a decrease in the mechanical bite force (Choi et al., 2014). When the mechanical bite force of the bond interface was insufficient to resist the shear force transmitted from the loading end, the reinforced bar was pulled out with the maximum cracking width of about 1 mm.
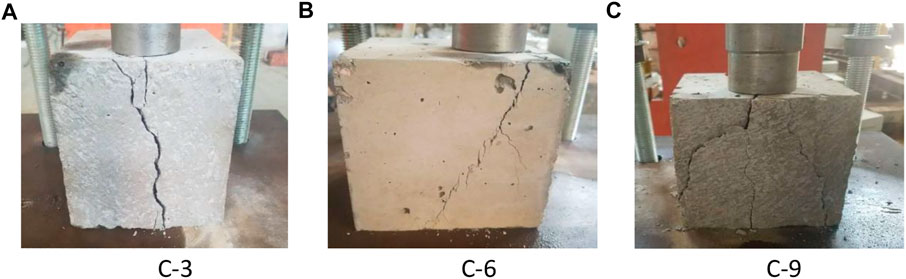
FIGURE 6. Failure mode of corroded specimen.
3.1.3 Combined action of corrosion and fatigue
The failure cracks of the composite action specimens mostly develop along the oblique or longitudinal direction. After the failure of the specimen, it can be seen that there is broken concrete between the transverse ribs of the steel bar. Fatigue load and chloride ion corrosion cause the transverse ribs of the steel bar to gradually wear away, resulting in a decrease in the mechanical bite force. The steel bars were pulled off during the pull-out test for some specimens. At the beginning of the test, these specimens behaved the same as those in other failure modes mentioned above, but when the load reached a certain value, the steel bar fractured near the concrete surface. The reason was that the corrosion situation at the junction is more serious in the corrosion test, the steel bar and the concrete, as shown in Figure 7C. The cross-sectional area of the steel bar there is sharply reduced, and the stress distribution of the cross-section is uneven. This may be due to the joint action of fatigue and corrosion and more cracks near the loading end, resulting in serious chloride ion erosion.
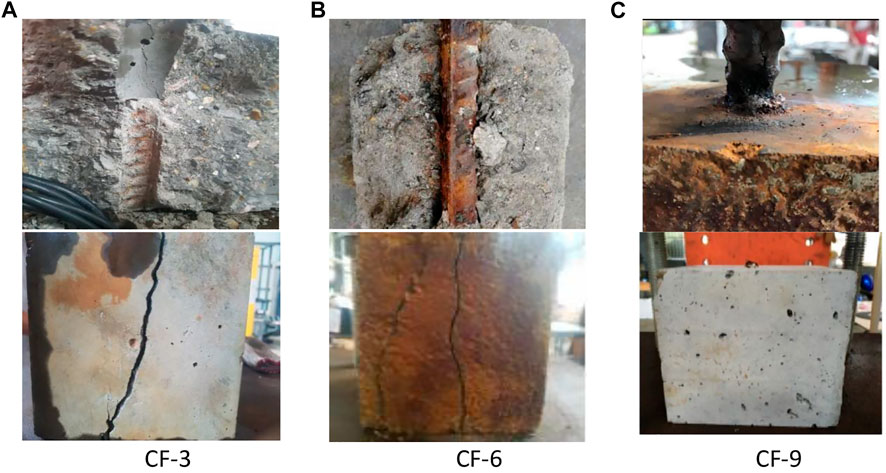
FIGURE 7. Failure mode of the combined action specimens.
3.2 Bond stress-slip between the reinforced bar and concrete
Based on the assumption that the bond stress along the anchorage length is uniformly distributed in short anchorage, the bond stress can be calculated as follows:
Where
The displacement value at the free end was selected as the slip value. The mean of the slip and bond stress of three specimens in each group was used to plot the bond stress-slip curve of specimens, as shown in Figure 8.
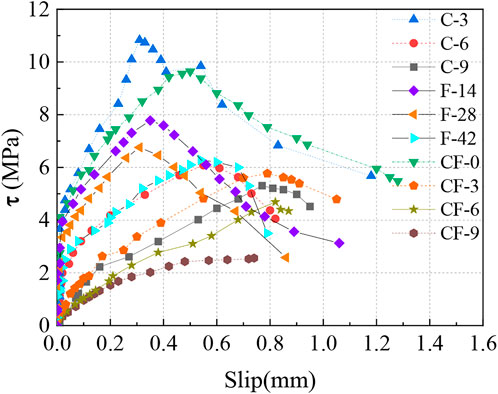
FIGURE 8. Bond stress-slip curve.
It can be seen from Figure 8 that the bond stress of the F-14 specimens with smaller preset loading cycles is significantly greater than that of the F-28 and F-42 specimens when the initial slip occurs. The smaller the preset fatigue loading times, the greater the ultimate bond strength of the specimens, consistent with most scholars’ research (Al-Hammoud et al., 2010; Zhang et al., 2020). Compared with those of the CF-0 specimens, the ultimate bond stress and slip value of the F-14 specimens is not obvious. However, the ultimate bond stress of the F-42 specimens is only 65.6% of the CF-0 specimens, and the reinforced bar is pulled out when its slip value is 0.79 mm. The bond stress-slip curve of the F-42 specimens changes more significantly than that of the F-14 and F-28 specimens.
Moreover, the ultimate bond stress of the C-3 specimens is slightly higher than that of the CF-0 specimens. It is because the corrosion products of the reinforced bar will cause its volume expansion in concrete. Hence, the friction and radial force of the interface between concrete and reinforced bar are increased (Fang et al., 2004). However, the further volume expansion of reinforced bars will cause the rust-expansion cracks of concrete with corrosion loss, which significantly reduces the bond force between the reinforced bar and concrete. When the corrosion loss of the C-9 specimens reaches 9%, its bond strength is only 55.8% of the CF-0 specimens. By comparing the results of ultimate bond stress, it can be found that the effect of corrosion on the bond performance of the specimens is far more significant than that of fatigue.
In addition, it is found that the bond stress curve of the specimens under the combined action is different from that under a single factor. Compared with the CF-0 specimens, the ultimate bond stress of the CF-3, CF-6, and CF-9 specimens decreased by 33.8%, 53.5%, and 73.8%, respectively. The decrease in the bond strength of the CF-9 group is the largest. The reinforced bar of certain specimens in the CF-9 group is broken due to uneven corrosion. Compared to the reduction amplitudes of bond stress in the three groups, it can be seen that the effect of corrosion and fatigue are not simply superimposed. Compared with cf-0 specimens, the free end slip values of CF-3, CF-6, and CF-9 specimens decreased by 22.3%, 35.6%, and 46.8%, respectively. Compared with cf-0, the maximum decrease in the other two groups was only 28.6%. The decrease of the free end slip values of CF-3, CF-6, and CF-9 is more intuitively reflected in the fact that the reinforcement is pulled out quickly when the specimen reaches the bond strength only. Under the simultaneous action of fatigue and corrosion, the bond-slip constitutive relationship of specimens is gradually shortened from the elastic stage, strengthening stage, and falling stage to two stages. The descending stage of the CF-9 test group almost completely disappeared. However, this phenomenon has not been found in previous corrosion (Lee et al., 2002; Fang et al., 2004; Tondolo, 2015; Ma et al., 2017) or fatigue (Rehm and Eligehausen, 1979; Koch and Balazs, 1993; Rteil et al., 2011) test research and corrosion fatigue asynchronous test (Fang et al., 2006; Lin et al., 2017), even if the corrosion degree exceeds 9%. The corrosion and fatigue can mutually promote bond failure and accelerate bond strength degradation. Fatigue load causes crack development and shorten the time for chloride ions to reach the reinforcement surface. The corrosion products make the concrete expand, and the concrete cracks are further expanded. This interaction decreases gradually with the increase of damage. Because the chloride ion concentration on the reinforcement surface gradually reaches the critical chloride ion concentration required for reinforcement corrosion. The combined action mechanism of corrosion and fatigue is shown in Figure 9.
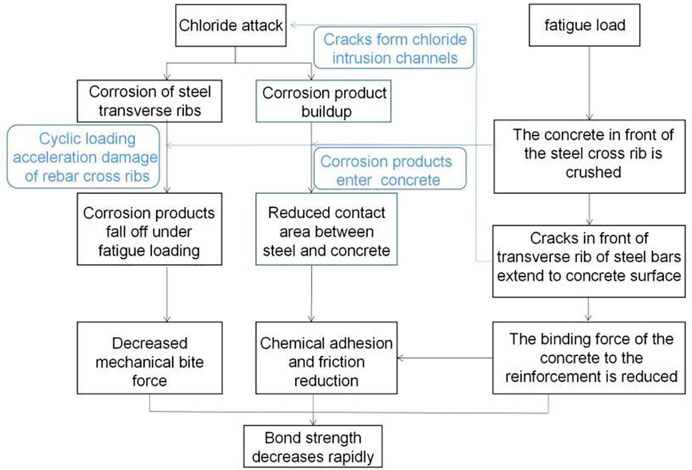
FIGURE 9. Mechanism of combined action
In the existing research, due to different test parameters and different test environments, the applicability of the results is limited (Yalciner et al., 2012; Feng et al., 2016). The empirical formula proposed by Cabrera (Cabrera, 1996) shows that the bond strength decreases linearly with the increase of corrosion degree. Subsequently, Lee et al. (Lee et al., 2002) and Chung et al. (Chung et al., 2008) proposed that the prediction of bond strength by an exponential function and power function is relatively more accurate. Ma et al. (Ma et al., 2017) believe that the power function can better describe the correlation between corrosion degree and bond strength. A large number of test results are collected to fit the empirical formula of the relationship between bond strength and corrosion degree (Almusallam et al., 1996; Cabrera, 1996; Amleh and Mirza, 1999; Auyeung et al., 2000; Chung et al., 2004; Fang et al., 2006; Yalciner et al., 2012; Zhao et al., 2013; Tondolo, 2015; Feng et al., 2016; Ma et al., 2017). Test results and fitted curves are shown in Figure 10. The standard bond strength (the ratio of the maximum bond strength of the preset damage sample to the maximum bond strength of the original sample) is used to eliminate the influence of test parameters such as concrete strength or reinforcement type. This can eliminate the one-sidedness of the test results and enhance the application scope of the empirical formula, as shown in :
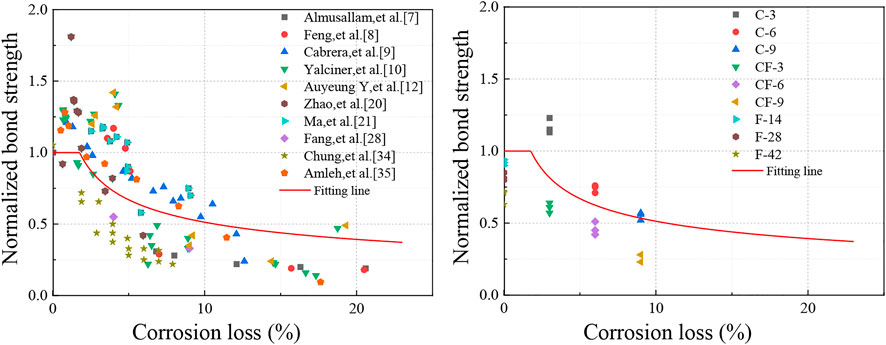
FIGURE 10. Normalized bond strength versus corrosion loss.
The predicted results of are compared with the test results in this paper, as shown in Table 4.
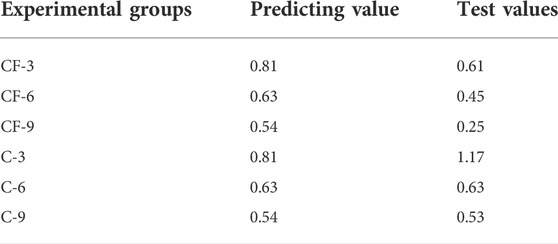
TABLE 4. Comparison of nominal bond stress.
3.3 Effect of the combined action on the bond stress distribution
The bond stress distribution under the action of corrosion or fatigue in the existing studies shows a single-peak distribution (Perry and Jundi, 1969; Zhao and Jin, 2002). This research studies the effect of the fatigue-corrosion combined action on bond stress distribution along the anchorage length. According to the finite difference method, the bond stress with different positions in the pull-out test can be calculated:
Where
The distribution curve of bond stress is drawn in Figure 11. It is worth noting that point A is the first peak point of the stress curve from the free end, point B is the second peak point, and point C is the minimum value between the two peaks.
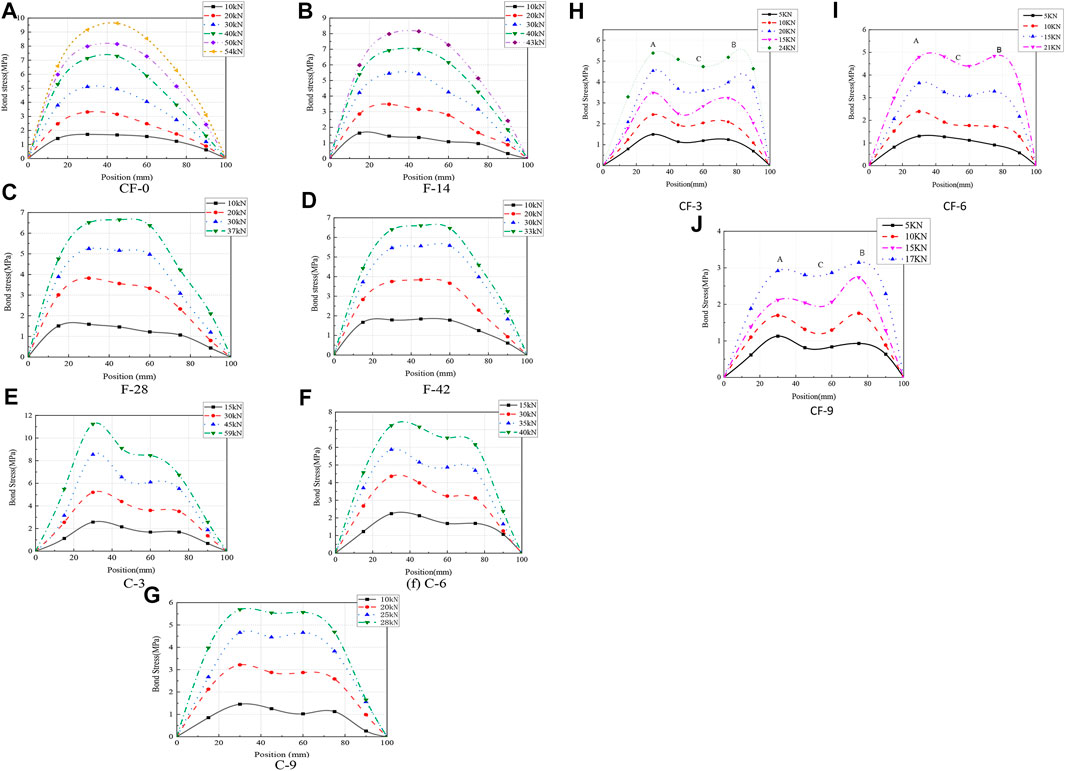
FIGURE 11. Bond stress distribution.
It can be seen from Figure 11 that the distribution curve of the bonding stress under the action of a single factor is almost a single peak. But the bond stress distribution curve of the specimen after the combined action of corrosion and fatigue has a double peak. The bond stress curve of the specimens has a peak at the place 20–30 mm away from the two ends, especially the CF-3 specimens with a lower degree of corrosion. The reason is that the corrosion products between the reinforced bar and concrete are gathered to form a rust layer composed of loose flakes or powders. This rust layer has damaged the chemical adhesion and mechanical bite force between the reinforced bar and concrete, resulting in a decrease in the bond stiffness of the specimens. However, the concrete around the reinforced bars cracks along the reinforced bars under cyclic loading. The corrosion products enter these cracks and mix with the crushed concrete, increasing the chemical adhesion and radial force and decreasing the loss of bond stiffness to a certain extent. The uneven distribution of bond stiffness along the anchorage direction makes the two peaks in the bond stress curve. As the loading grade increases, the enhancement part of bond stiffness caused by the accumulation of corrosion products is further damaged. The bond stress distribution gradually flatten. Namely, the bond stress in point C of the curve was approximately close to the peak value of the curve with the damage level.
As the level of corrosion and fatigue increases, the peak of the bond stress curve tends to move to the free end. When the loss of bond stiffness between the reinforced bar and concrete becomes more significant, the bond stress in the anchorage zone is relatively more minor. The first peak of bond stress in the CF-9 group is only 45% of that in the CF-3 group.
4 Conclusion
In this study, the effect of corrosion and fatigue on the bond performance of RC specimens was explored. The degradation of bond strength, bond stress distribution, and failure modes were analyzed. Some conclusions were drawn as follows.
1) The corrosion effect is dominant in the degradation of the bond performance. The fatigue effect will accelerate the corrosion loss, resulting in the degradation of the bond performance. When the level of corrosion of reinforced bars in the RC specimens is low, the failure mode of the specimens under the combined action of corrosion and fatigue is mainly a pull-out failure. When the level of corrosion loss is high, the reinforced bars maybe break.
2) An empirical bond strength prediction model between steel bars and concrete is proposed. When the corrosion loss is less than 1.77, the corrosion has little effect on the bond strength. The bond strength of the CF-9 specimen is close to that of specimens with a corrosion degree of about 15%.
3) Under the combined action of corrosion and fatigue, the distribution curve of bond stress along the anchorage length is a double-peak curve. The peak position of the bond stress curve gradually moves to the free end with the increase of the fatigue corrosion degree.
Data availability statement
The datasets presented in this article are not readily available because Data Availability Only part of the raw/processed data can be shared at this time as the other data also forms part of an ongoing. Requests to access the datasets should be directed to wangbowenbridge@163.com.
Author contributions
WB, Conceptualization; Methodology; Formal analysis; Writing - Original Draft LY, Funding acquisition; Supervision LD, Data Curation Yuan Heping, Resources.
Funding
This work was supported by the National Natural Science Foundation of China (grant numbers 52178207 and 52008036), the China Postdoctoral Science Foundation (grant number 2020M672462), the Hunan Provincial Natural Science Foundation of China (grant number 2021JJ40581), Hunan graduate science and technology innovation project (CX20210766), and the Science and Technology Innovation Program of Hunan Province (grant number 2020RC 2052). All these financial supports are greatly appreciated.
Conflict of interest
The authors declare that the research was conducted in the absence of any commercial or financial relationships that could be construed as a potential conflict of interest.
Publisher’s note
All claims expressed in this article are solely those of the authors and do not necessarily represent those of their affiliated organizations, or those of the publisher, the editors and the reviewers. Any product that may be evaluated in this article, or claim that may be made by its manufacturer, is not guaranteed or endorsed by the publisher.
References
Al-Hammoud, R., Soudki, K., and Topper, T. H. (2010). Bond analysis of corroded reinforced concrete beams under monotonic and fatigue loads. Cem. Concr. Compos. 32 (3), 194–203. doi:10.1016/j.cemconcomp.2009.12.001
Almusallam, A. A., Al-Gahtani, A. S., Aziz, A. R., and Rasheeduzzafar, (1996). Effect of reinforcement corrosion on bond strength. Constr. Build. Mater. 10 (2), 123–129. doi:10.1016/0950-0618(95)00077-1
Amleh, L., and Mirza, S. (1999). Corrosion influence on bond between steel and concrete. Struct. J. 96 (3), 415–423.
Auyeung, Y., Balaguru, P., and Chung, L. (2000). Bond behavior of corroded reinforcement bars. Mater. J. 97 (2), 214–220.
Bhargava, K., Ghosh, A. K., Mori, Y., and Ramanujam, S. (2007). Corrosion-induced bond strength degradation in reinforced concrete—analytical and empirical models. Nucl. Eng. Des. 237 (11), 1140–1157. doi:10.1016/j.nucengdes.2007.01.010
Blomfors, M., Zandi, K., Lundgren, K., and Coronelli, D. (2018). Engineering bond model for corroded reinforcement. Eng. Struct. 156, 394–410. doi:10.1016/j.engstruct.2017.11.030
Cabrera, J. G. (1996). Deterioration of concrete due to reinforcement steel corrosion. Cem. Concr. Compos. 18 (1), 47–59. doi:10.1016/0958-9465(95)00043-7
Choi, Y. S., Yi, S. T., Kim, M. Y., Jung, W. Y., and Yang, E. I. (2014). Effect of corrosion method of the reinforcing bar on bond characteristics in reinforced concrete specimens. Constr. Build. Mater. 54, 180–189. doi:10.1016/j.conbuildmat.2013.12.065
Chung, L., Cho, S. H., Kim, J. H. J., and Yi, S. T. (2004). Correction factor suggestion for ACI development length provisions based on flexural testing of RC slabs with various levels of corroded reinforcing bars. Eng. Struct. 26 (8), 1013–1026. doi:10.1016/s0141-0296(04)00012-4
Chung, L., Kim, J. H. J., and Yi, S. T. (2008). Bond strength prediction for reinforced concrete members with highly corroded reinforcing bars. Cem. Concr. Compos. 30 (7), 603–611. doi:10.1016/j.cemconcomp.2008.03.006
Fang, C., Gylltoft, K., Lundgren, K., and Plos, M. (2006). Effect of corrosion on bond in reinforced concrete under cyclic loading. Cem. Concr. Res. 36 (3), 548–555. doi:10.1016/j.cemconres.2005.11.019
Fang, C., Lundgren, K., Chen, L., and Zhu, C. (2004). Corrosion influence on bond in reinforced concrete. Cem. Concr. Res. 34 (11), 2159–2167. doi:10.1016/j.cemconres.2004.04.006
Feng, Q., Visintin, P., and Oehlers, D. J. (2016). Deterioration of bond–slip due to corrosion of steel reinforcement in reinforced concrete. Mag. Concr. Res. 68 (15), 768–781. doi:10.1680/jmacr.15.00217
Guo, Z., Ma, Y., Wang, L., Zhang, X., Zhang, J., Hutchinson, C., et al. (2020). Crack propagation-based fatigue life prediction of corroded RC beams considering bond degradation. J. Bridge Eng. 25 (8), 04020048. doi:10.1061/(asce)be.1943-5592.0001592
Huang, D., Chen, P., Peng, H., Yang, Y., Yuan, Q., and Su, M. (2021). A review and comparison study on drying shrinkage prediction between alkali-activated fly ash/slag and ordinary Portland cement. Constr. Build. Mater. 305, 124760.
Jokūbaitis, A., Marčiukaitis, G., and Valivonis, J. (2017). Analysis of reinforcement anchorage zone behavior of prestressed concrete elements under static and cyclic loads. Procedia Eng. 172, 457–464. doi:10.1016/j.proeng.2017.02.028
Jokūbaitis, A., Valivonis, J., and Zubrus, A. (2014). The influence of prestress losses on the anchorage zone of prestressed concrete member/ itemptųjų gelžbetoninių elementų itempių nuostolių itaka inkaravimo zonai. Eng. Struct. Technol. 6 (1), 25–32. doi:10.3846/2029882x.2014.957902
Kivell, A. R. L. (2012). Effects of bond deterioration due to corrosion on seismic performance of reinforced concrete structures. Canterbury: University of Canterbury. Thesis (PhD).
Koch, R., and Balazs, G. L. (1993). Slip increase under cyclic and long term loads. Otto Graf J. 4 (1), 160–191.
Lee, H. S., Noguchi, T., and Tomosawa, F. (2002). Evaluation of the bond properties between concrete and reinforcement as a function of the degree of reinforcement corrosion. Cem. Concr. Res. 32 (8), 1313–1318. doi:10.1016/s0008-8846(02)00783-4
Lin, H., Zhao, Y., Ožbolt, J., and Hans-Wolf, R. (2017). The bond behavior between concrete and corroded steel bar under repeated loading. Eng. Struct. 140, 390–405. doi:10.1016/j.engstruct.2017.02.067
Luo, Y., Zheng, H., Zhang, H., and Liu, Y. (2021). Fatigue reliability evaluation of aging prestressed concrete bridge accounting for stochastic traffic loading and resistance degradation. Adv. Struct. Eng. 24 (13), 3021–3029.
Ma, Y., Guo, Z., Wang, L., and Zhang, J. (2017). Experimental investigation of corrosion effect on bond behavior between reinforcing bar and concrete. Constr. Build. Mater. 152, 240–249. doi:10.1016/j.conbuildmat.2017.06.169
Morris, G., Bull, D. K., and Bradley, B. (2015). “Monotonic and cyclic bond behaviour of deformed bars in reinforced concrete structures,” in Conference proceedings of the New Zealand society of earthquake engineering (New Zealand: Rotorua), 761–770.
Murcia-Delso, J., Stavridis, A., and Shing, P. B. (2013). Bond strength and cyclic bond deterioration of large-diameter bars. ACI Struct. J. 110 (4), 1.
Perry, E. S., and Jundi, N. (1969). Pullout bond stress distribution under static and dynamic repeated loadings. J. Proc. 66 (5), 377–380.
Rehm, G., and Eligehausen, R. (1979). Bond of ribbed bars under high cycle repeated loads. ACI 76 (2), 297–309.
Rteil, A., Soudki, K., and Topper, T. (2011). Mechanics of bond under repeated loading. Constr. Build. Mater. 25 (6), 2822–2827. doi:10.1016/j.conbuildmat.2010.12.053
Shang, H., Yang, J., Huang, Y., Fan, L., and Wang, R. (2022). Study on the bond behavior of steel bars embedded in concrete under the long-term coupling of repeated loads and chloride ion erosion. Constr. Build. Mater. 323, 126498. doi:10.1016/j.conbuildmat.2022.126498
Shen, D., Wen, C., Zhu, P., Li, M., Ojha, B., and Li, C. (2020). Bond behavior between basalt fiber-reinforced polymer bars and concrete under cyclic loading. Constr. Build. Mater. 258, 119518. doi:10.1016/j.conbuildmat.2020.119518
Stanish, K. D. (1999). Corrosion effects on bond strength in reinforced concrete. Toronto: University of Toronto. Thesis (PhD).
Tondolo, F. (2015). Bond behaviour with reinforcement corrosion. Constr. Build. Mater. 93, 926–932. doi:10.1016/j.conbuildmat.2015.05.067
Yalciner, H., Eren, O., and Sensoy, S. (2012). An experimental study on the bond strength between reinforcement bars and concrete as a function of concrete cover, strength and corrosion level. Cem. Concr. Res. 42 (5), 643–655. doi:10.1016/j.cemconres.2012.01.003
Ye, Z., Zhang, W. P., Hu, Y., and Gu, X. L. (2016). “Experimental study on effects of fatigue loading history on bond behavior between steel bars and concrete,” in Key engineering materials (Switzerland: Trans Tech Publications Ltd), 673–680.
Zhang, W., Zhang, Y., Li, H., and Gu, X. (2020). Experimental investigation of fatigue bond behavior between deformed steel bar and concrete. Cem. Concr. Compos. 108, 103515. doi:10.1016/j.cemconcomp.2020.103515
Zhao, Y., and Jin, W. (2002). Test study on bond stress-slip relationship of concrete and steel bar. J. Build. Struct. 23 (1), 32–37.
Keywords: fatigue, corrosion, combined action, reinforced concrete, bond performance
Citation: Wang B, Liu Y, Luo D and Yuan H (2022) Experimental research on statics bond performance of reinforcement-concrete interface after the combined action of corrosion and fatigue. Front. Mater. 9:1012489. doi: 10.3389/fmats.2022.1012489
Received: 05 August 2022; Accepted: 09 September 2022;
Published: 29 September 2022.
Edited by:
Qing-feng LIU, Shanghai Jiao Tong University, ChinaReviewed by:
Li Song, Central South University, ChinaJin Zu Quan, Qingdao Technological University, China
Copyright © 2022 Wang, Liu, Luo and Yuan. This is an open-access article distributed under the terms of the Creative Commons Attribution License (CC BY). The use, distribution or reproduction in other forums is permitted, provided the original author(s) and the copyright owner(s) are credited and that the original publication in this journal is cited, in accordance with accepted academic practice. No use, distribution or reproduction is permitted which does not comply with these terms.
*Correspondence: Bowen Wang, wangbowenbridge@163.com