 Haytham F. Isleem1*
 Jagadesh P2
 Jawad Ahmad3
 Shaker Qaidi4,5
 Fadi Althoey5
 Hadee Mohammed Najm6Mohanad Muayad Sabri Sabri7
- 1Department of Construction Management, Qujing Normal University, Qujing, Yuannan, China
- 2Department of Civil Engineering, Coimbatore Institute of Technology, Coimbatore, India
- 3Department of Civil Engineering, Military College of Engineering, Sub Campus of National University of Sciences and Technology, Islamabad, Pakistan
- 4Department of Civil Engineering, College of Engineering, University of Duhok, Duhok, Iraq
- 5Department of Civil Engineering, College of Engineering, Nawroz University, Duhok, Iraq
- 6Department of Civil Engineering, Zakir Husain Engineering College, Aligarh Muslim University, Aligarh, India
- 7Peter the Great St. Petersburg Polytechnic University, St.Petersburg, Russia
Confined concrete in pipes provides a solution for the structures to resist lateral forces and avoids the problems associated with production of confined concrete and lateral reinforcement. To evaluate the influence of PVC pipe on the compressive behavior of concrete filled composite tubes, ABAQUS software was used to simulate 44 concrete filled PVC pipes (CFPT). The influence of internal steel reinforcement, unconfined concrete strength, slenderness ratio, specimen’s size and thickness of PVC tube on failure mode load carrying capacity, and strain of PVC confined reinforced concrete column was studied. The present discussion show that the existing analytical models failed to capture the effect of these parameters. On the other hand, the proposed finite element (FE) models achieve a very good agreement between the experimental and analytical values. The proposed FE model can provide an acceptable portrayal of the CFPT’s response. The response of confined concrete was estimated using trial and error approach and as a result a model for the strain of confined concrete was proposed. The effect of these parameters on the CFPT leads to development of analytical models.
1 Introduction
Most common material used for construction is Reinforced Concrete (RC), plays significant role in construction sector in recent decades. Such significant material in present scenario, faces several problems, when it is used for specific purposes. Some of the problems are listed below.
• Development of engineering structures in recent decades, pushes the engineers with high rise, large-span, complex and heavy load, the ordinary RC structures, which cannot fully meet the necessity of load carrying capacity and functional purpose of engineering structures (Feng et al., 2021).
• The worsening of the RC structure triggered by aging of materials, exposing to severe environmental conditions leads to gradually emerging of structural damage during long time service period of structures (Feng et al., 2021).
• Now-a-days, occurrence of wind force and earthquake on concrete structures is unpredictable results in failure of structure itself. Hence, such structures need high strength concrete and more lateral reinforcement to resist such lateral force. Construction of such structures, requires compaction and vibration of concrete in mold (Morino et al., 2001).
In order to overcome above problems, composite materials like confined concrete in tubes is recommended by researchers and engineers. Composite tubes display a compatible behavior, as the composite tube affords confinement for concrete and the concrete avoids internal and local buckling of the composite tube in the exchange (Morino et al., 2001). Introduction of composite materials as confined materials in concrete column, results can increase the ultimate strength and strain of concrete by 3 and 15 times, respectively and it is confirmed by Jiang et al. (2014).
In order to improve the brittleness and the ductility of concrete, concrete confined by steel tube is recommended by so many researchers (Guo et al., 2009; Uy et al., 2011; Abed et al., 2013; Han et al., 2014; Lai et al., 2019) but it has so many disadvantages (Han et al., 2014; Fakharifar and Chen, 2016). Another notable disadvantage is corrosion of steel tubes (Hou et al., 2016; Gao et al., 2020), when exposed to severe environment. Reduction in axial compressive strength with localized penetrating corrosion for concrete filled steel tubes are also reported (Gao et al., 2022). Concrete filled steel tubes have problem of reduced confinement effectiveness at low level of loadings if the tube is also loaded in the axial direction. This is due to the fact that the Poisson’s ratio of concrete at low levels of loading is smaller than the value of steel (Wei et al., 1995). Apart from this, confining materials improve the structure absorption to shock energy (Guo et al., 2009). Partial separation of steel tubes and concrete is also noted at low level of loading due to differential radial expansion of steel and concrete (Mirmiran, et al., 1999). Ductility of the CFST specimens is high when compared with hollow specimens is reported by (Hou et al., 2016). Premature buckling of the composite material occurs due to this separation of materials. Effective confinement will only be achieved at higher loading and Poisson’s ratio of composite material should be nearer. This is achieved by concrete filled Poly Vinyl Chloride (PVC) tubes, at higher loading concrete begins to crack, as it expands first than PVC tubes and becomes well confined.
Kurt (1978), first proposed usage of PVC tube as confining material and experimentally confirmed that the axial compressive strength of concrete increased by 3.2 times because of lateral confinement effect of the PVC tube. In present scenario, even larger PVC pipes are manufactured, which can be used for production of confined concrete columns. Apart from reduction in cost, PVC also shows better mechanical properties in tests. PVC pipes not only reduces the weight of the structure but also improves its earthquake performance (Wang and Yang 2012). PVC provides better corrosion resistance, which also offers a possible suggestion for the application of this kind of new composite materials in special environment (Saafi et al., 1999). PVC tubes being used for confinement, there is no need to mold when using PVC tube, which accelerate the construction progression and reduces the cost of molding (Robinson and Melby, 2015). Wang and Yang (2010) studied the effect of high-density polyethylene pipe thickness and compressive strength of core concrete on their ultimate strength, stress-strain curve and ductility of concrete. Previous researchers have shown the enhanced strength and ductility of concrete when column is laterally confined by PVC pipes (Wang and Yang 2010; Fakharifar and Chen 2016).
Woldemariam, et al. (2019) tested four different types of PVC diameter and observed the effect on compressive strength of concrete on strength enhancement ratio (fcc/fco). In his experimental work, 63mm, 90mm, 110mm, 140 mm PVC diameter are used, and increase in concrete strength from 15 MPa to 35 MPa results in decrease in strength confinement effectiveness (fcc/fco) ratios are noted in the order of 2.35 to 1.44, 2.23 to 1.42, 2.12 to 1.36 and 2.03 to 1.28 respectively. And also, with increase in PVC diameter decrease in fcc/fco ratio is noted (Woldermariam et al., 2019). also reported that the increase in compressive strength, the ratio of thickness to diameter (2t/D) value is decreased. And also, with increase in 2t/D ratio, the value of fcc/fco ratio is increased.
Increase in ultimate compressive strength of PVC confined short columns shows an increase about 11–17% then the unconfined compressive strength is reported by (Marzoucka and Sennah 2002). Whereas increase in the concrete compressive strength, there is an increase in strength and strain about 1.324–2.345 and 2.094 to 5.540 times when compared to unconfined concrete strength is found by (Wang and Yang 2012). Height to diameter of column is kept as two and the diameter of core concrete is taken as 100 mm. PVC tube serve as outer hoop material for concrete column and improves its mechanical and durability properties. Strength of plain specimen i.e., without PVC tube was 0.72–0.74 times that of the PVC confined specimen (Dong et al., 2011). Usage of PVC tubes, not only increases the confinement strength but also decreases the cost, when compared to concrete filled steel tubes and Fibre Reinforced Polymer (FRP) steel tubes.
PVC is a thermoplastics polymer with good strength, toughness, resistance to acid exposure conditions and good corrosion resistance (Neelam and Kalaga, 2002). PVC tube play the role of formwork and protective shell for inner core of concrete and also it increases the confinement strength for core concrete. Major characteristics of PVC tubes is that they are elastic and undergo larger deformation under loading. Experimental investigations like stress deterioration, damage initiation, crack initiation and growth, impact tests, bursts and the tensile and fatigue of PVC have unveiled extraordinary performance in that service life beyond 100 years (Woldemariam et al., 2019).
In literatures, it is reported that the use of PVC in CFPT column increases the structural performance of concrete; however, the effect of several parameters like concrete compressive strength, PVC tube thickness, column slenderness ratio and specimen size on the stress and strain of those columns are not exposed properly.
1.1 Research significance
For a concrete compressive strength of 30 MPa, the ratio of confined strength to unconfined concrete strength raged from 1.419 to 1.896 was reported by Saadoon, (2002). If the confined concrete compressive strength is increased to 50 MPa, the ratio was dropped in the range of 1.118–1.405. Effect of compressive strength and tube thickness on the ultimate strength of PVC confined concrete was experimentally proved by Wang and Yang (2012). Kurt (1978) reported that the increase in the length to diameter (H/D) ratio from 2.6 to 20, there is reduction in compressive strength about 40% is observed. Whereas, Sadoon (2002) reported that there is 14% drop in the ultimate strength about 14% when H/D ratio is increased from 2 to 10. H/D ratio from 10 to 17.5 on the axial load carrying capacity and failure mechanism is reported by Soliman (2011). Increase in specimen size, results in load carrying capacity of CFPT was reported by Raheemah and Resan (2020).
It is noted that in existing literatures, the parameters like concrete strength, PVC tube thickness, H/D ratio and size of specimen on the confined concrete compressive strength of CFPT columns. And also, there are several models available in literatures to estimate the peak strength of CFPT columns. These models are mostly used to estimate the peak strength from confined concrete strength and lateral confined pressure. Hence, it is necessary to develop model by considering all these parameters to estimate the peak strength of CFPT columns. For this purpose, FE simulations are required and the results obtained are compared with experimental results from literatures.
1.2 Research scope
The objective of this study is to numerically estimate the effect of the PVC tube on the behavior of concrete-filled composite tubes under concentric load, concrete filled PVC tubes were modelled by (ABAQUS, 2014) software and the stress strain curves and failure mode of the models associated to the experimental results from literatures. The influence of internal steel reinforcement, unconfined concrete strength, slenderness ratio, specimen’s size and thickness of PVC tube on failure mode load carrying capacity, and strain of PVC confined reinforced concrete column was investigated.
2 Experimental test database
A wide-ranging database with a test result of 90 CFPT concrete columns with different unconfined concrete strength, thickness of PVC tubes, slenderness ratios and specimen sizes were collected from eight different studies (Guo et al., 2009; Feng and Ditao, 2013; Gupta, 2013; Woldemariam et al., 2019; Fang et al., 2020; Bandyopadhyay et al., 2020; Chang et al., 2021; Alatshan et al., 2022]. The database includes 45 experiment results from literatures and 45 simulated results from (ABAQUS, 2014).
Feng and Ditao (2013) reported that the highest axial load with lower ultimate strain. Fang et al. (2020) which is noted from Figure 1. Feng and Ditao (2013) performed testing with diameter 200 mm and height 500 mm with diameter of longitudinal reinforcement as 10 mm with hoop reinforcement. Similar specimen as like (Feng and Ditao, 2013) without reinforcement is performed by Fang et al. (2020) but axial strain is increased but axial load is decreased. Linear deformation of strain is noted for (Feng and Ditao, 2013; Fang et al., 2020).
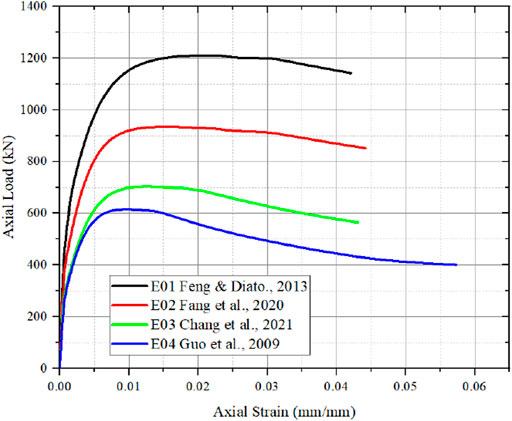
FIGURE 1. Axial stress and axial strain from (Feng and Ditao, 2013; Fang et al., 2020; Chang et al., 2021; Guo et al., 2009).
Chang et al. (2021) performed with specimen size as 168 mm as diameter and height of specimen as 588 mm but without longitudinal and hoop reinforcement. Since, increase in specimen size, results in decrease in ultimate strain when compared to Feng and Ditao (2013), Fang et al. (2020). Guo et al. (2009) performed specimen size with diameter as 495 mm and height as 165 mm with lower compressive strength is noted from Feng and Ditao (2013) , Fang et al. (20,200 and Chang et al. (2021) result in decrease in ultimate strain. Decrease in strain deformation is steeply noted by Chang et al. (2021), Guo et al. (2009), when axial load and axial strain are plotted. Bandyopadhyay et al. (2020) tested 12 specimens with same diameter as 160 mm and height with three different sizes as 500, 750 and 1,000 mm with same concrete strength and similar longitudinal and hoop reinforcement for all specimens. It is noted from Figure 2, that lower slenderness ratio has higher ultimate strain capacity and higher the slenderness ratio, the ultimate strain is decreased. Peak load is noted for the higher slenderness ratio is observed from Bandyopadyay et al. (2020). Summary of the data points are tabulated in Table 1.
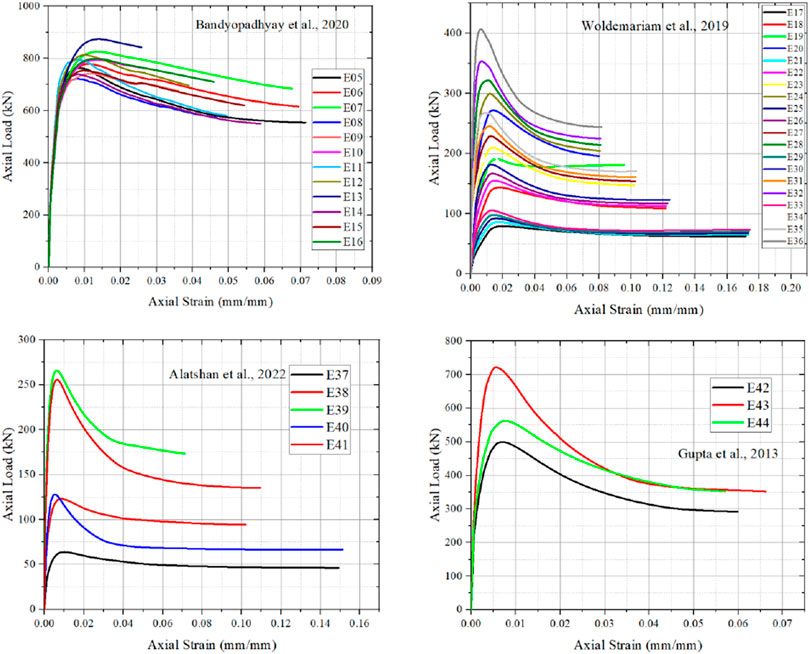
FIGURE 2. Axial stress and axial strain from (Bandyopadhyay et al., 2020; Woldemariam et al., 2019; Alatshan et al., 2022 and Gupta, 2013).

TABLE 1. Summary of Confined Concrete Filled PVC Tube used in this investigation.
Woldemariam et al. (2019) tested 20 specimens with constant slenderness ratio and concrete strength used and varying PVC thickness, PVC pipe diameter and height. Woldemariam et al. (2019) noted that increase in unconfined concrete strength results in increase in peak load carrying capacity of CFPT columns. Alatshan et al. (2022), tested five specimens with increasing height and diameter of the specimen with slenderness ratio as constant. With constant concrete strength and increase in PVC tube thickness, there is increase in peak load and lower in ultimate strain is noted. Whereas, decrease in PVC thickness and lower the specimen dimensions results in increase in ultimate strain and decrease in peak load is observed. Gupta (2013) tested three specimens with constant height as 500 mm, and change in diameter as 140 and 160 mm, with change in PVC tube thickness as 3.9 and 4.25 mm. For constant unconfined concrete strength, with increase in PVC tube thickness result in increase in peak load and ultimate load is observed. Decrease in peak load, ultimate load and ultimate strain is noted for specimen with small diameter and thickness is observed.
3 Finite element model
3.1 Concrete modeling
When a CFPT column is under axial compression load, the core concrete expands laterally and interacts with the PVC tube. It is thought that the confined concrete is under tri-axial stress state and the CFPT is under biaxial stress state next the interaction between the two different components. Elastic behavior of concrete was demarcated by the Poisson’s ratio and elastic modulus parameters. From Equation 1, the elastic modulus of concrete was determined (ACI 363, 1984) and Poisson’s ratio was taken from Hassan et al. (2019) as 0.20. In this research, the concrete damaged plasticity model available in (ABAQUS, 2014) was used, and the concrete parameters are shown in Table 2. Density of normal weight of concrete was taken as 2,400 kg/m3 (Isleem et al., 2022a). For the plastic condition of concrete, Concrete Damaged Plastic Model (CDPM) was used for modeling in (ABAQUS, 2014) and it was confirmed by several authors are reported in literatures (Youssf et al., 2014; Alfarah et al., 2017).

TABLE 2. Concrete damaged plasticity parameters.
CFPT columns, concrete infill has to be demonstrated as confined concrete, while mechanical properties testing on concrete is conducted on uniaxial unconfined concrete. Hence, a corresponding confined stress strain curves for confined and unconfined concrete are shown in Figure 3. In which, fc’, fcc, εc and εcc are unconfined concrete compressive strength, confined concrete compressive strength, unconfined compressive strain corresponding strength to fc’ and the confined compressive strain corresponding to fcc’. From Figure 3, there are three parts are noted, first is linear elastic part that extends to the elastic limit stress and it was calculated as 0.5 fcc as reported in (Hu et al., 2003). Second part of confined stress strain curve is non-linear part extending from the end of first part which continues on to the ultimate confined concrete compressive strength and it was estimated as proposed by Saenz (1964). The third part representing the strain softening is a linear part that extends to a value (rk3 fcc) which is lower than the ultimate confine strength Equation recommended by Jiang et al. (2014) is adopted to calculate young’s modulus of concrete (Ec) in MPa. Poisson’s ratio of concrete is used in this study is 0.2 as recommended by Jiang et al. (2014).
Where fc’ is 28th day compressive strength (MPa) of concrete in cylinder. In CDPM, the inelastic behavior and the damaging standards of concrete are measured. Inelastic response of concrete was reported in (ABAQUS, 2014), which considers five essential parameters as shown in Table 1. Five essential parameters are dilation angle (Ψ), Shape factor for the yielding surface (Kc), plastic flow potential eccentricity (e), Viscosity Parameter (µ) and ratio of biaxial stress to uniaxial stress (fbo/fc’). All these parameters with experimental data of the CFPT columns to obtain best results. Some of concrete damaged plasticity parameters are recommended by (ABAQUS, 2014) and the others from Alinejad et al. (2021).
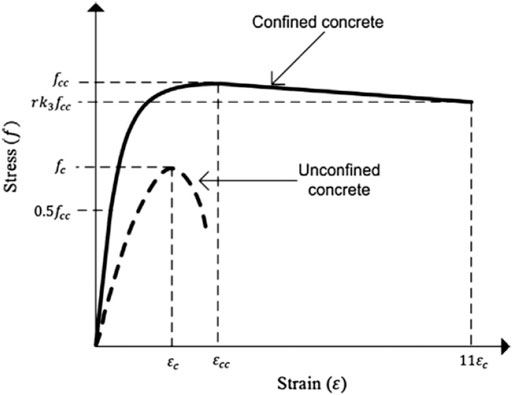
FIGURE 3. Stress strain for concrete used (Alam et al., 2015).
3.2 PVC material modeling
Modulus of elasticity and Poisson’s ratio of the PVC tube are introduced according to Table 3. Woldemariam et al. (2019) observed the tensile properties of PVC tubes for samples taken from two different tubes both perpendicular and parallel to the direction of extrusion, which shows both have similar behaviour. Due to the homogeneity of the PVC pipes, the stress–strain curve is introduced under the Mechanical > Plasticity > Plastic menu. Stress strain of PVC material used for this study is shown in Figure 4.

TABLE 3. Tensile properties of PVC.
FIGURE 4. Stress strain of PVC material used in this investigation.
3.3 Concrete and PVC tube interaction
Interaction between the concrete and PVC tube, the method is the ‘surface to surface’ contact method. Interaction between inner surface PVC tube and outer surface of concrete is surface to surface contact method. Interaction between PVC and concrete were identified as “Tie”. Previous studies on interaction between materials as ‘Tie’ were also reported in literatures (Tang et al., 2020). Surface to surface contact, applied displacement and element type used in this simulation is shown in Figure 5.
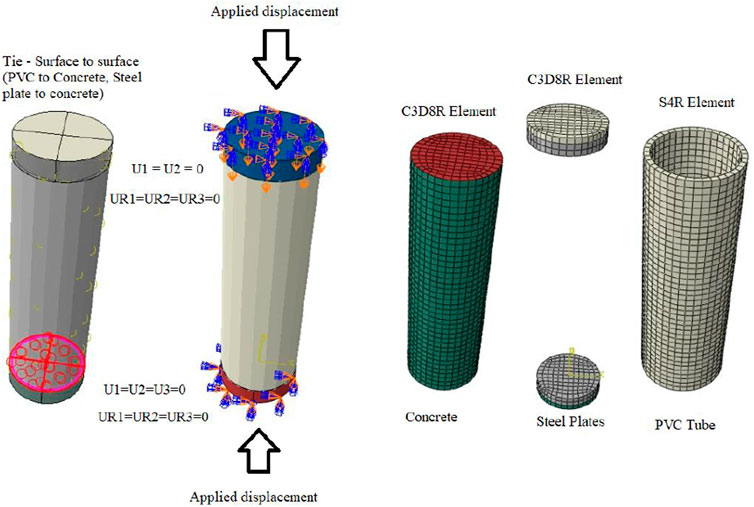
FIGURE 5. Finite element type, loading conditions, boundary conditions and contact surface for CFPT columns.
3.4 Boundary conditions and types of loadings
All degrees of freedom on the bottom of the columns in models are constrained. Concentric load is applied on the top of the columns along the main axis of the column under displacement mode. Boundary conditions on the top surfaces with displacement on X axis and Y axis are zero. On the top of the column specimen, the displacement along main axis is allowed only. Whereas rotation along all three axes is restricted. For the bottom surface, the displacement and rotation on all three axes are set to be zero.
3.5 Meshing
Homogenous 3-dimensional solid stress element (C3D8R) commonly used for the concrete column and the steel end plates was assigned in the present model to transfer the axial load identically (Raza et al., 2019). It should be noted that in solid three-dimensional elements, the degrees of freedom of the nodes are transitional, so there are only 3 degrees of freedom in each node. In this model, elements of 20 mm in size and Sweep technique have been used for concrete core. For the PVC pipe, S4R elements are used. In this element, each node has 6 degrees of freedom. In this model, elements of 15 mm and 20 mm in size and the Sweep Technique have been used for PVC pipe in columns with and without gaps at two ends, respectively. Figure 5 shows the finite element modelling for CFPT tubes.
3.6 Stress and strain estimation for FE simulations
Compression stress of concrete (σc) was determined by Equation 2 (Papanikolaou and Kappos, 2007). Only one alteration is incorporated in this expression to explanation for the result of confinement of the concrete strain measurements, which was measured using Eqss (3) and (4) as recommended by Zeng et al. Zeng (2016). In the present FE simulation, the elastic response of the unconfined or confined concrete starts from a stress value equals to 45% and ends at a stress value of 50% of the maximum compressive strength of the concrete cylinders.
Where,
Eq. 3 is applicable for CFPT confined concrete columns including the effect of slenderness ratio, stresses in steel and PVC pipes, as well as for unconfined CFPT columns. Whereas, εco is 0.002 for unconfined concrete strength at peak load, H is the height (mm) of column and D is diameter (mm) of the column. Lateral confinement pressure provided by the hoop steel reinforcement is determined by Equation 4
Where,
Where, s’ is the clear spacing between hoop reinforcement, dcor is the diameter of confined concrete core measured to the outside of hoop reinforcement and
Where, tpvc is the thickness of PVC tube, fy,pvc is the yield strength of PVC tube, Din is inside diameter of the PVC tube. Damage parameters of concrete under compression and tensile loads were determined using Eqs. 7, 8 respectively. Compression stress of concrete (σc) is calculated by load by concrete core area and tension stress of concrete (σt) is calculated by load by concrete core area.
Where ft is the maximum strength of concrete under tension and it is determined from Equation 9 which is already used by Isleem et al. (2022b) to determine the compressive stress of FRP-RC columns.
Strain of concrete in the plastic zone is determined using Equation 10 for the compression loading and Equation 11 for the case of tension loading.
Whereas,
To estimate the axial compression, conduct of CFPT columns, 44 CFPT columns under concentric compression and numerous studied parameters including the geometric size of PVC tubes (Height ‘H’, Diameter ‘D’ and Thickness ‘t’ of the tube), Compressive strength of PVC tubes, infilled concrete strength and diameter of concrete core were considered. As shown in Table 3, the diameter core of concrete varies from 58 mm to 151.5mm, thickness of PVC tubes varies from 2.30mm to 7.80 mm and concrete strength varies from 10.50 to 35.00 MPa.
Certainly, the strength and ductility of concrete enclosed in the PVC tubes would be significantly enhanced due to the lateral confinement of the tubes as noted from Figure 6. The confinement of the PVC tube on core concrete was inert, as the PVC tube replaced as confinement material when the circumferential strain was produced. Confinement effect of the PVC tube depend upon on the expansion tendency of concrete and the radial stiffness of the PVC tube. In order to check the stress and strain from experimental part, the results of simulated model of Woldemariam et al. (2019) is represented in Figure 6.
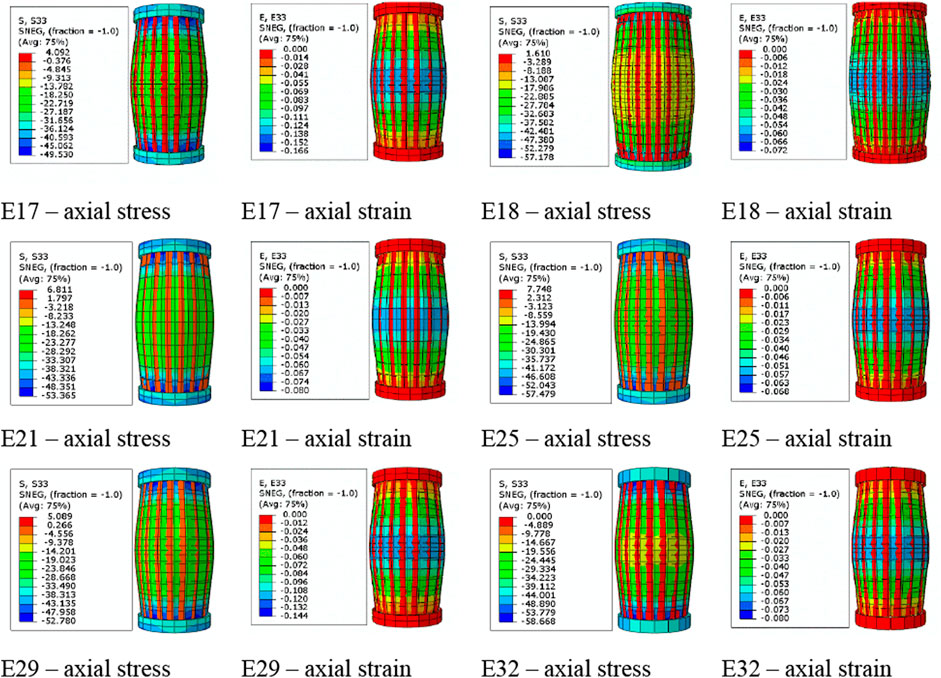
FIGURE 6. Simulated axial stress and axial strain for Woldemariam et al. (2019).
4 Test parameter effects
4.1 Effect of concrete strength
From Figure 7A it is noted that increase in slenderness ratio results in decrease in strain value. Decrease in core diameter results in increase in load carrying capacity for two different slenderness ratios are noted for a concrete compressive strength as 25.04 MPa. From Figure 7B, it is observed that the higher the core, results higher strain and lower the core, results lower the strain. Lower the core size results in higher load carrying capacity of specimen for concrete compressive strength as 29.12 MPa. Similar to Figure 7B, it is noted that the decrease in the core diameter results in decrease in load carrying capacity and lower the strain value for Figure 7C for concrete compressive strength as 25.04 MPa. For concrete compressive strength of 24.12 MPa from Figure 7D, increase in the core diameter results in increase in strain. Increase in load carrying capacity is noted for the decrease in core diameter.
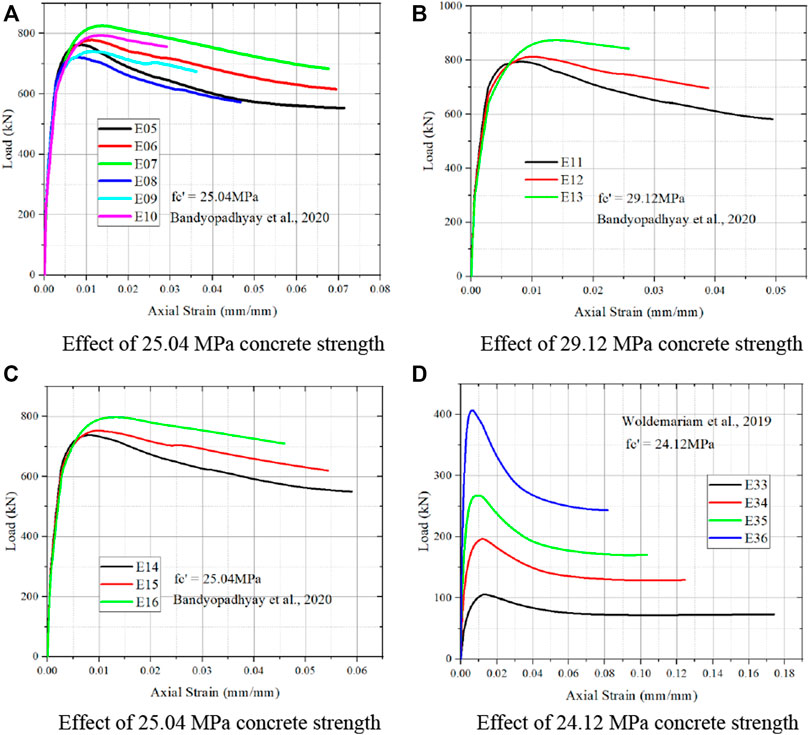
FIGURE 7. Effect of different concrete strength from Bandyopadhyay et al. (2020), Woldemariam et al. (2019). (A) Effect of 25.04 MPa concrete strength. (B) Effect of 29.12 MPa concrete strength. (C) Effect of 25.04 MPa concrete strength. (D) Effect of 24.12 MPa concrete strength.
For concrete compressive strength 10.50 MPa for Figure 8A, decrease in core diameter results in increase in strain and also increase in load carrying capacity. Similar to Figures 8A–D shows same trend. Increase in load carrying capacity with increase in concrete compressive strength is noted. With increase in concrete strength, there is decrease in axial strain is noted from Figure 6 and also with increase in concrete strength, there is increase in axial stress is also noted.
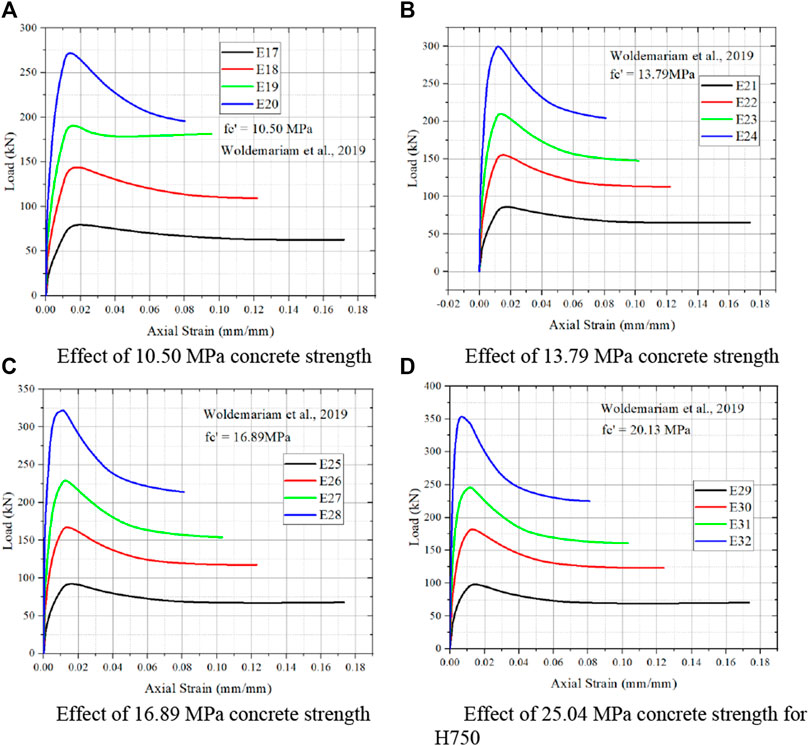
FIGURE 8. Effect of different concrete strength from Woldemariam et al. (2019). (A) Effect of 10.50 MPa concrete strength. (B) Effect of 13.79 MPa concrete strength (C) Effect of 16.89 MPa concrete strength. (D) Effect of 25.04 MPa concrete strength for H750.
From Figure 9A, the strain value decrease with increase in core size is also noted from Alatshan et al. (2022). Similar to Figures 9A, B also shows same trend. But Alatshan et al. (2022) shows different behaviour as increase in compressive strength results in decrease in load carrying capacity. From Figure 9C, it is noted that (Gupta, 2013) has similar behaviour nature of other authors from Figures 9A, B.
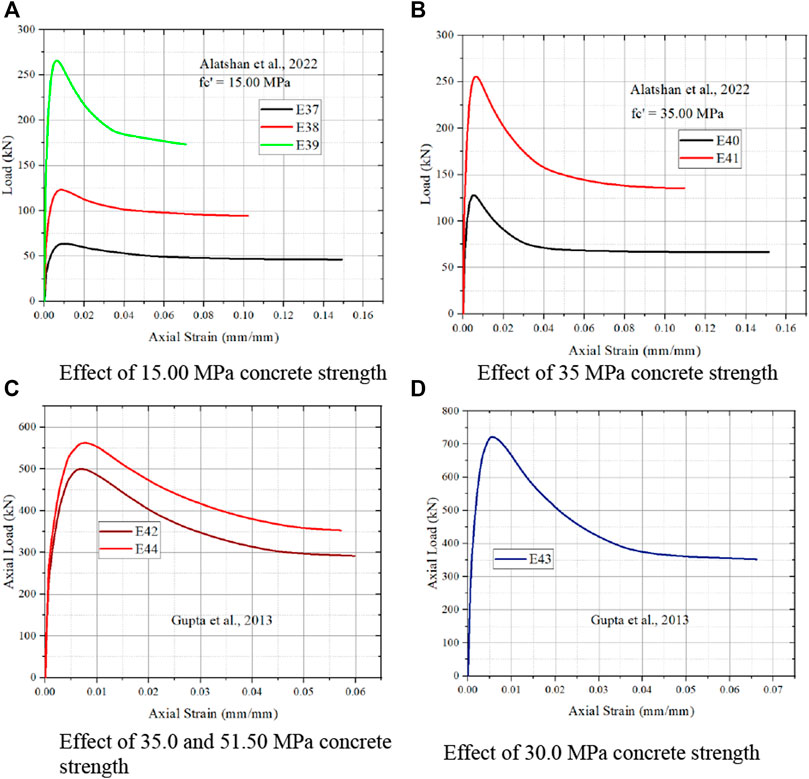
FIGURE 9. Effect of different concrete strength from (Gupta et al., 2020; Alatshan et al., 2022 and Gupta, 2013). (A) Effect of 15.00 MPa concrete strength. (B) Effect of 35 MPa concrete strength. (C) Effect of 35.0 and 51.50 MPa concrete strength. (D) Effect of 30.0 MPa concrete strength.
From Figures 7–9, it is noted that the varying strength of concrete effects the strain value and load carrying capacity. Increase in the compressive strength of concrete core, the slope of the curve increases and the stiffness of the specimen rises is reported by Alinejad et al. (2021). Higher the compressive strength of concrete, results in higher the load carrying capacity of column is noted from Jiang et al. (2014).
4.2 Effect of PVC tube thickness
Figure 10A, it is noted that lower slenderness ratio has higher strain value and increase in the slenderness ratio decrease strain value. From Figures 10B, C, it is noted that the similar behavior to that Figure 10A. Bandyopadhyay et al. (2020) noted that the increase in PVC thickness results in increase in load carrying capacity. And also, increase in PVC thickness results in decrease in strain. Increase in thickness, results in decrease in slope is noted. Increase in thickness of PVC tube results in increase in load carrying capacity is noted from Bandyopadhyay et al. (2020). Increase in concrete compressive strength results in decrease in strain value is noted from Figure 10D. Increase in concrete strength results in increase in strain value is noted from Figure 10E. Woldemariam et al. (2019), noted that the there is no constant relationship between PVC thickness and the strain value. And also, there is decrease in PVC thickness results in lower in load carrying capacity, which also confirmed from Figure 6. Lower the PVC thickness, lower the axial strain is observed.
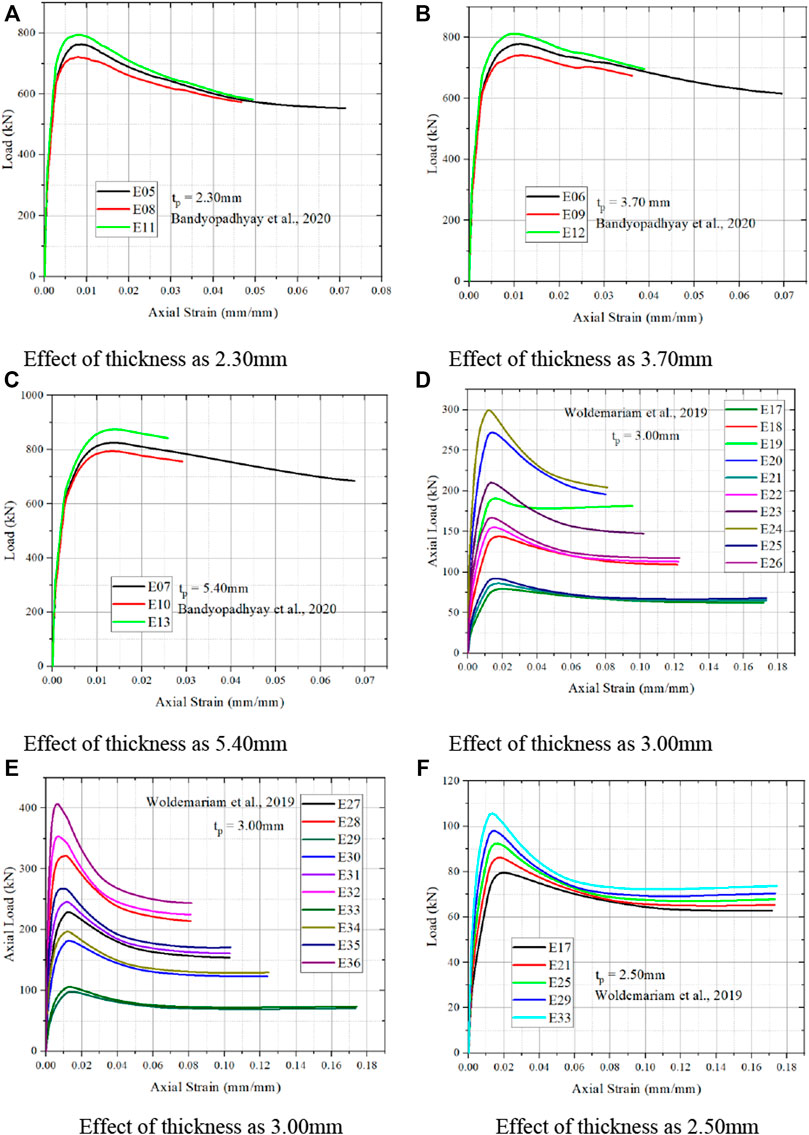
FIGURE 10. Effect of PVC tube thickness on stress and strain. (A) Effect of thickness as 2.30 mm. (B) Effect of thickness as 3.70 mm. (C) Effect of thickness as 5.40 mm. (D) Effect of thickness as 3.00 mm. (E) Effect of thickness as 3.00 mm. (F) Effect of thickness as 2.50 mm.
4.3 Effect of Column’s slenderness
Increase in slenderness ratio decrease in strain value is noted from FEM simulation is noted from Figure 11. Increase in slenderness ratio also increase in load carrying capacity of simulated column is observed from Bandyopadhyay et al. (2020). From Figure 11A, it is noted that at higher slenderness ratio, increase in PVC thickness results in decrease in strain value and also increase in load carrying capacity. Figure 11B increase in PVC thickness results in decrease in strain and also increase in load carrying capacity but however less than slenderness ratio 25. From Figure 11C, still reducing the slenderness ratio, increase in strain value and however there is less load carrying capacity is noted by Bandyopadhyay et al. (2020). Woldemariam et al. (2019) noted that for the lower slenderness ratio has higher strain value and with increase in PVC thickness results in decrease in strain and increase in load carrying capacity is noted from Figure 11D. Increase in slenderness ratio results in increase in confinement of concrete filled CFRP-PVC tubular columns is reported by Jiang et al. (2014). And similar behavior from steel tube filled concrete specimen is observed.
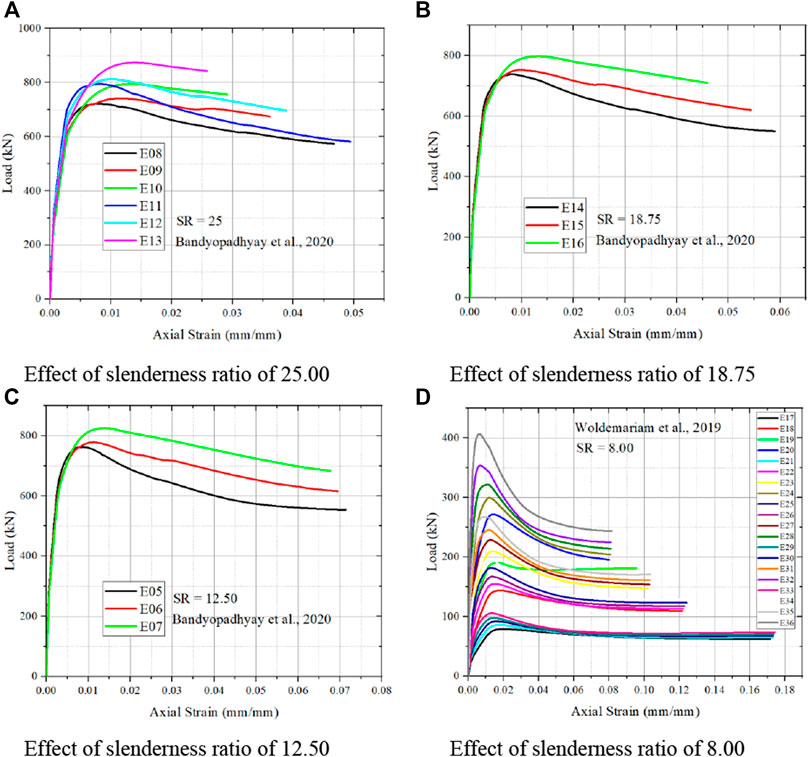
FIGURE 11. Effect of column slenderness ratio on strain and load carrying capacity of CFPT tubes. (A) Effect of slenderness ratio of 25.00. (B) Effect of slenderness ratio of 18.75. (C) Effect of slenderness ratio of 12.50. (D) Effect of slenderness ratio of 8.00.
4.4 Effect of concrete specimen diameter
From Figures 12A–C it is noted that the increase in confined concrete size results in increase in load carrying capacity and decrease in strain value is noted from Bandyopadhyay et al. (2020). Whereas inverse relationship is noted by Woldemariam et al. (2019) from Figures 12D–G with increase in core confinement area results in decrease in load carrying capacity and decrease in strain value is noted. Higher the core size, results in higher the peak load and ultimate load capacity is noted from Figure 12F. When core diameter of concrete is reduced, the ultimate strain of concrete is also reduced is observed. On higher the core diameter, the reduction from peak load to ultimate load is high is noted when compared to the lower core diameter.
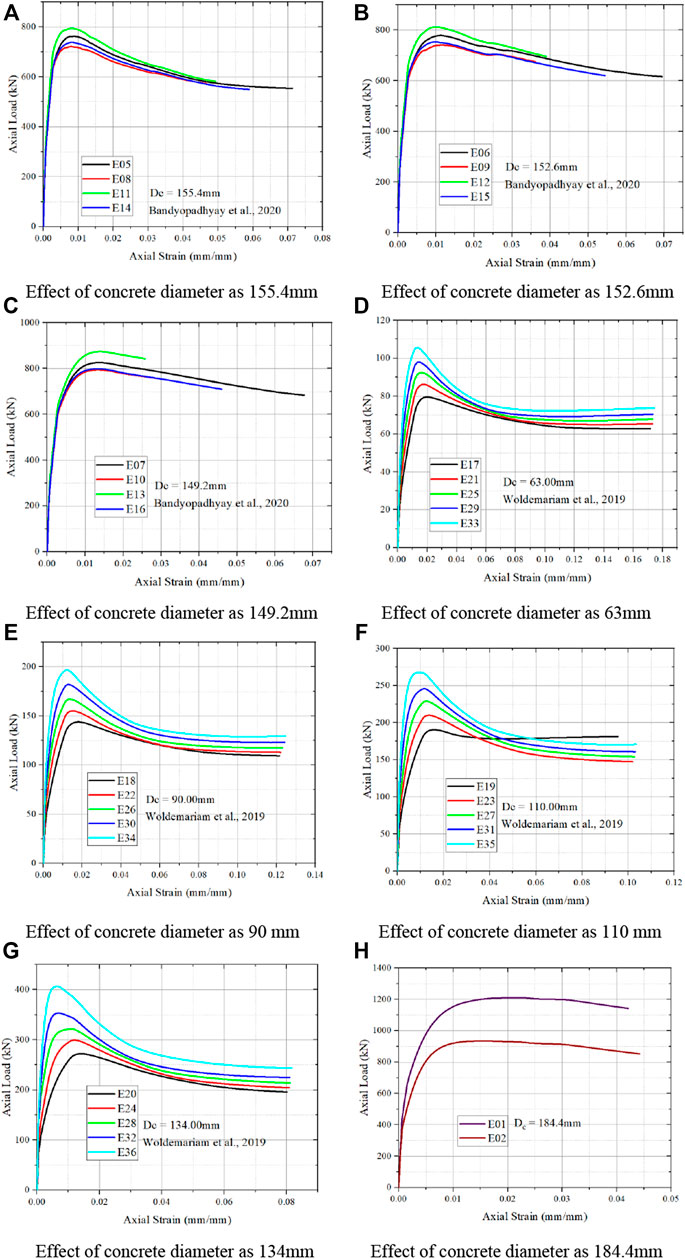
FIGURE 12. Effect of specimen diameter on strain and load carrying capacity of CFPT columns. (A) Effect of concrete diameter as 155.4 mm. (B) Effect of concrete diameter as 152.6 mm. (C) Effect of concrete diameter as 149.2 mm. (D) Effect of concrete diameter as 63 mm. (E) Effect of concrete diameter as 90 mm. (F) Effect of concrete diameter as 110 mm. (G) Effect of concrete diameter as 134 mm. (H) Effect of concrete diameter as 184.4 mm.
5 Analytical modelling
5.1 Peak stress
The analytical expression for the confined concrete that relates the concrete strength, PVC tube thickness, column’s slenderness ratio and specimen size of the confining material in Equation 13 was first developed by Richart, et al. (1928). Many researchers (Saatcioglu and Razvi., 1992.; Cusson and Paultre., 1995.; Bisby et al., 2005; Benzaid, et al., 2010; Xiao et al., 2010), made an attempt to modified the expression to predict the confined concrete compressive strength. It is also reported that the lateral confining pressure is uniformly distributed on perimeter of CFPT columns.
Substituting Equation 15 in Equation 13, the axial strength of CFPT columns can be expressed in Equation 16.
Experimental and FEM tests on CFPT columns have shown that peak stress fcc, to be influenced by the longitudinal reinforcing bars, hoop reinforcement bars and PVC used. Apart from this, slenderness ratio also plays a vital role in influencing the peak stress as described in Section 4. Hence, it is necessary to develop a model for determining the peak stress using all these parameters by means of dimensionless parameters as reported by Wang et al. (2012). Similar to (Isleem et al., 2018a), there are three different dimensionless parameters are used to develop model. Relative to the unconfined compressive strength of concrete, the dimensionless parameters for the PVC (λpvc), hoop reinforcement (λh), longitudinal reinforcement (λl) are introduced as follows
Where the volumetric ratio of the PVC tube is derived as
The following expressions for the peak stress, which depend on the three different dimensionless parameters and slenderness ratio was performed using MINITAB and obtained R2 value as 0.88.
Weights arrived on each dimensionless parameters and on slenderness ratio in Equation 18 have been determined from multiparameter regression analysis from 90 data points. Increase in strains were observed due to the presence of the internal longitudinal and hoop steel reinforcement (Isleem et al., 2018b).
5.2 Peak strain
As reported by Wang et al. (2012), the longitudinal steel reinforcement has less effect on the peak strain it is neglected in the model development. And also, it is observed from Equation (18) that the longitudinal steel reinforcement has less influence when compared to the hoop reinforcement. However, the peak strain is much influenced by the hoop reinforcement and lateral confinement provided by PVC tube. On the basis of the multiparameter regression analysis using MINITAB for the same data used to calibrate Equation 18, the peak strain is arrived as follows, with R2 value as 0.84.
Where,
5.3 Ultimate stress
Ultimate stress is much influenced by stress parameter (
5.4 Ultimate strain
It is noted that the ultimate axial stress and corresponding strain are the most significant parameters for defining a complete stress-strain response of concrete columns confined by steel and composite materials (Isleem et al., 2018c). Ultimate strain is much influenced by the yield stress of PVC material when compared to geometrical parameters. On the basis of multiparameter regression analysis using MINITAB for the 40 data points are used to develop an Equation 21 with R2 value as 0.72 with higher influence parameter for developing model.
5.5 Confined pressure
Procedure for estimating the confined pressure from slenderness ratio, specimen diameter, thickness of PVC tubes, ratio of yield stress of PVC to unconfined pressure and the ratio of yield stress of longitudinal steel to unconfined pressure of 90 data’s are used. Based on multi parameter regression analysis, the following two expression are developed to estimate the effective PVC confined pressure for rectangular column are proposed in which the coefficient correlation as 87.14% as shown in Figure 13. Modified Confined Pressure Ratio (MCR) used to account for the contributions of the PVC, longitudinal reinforcement and hoop reinforcement on the enhancement of ultimate strength (Isleem et al., 2019a). MCR is a non-dimensional parameter and it is calculated using Equation 23 with parameters discussed above.
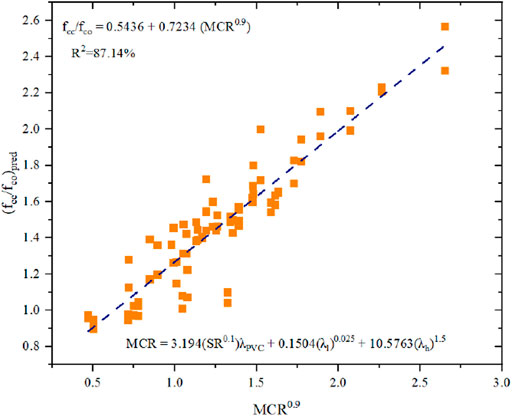
FIGURE 13. Estimation of PVC confined pressure.
In order to determine the minimum amount of PVC confinement, the relationship between the ratio of ultimate strength to the strength of unconfined concrete and the MCR calculated for 90 specimens reported in Table 1 is shown in Figure 14. Based on the resulted relationship, when fcc/fco = 1, then the MCR value is less than 0.63. This represents lightly confined concrete. Similar to Equation 23, most contributing factor for determining the confined strength is hoop reinforcement as reported in literatures (Isleem et al., 2019b).
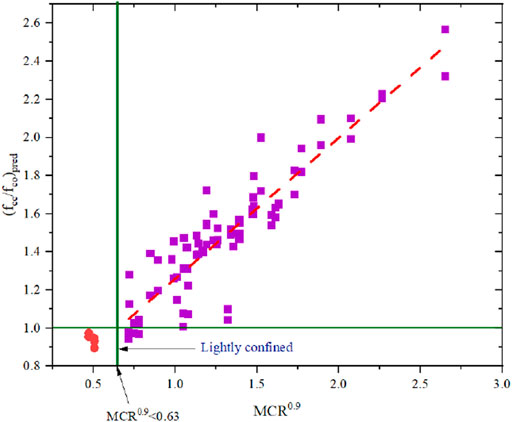
FIGURE 14. Relationship between MCR and (fcc/fco)pred: definition of lightly confined pressure.
6 Evaluation of existing strength and strain models
To design the CFPT system approximately, peak stress and peak strain must be accurately. In this section, eleven stress models and seven strain models as presented in Table 4 are verified against the obtained results from CFPT specimens to understand their applicability of the proposed composite system. Most of peak strength models from literatures discuss about the longitudinal steel reinforcement. Woldemariam et al. (2019) developed the strength model based on the thickness of PVC tube and diameter of column. Richart et al. (1928) developed the strength model as linear regression model. Strain models are based on the longitudinal steel reinforcement is proposed by most of researchers in literatures. To verify the models from literatures, the datasets are divided into two data sets, i.e., data’s having longitudinal reinforcement and data’s without longitudinal reinforcement. But the models from literatures are used in similar way as that corresponding researcher used.
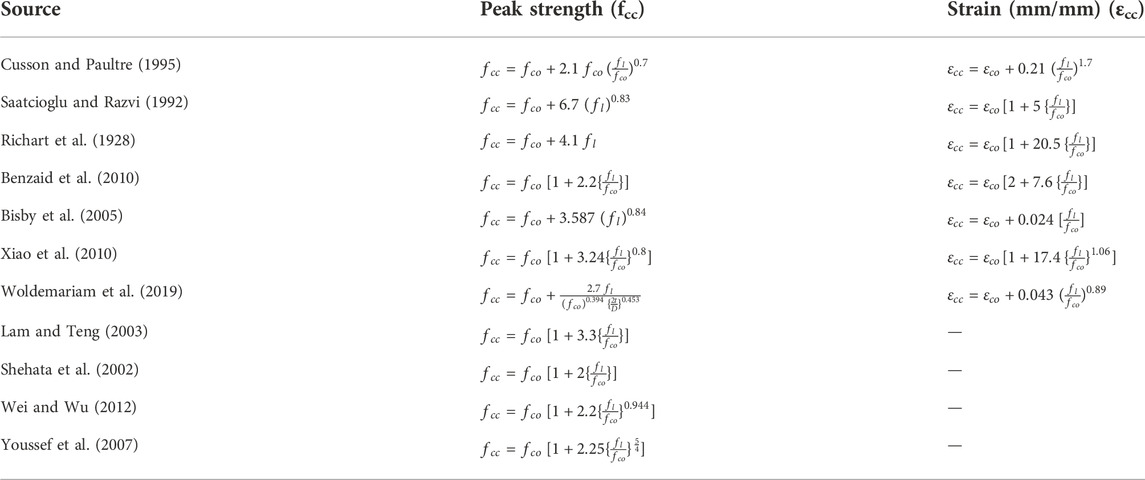
TABLE 4. Models used for calculation of fcc and εcc.
From Figure 15, it is understood that the most of the models in literatures are overestimating the peak stress, whereas model from (Shehata et al., 2002; Lam and Teng., 2003) underestimate the peak stress value. From Figure 16, it is understood that the specimen’s with the longitudinal reinforcement, most of the models from literatures has over prediction of the peak stress, whereas the present study underestimates the peak strain. Model proposed by Saastcioglu and Razvi (1992) predict the peak strain nearer to the experimental value.
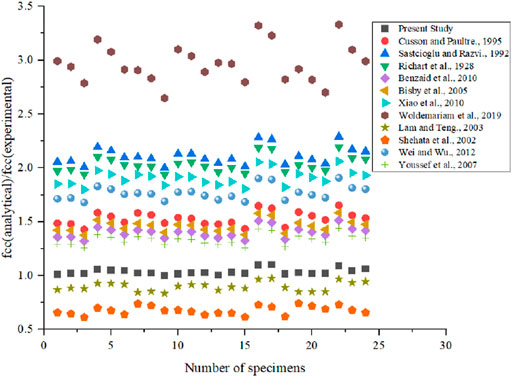
FIGURE 15. Predicted models for peak stress estimation without the longitudinal reinforcement.
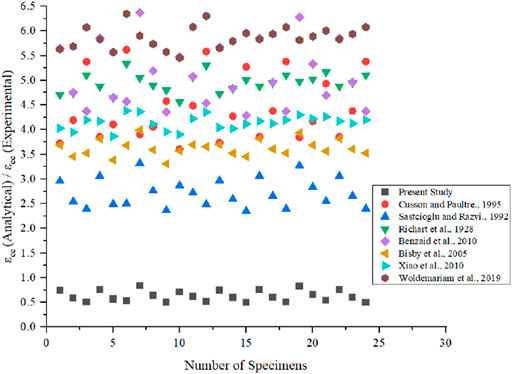
FIGURE 16. Predicted models for peak stress estimation with the longitudinal reinforcement.
From, Figure 17 it is noted that the strain values determined by Benzaid et al. (2010) and Woldemariam et al. (2019) are nearer to the present peak strain determination. Whereas, other authors from literatures determines the strain value which are much higher for the CFPT columns with longitudinal reinforcement. From Figure 18, it is noted that the model from (Benzaid et al., 2010) overestimate the peak strain when compared to other proposed models from literatures. Whereas all other models provide same value because there is no longitudinal reinforcement, as most of model uses it.
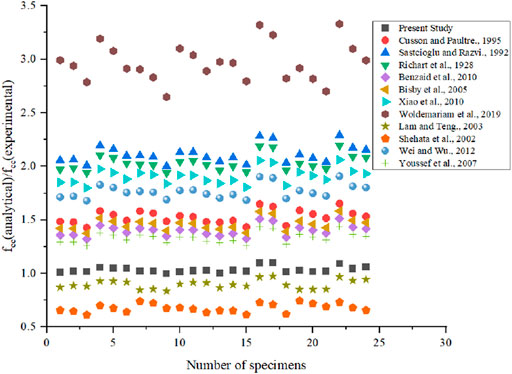
FIGURE 17. Predicted models for peak strain estimation without the longitudinal reinforcement.
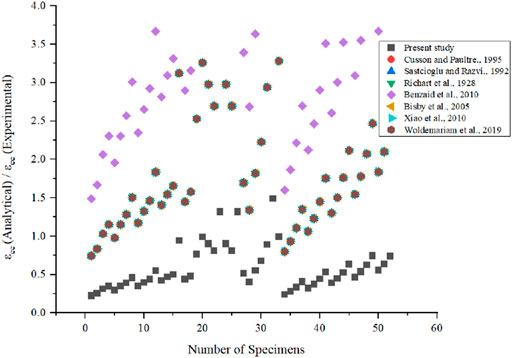
FIGURE 18. Predicted models for peak strain estimation without the longitudinal reinforcement.
Further to measure the accuracy of the various models from literatures, an average absolute error (AAE) is used as reported by Isleem et al. (2022a). AAE is defined as follows
Where, modi represents the model prediction and expi is experimental and FEM results and N is the total number of datasets. Table 5 presents the AAE results of the stress and strain models from literatures. From the model developed from present study, lower value of AAE is noted which indicates that the peak stress model developed is best when compared to other models available in literatures. Since, there are two different data set are used, model developed with longitudinal reinforcement shows better result when compared to data without longitudinal reinforcement. Strain model developed in present study for data with longitudinal reinforcement shows higher prediction and same without the data for longitudinal reinforcement. Higher predicted strain value is due to the strain model developed from present study is from both with and without longitudinal reinforcement.
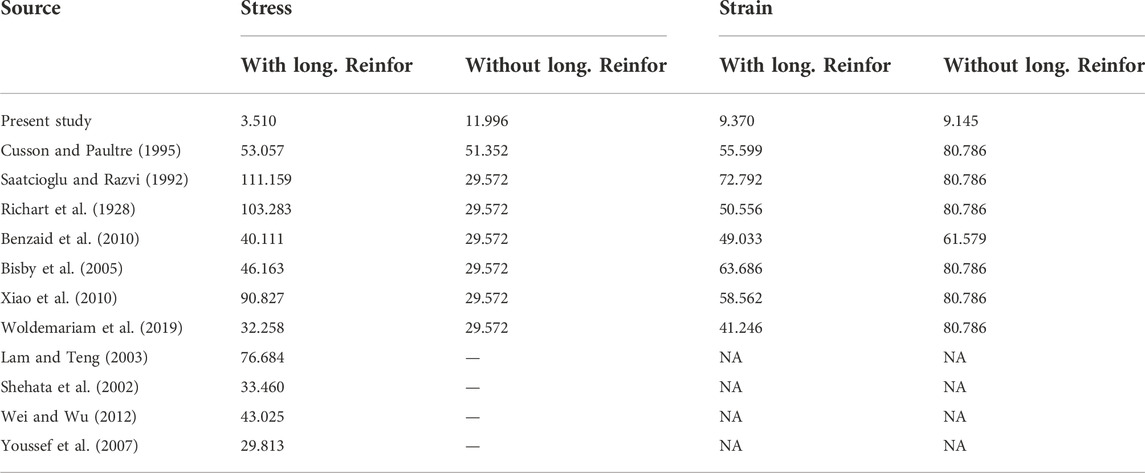
TABLE 5. AAE value (%) for peak stress and peak strain for various models from literatures.
7 Conclusion
In this research, simulated work on CFPT concrete columns was done to study the suitability and the performance of CFPT columns for structural use. Based on the stimulated work carried out and the results regarding the effect of concrete strength, PVC tube thickness, column slenderness ratio and specimen size on the peak load carrying capacity and peak strain model, the following conclusions are made:
• For lower the concrete compressive strength, higher the strain value and lower the load carrying capacity. Confined capacity of CFPT column decreases with increase in concrete compressive strength
• Increase in the PVC tube thickness result in the increase in the load carrying capacity and strain value
• Increase in the slenderness ratio results in decrease in the load carrying capacity and strain of CFPT columns
• Smaller the core diameter results in higher strain value and load carrying capacity.
• A general, consistent and computationally efficient mathematical model is developed for the peak stress, peak strain, ultimate stress and ultimate strain model.
• Stress model is developed between peak stress, ultimate stress and dimensionless parameter.
• Strain model is developed between peak strain, ultimate strain and dimensionless parameter
Proposed peak stress, peak strain, ultimate stress and ultimate strain models are based on the concrete compressive strength, slenderness ratio, longitudinal reinforcement and hoop reinforcement, when it is subjected to axial loading.
Data availability statement
The raw data supporting the conclusions of this article will be made available by the authors, without undue reservation.
Author contributions
Conceptualization: HI, Investigation: HI, and JP, Methodology: HI, and JP, Project Administration: HI, and JP, Resources: HI, and JP, HN, MS, Software: HI, and JP, Supervision: HI, Validation: JP, Visualization JP, SQ, FA, and JA, Writing–Original Draft: JP, SQ, FA, and JA, Writing–review and editing: JP, SQ, FA, and JA, Funding: MS.
Funding
The authors acknowledge that the research is partially funded by the Ministry of Science and Higher Education of the Russian Federation as part of the World Class Research Center Program: Advanced Digital Technologies (Contract No. 075-15-2022-311 dated 20.04.2022).
Acknowledgments
The authors acknowledge Qujing Normal University, Qujing, Yunnan, China, for facilitating the structural concrete laboratory.
Conflict of interest
The authors declare that the research was conducted in the absence of any commercial or financial relationships that could be construed as a potential conflict of interest.
Publisher’s note
All claims expressed in this article are solely those of the authors and do not necessarily represent those of their affiliated organizations, or those of the publisher, the editors and the reviewers. Any product that may be evaluated in this article, or claim that may be made by its manufacturer, is not guaranteed or endorsed by the publisher.
References
ABAQUS (2014). Providence. Version 6.14-2. RI, USA: Dassault Systèmes, Simulia, 440. Available at: https://www.3ds.com.
Abed, F., Alhamaydeh, M., and Abdalla, S. (2013). Experimental and numerical investigations of the compressive behavior of concrete filled steel tubes (CFSTs). J. Constr. Steel Res. 80, 429–439. doi:10.1016/j.jcsr.2012.10.005
ACI 363 (1984). State-of-the-Art report on high-strength concrete (ACI 363R- 92). ACI J. Proc. 81, 364–411.
Alam, M. I., Fawzia, S., and Liu, X. (2015). Effect of bond length on the behaviour of CFRP strengthened concrete-filled steel tubes under transverse impact. Compos. Struct. 132, 898–914. doi:10.1016/j.compstruct.2015.06.065
Alatshan, F., Altomate, A., and Hamad, S. (2022). Concrete filled plastic stub columns strength under axial compression. Open J. Civ. Eng. 12, 87–100. doi:10.4236/ojce.2022.121007
Alfarah, B., López-Almansa, F., and Oller, S. (2017). New methodology for calculating damage variables evolution in plastic damage model for RC structures. Eng. Struct. 132, 70–86. doi:10.1016/j.engstruct.2016.11.022
Alinejad, A., Khaloo, A., and Hassanpour, S. (2021). Investigating the behavior of circular concrete filled PVC tube columns under concentric and eccentric load using FEM. Asian J. Civ. Eng. 22, 589–603. doi:10.1007/s42107-020-00334-z
Bandyopadhyay, A., Maurya, K. K., and Samanta, A. K. (2020). Investigation on UPVC confined RC columns with recycled aggregate concrete using C&D waste. Structures 23, 279–288.
Benzaid, R., Mesbah, H., and Chikh, N. E. (2010). FRP-confined concrete cylinders: Axial compression experiments and strength model. J. Reinf. Plast. Compos. 29, 2469–2488. doi:10.1177/0731684409355199
Bisby, L. A., Dent, A. J. S., and Green, M. F. (2005). Comparison of confinement models for fiber-reinforced polymer-wrapped concrete. ACI Struct. J. 102, 62–72.
Chang, Y., Chen, W., Xiao, Q., Rong, E., and Peng, L, (2021). Theoretical and experimental study on axial compression concrete-filled tubes with different confinements. J. Construct. Steel Res. 185, 106862. doi:10.1016/j.jcsr.2021.106862
Cusson, D., and Paultre, P. (1995). Stress-strain model for confined high-strength concrete. J. Struct. Eng. 121, 468–477. doi:10.1061/(asce)0733-9445(1995)121:3(468)
Dong, J., Chen, D. P., Zho, J. M., Shan, D. S., Liu, X. Y., and Liu, G. (2011). Experimental study on mechanical properties of axially loaded PVC tube short concrete columns. Appl. Mech. Mater. 99 (100), 715–718. doi:10.4028/www.scientific.net/AMM.99-100.715
Fakharifar, M., and Chen, G. (2016). Compressive behavior of FRP-confined concrete-filled PVC tubular columns. Compos. Struct. 141, 91–109. doi:10.1016/j.compstruct.2016.01.004
Fang, Y., Yu, F., Guan, G., Wang, Z., Feng, C., and Li, D. (2020). A model for predicting the stress–strain relation of PVC-CFRP confined concrete stub columns under axial compression. Structures 26, 259–270. doi:10.1016/j.istruc.2020.04.023
Feng, Y., and Ditao, N. (2013). Experimental study on PVC-CFRP confined reinforced concrete short column under axial compression. J. Build Struct. 34 (6), 129–37.
Feng, C., Yu, F., and Fang, Y. (2021). Mechanical behavior of PVC tube confined concrete and PVC-FRP confined concrete: A review. Structures 31, 613–635. doi:10.1016/j.istruc.2021.01.093
Gao, S., Guo, L., Zhang, S., and Peng, Z. (2020). Performance degradation of circular thin walled CFST stub columns in high latitude offshore region. Thin-walled Struct. 154, 106906. doi:10.1016/j.tws.2020.106906
Gao, S., Wang, Y., Guo, L., Xu, Y., and Iyama, J. (2022). Axial behavior of circular steel tube with localized penetrating corrosion simulated by artificial notch. Thin-walled Struct. 172, 108944. doi:10.1016/j.tws.2022.108944
Guo, Y. C., Huang, P, Y., Yang, Y., and Li, L. J. (2009). Experimental studies on axially loaded concrete columns confined by different materials. Key Eng. Mat. 400-402, 513–518. doi:10.4028/www.scientific.net/kem.400-402.513
Gupta, P. K. (2013). Confinement of concrete columns with unplasticized Poly-vinyl chloride tubes. Int. J. Adv. Struct. Eng. 5, 1–8. doi:10.1186/2008-6695-5-19
Han, L.-H., Hou, C.-C., and Wang, Q.-L. (2014). Behavior of circular CFST stub columns under sustained load and chloride corrosion. J. Constr. Steel Res. 103, 23–36. doi:10.1016/j.jcsr.2014.07.021
Hassan, A., Arif, M., and Shariq, M. (2019). Use of geopolymer concrete for a cleaner and sustainable environment - a review of mechanical properties and microstructure. J. Clean. Prod. 223, 704–728. doi:10.1016/j.jclepro.2019.03.051
Hou, C. C., Han, L. H., Wang, Q. L., and Hou, C. (2016). Flexural behavior of circular concrete filled steel tubes (CFST) under sustained load and chloride corrosion. Thin-Walled Struct. 107, 182–196. doi:10.1016/j.tws.2016.02.020
Hu, H. T., Huang, C. S., Wu, M. H., and Wu, Y. M. (2003). Nonlinear analysis of axially loaded concrete-filled tube columns with confinement effect. J. Struct. Eng. (N. Y. N. Y). 129, 1322–1329. doi:10.1061/(asce)0733-9445(2003)129:10(1322)
Isleem, H. F., Wang, D., and Wang, Z. (2018a). Axial stress–strain model for square concrete columns internally confined with GFRP hoops. Mag. Concr. Res. 70 (20), 1064–1079. doi:10.1680/jmacr.17.00122
Isleem, H. F., Wang, Z., Wang, D., and Smith, S. T. (2018b). Monotonic and cyclic axial compressive behavior of CFRP-confined rectangular RC columns. J. Compos. Constr. 22, 4. doi:10.1061/(ASCE)CC.1943-5614.0000860
Isleem, H. F., Wang, D., and Wang, Z. (2018c). Modeling the axial compressive stress-strain behavior of CFRP-confined rectangular RC columns under monotonic and cyclic loading. Compos. Struct. 185, 229–240. doi:10.1016/j.compstruct.2017.11.023
Isleem, H. F., Wang, D., and Wang, Z. (2019a). A new model for reinforced concrete columns strengthened with fibre-reinforced polymer. Proc. Institution Civ. Eng. - Struct. Build. 173 (8), 602–622. doi:10.1680/jstbu.18.00159
Isleem, H. F., Wang, D., and Wang, Z. (2019b). A new numerical model for polymer-confined rectangular concrete columns. Proc. institution Civ. Eng. – Struct. Build. 172 (7), 528–544. doi:10.1680/jstbu.17.00103
Isleem, H. F., Peng, F., and Tayeh, B. A. (2022a). Confinement model for LRS FRP-confined concrete using conventional regression and artificial neural network techniques. Compos. Struct. 279, 114779. doi:10.1016/j.compstruct.2021.114779
Isleem, H. F., Tayeh, B. A., Abid, M., Iqbal, M., Mohamed, A. M., and Sherbiny, M. G. I. (2022b). Finite element and artificial neural network modeling of FRP-RC columns under axial compression loading. Front. Mat. 9, 888909. doi:10.3389/fmats.2022.888909
Jiang, S. F., Ma, S. L., and Wu, Z, Q. (2014). Experimental study and theoretical analysis on slender concrete filled CFRP-PVC tubular columns. Constr. Build. Mater. 53, 475–487. doi:10.1016/j.conbuildmat.2013.11.089
Kurt, C. E. (1978). Concrete filled structural plastic columns. J. Struct. Div. 104 (1), 55–63. doi:10.1061/jsdeag.0004849
Lai, M., Chen, M., Ren, F., and Ho, J. (2019). Uni-axial behaviour of externally confined UHSCFST columns. Thin-Walled Struct. 142, 19–36. doi:10.1016/j.tws.2019.04.047
Lam, L., and Teng, J. (2003). Design oriented stress strain model for FRP confined concrete. Constr. Build. Mater. 17 (6), 471–489. doi:10.1016/s0950-0618(03)00045-x
Mander, J. B., Priestley, M. J. N., and Park, R. (1988). Theoretical stress–strain model for confined concrete. J. Struct. Eng. (N. Y. N. Y). 114 (8), 1804–1826. doi:10.1061/(asce)0733-9445(1988)114:8(1804)
Marzoucka, M., and Sennah, K. (2002). “Concrete filled PVC tubes as compression members,” in Proceedings of the international seminar, composite material in concrete construction, dundee (Scotland, UK: ICE Virtual Library), 5–6 September 2002, 31–38.
Mirmiran, A., Shahawy, M., and Samaan, M. (1999). Strength and ductility of hybrid FRP concrete beam-columns. J. Struct. Eng. (N. Y. N. Y). 125 (10), 1085–1093. doi:10.1061/(asce)0733-9445(1999)125:10(1085)
Morino, S., Uchikoshi, M., and Yamaguchi, I. (2001). Concrete-filled steel tube column system-its advantages. International J. Steel Struct. 1, 33–44.
Neelam, M. K., and Kalaga, S. (2002). Elastic properties of PVC pipes. J. Struct. Eng. 29 (2), 91–96.
Papanikolaou, V. K., and Kappos, A. J. (2007). Confinement-sensitive plasticity constitutive model for concrete in triaxial compression. Int. J. Solids Struct. 44, 7021–7048. doi:10.1016/j.ijsolstr.2007.03.022
Raheemah, M. A., and Resan, S. F. (2020). Structural behaviour of slender PVC composite columns filled with concrete. IOP Conf. Ser. Mat. Sci. Eng. 671, 012083. doi:10.1088/1757-899X/671/1/012083
Raza, A., Khan, Q. U. Z., and Ahmad, A. (2019). Numerical investigation of load-carrying capacity of GFRP reinforced rectangular concrete members using CDP model in ABAQUS. Adv. Civ. Eng. 1745341. doi:10.1155/2019/1745341
Richart, F., Brandtzaeg, A., and Brown, R. L. (1928). A study of the failure of concrete under combined compressive stresses. Champaign, USA: University of Illinois at Urbana Champaign, College of Engineering, Engineering experiment station, 26.
Robinson, M., and Melby, I. (2015). Effects of bonding in short-span rectangular concrete filled GFRP tubes. Compos. Struct. 133, 131–139. doi:10.1016/j.compstruct.2015.07.105
Saafi, M., Toutanji, H. A., and Zongjin, L. (1999). Behavior of concrete columns confined with fiber reinforced polymer tubes. ACI Mater. J. doi:10.14359/652
Saatcioglu, B. M., and Razvi, S. R. (1992). Strength and ductility of confined concrete. J. Struct. Eng. 118, 1590–1607. doi:10.1061/(asce)0733-9445(1992)118:6(1590)
Sadoon, A. S. (2002). Experimental and theoretical investigation of PVC concrete composite columns. Iraq: Doctoral dissertation, University of Basrah.
Saenz, L. P. (1964). Discussion of ‘Equation for the stress–strain curve of concrete’ by P. Desayi, and S. Krishnan. ACI J. 61, 1229–1235.
Shehata, I. A., Carneiro, L. A., and Shehata, L. C. (2002). Strength of short concrete columns confined with CFRP sheets. Mat. Struct. 35 (1), 50–58. doi:10.1617/13686
Soliman, A. (2011). Behavior of long confined concrete column. Ain Shams Eng. J. 2 (3), 141–148. doi:10.1016/j.asej.2011.09.003
Tang, Y., Fang, S., Chen, J., Ma, L., Li, L., and Xiangguo, W. (2020). Axial compression behavior of recycled-aggregate-concrete-filled GFRP–steel composite tube columns. Eng. Struct. 216, 1–12.
Uy, B., Tao, Z., and Han, L.-H. (2011). Behaviour of short and slender concrete-filled stainless steel tubular columns. J. Constr. Steel Res. 67, 360–378. doi:10.1016/j.jcsr.2010.10.004
Wang, J.-Y., and Yang, Q. B. (2012). Investigation on compressive behaviors of thermoplastic pipe confined concrete. Constr. Build. Mater. 35, 578–585. doi:10.1016/j.conbuildmat.2012.04.017
Wang, J., and Yang, Q. (2010). Experimental study on mechanical properties of concrete confined with plastic Pipe. ACI Mater. J. 107, 132.
Wang, Z., Wang, D., Smith, S. T., and Lu, D. (2012). CFRP-Confined square RC columns. II: Cyclic axial compression stress-strain model. J. Compos. Constr. 16, 161–170. doi:10.1061/(ASCE)CC.1943-5614.0000246
Wei, S., Mau, S. T., and Mantrala, S. K. (1995). Performance of new sandwich tube under axial loading experiment. J. Struct. Eng. (N. Y. N. Y). 121 (12), 1806–1814. doi:10.1061/(asce)0733-9445(1995)121:12(1806)
Wei, Y. Y., and Wu, Y. F. (2012). Unified stress–strain model of concrete for FRP-confined columns. Constr. Build. Mater. 26 (1), 381–392. doi:10.1016/j.conbuildmat.2011.06.037
Woldemariam, A. M., Oyawa, W. O., and Nyomboi, T. (2019). Structural performance of uPVC confined concrete equivalent cylinders under axial compression loads. Buildings 9 (4), 82. doi:10.3390/buildings9040082
Xiao, Q. G., Teng, J. G., and Yu, T. (2010). Behavior and modeling of confined high-strength concrete. J. Compos. Constr. 14, 249–259. doi:10.1061/(asce)cc.1943-5614.0000070
Youssef, M. N., Feng, M. Q., and Mosallam, A. S. (2007). Stress–strain model for concrete confined by FRP composites. Compos. Part B Eng. 38 (5), 614–628. doi:10.1016/j.compositesb.2006.07.020
Youssf, O., ElGawady, M. A., Mills, J. E., and Ma, X. (2014). Finite element modelling and dilation of FRP-confined concrete columns. Eng. Struct. 79, 70–85. doi:10.1016/j.engstruct.2014.07.045
Zeng, X. (2016). Finite element modelling and analysis of concrete confined by stirrups in square RC columns. Civ. Eng. J. 17, 1–11. doi:10.14311/cej.2016.03.0017
Nomenclature
Ac the cross-sectional area of concrete core (mm2)
Ag cross sectional area of concrete column (mm2)
CFST Concrete Filled Steel Tubes
CFPT Concrete Filled PVC Tubes
RC Reinforced Concrete
FE Finite Element
fcc Confined Concrete compressive strength (MPa)
fco Unconfined Concrete compressive strength (MPa)
t thickness of PVC tube (mm)
D Dimater of the PVC tube (mm)
L/H Length/height of the PVC tube (mm)
fcc/fco confined concrete compressive strength to unconfined concrete compressive strength ratio
Dc Diameter of the concrete core without PVC tube (mm)
fc’ strength of unconfined concrete cylinder under compression (MPa)
εEP Peak experimental strain (mm/mm)
εFP Peak finite element modelling strain (mm/mm)
PEP Peak Experimental Load (kN)
PFP Peak finite element modelling Load (kN)
CDPM Concrete Damaged Plastic Model
Ψ dilation angle
Kc Shape factor for the yielding surface
e plastic flow potential eccentricity
µ Viscosity Parameter
fbo/fc’ ratio of biaxial stress to uniaxial stress
fc’’ considered to be 80% of the concrete cylinder strength (MPa)
εcc1 the strain of the confined concrete at first peak load
εc0 0.002 for unconfined concrete strength at peak load
kes the ratio of effectively confined concrete area to the confined area
fyt the yield strength of the steel
AAE Average Absolute Error
fl yield stress of longitudinal steel reinforcement (mm2)
fh yield stress of hoop steel reinforcement (mm2)
fpvc yield stress of pvc (mm2)
Ec Young’ss modulus of concrete (MPa)
λpvc dimensionless parameter for the PVC
λh dimensionless parameter for the hoop reinforcement
λl dimensionless parameter for the longitudinal reinforcement
ρls volumetric ratio for the longitudinal reinforcement
ρhs volumetric ratio for the hoop reinforcement
MCR Modified Confined Pressure Ratio (MCR)
Keywords: abaqus, concrete filled PVC tubes, load carrying capacity, finite element model, stress-strain
Citation: Isleem HF, P J, Ahmad J, Qaidi S, Althoey F, Najm HM and Sabri MMS (2022) Finite element and analytical modelling of PVC-confined concrete columns under axial compression. Front. Mater. 9:1011675. doi: 10.3389/fmats.2022.1011675
Received: 04 August 2022; Accepted: 05 September 2022;
Published: 07 December 2022.
Edited by:
Lili Hu, Shanghai Jiao Tong University, ChinaReviewed by:
Shan Gao, Harbin Institute of Technology, ChinaHassan Karampour, Griffith University, Australia
Copyright © 2022 Isleem, P, Ahmad, Qaidi, Althoey, Najm and Sabri. This is an open-access article distributed under the terms of the Creative Commons Attribution License (CC BY). The use, distribution or reproduction in other forums is permitted, provided the original author(s) and the copyright owner(s) are credited and that the original publication in this journal is cited, in accordance with accepted academic practice. No use, distribution or reproduction is permitted which does not comply with these terms.
*Correspondence: Haytham F. Isleem, aXNsZWVtaGF5dGhhbTg4QGdtYWlsLmNvbQ==