 C. Zhang
 D. Zhou3
94% of researchers rate our articles as excellent or good
Learn more about the work of our research integrity team to safeguard the quality of each article we publish.
Find out more
ORIGINAL RESEARCH article
Front. Mater., 12 January 2022
Sec. Mechanics of Materials
Volume 8 - 2021 | https://doi.org/10.3389/fmats.2021.820158
This article is part of the Research TopicMicrostructures and Mechanical Behavior of Light Metals Under Extreme ConditionsView all 4 articles
The Zr65Cu18Ni7Al10 bulk metallic glass with smaller diameter exhibits higher fracture strength under dynamic compression, which is ascribed to concentration of flow defect. The density of shear bands in the sample surface will increase with decreasing of the diameter, whereas, average distance and width of tear ridges in the fracture surface will increase with larger diameter. In addition, the volume of shear transformation zone can be estimated, which presents a ductile-to-brittle transition with the change of diameter. The physical graph of shear transformation zone can be obtained from the experimental analysis.
In view of its amorphous nature of the long-range disordered feature, bulk metallic glasses (BMGs) exhibit high strength and hardness, large elastic limit, high fracture toughness and excellent corrosion resistance compared with their crystalline counterparts (Johnson, 1999; Schuh et al., 2007; Qiao and Pelletier, 2014; Xie et al., 2019; Tao et al., 2021). However, studies about mechanical properties concluded that the vast majority of BMGs exhibit poor plastic deformation at room temperature (Schuh and Nieh, 2003; Wang, 2012; Zhang et al., 2016a). Recently, a typical ductile-to-brittle transition was found in BMGs with high applied strain rates (Jiang et al., 2008; Li et al., 2016). Different deformation behaviors of BMGs upon quasi-static and dynamic compressions at different strain rates and temperatures have been investigated (Sunny et al., 2008; Liu and Liu, 2011; Huang et al., 2012), these researches showed either positive or negative correlation between fracture stress and strain rate. In addition, the size effect of BMGs have been extensively studied by experimental analysis and molecular dynamics simulation under quasi-static biaxial loading condition (Huang et al., 2007; Wu et al., 2015; Zhang et al., 2016b; Wang et al., 2016; Yang et al., 2016). With a faster cooling rate, smaller BMG containing more free volume or shear transformation zones (STZs) will be conducive to the formation of shear bands and further enhance its plasticity under quasi-static compressions (Huang et al., 2007; Zhang et al., 2016b). Up till now, size effect on the dynamic mechanical properties are rarely reported. Most investigations, if any, focus on the experimental phenomena. However, the physical mechanisms remain unclear. The fundamental mechanism of size effect on dynamic mechanical properties still requires further study.
It is well known that there are no dislocations or grain boundaries in BMGs. The frozen-in “defects” of BMGs, which can be depicted as local fluctuations of density, is understood as the source of macroscopic plasticity and the origin of structural relaxation (Castellero et al., 2008). The “defects” can be described by physical models under different circumstances, such as STZs (Argon, 1979), free volume (Spaepen, 1977; Qiao et al., 2015), liquid-like core (Huo et al., 2013; Li et al., 2013), flow units (Wang et al., 20142014), quasi-point defects (Perez, 1990), coupling model (Ngai, 1998), or weakly bonded regions (Ichitsubo et al., 2005). In the current research, the conception of STZ will be used. As the review depicted (Wang et al., 2015), STZ can be pictured as an “event” or a consequence of plastic flow (Argon, 1979), and also can be regarded as a flow defect which triggers plastic flow (Langer and Lemaître, 2005), Herein, both of these two definitions are used.
In this study, the size effect under high strain rate compression was investigated based on microstructure because mechanical properties are often determined by microstructure. By studying thermal and dynamic compressive properties of BMGs with the diameter of 2, 3, and 5 mm, the physical landscape between intrinsic microstructure (the number of STZs per unit volume) and dynamic compressive properties could be obtained.
Because the alloy show superior plastic processing capacity, i.e. the supercooled liquid region is ∼120 K (Wang et al., 2015; Zhang et al., 2016a), the master alloys of Zr65Cu18Ni7Al10 (atom %) were re-melted at least five times to guaranty its chemical homogeneity. Rod-like BMGs with different diameters were then fabricated by employing the copper mould casting method. The amorphous nature of as-cast specimens was examined by the X-ray diffraction (XRD, Philips PW3830). The thermal properties and relaxation behavior of Zr65Cu18Ni7Al10 BMG were determined by differential scanning calorimetry (DSC, NETZSCH DSC 200F3). Cylindrical samples with different sizes of φ2×2 mm, φ3×3 mm, φ5×5 mm were prepared and both ends were polished carefully to ensure dustless and parallelism for the dynamic mechanical tests (Zhang et al., 2016a; Zhang et al., 2016b). The height error of each sample is less than 0.05 mm. The dynamic compressive experiments were performed on a split Hopkinson pressure bar (SHPB) apparatus at an average strain rates of 250 s−1. The sample surface and fracture morphology of the BMGs samples were observed by the scanning electron microscopy (SEM, TESCAN MIRA 3 XMU).
Dynamical compression experiments were performed by SHPB technique at high strain rates, as illustrated in Figure 1A. Specimens with an aspect ratio of one were sandwiched between the incident bar and the transmitted bar. Taking the higher strength of BMGs into account, two protection plates (12.7 mm in diameter) made of tungsten core and titanium-alloy ring were attached to the ends of bars between the samples. The size of tungsten core (6 mm in diameter) was designed in order to match the wave impedance of the steel bar. Copper impulse shaper was placed between the striker bar and the incident bar to shape the incident wave, aiming at maintaining a constant-strain rate loading during the dynamical compression experiment. The specimen ends were lubricated to minimize friction. We examined the effectiveness of impulse shaping and protection plates by compression test. Figure 1B shows a suitable incident wave for loading BMGs samples. In addition, the low amplitude of the reflected wave implies that introduction of protection plates has negligible effect on the experimental results. Thus, relatively reliable experimental results could be obtained, which formed the basis of current analysis. Eight test pieces were prepared for each test and at least four valid data were obtained.
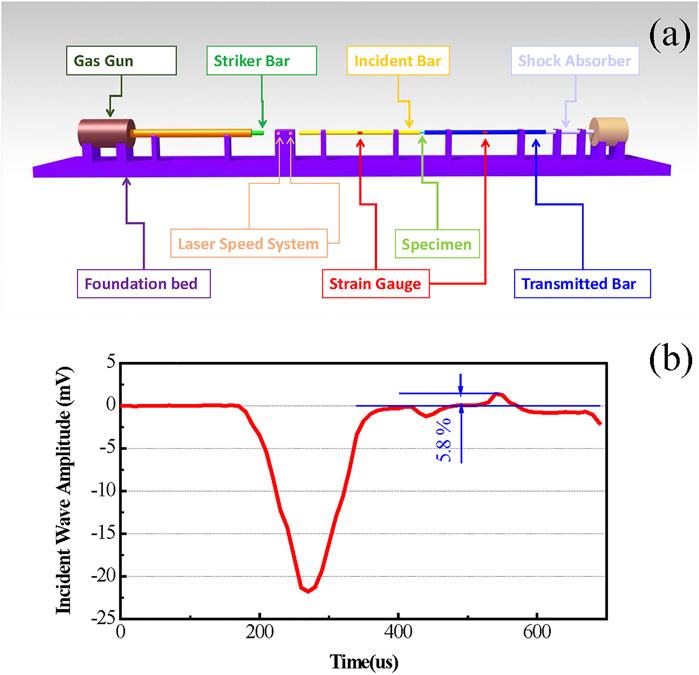
FIGURE 1. (A) Schematic diagram of the SHPB device for dynamic compression experience; (B) a suitable incident wave for loading BMGs samples to guarantee the reliability of data.
Figure 2A shows the XRD patterns of Zr65Cu18Ni7Al10 BMGs with different diameters. The typical diffraction humps were exhibited, which suggest amorphous structure of the alloys. The bigger the diameter, the stronger the intensity owing to the length of deflection.
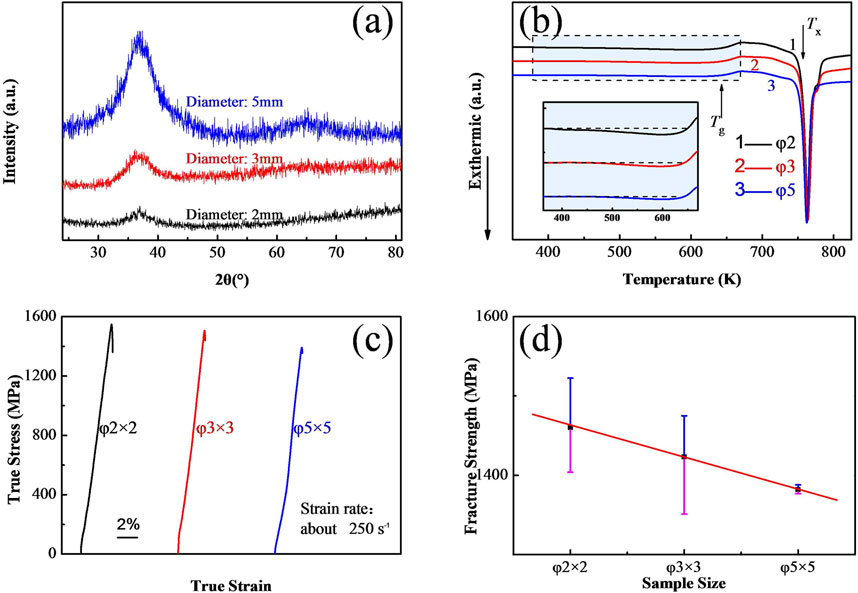
FIGURE 2. (A) the XRD patterns of Zr65Cu18Ni7Al10 BMGs; (B) the DSC curves of the samples with different diameters at a heating rate of 20 K min−1; (C) Typical compression true stress versus true strain curves obtained for the as-cast Zr65Cu18Ni7Al10amorphous alloy at strain rate of 250 s−1; (D) The relationship between sample size and fracture strengthen in the above cases.
Typical DSC curves were conducted at heating rate of 20 K min−1, as shown in Figure 2B. Each DSC curve exhibits a single endothermic reaction, which corresponds to the glass transition process, which followed by a significant exothermic event corresponding to a crystallization behavior in the supercooled liquid region. As displayed in Table 1, the glass transition temperature Tg = 643 K and onset temperature of crystallization Tx = 757 K were acquired from the DSC line chart, respectively. These experimental results agree well with the previously published data (Zhang et al., 2016a; Zhang et al., 2017). It is noted that smaller sample with the same composition contains larger structural relaxation exothermic heat, because of the faster cooling rate (Table 1). As discussed in the previous literature (Zhang et al., 2016b), structural relaxation exothermic heat can be considered as characterize “flow defect” in BMGs, called STZs (Langer and Lemaître, 2005), which play an essential role on the mechanical properties (Huang et al., 2007; Zhang et al., 2016b). As shown in Table 1, structural relaxation exothermic heat (involved energy per unit mass) with the diameters of 2, 3, and 5 mm are 0.201, 0.100, and 0.067 J g−1, respectively.
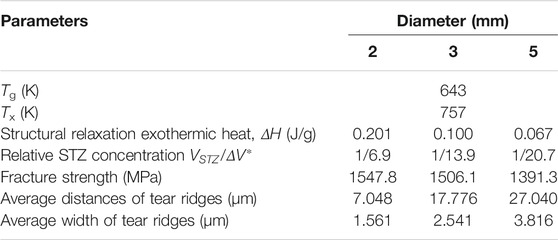
TABLE 1. Thermal properties of samples measured from their DSC curves and dynamic compression performances obtained by the SHPB tests.
The typical dynamic compression true stress versus true strain curves are obtained at strain rate of 250 s−1 with the diameters of 2, 3, and 5 mm, respectively, as shown in Figure 2C. The fracture strength of the samples with diameter of 2 mm are 1,404, 1,522, and 1,455 MPa, respectively. That diameter of 3 mm are 1,444, 1,351, and 1,475 MPa, respectively. That diameter of 5 mm are 1,381, 1,378, 1,338, and 1,381 MPa, respectively. Although the data have some variability, the general trend has been determined. And the variability is due to the experimental technology to a certain extent. As we all know, the difficulty and accuracy of dynamic mechanical test are lower than that of quasi-static mechanical test. The average fracture strength of 2, 3, and 5 mm are 1460.3, 1423.3, and 1382.0 MPa, respectively. The correlation between sample size and fracture strengthen is given in Figure 2D, also the error bars are indicated in the figure. There exists an obvious trend that fracture strengthen decreases with the increasing of sample size. Based on previous investigation (Huang et al., 2007; Zhang et al., 2016b), this may be caused by the number of STZ.
At the sample surfaces, as can be seen in Figures 3A,C,E, the density of sample’s shear bands with the diameter of 2 mm is obviously larger than that of 3 and 5 mm. As observed in fractography (Figures 3B,D,F), both average distance and average width of tear ridges decrease with increasing of the sample diameter.
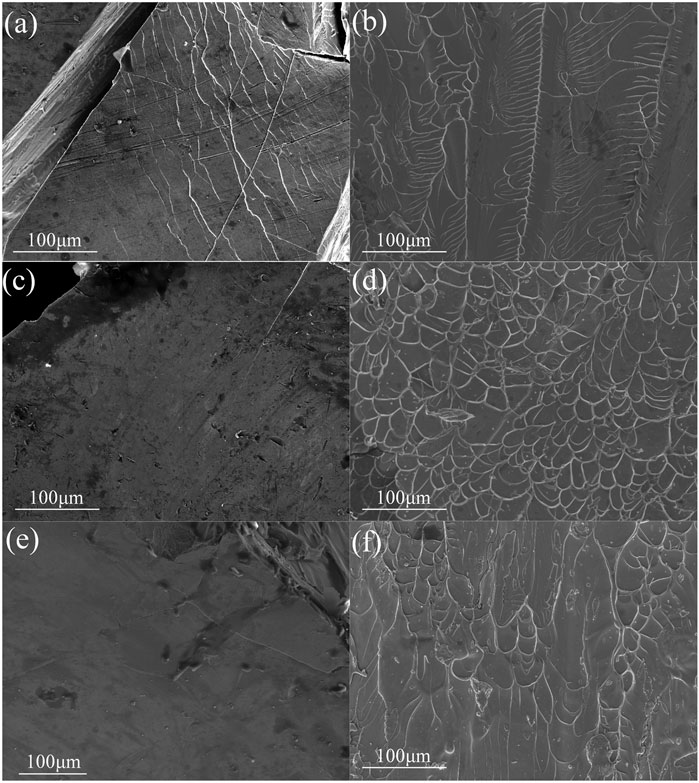
FIGURE 3. SEM images of the samples surfaces and fracture surfaces with diameters of 2 mm [(A,B)], 3 mm [(C,D)], and 5 mm [(E,F)], respectively. In (A), the shear bands are dense, and the red arrows only point out two types of shear bands. The red arrows in (C) and (E) point out all shear bands.
Structural relaxation exothermic heat
where
Jiang et al. (2011) proposed a method to predict the characteristic volume of an STZ
where
On the other hand, Jiang et al. (Jiang et al., 2008) presented that there exists a transition from STZ to tension transformation zones at the strain rate of 106 s−1. That means when the strain rate is 106 s−1, STZ volume
By assuming
At 250 s−1,
According to Eq. 2, the volume of STZ of the sample with diameter of 2 mm is 1.32 nm3. This number is located between 0.8 and 3.2 nm3, which is corresponding to the strain rate of 1800 and 2 × 10⁻⁴ s−1 for as-cast Vit105 (Li et al., 2016). The average atomic radius can be statistically estimated by
In such circumstances, the BMGs with a larger diameter can be regarded as an annealing sample, because they both contain less STZ per unit volume. The
For sample with 5 mm in diameter, there appears a negative volume of STZ under 250 s−1, which indicates that Eq. 2 cannot predict the volume of STZ and the obtained value is not reliable. This can be explained by a transition from ductile to brittle when sample diameter changes from 2 to 5 mm at the strain rate of 250 s−1. Similar observations have also been achieved in the research of Li et al. (2016). Distinctly different fracture morphology confirm this point, as shown in Figure 3.
For further study, under the strain rate of 10−4 ∼ 10−2 s−1 at 300 K, the volumes of STZ are calculated to be 3.68, 2.57 and 1.47 nm3 for samples with the diameter of 2, 3 and 5 mm, respectively. These values are close to 3.89 nm3 for Zr55Cu25Ni10Al10 (Pan et al., 2008) and 2.93 nm3 for Zr52.5Cu17.9Ni14.6Al10Ti5 (Vit105) (Jiang et al., 2011). In general, under quasi-static conditions, the volume of STZ decreases with the increase of sample diameter rather than transitions.
At the liquid nitrogen temperature (77 K), the volumes of STZ are 0.95, 0.66 and 0.38 nm3 for samples with the diameter of 2, 3 and 5 mm, respectively. The volumes of STZ decrease continuously to be 0.21, 0.15 and 0.08 nm3 at 17 K for samples with the diameter of 2, 3 and 5 mm. These predictions are similar to 0.73 and 0.17 nm3 (as-cast Vit105) at the temperature of 77 and 17 K, respectively (Li et al., 2016). Only at 0 K will the volume of STZ reaches 0 nm3. However, absolute zero can hardly be reached based on the laws of thermodynamics. Thus, decreasing of temperature causes smaller volume of STZ and the limit is 0 nm3 at 0 K. Besides, it will not lead a transition, i.e., change of STZ volume from positive to negative.
Based on the above analysis, it can be concluded that there are more STZs in smaller samples, which can deduce that: 1) the volume of STZ in smaller samples are larger than the bigger one under the same condition; 2) a transition in the volume of STZ from positive to negative will take place under strain rate of 250 s−1 at 300 K; 3) the volume of STZ will increase as the temperature increases for a given sample, where any transitions were improbable in theory.
However, it is still not clear how the STZs are distributed in a sample. The distribution of STZs is investigated based on the fractography. We have studied the average distance and average width of tear ridges. As shown in Figure 4, the average distances of tear ridges are 7.048, 17.776 and 27.040 μm in the fracture surface with the diameter of 2, 3, and 5 mm. Also, the corresponding average width of tear ridges are 1.561, 2.541, 3.816 μm, respectively. All these data are obtained by SEM images (Figure 3), using pixel size and Pythagorean Theorem. Because of the equal area, the greater the total length of the shear band, the greater the shear band density. According to statistics, the total length of the shear bands in the SEM pictures of the surfaces of 2, 3 and 5 mm samples shown in Figure 3 is 5,029, 869 and 540 μm, respectively. In order to make it understood easier, the red arrows will be insert in Figure 3. In Figure 3A, the shear bands are dense, and the red arrows only point out two types of shear bands. The red arrows in Figures 3C,E point out all shear bands.
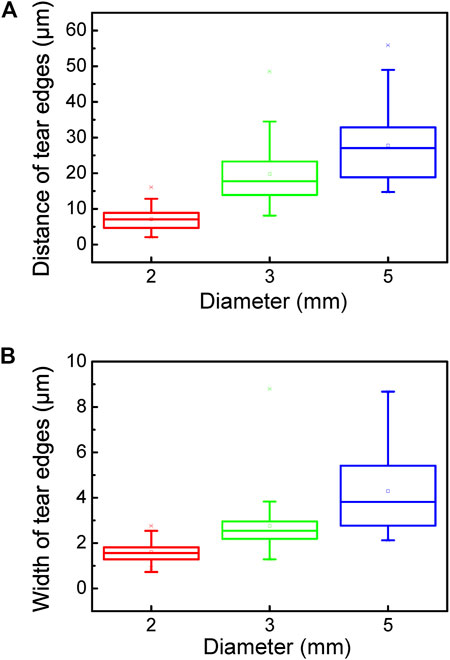
FIGURE 4. (A) the statistics of distance between adjacent tear ridges at samples with different diameters; (B) the statistics of width of each tear ridge at samples with different diameters. Note: all the data come from Figure 3.
For the specimen with stronger STZ concentration in unit volume, the average distances of tear ridges will inevitably be small on the fracture surface after impact load, which can be proved by experimental observation. If the dispersion degree of weak keys in the specimen is consistent, the average width of tear edges should behave similarly in specimens of different sizes. However, the experimental results show that the smaller the specimen, the smaller the average width of the tear edge. Through the above analysis, this paper speculates that the smaller specimen not only has the greater STZ concentration, but also the more dispersed. Figure 5 shows the physical image of STZ distribution and deformation mechanism.
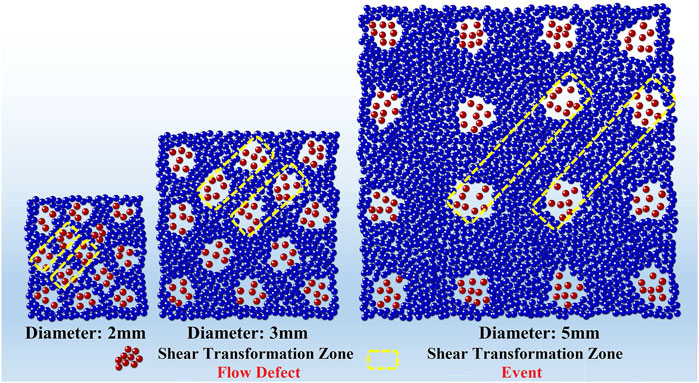
FIGURE 5. Diagrammatic sketch of microscopic deformation mechanism on Zr65Cu18Ni7Al10 BMGs with different diameters under dynamic compression.
In summary, the sample with smaller size exhibits better fracture strengthen under dynamic compression, which is ascribed to the higher concentration of STZ. The volume of STZ has been predicted. A transition from ductile to brittle at samples with different diameters is observed at the strain rate of 250 s−1. In addition, the volume of STZ will increase at elevated temperatures. Based on fractrography, the physical distribution image of STZ is displayed. The current analysis provides several microstructure information that could be drawn from STZ concentration, which is caused by different cooling rate, i.e. processing. This can be explained by Figure 6.
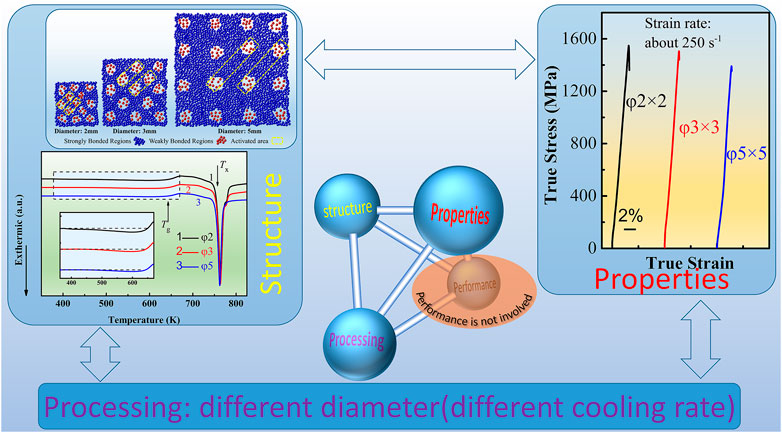
FIGURE 6. The relationship among processing, structure and properties is reflected in the dynamic compression of Zr65Cu18Ni7Al10 BMGs with different diameters.
This research have built two relationships: 1) the smaller the sample, the greater the strength, 2) the smaller the sample, the more dispersed the flow defect.
The original contributions presented in the study are included in the article/Supplementary Material, further inquiries can be directed to the corresponding author.
CZ and BH: conceptualization and project administration. CZ and DZ: testing, data acquisition, resources, and writing—original draft. BH: writing—review and editing. All authors contributed to the article and approved the submitted version.
The work was sponsored by the Natural Science Foundation of Shaanxi Province (No. 2020JQ-114 ), Natural Science Foundation of Chongqing, China (No. cstc2021jcyj-msxmX0194) and the National Natural Science Foundation of China (No. 11972310). CZ thank Professor Jichao Qiao for providing the materials and helpful discussions.
The authors declare that the research was conducted in the absence of any commercial or financial relationships that could be construed as a potential conflict of interest.
All claims expressed in this article are solely those of the authors and do not necessarily represent those of their affiliated organizations, or those of the publisher, the editors and the reviewers. Any product that may be evaluated in this article, or claim that may be made by its manufacturer, is not guaranteed or endorsed by the publisher.
The Supplementary Material for this article can be found online at: https://www.frontiersin.org/articles/10.3389/fmats.2021.820158/full#supplementary-material
Argon, A. S. (1979). Plastic Deformation in Metallic Glasses. Acta Metallurgica 27 (1), 47–58. doi:10.1016/0001-6160(79)90055-5
Castellero, A., Moser, B., Uhlenhaut, D. I., Torre, F. H. D., and Löffler, J. F. (2008). Room-temperature Creep and Structural Relaxation of Mg-Cu-Y Metallic Glasses. Acta Materialia 56 (15), 3777–3785. doi:10.1016/j.actamat.2008.04.021
Evenson, Z., and Busch, R. (2011). Equilibrium Viscosity, Enthalpy Recovery and Free Volume Relaxation in a Zr44Ti11Ni10Cu10Be25 Bulk Metallic Glass. Acta Materialia 59 (11), 4404–4415. doi:10.1016/j.actamat.2011.03.064
Huang, Y. J., Shen, J., and Sun, J. F. (2007). Bulk Metallic Glasses: Smaller Is Softer. Appl. Phys. Lett. 90 (8), 081919. doi:10.1063/1.2696502
Huang, Y., Zheng, W., He, F., and Shen, J. (2012). The Temperature Dependent Dynamic Mechanical Response of a ZrCuNiAl Bulk Metallic Glass. Mater. Sci. Eng. A 551, 100–103. doi:10.1016/j.msea.2012.04.100
Huo, L. S., Zeng, J. F., Wang, W. H., Liu, C. T., and Yang, Y. (2013). The Dependence of Shear Modulus on Dynamic Relaxation and Evolution of Local Structural Heterogeneity in a Metallic Glass. Acta Materialia 61 (12), 4329–4338. doi:10.1016/j.actamat.2013.04.004
Ichitsubo, T., Matsubara, E., Yamamoto, T., Chen, H. S., Nishiyama, N., Saida, J., et al. (2005). Microstructure of Fragile Metallic Glasses Inferred from Ultrasound-Accelerated Crystallization in Pd-Based Metallic Glasses. Phys. Rev. Lett. 95 (24), 245501. doi:10.1103/PhysRevLett.95.245501
Jiang, F., Jiang, M. Q., Wang, H. F., Zhao, Y. L., He, L., and Sun, J. (2011). Shear Transformation Zone Volume Determining Ductile-Brittle Transition of Bulk Metallic Glasses. Acta Materialia 59 (5), 2057–2068. doi:10.1016/j.actamat.2010.12.006
Jiang, M. Q., Ling, Z., Meng, J. X., and Dai, L. H. (2008). Energy Dissipation in Fracture of Bulk Metallic Glasses via Inherent Competition between Local Softening and Quasi-Cleavage. Phil. Mag. 88 (3), 407–426. doi:10.1080/14786430701864753
Johnson, W. L. (1999). Bulk Glass-Forming Metallic Alloys: Science and Technology. MRS Bull. 24 (10), 42–56. doi:10.1557/S0883769400053252
Johnson, W. L., and Samwer, K. (2005). A Universal Criterion for Plastic Yielding of Metallic Glasses with a(T/Tg)2/3Temperature Dependence. Phys. Rev. Lett. 95 (19), 195501. doi:10.1103/PhysRevLett.95.195501
Langer, J. S., and Lemaître, A. (2005). Dynamic Model of Super-arrhenius Relaxation Rates in Glassy Materials. Phys. Rev. Lett. 94 (17), 175701. doi:10.1103/PhysRevLett.94.175701
Li, M. C., Jiang, M. Q., Li, G., He, L., Sun, J., and Jiang, F. (2016). Ductile to Brittle Transition of Fracture of a Zr-Based Bulk Metallic Glass: Strain Rate Effect. Intermetallics 77, 34–40. doi:10.1016/j.intermet.2016.07.004
Li, W., Bei, H., Tong, Y., Dmowski, W., and Gao, Y. F. (2013). Structural Heterogeneity Induced Plasticity in Bulk Metallic Glasses: From Well-Relaxed Fragile Glass to Metal-like Behavior. Appl. Phys. Lett. 103 (17), 171910. doi:10.1063/1.4827299
Liu, W. D., and Liu, K. X. (2011). Dynamic Behavior of a Zr-Based Metallic Glass at Cryogenic Temperature. Intermetallics 19 (1), 109–112. doi:10.1016/j.intermet.2010.10.003
Lu, Z., Li, J., Shao, H., Gleiter, H., and Ni, X. (2009). The Correlation between Shear Elastic Modulus and Glass Transition Temperature of Bulk Metallic Glasses. Appl. Phys. Lett. 94 (9), 091907. doi:10.1063/1.3093879
Ngai, K. L. (1998). Correlation between the Secondary β-relaxation Time atTgwith the Kohlrausch Exponent of the Primary α Relaxation or the Fragility of Glass-Forming Materials. Phys. Rev. E 57 (6), 7346–7349. doi:10.1103/PhysRevE.57.7346
Pan, D., Inoue, A., Sakurai, T., and Chen, M. W. (2008). Experimental Characterization of Shear Transformation Zones for Plastic Flow of Bulk Metallic Glasses. Proc. Natl. Acad. Sci. 105 (39), 14769–14772. doi:10.1073/pnas.0806051105
Perez, J. (1990). Quasi-punctual Defects in Vitreous Solids and Liquid-Glass Transition. Solid State Ionics 39 (1-2), 69–79. doi:10.1016/0167-2738(90)90028-P
Qiao, J. C., and Pelletier, J. M. (2014). Dynamic Mechanical Relaxation in Bulk Metallic Glasses: a Review. J. Mater. Sci. Tech. 30 (6), 523–545. doi:10.1016/j.jmst.2014.04.018
Qiao, J. C., Wang, Y.-J., Pelletier, J. M., Keer, L. M., Fine, M. E., and Yao, Y. (2015). Characteristics of Stress Relaxation Kinetics of La 60 Ni 15 Al 25 Bulk Metallic Glass. Acta Materialia 98, 43–50. doi:10.1016/j.actamat.2015.07.020
Schuh, C. A., and Nieh, T. G. (2003). A Nanoindentation Study of Serrated Flow in Bulk Metallic Glasses. Acta materialia 51 (1), 87–99. doi:10.1016/S1359-6454(02)00303-8
Schuh, C., Hufnagel, T., and Ramamurty, U. (2007). Mechanical Behavior of Amorphous Alloys. Acta Materialia 55 (12), 4067–4109. doi:10.1016/j.actamat.2007.01.052
Slipenyuk, A., and Eckert, J. (2004). Correlation between Enthalpy Change and Free Volume Reduction during Structural Relaxation of Zr55Cu30Al10Ni5 Metallic Glass. Scripta Materialia 50 (1), 39–44. doi:10.1016/j.scriptamat.2003.09.038
Spaepen, F. (1977). A Microscopic Mechanism for Steady State Inhomogeneous Flow in Metallic Glasses. Acta Metallurgica 25 (4), 407–415. doi:10.1016/0001-6160(77)90232-2
Sunny, G., Yuan, F., Prakash, V., and Lewandowski, J. (2008). Effect of High Strain Rates on Peak Stress in a Zr-Based Bulk Metallic Glass. J. Appl. Phys. 104 (9), 093522. doi:10.1063/1.3009962
Tao, K., Qiao, J. C., He, Q. F., Song, K. K., and Yang, Y. (2021). Revealing the Structural Heterogeneity of Metallic Glass: Mechanical Spectroscopy and Nanoindentation Experiments. Int. J. Mech. Sci. 201 (5817), 106469. doi:10.1016/j.ijmecsci.2021.106469
Wang, W. H. (2012). The Elastic Properties, Elastic Models and Elastic Perspectives of Metallic Glasses. Prog. Mater. Sci. 57 (3), 487–656. doi:10.1016/j.pmatsci.2011.07.001
Wang, W. H., Yang, Y., Nieh, T. G., and Liu, C. T. (2015). On the Source of Plastic Flow in Metallic Glasses: Concepts and Models. Intermetallics 67, 81–86. doi:10.1016/j.intermet.2015.08.004
Wang, X., Jiang, F., Hahn, H., Li, J., Gleiter, H., Sun, J., et al. (2016). Sample Size Effects on Strength and Deformation Mechanism of Sc75Fe25 Nanoglass and Metallic Glass. Scripta Materialia 116, 95–99. doi:10.1016/j.scriptamat.2016.01.036
Wang, Z., Sun, B. A., Bai, H. Y., and Wang, W. H. (2014). Evolution of Hidden Localized Flow during Glass-To-Liquid Transition in Metallic Glass. Nat. Commun. 5 (1), 1–7. doi:10.1038/ncomms6823
Wu, F. F., Jiang, S. S., Zhao, R. D., Zhou, Q., Zhang, G. A., and Wu, X. F. (2015). Size-dependent Plastic Stability of Zr-Based Metallic Glass. Mater. Sci. Eng. A 646, 272–278. doi:10.1016/j.msea.2015.08.062
Xie, F., Chen, Q., Gao, J., and Li, Y. (2019). Laser 3D Printing of Fe-Based Bulk Metallic Glass: Microstructure Evolution and Crack Propagation. J. Materi Eng. Perform. 28 (6), 3478–3486. doi:10.1007/s11665-019-04103-1
Yang, G. J., Xu, B., Kong, L. T., Li, J. F., and Zhao, S. (2016). Size Effects in Cu50Zr50 Metallic Glass Films Revealed by Molecular Dynamics Simulations. J. Alloys Comp. 688, 88–95. doi:10.1016/j.jallcom.2016.07.178
Zhang, C., Qiao, J. C., Pelletier, J. M., and Yao, Y. (2017). Arrhenius Activation of Zr65Cu18Ni7Al10 Bulk Metallic Glass in the Supercooled Liquid Region. Intermetallics 86, 88–93. doi:10.1016/j.intermet.2017.03.017
Zhang, C., Qiao, J. C., Pelletier, J. M., and Yao, Y. (2016). Bulk Metallic Glasses: "Defects" Determines Performance. Mater. Sci. Eng. A 675, 379–385. doi:10.1016/j.msea.2016.08.082
Keywords: metallic glass, mechanical testing, high-speed deformation, fractography, shear transformation zones
Citation: Zhang C, Zhou D and Hou B (2022) Influence of Defects to Zr65Cu18Ni7Al10 Bulk Metallic Glass Properties Under Dynamic Compression. Front. Mater. 8:820158. doi: 10.3389/fmats.2021.820158
Received: 22 November 2021; Accepted: 15 December 2021;
Published: 12 January 2022.
Edited by:
Huihong Liu, Osaka University, JapanCopyright © 2022 Zhang, Zhou and Hou. This is an open-access article distributed under the terms of the Creative Commons Attribution License (CC BY). The use, distribution or reproduction in other forums is permitted, provided the original author(s) and the copyright owner(s) are credited and that the original publication in this journal is cited, in accordance with accepted academic practice. No use, distribution or reproduction is permitted which does not comply with these terms.
*Correspondence: B. Hou, aG91YmluZ0Bud3B1LmVkdS5jbg==
Disclaimer: All claims expressed in this article are solely those of the authors and do not necessarily represent those of their affiliated organizations, or those of the publisher, the editors and the reviewers. Any product that may be evaluated in this article or claim that may be made by its manufacturer is not guaranteed or endorsed by the publisher.
Research integrity at Frontiers
Learn more about the work of our research integrity team to safeguard the quality of each article we publish.