 Z. Li
Z. Li K. F. Yao2*
- 1Institute of High Energy Physics, Chinese Academy of Science, Beijing, China
- 2School of Material Science and Engineering, Tsinghua University, Beijing, China
- 3China Iron and Steel Research Institute Group, Advanced Technology and Materials Co., Ltd., Beijing, China
A series of nanocrystalline soft magnetic alloys with nominal compositions of Fe66.8-xCo10NixCu0.8Nb2.9Si11.5B8 (x = 1–15 at%) were developed and studied. Effects of annealing on the soft magnetic properties, crystallization behavior, and domain structure were investigated. The alloys with higher Ni content were prone to exhibit stronger magnetic anisotropy. The Fe66.8Co10Ni10Cu0.8Nb2.9Si11.5B8 alloy exhibited excellent soft magnetic properties, including the low permeability of 2000, low coercivity of about 0.6 A/m, and low remanence of 2.4 mT, together with a temperature gap of 128 K between two crystallization onset temperatures. It has been found that the Ni content and the annealing process possess significant effects on the soft magnetic property of the nanocrystalline alloys. It shows that the developed Fe66.8Co10Ni10Cu0.8Nb2.9Si11.5B8 nanocrystalline alloy exhibits great potentials for applying in the field of common mode chokes or current transformers, due to its ability to resist the direct current.
Introduction
FINEMET-type FeCuNbSiB nanocrystalline alloys exhibit excellent comprehensive soft magnetic properties including high saturation magnetic induction Bs, high permeability μ, and low core loss P (Yoshizawa et al., 1988a). Furthermore, since FINEMET-type FeCuNbSiB nanocrystalline alloys can be easily prepared in air at low cost, they are widely used in electronic fields such as high-frequency power transformers, common mode chokes, magnetic amplifiers, and current transformers (Yoshizawa et al., 1988b; Petzold, 2002; Hasegawa, 2004; Herzer et al., 2005; Hasegawa, 2006; Herzer, 2013). Nowadays, the devices used in electronic and information fields, however, are prone to higher power and higher frequency. Then, it is necessary to develop soft magnetic materials with better permeability properties in high-frequency range and good DC resistance ability.
It is known that the performance of permeability vs. frequency in high-frequency regions could be enhanced by a large anisotropy constant Ku when the coercivity property does not deteriorate. This results in the decreases in permeability attenuation with frequency. This characteristic makes the design of the LCR rectifier circuit become easier when the material is processed into an inductor. The anisotropy constant Ku could be evaluated by Herzer et al. (2011)
where Hk is the magnetic anisotropy field and Js is the saturation magnetic polarization. As indicated by Eq. 1, the magnetic anisotropy constant Ku can be improved by increasing Js. Nevertheless, despite there being myriad works focusing on developing materials with high saturation magnetic polarization (Makino et al., 1995; Ohta and Yoshizawa, 2007; Makino et al., 2009; Kubota et al., 2011; Urata et al., 2011; Chen et al., 2013; Li et al., 2014; Li et al., 2015; Shi and Yao, 2020; Shi et al., 2021), few of these materials can meet the requirements of industrial mass production. Moreover, the increase in magnetic anisotropy constant Ku is very limited.
For FINEMET-type alloys, the magnetic field-induced anisotropy is very weak (Herzer, 1994a). However, it was found that the creep could induce the anisotropy in FINEMET-type alloys (Herzer, 1994b). It shows a Ku value as large as 1,000 J/m3 can be achieved after the FINEMET-type alloys are annealed with a 100-MPa tensile stress applied along the ribbon axis. However, due to the low productivity, inducing anisotropy via creep is impractical for industrial production.
For nanocrystalline alloys processed by magnetic field annealing, adding other ferromagnetic elements such as Co and Ni is considered to be conducive to the induction of in-plane anisotropy (Fujimori et al., 1977; Ohnuma et al., 2003; Yoshizawa et al., 2003). However, the crystallization process would be significantly influenced after the addition/replacement of Co and Ni to Fe-based amorphous alloys (Agudo and Vázquez, 2005). The increment of the Ni content leads to the rise of the second crystallization peak temperature of the amorphous alloy rise, resulting in the deterioration of the thermal stability and soft magnetic property of the alloy. Then, understanding the factors affecting the crystallization behavior and soft magnetic property of the nanocrystalline alloy is important.
Here, effects of Ni addition and annealing process on the structure and properties of FeCoNiCuNbSiB soft magnetic alloys were investigated, and an Fe66.8Co10Ni10Cu0.8Nb2.9Si11.5B8 nanocrystalline alloy with good soft magnetic property and large resistance to direct current in the high-frequency region was obtained.
Experimental Procedure
Alloy ingots with a nominal composition of Fe66.8-xCo10NixCu0.8Nb2.9Si11.5B8 (x = 1, 5, 10, 15 at%) were prepared by induction melting in a high-vacuum condition. The raw materials were industrial-purity metals of Fe (99.9 mass%), Co (99.9 mass%), Ni (99.9 mass%), Cu (99.9 mass%), Si (99.9 mass%), pre-alloyed Nb-Fe (99.7 mass%), and Fe-B (99.7 mass%). The amorphous ribbons were manufactured by the single-roll rapid solidification method. The ribbon width is 30 mm, and thickness is 22 μm. The ribbons were slit to 6 mm in width. Toroidal cores with the outer diameter of 29 mm and inner diameter of 21 mm were wounded by these slit ribbons then. These cores were annealed at different temperatures in a furnace with 2 L/min flowing argon; meanwhile, a 400-Oe transverse magnetic field was applied. The transverse field means the direction is parallel to the axis of rotation.
The microstructure of as-cast and annealed ribbons was analyzed by X-ray diffractometry (XRD, Bruker D8 Advance) with Cu K radiation (λ = 0.15406 nm). The thermodynamic characteristics of the ribbons were analyzed by the differential scanning calorimeter (DSC, NETZSCH 404C) at a heating rate of 10 K/min under high-purity argon flow. The B-H loops were measured by a static magnetic property analyzer (MATS-2010SD). The core loss property of the cores was analyzed by the IWATSU B-H Analyzer. The test frequency range was 10–100 kHz, sinusoidal type. The maximum flux density values were 100, 200, and 300 mT, respectively. Images of the magnetic domain structures for samples with different compositions were captured using the magneto-optical Kerr microscope (Zeiss A × 10). All measurements were performed at room temperature.
Results and Discussion
The XRD patterns of the as-cast Fe66.8-xCo10NixCu0.8Nb2.9Si11.5B8 (x = 1, 5, 10, 15 at%) ribbons are shown in Figure 1. Except for the broad peak corresponding to the amorphous phase, no crystallization peak can be found in the XRD patterns, indicating that the microstructure of the as-cast ribbons is amorphous.
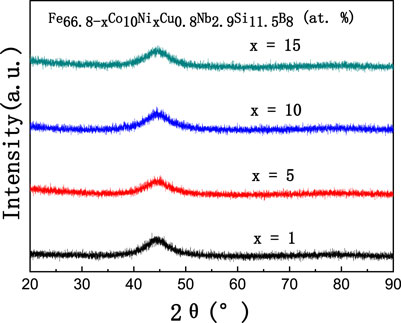
FIGURE 1. XRD patterns of the as-cast Fe66.8-xCo10NixCu0.8Nb2.9Si11.5B8 (x = 1, 5, 10, 15 at%) ribbons.
The DSC curves of the as-cast Fe66.8-xCo10NixCu0.8Nb2.9Si11.5B8 (x = 1, 5, 10, 15 at%) ribbons are shown in Figure 2. The first and second crystallization onset temperature Tx1 and Tx2 and the first and second crystallization peak temperature T1 and T2 are indicated by arrows on the curves. We can find three distinguishing characteristics in the DSC curves. Firstly, T2 decreases gradually with the increase in Ni content, while T1 stays almost unchanged. The temperature gap ΔTx (Tx2-Tx1) shrinks down from 165 to 119 K with the increase in Ni content. However, the interval ΔTx for the alloys with x = 5, 10, 15 are almost the same. This value agrees to the previous work by Agudo in Ref. (Agudo and Vázquez, 2005). Secondly, there is an exothermic-peak-like region between Tx1 and Tx2 at about 828 K for the alloys with x = 10, 15%; this region is considered to be an overlap of the two stages of crystallization. It means that the alloys of Fe56.8Co10Ni10Cu0.8Nb2.9Si11.5B8 and Fe51.8Co10Ni15Cu0.8Nb2.9Si11.5B8 tend to get into the second crystallization process much more easily. Also, the stability of the first-stage crystallization phase is weaker. This might be the reason for the ΔTx of the 10% Ni alloy being a little larger than 5% Ni alloy. Values of Tx1, Tx2, T1, T2, and ΔTx of the as-cast Fe66.8-xCo10NixCu0.8Nb2.9Si11.5B8 alloys are summarized in Table 1.
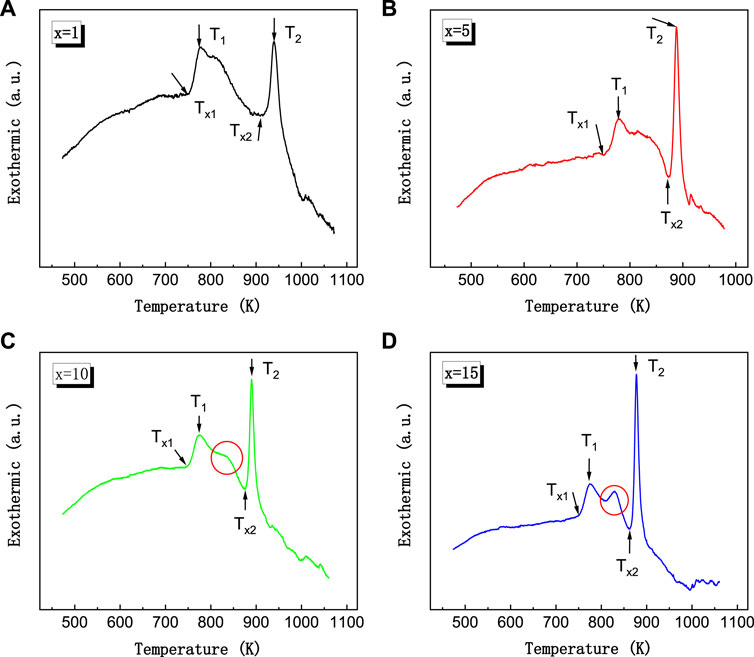
FIGURE 2. DSC curves of the as-cast Fe66.8-xCo10NixCu0.8Nb2.9Si11.5B8 (x = 1, 5, 10, 15 at%) ribbons at a heating speed of 10 K/min, (A) x = 1 alloy, (B) x = 5 alloy, (C) x = 10 alloy, (D) x = 15 alloy.
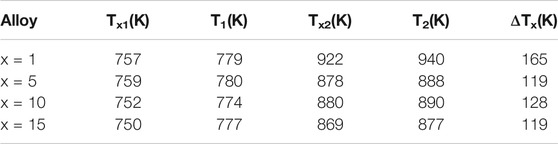
TABLE 1. Thermodynamic data of as-cast Fe66.8-xCo10NixCu0.8Nb2.9Si11.5B8 (x = 1, 5, 10, 15 at%) alloy ribbons.
The cores were annealed at 838 K with transverse magnetic field for 15, 30, and 45 min, respectively. The B–H loops of the cores are shown in Figure 3. The hysteresis loops of the annealed alloys show good linearity. With the increment of Ni content, the anisotropic field Hk rises from 200 to 380 A/m. The values of the magnetic anisotropy constant Ku can be obtained from Eq. 1. During the calculation of Ku, Js was estimated using the values of B800 (B800 denotes the magnetic induction intensity of alloys under an applied magnetic field of 800 A/m), and the B800 values are 1.26, 1.15, 1.11, and 1.04 T for the alloys of Ni = 1%, Ni = 5%, Ni = 10%, and Ni = 15%, respectively. When the Ni content increases to 15%, the alloy exhibits a lower permeability and larger magnetic anisotropy field Hk. However, the coercivity of the alloy is significantly increased, and the linearity of the hysteresis loop gets worse. The coercivity (Hc), remanence (Br), initial permeability (μi), and anisotropy constant (Ku) properties are shown in Table 2. With the prolongation of annealing time, the permeability of the alloy gradually decreases. The strength of the magnetic anisotropy field becomes stronger. Moreover, the ability to resist the external magnetic field is enhanced. The Hc and Br for the Fe65.8Co10Ni1Cu0.8Nb2.9Si11.5B8 alloy decrease with the increasing annealing time. The Hc and Br of Fe61.8Co10Ni5Cu0.8Nb2.9Si11.5B8 alloy increase firstly and then get smaller with the increase in heat treatment time. Hc and Br increase definitely with the heat treatment time when the Ni content is high (x = 10, 15%). When the Ni content reaches 15%, the coercive Hc and the remanence Br increase greatly. When the heat treatment time increased from 15 to 45 min, Hc and Br increased from 15.81 A/m and 28 mT to 163.8 A/m and 330 mT, respectively. With the increase in Ni content, the relative initial permeability μi decreases and the magnetic anisotropy Ku is enhanced.
FIGURE 3. B–H loops of Fe66.8-xCo10NixCu0.8Nb2.9Si11.5B8 (x = 1, 5, 10, 15 at%) cores annealed at 838 K for. (A) 15 min, (B) 30 min, and (C) 45 min.
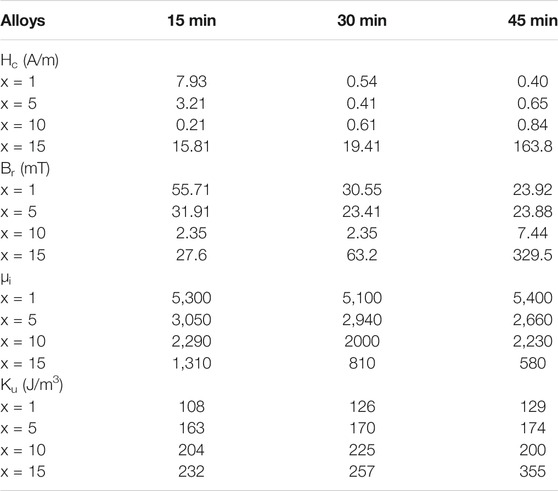
TABLE 2. Magnetic properties of Fe66.8-xCo10NixCu0.8Nb2.9Si11.5B8 (x = 1, 5, 10, 15 at%) alloy cores.
The XRD patterns of Fe66.8-xCo10NixCu0.8Nb2.9Si11.5B8 (x = 1, 5, 10, 15 at%) alloy ribbons which annealed at 838 K for 30 min are shown in Figure 4. The grain size of the crystalline phase was estimated using the Scherrer formula as follows (Scherrer, 1918),
where D is the grain size, K is the Scherrer constant (∼0.89), λ is the wavelength of the X-ray, β is the full width at half maximum (FWHM) of the diffraction peak, and θ is the Bragg angle. The crystallized volume fraction phase can be estimated by using the following equation (Langford, 1978; Verdon et al., 1998; Zhang et al., 1998; Cerqueira et al., 2000; Aronin et al., 2010):
where Vcr is the crystallized volume fraction, and Icr and Iam denote the integrated peak intensities of the crystalline and amorphous phases, respectively.
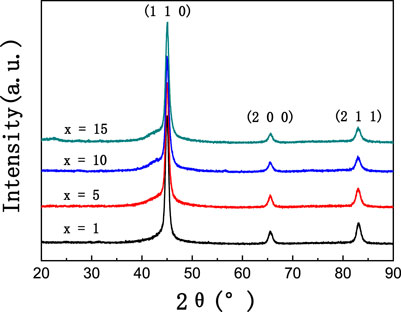
FIGURE 4. XRD patterns of Fe66.8-xCo10NixCu0.8Nb2.9Si11.5B8 (x = 1, 5, 10, 15 at%) ribbons annealed at 838 K for 30 min.
According to the XRD patterns, the first crystallization process of the Fe66.8-xCo10NixCu0.8Nb2.9Si11.5B8 (x = 1, 5, 10, 15 at%) samples is characterized by the precipitation of α-Fe and some α-Fe3Si crystalline phase. Additionally, Co and Ni atoms partially substitute the crystallographic positions of Fe atoms in the precipitated crystalline phases, leading to the formation of α-(Fe, Ni), α-(Fe, Co), and α-(Fe, Co, Ni)3Si phases with a bcc structure. Although there is an overlap area between the two crystallization temperatures at about 833 K, there is no other phase but bcc. Maybe the content of the possibly existing phase is very small that we cannot find it through XRD results. The crystallized volume fraction is about 25%, and the grain size is about 11–15 nm. The main diffraction peak positions (2θ) in XRD patterns for the Fe66.8-xCo10NixCu0.8Nb2.9Si11.5B8 (x = 1, 5, 10, 15 at%) alloys are 44.92°, 44.94°, 45.03°, and 45.00°, respectively. The main diffraction peak positions (2θ) and lattice constants for the α-Fe, α-Fe3Si, α-(Fe,Ni), and α-(Fe, Co) phases are 44.673°, 45.186°, 44.645°, 44.827°, and 2.8664, 2.841, 2.8681, and 2.8570 Å, respectively. As the Ni content increases in the Fe66.8-xCo10NixCu0.8Nb2.9Si11.5B8 alloys, the solubility of Ni and Si in the crystalline phases increases during the crystallization process, causing severer lattice distortion. During the amorphous-to-crystalline transformation process, a proportion of energy is consumed to compensate for the elevated lattice distortion energy, so the crystallization enthalpy of the first crystallization stage declines.
Based on the random anisotropy model (Herzer, 1989), the magnetic anisotropy is mainly determined by the grain size (D) and the crystallized volume fraction (χ). Specifically, magnetic anisotropy is positively correlated with grain size. The corresponding quantitative correlation can be expressed as below:
where ⟨K⟩ is the effective anisotropy constant, K1 is the magnetic anisotropy constant, and L0 denotes the exchange length. The coercivity Hc and initial permeability μi can be expressed as the following equations:
where Pc is a dimensionless constant, Js is the saturation magnetic polarization of the material, and μ0 is the vacuum permeability. The rise in Hc of soft magnetic alloys is mainly due to the increment in grain size.
The XRD patterns of the x = 15 alloy ribbons annealed at 838 K for 15, 30, and 45 min are shown in Figure 5. The crystallized volume fractions of the samples shown in Figure 5 are all about 25%, while the corresponding grain size is 11–15 nm. The crystalline phases are consistent with the previous analysis. So, the reason for the sharp increase in Hc of the alloy annealed for 45 min is not caused by the increase in grain size. The diffraction peak positions and the lattice constant of the ribbons which were annealed for 15, 30, and 45 min are 44.980°, 45.000°, and 44.960° and 2.8478, 2.8466, and 2.8490 Å, respectively. Therefore, the drastic increase in coercivity is not caused by the difference in the degree of lattice distortion, either.

FIGURE 5. XRD patterns of Fe51.8Co10Ni15Cu0.8Nb2.9Si11.5B8 alloy ribbons annealed at 838 K for 15, 30, and 45 min.
The theory proposed by Luborsky (Luborsky et al., 1976) suggests that the origin of the induced anisotropy Ku in the amorphous alloys is the atomic pairing orientation, which is the same as that of the crystalline material. Since the crystallization process is a thermal activation process, the coupling orientation of (Fe, Ni) atoms would be enhanced as the annealing time increases. The magnetic anisotropy was enhanced then. The rise in Hc could be ascribed to the enhanced magnetic anisotropy or the change in magnetic domain structure after the enhancement magnetic anisotropy.
The permeability-vs.-frequency curves of Fe66.8-xCo10NixCu0.8Nb2.9Si11.5B8 (x = 1, 5, 10, 15 at%) alloy cores which were annealed at 838 K for 30 min are shown in Figure 6. With the increase in Ni content, the initial permeability of the alloy becomes lower and the magnetic anisotropy is enhanced. The decay of relative initial magnetic permeability became slower with the increase in frequency. The permeability of the alloy with a Ni content of 10% is about 2,000, and the magnetic field induced Ku is about 225 J/m3. The permeability attenuation of these alloys was 47.8%, 35.2%, 19.2%, and 10.2% from 10 to 1,000 kHz for the alloy with Ni content of 1%, 5%, 10%, and 15%, respectively. These results agree with the previous work by Ohnuma in Ref. (Herzer, 1994b) that, with the increase of Ku, the alloy exhibits more excellent permeability-vs.-frequency characteristics in the high-frequency band.
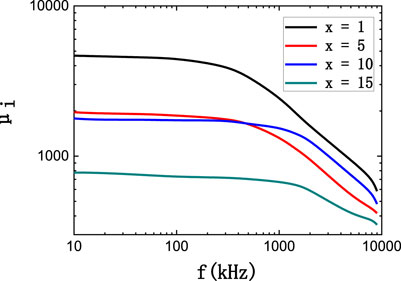
FIGURE 6. The permeability–frequency curves of Fe66.8-xCo10NixCu0.8Nb2.9Si11.5B8 (x = 1, 5, 10, 15 at%) alloy cores.
The domain structures of Fe66.8-xCo10NixCu0.8Nb2.9Si11.5B8 (x = 1, 5, 10, 15 at%) alloy ribbons annealed at 838 K for 30 min are shown in Figure 7. The double arrow line in Figure 7 denotes the width direction of the ribbon, which is parallel to the direction of the transverse magnetic field during annealing. The single arrow line is parallel to the orientation of the polarized light in the magneto-optical Kerr microscope. The light-colored magnetic domains are oriented in the same direction as the polarized light, while the dark magnetic domains are in the opposite direction of the polarized light. It can be concluded from the figure that the size of the magnetic domain decreases when the magnetic anisotropy intensity becomes stronger with the increase in the Ni content. The parallelism between the magnetic domain and the direction of the applied magnetic field becomes stronger. The local magnetic domain structure becomes more uniformly distributed. From the perspective of technical magnetization, the magnetic domain structure inside the material because the sum of the different energies tends to be minimized. Moreover, the corresponding energies can be categorized as the exchange energy, the magneto-elastic energy, the magneto-crystalline anisotropy, the demagnetizing field energy, and the applied magnetic field energy. This result agrees with the work by Herzer (Herzer et al., 2011) that combines the domain structure and creep-induced Ku.
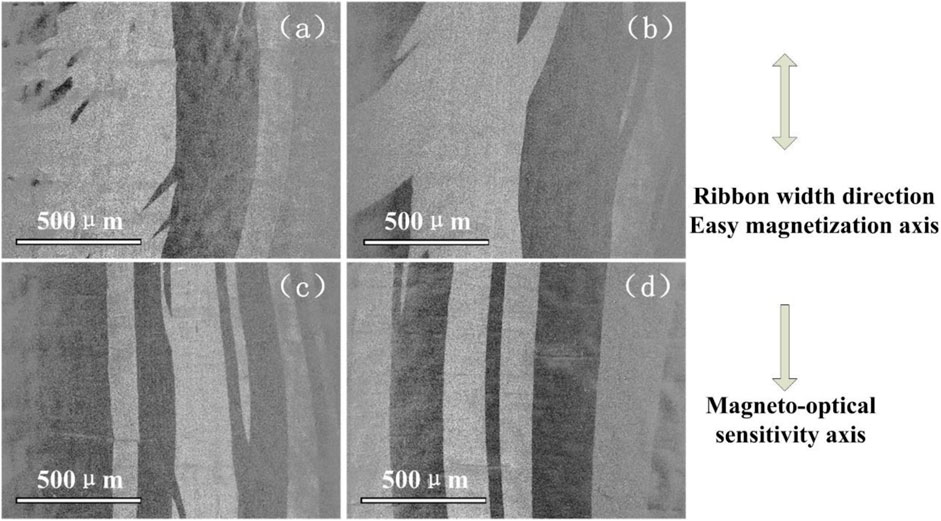
FIGURE 7. (A) alloy of x = 1%; (B) alloy of x = 5%; (C) alloy of x = 10%; (D) alloy of x = 15%.
The changing process of x = 10% alloy’s domain structure during the whole magnetization process is shown in Figure 8. The direction distribution and test method of the magnetic domain structure photo are the same as those in Figure 7. The magnetic domain structure in each magnetized state is shown in the photograph indicated by the arrow in the figure. The magnetic domain of the alloy ribbon is fine 90° structure, and the whole magnetization process is basically a reversible movement of the domain walls. According to the magnetization theory of soft magnetic materials, the magnetization process can be separated into five steps (Tahara and Sugeno, 1973; Iványi, 1997). First is the initial magnetization (μi), or the so-called linear magnetization region, where B varies linearly with H. Second is the Rayleigh region, where the magnetization process is no longer linear. Third is the maximum permeability region, where B increases sharply with H. Fourth is the near saturation region. Fifth is the paramagnetic region. In the magnetization process of Fe61.8Co10Ni5Cu0.8Nb2.9Si11.5B8 and Fe56.8Co10Ni10Cu0.8Nb2.9Si11.5B8 alloy ribbons, the first region is very big, and the second to fourth regions become very small. So, the magnetization process is kept linear until saturation.
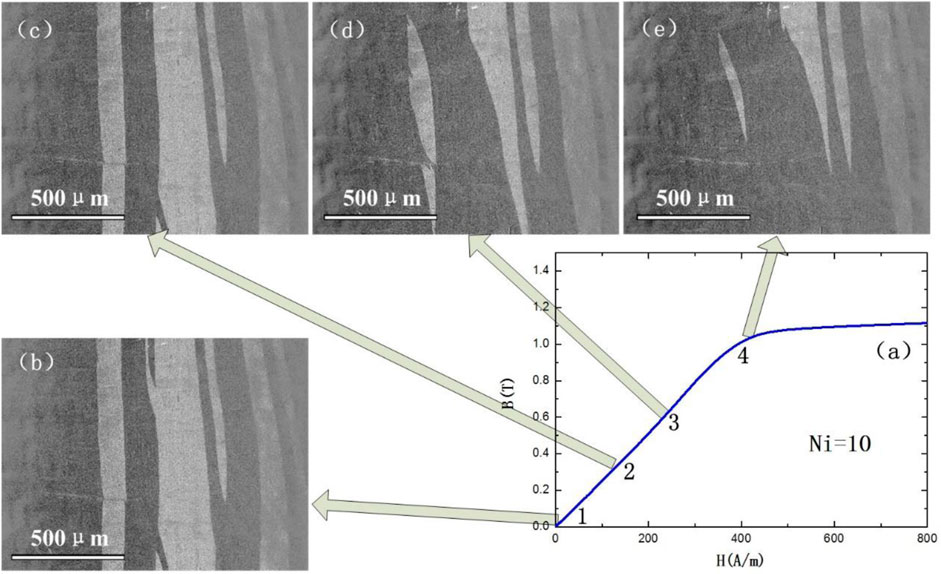
FIGURE 8. Changes of the domain structure during the magnetization of Fe56.8Co10Ni10Cu0.8Nb2.9Si11.5B8 alloy ribbon which was annealed at 838 K for 30 min. (A) Magnetization curve, (B) magnetization state 1, (C) magnetization state 2, (D) magnetization state 3, and (E) magnetization state 4.
For the Fe51.8Co10Ni15Cu0.8Nb2.9Si11.5B8 alloy ribbon, more Ni elements may be entrapped in the α-(Fe) and α-(Fe)3Si crystallization phases to replace the Fe atom position during the heat treatment. It will result in a more serious lattice distortion, so the energy of the alloy system increases. In addition, the addition of the Ni element increases the number of magnetic interaction (Fe, Ni) atom pairs in the alloy and enhances the magnetic anisotropy. In order to reduce the energy of the alloy, the magnetic field size of the soft magnetic alloy becomes smaller. This makes the B–H loop of the alloy with strong magnetic anisotropy show poor linearity, and its coercivity and remanence are larger.
Since the soft magnetic properties of the Fe51.8Co10Ni15Cu0.8Nb2.9Si11.5B8 alloy are very poor, some further heat treatment was applied to the cores. The deterioration of the coercivity property was originated in the distortion of the lattice. It was assumed that the distortion could be reduced by the decrease in the crystallization degree. We chose a temperature that is higher than the crystallization temperature and definitely lower than the overlap region. Moreover, some other temperatures that are lower than the crystallization temperature were set. The heat treatment temperatures were 783, 683, and 643 K then, and the heat treatment time was 15 min. The heat treatment was finished when the furnace was cooled to 473 K, and the transverse magnetic field of 400 Oe was applied. The XRD patterns of the Fe51.8Co10Ni15Cu0.8Nb2.9Si11.5B8 alloy ribbons after heat treatment are shown in Figure 9. The crystallization temperature of the alloy is 750 K, and the first crystallization peak temperature is 777 K. Some α-Fe-crystallized phases were formed after the heat treatment at 783 K for 15 min. After calculation, the crystallization ratio is less than 5%. Both 683 and 643 K were subjected to stress relief annealing, and the alloy ribbons possess a typical amorphous structure after heat treatment.
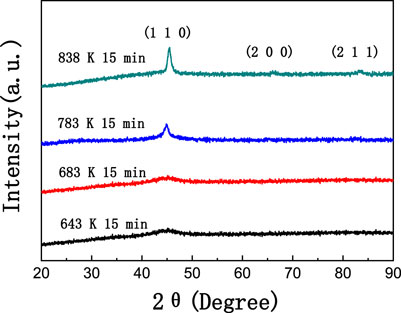
FIGURE 9. XRD patterns of Fe51.8Co10Ni15Cu0.8Nb2.9Si11.5B8 alloy ribbons annealed at 643, 683, 783, and 838 K for 15 min.
The B–H loops of these Fe51.8Co10Ni15Cu0.8Nb2.9Si11.5B8 alloy are shown in Figure 10. The μi, Hc, and Br properties are listed in Table 3. With the increase in heat treatment temperature, the linearity of the B–H loop gradually increased; meanwhile, the remanence and coercivity decreased. When the heat treatment temperature rises from 643 to 783, the coercivity of the alloy decreases from 7.29 to 3.63 A/m, and the remanence is reduced from 250.9 to 12.2 mT. However, when the heat treatment temperature increased to 838 K, the coercivity of the alloy increased to 15.81 A/m, and remanence increased to 27.6 mT. It seems that the trace crystallization is beneficial to obtain excellent soft magnetic properties for the Fe-based alloy with high content of Ni. To obtain better soft magnetic properties, it can be summarized as the following: the higher the Ni content, the lower the heat treatment temperature required.
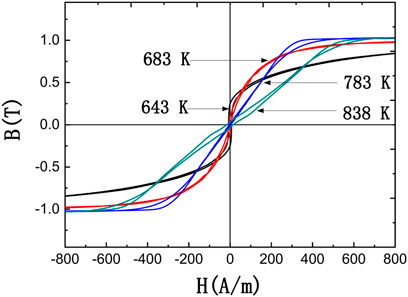
FIGURE 10. B–H loops of Fe66.8-xCo10NixCu0.8Nb2.9Si11.5B8 (x = 15 at%) cores annealed at 643, 683, 783, and 838 K for 15 min.
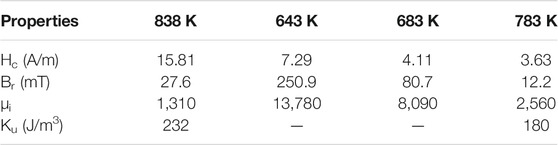
TABLE 3. Properties of the different temperature-annealed Fe51.8Co10Ni15Cu0.8Nb2.9Si11.5B8 alloy.
Summary
The crystallization behavior, microstructure, soft magnetic properties, and domain structure for Fe66.8-xCo10NixCu0.8Nb2.9Si11.5B8 alloys with the Ni content ranging from x = 1 to x = 15 have been systemically studied, and results are summarized as follows:
1. The increment of the Ni content results in the decline of the crystallization temperature of the secondary crystallization phase and decreases the thermal stability of the α-Fe phase. The temperature interval between the two crystallization processes is drastically reduced from 165 to 119 K when the Ni content increases from x = 1 to x = 15.
2. With the increase in Ni content, the magnetic anisotropy of the alloy is enhanced. However, when the Ni content is ≥15%, the coercivity and remanence properties of the alloy deteriorate sharply. The low coercivity and remanence properties can be obtained by reducing the heat treatment temperature, and the B–H loop linearity of the alloy is improved.
3. A large magnetic field-induced Ku of 225 J/m3 can be obtained through optimized annealing, and the Fe56.8Co10Ni10Cu0.8Nb2.9Si11.5B8 nanocrystalline alloy exhibits a linear B–H loop and its initial permeability μi is as low as 2,000. It makes the alloy a promising material in the field of common mode chokes or current transformers, where the ability to resist the direct current is necessary.
Data availability statement
The original contributions presented in the study are included in the article/Supplementary Material; further inquiries can be directed to the corresponding author.
Author contributions
ZL, the first person to complete the thesis work. KY, provided ideas for this work and finished the thesis together. TL, provided materials to finish the experimental works. XL, participated the testing work. SW, provided suggestions for the completion of the thesis.
Funding
This work was supported by the National Key Basic Research and Development Program (Grant No. 2016YFB0300502), National Natural Science Foundation of China (11875270), and Youth Innovation Promotion Association CAS (2018015).
Conflict of Interest
TL was employed by the company China Iron and Steel Research Institute Group, Advanced Technology and Materials Co., Ltd.
The remaining authors declare that the research was conducted in the absence of any commercial or financial relationships that could be construed as a potential conflict of interest.
Publisher’s Note
All claims expressed in this article are solely those of the authors and do not necessarily represent those of their affiliated organizations, or those of the publisher, the editors, and the reviewers. Any product that may be evaluated in this article, or claim that may be made by its manufacturer, is not guaranteed or endorsed by the publisher.
References
Agudo, P., and Vázquez, M. (2005). Influence of Ni on the Structural and Magnetic Properties of NixFe73.5−xSi13.5B9Nb3Cu1 (0⩽x⩽25) Alloys. J. Appl. Phys. 97, 023901. doi:10.1063/1.1825633
Aronin, A., Abrosimova, G., Matveev, D., and Rybchenko, O. (2010). Structure and Properties of Nanocrystalline. Rev. Adv. Mater. Sci. 25, 52–57.
Cerqueira, M. F., Ferreira, J. A., and Adriaenssens, G. J. (2000). Structural Studies and Influence of the Structure on the Electrical and Optical Properties of Microcrystalline Silicon Thin Films Produced by RF Sputtering. Thin Solid Films 370, 128–136. doi:10.1016/s0040-6090(00)00950-0
Chen, F. G., Wang, Y. G., Miao, X. F., Hong, H., and Bi, K. (2013). Nanocrystalline Fe83P16Cu1 Soft Magnetic alloy Produced by Crystallization of its Amorphous Precursor. J. Alloys Compd. 549, 26–29. doi:10.1016/j.jallcom.2012.09.072
Fujimori, H., Morita, H., Obi, Y., and Ohta, S. (1977). “On the Magnetically Induced Anisotropy in Amorphous Ferromagnetic Alloys,” in Amorphous Magnetism II. Editors R. A. Levy, and R. Hasegawa (New York: Prenum), 393–402. doi:10.1007/978-1-4613-4178-9_37
Hasegawa, R. (2006). Advances in Amorphous and Nanocrystalline Magnetic Materials. J. Magn. Magn. Mater. 304, 187–191. doi:10.1016/j.jmmm.2006.02.119
Hasegawa, R. (2004). Applications of Amorphous Magnetic Alloys. Mater. Sci. Eng. A. 375, 90–97. doi:10.1016/j.msea.2003.10.258
Herzer, G., Budinsky, V., and Polak, C. (2011). Magnetic Properties of FeCuNbSiB Nanocrystallized by Flash Annealing under High Tensile Stress. Phys. Status Solidi B 248, 2382–2388. doi:10.1002/pssb.201147088
Herzer, G. (1994). Creep Induced Magnetic Anisotropy in Nanocrystalline Fe-Cu-Nb-Si-B Alloys. IEEE Trans. Magn. 30, 4800–4802. doi:10.1109/20.334226
Herzer, G. (1989). Grain Structure and Magnetism of Nanocrystalline Ferromagnets. IEEE Trans. Magn. 25, 3327–3329. doi:10.1109/20.42292
Herzer, G. (1994). Magnetic Field Induced Anisotropy in Nanocrystalline Fe Cu Nb Si B Alloys. Mater. Sci. Eng. A 181-182, 876–879. doi:10.1016/0921-5093(94)90760-9
Herzer, G. (2013). Modern Soft Magnets: Amorphous and Nanocrystalline Materials. Acta Materialia 61, 718–734. doi:10.1016/j.actamat.2012.10.040
Herzer, G., Vazquez, M., Knobel, M., Zhukov, A., Reininger, T., Davies, H. A., et al. (2005). Round Table Discussion: Present and Future Applications of Nanocrystalline Magnetic Materials. J. Magnetism Magn. Mater. 294, 252–266. doi:10.1016/j.jmmm.2005.03.042
Iványi, A. (1997). Hysteresis Models in Electromagnetic Computation. Budapest, Hungary: University of Pécs, Book, Akadémiai Kiadó.
Kubota, T., Makino, A., and Inoue, A. (2011). Low Core Loss of Fe85Si2B8P4Cu1 Nanocrystalline Alloys with High Bs and B800. J. Alloys Compd. 509, S416–S419. doi:10.1016/j.jallcom.2010.11.012
Langford, J. I. (1978). A Rapid Method for Analysing the Breadths of Diffraction and Spectral Lines Using the Voigt Function. J. Appl. Cryst. 11, 10–14. doi:10.1107/s0021889878012601
Li, J.-F., Liu, X., Zhao, S.-F., Ding, H.-Y., and Yao, K.-F. (2015). Fe-based Bulk Amorphous Alloys with Iron Contents as High as 82at%. J. Magnetism Magn. Mater. 386, 107–110. doi:10.1016/j.jmmm.2015.03.070
Li, Z., Wang, A., Chang, C., Wang, Y., Dong, B., and Zhou, S. (2014). Synthesis of FeSiBPNbCu Nanocrystalline Soft-Magnetic Alloys with High Saturation Magnetization. J. Alloys Compd. 611, 197–201. doi:10.1016/j.jallcom.2014.04.223
Luborsky, F. E., Becker, J. J., Lander, G. H., and Rhyne, J. J. (1976). "Kinetics of reorientation of magnetically induced anisotropy in amorphous Ni40Fe40P14B6," in AIP Conference Proceedings 29, 209–210. doi:10.1063/1.30588
Makino, A., He Men, H., Kubota, T., Yubuta, K., and Inoue, A. (2009). New Excellent Soft Magnetic FeSiBPCu Nanocrystallized Alloys with High $B_{s}$ of 1.9 T from Nanohetero-Amorphous Phase. IEEE Trans. Magn. 45, 4302–4305. doi:10.1109/tmag.2009.2023862
Makino, A., Inoue, A., and Masumoto, T. (1995). Soft Magnetic Properties of Nanocrystalline Fe M B(M Zr, Hf, Nb) Alloys with High Magnetization. Nanostructured Mater. 6, 985–988. doi:10.1016/0965-9773(95)00226-x
Ohnuma, M., Ping, D. H., Abe, T., Onodera, H., Hono, K., and Yoshizawa, Y. (2003). Optimization of the Microstructure and Properties of Co-substituted Fe-Si-B-Nb-Cu Nanocrystalline Soft Magnetic Alloys. J. Appl. Phys. 93, 9186–9194. doi:10.1063/1.1569396
Ohta, M., and Yoshizawa, Y. (2007). New High-BsFe-Based Nanocrystalline Soft Magnetic Alloys. Jpn. J. Appl. Phys. 46, L477–L479. doi:10.1143/jjap.46.l477
Petzold, J. (2002). Advantages of Softmagnetic Nanocrystalline Materials for Modern Electronic Applications. J. Magnetism Magn. Mater. 242-245, 84–89. doi:10.1016/s0304-8853(01)01206-9
Scherrer, P. (1918). Bestimmung der Größe und der inneren Struktur von Kolloidteilchen mittels Röntgenstrahlen. Nachr. Ges. Wiss. Goettingen, Math.-Phys. Kl. 26, 98.
Shi, L., Hu, X., Li, Y., Yuan, G., and Yao, K. (2021). The Complementary Effects of Fe and Metalloids on the Saturation Magnetization of Fe-Based Amorphous Alloys. Intermetallics 131, 107116. doi:10.1016/j.intermet.2021.107116
Shi, L., and Yao, K. (2020). Composition Design for Fe-Based Soft Magnetic Amorphous and Nanocrystalline Alloys with High Fe Content. Mater. Des. 189, 108511. doi:10.1016/j.matdes.2020.108511
Tahara, Y., and Sugeno, T. (1973). A Theory of Magnetic After-Effect for the Irreversible Magnetization Process in Rayleigh Region. Phys. Stat. Sol. (B) 55, 385–398. doi:10.1002/pssb.2220550140
Urata, A., Matsumoto, H., Yoshida, S., and Makino, A. (2011). Fe-B-P-Cu Nanocrystalline Soft Magnetic Alloys with High Bs. J. Alloys Compd. 509, S431–S433. doi:10.1016/j.jallcom.2010.12.104
Verdon, C., Karimi, A., and Martin, J.-L. (1998). A Study of High Velocity Oxy-Fuel Thermally Sprayed Tungsten Carbide Based Coatings. Part 1: Microstructures. Mater. Sci. Eng. A 246, 11–24. doi:10.1016/s0921-5093(97)00759-4
Yoshizawa, Y., Fujii, S., Ping, D. H., Ohnuma, M., and Hono, K. (2003). Magnetic Properties of Nanocrystalline FeMCuNbSiB Alloys (M: Co, Ni). Scripta Materialia 48, 863–868. doi:10.1016/s1359-6462(02)00611-5
Yoshizawa, Y., Oguma, S., and Yamauchi, K. (1988). New Fe‐based Soft Magnetic Alloys Composed of Ultrafine Grain Structure. J. Appl. Phys. 64, 6044–6046. doi:10.1063/1.342149
Yoshizawa, Y., Yamauchi, K., Yamane, T., and Sugihara, H. (1988). Common Mode Choke Cores Using the New Fe‐based Alloys Composed of Ultrafine Grain Structure. J. Appl. Phys. 64, 6047–6049. doi:10.1063/1.342150
Keywords: nanocrystallization, annealing, microstructure, soft magnetic properties, magnetic domain
Citation: Li Z, Yao KF, Liu TC, Li X and Wang S (2022) Effect of Annealing on the Magnetic Properties of FeCoNiCuNbSiB Soft Magnetic Alloys. Front. Mater. 8:805609. doi: 10.3389/fmats.2021.805609
Received: 30 October 2021; Accepted: 19 November 2021;
Published: 05 January 2022.
Edited by:
Jiang Ma, Shenzhen University, ChinaCopyright © 2022 Li, Yao, Liu, Li and Wang. This is an open-access article distributed under the terms of the Creative Commons Attribution License (CC BY). The use, distribution or reproduction in other forums is permitted, provided the original author(s) and the copyright owner(s) are credited and that the original publication in this journal is cited, in accordance with accepted academic practice. No use, distribution or reproduction is permitted which does not comply with these terms.
*Correspondence: Z. Li, bHpfa2V2aW5AMTYzLmNvbQ==; K. F. Yao, a2Z5YW9AdHNpbmdodWEuZWR1LmNu