 Xiaoqi Yue
 Luyao Huang
 Zhihao Qu
 Zhile Yang
 Lei Zhang
 Yong Hua
95% of researchers rate our articles as excellent or good
Learn more about the work of our research integrity team to safeguard the quality of each article we publish.
Find out more
ORIGINAL RESEARCH article
Front. Mater. , 28 January 2022
Sec. Environmental Degradation of Materials
Volume 8 - 2021 | https://doi.org/10.3389/fmats.2021.802136
This article is part of the Research Topic Spotlight on China - Materials Science View all 14 articles
The formation and evolution of the corrosion scales on the super 13Cr stainless steel (SS) surface after exposure in a formate completion fluid with the presence of various aggressive substances was investigated. The results indicate that the formation of Fe3O4 covered the surface of super 13Cr SS as the inner layer accompanied with outer scattered FeS. The corrosion rate was below 0.07 mm/year after 120 h of exposure in the formate fluid at 180°C under N2 environments; the presence of aggressive substances such as sulfide and CO2 in the formate fluid promoted the proceeding of anodic dissolution in the early period, and the ingress of CO2 progressively increased the general corrosion rate to 1.7 mm/year. For CO2-containing conditions, the formation of FeCr2O4 and Cr(OH)3 was detected in the inner corrosion product layers, and the precipitation of “sheet”-shaped iron carbonate (FeCO3) was detected as the outer layer. The accumulation rate of corrosion products increases by two orders of magnitude with the ingress of CO2, corresponding to thicker corrosion products, but the dissolution rate is still three orders of magnitude higher than when CO2 was absent.
The exploitation and production of ultra-deep reservoirs for future energy supply have been highlighted as a practical strategy to achieve the effective application of fossil energy. The Tarim Basin, where exists abundant natural gas in the depth between 6,500–8,000 m, has been constructed with 52 wells in Kuqa from 2012 (Liu et al., 2019a). Due to the high pressure (115–140 MPa), high temperature (170°C–190°C), and complex corrosive medium, the corrosion issues of highly dense brine-based completion fluids on tubing and casing materials in ultra-deep high-temperature wells have become a research hot spot in the course of oil and gas exploitation (Yue et al., 2020a; Li et al., 2020; Zhao et al., 2020). The considered competition fluids are mainly the bromine salt completion fluids (KBr, ZnBr2, and CaBr2) (Liu et al., 2014; Liu et al., 2019b) and/or formate brines (NaCOOH, KCOOH, and CsCOOH) (Bungert et al., 2000; Leth-Olsen, 2004; Zhu et al., 2011b). In the past decades, one of the major issues is the localized corrosion by using bromine salts due to the presence of Br− (Hoar and Jacob, 1967; Refaey et al., 2005). Recently, formate brines with filtrate viscosity and low-water activities are more potential to be a safe option for the deep wells (the average depth >6,000 m), and also the operating temperature can be over 150°C (Howard and others, 1995; Bungert et al., 2000). Clarke states that the formate brines have many advantages during drilling and completion processes at a temperature up to 160°C, such as preventing the thermal degradation for the conventional drilling and completion fluid polymers (Clarke-Sturman and Sturla, 1988). Among formate brines, KCOOH solution has been widely used as the alternative option for such arduous conditions based on its large solubility and low corrosivity (Leth-Olsen, 2004).
Tubing materials experienced low-corrosion risk in formate brines at a high temperature of 180°C (Li et al., 2018), compared with that of immersing in the CO2-saturated formation water (Zhu et al., 2011a, 2015a; Hua et al., 2019a). However, corrosion control of the tubing material during the completion period remains an obstinate issue for corrosion engineers due to the intrinsically complicated corrosion processes, especially in the presence of sulfide impurity or CO2 ingress under such harsh environments. The sulfides were introduced as an impurity by the synthesis of KCOOH where it is inevitable to exit sulfides in the industrial-grade purification process of CO from the exhaust gas (Teng et al., 2016). The CO2 influx in annulus protection fluids will react with formate brines and form trace amounts of formic acid, which acts as a catalyst in the reactivity of formate (Bungert et al., 2000) and promotes the corrosion process on the material surface (Yang et al., 2019). Sekine et al. (Sekine and Chinda, 1984) stated that the formic acid can be corrosive with an increasing content of KCOOH in the solution due to the dissolved KCOOH increased the solution electrical conductivity. Recently, materials such as super 13%Cr martensite stainless steel (S13Cr) has been considered as a tubing and casing material for such hash conditions based on its good corrosion resistance, low cost, and excellent mechanical properties. Along with the growing understanding of the influence of aggressive substances on the corrosive of formate brines (Bungert et al., 2000; Howard et al., 2009), further study of the corrosion behavior of S13Cr immersed in the formate brines as well as the evolution of the corrosion scales on the surface is urgently pressed. It has been reported that both Fe and Cr elements in the matrix significantly contributed to the corrosion-resistant stainless steel (SS) in an acidized KCOOH solution by comparing the polarization curves between pure metal and 304 SS; Ni promotes the stability of the passive film on the surface as well as the mechanical property (Sekine and Chinda, 1984). Hakon (Leth-Olsen, 2004) found that the formation of the corrosion product scales on 13Cr SS in formate fluids did not act as an effective barrier against corrosion, showing high-corrosion rates after several weeks of exposure, and the surface was covered by nonuniformed crystalline FeCO3, especially at 180°C (Leth-Olsen and others, 2005). Although the formation of the FeCO3 layer plays a dominant role in retarding the corrosion rate, the corrosion resistance of S13Cr SS corresponds to a complicated corrosion product scales formation and evolution process, and that the amorphous/nanocrystalline inner layer provides better corrosion protection than outer FeCO3 precipitation21–25 under the ultra-deep well conditions [temperatures beyond 180°C (Zhao et al., 2018; Yue et al., 2020a, 2020b, 2020c; Zhao et al., 2021a)]. The systematic study on the formation and evolution of the corrosion product scales on the S13Cr SS surface immersed in a formate fluid under HTHP condition, especially with the presence of aggressive substances such as sulfide or CO2 is rare.
It has been reported that the formation of the corrosion products under a CO2–H2S coexistence environment was related to H2S and CO2 concentration (Banaś et al., 2007; Pessu et al., 2017; Li et al., 2021). Having acidic media such as CO2 and H2S can promote the ionic conductivity in the solution (Vedage et al., 1993; Zhao et al., 2021b). Ding et al. (2013) discovered that the anodic dissolution was accelerated by high-H2S/CO2 partial pressures where both H2S and CO2 reduced the stability of the corrosion product scales (He et al., 2009). The composition of corrosion products may vary as H2S concentration increases. The corrosion products have been reported to become more complicated (generating several FeS compounds in addition to FeCO3), indicating porous in feature and results in less corrosion protection (Vedage et al., 1993). If the pCO2/pH2S ratio is between 20 and 500, there is a possibility that the iron sulfide layer covers the surface locally, and pitting corrosion dominates degradation due to the galvanic corrosion between covered and bare surfaces, which is usually improved by adding inhibitors (Xu et al., 2018; Askari et al., 2021; Hamza et al., 2021).
This article complements the literature gaps by systematically investigating the corrosion behavior of S13Cr immersed in a formate fluid via studying the influence of sulfide or CO2 on the corrosion product kinetics. The weight-loss method is implemented to review the extent of general corrosion, and the nature and morphology of the corrosion products are identified using a combination of scanning electron microscopy (SEM), energy-dispersive X-ray spectroscopy (EDS), X-ray diffraction (XRD), and Raman spectroscopy in order to identify the role CO2 plays on the corrosion product scale composition and morphology. This article mainly discussed the corrosion risk caused by potential aggressive substances (sulfide and CO2 ingress) that may be introduced in the formate fluid as the application in the oil and gas industry and revealed the surface interaction mechanisms on the corrosion product scale of S13Cr SS at severe annulus environments.
The material used was an API-P110 grade S13Cr (UNS S41425) SS with heat-treated through normalization and tempering at 980°C and 590°C, respectively. The chemical composition (wt%) of the material is listed in Table 1. Coupon specimens for immersion tests were machined to the dimension of 30 mm × 13 mm × 3 mm. Before each test, the specimens were ground to 1,200 grit using silicon carbide paper, then rinsed with deionized water and acetone, and dried.
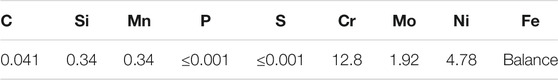
TABLE 1. Elemental composition of super 13Cr SS (wt%).
The test solutions simulated the composition of the completion fluid from the Tarim field (1.5 g/ml in density) containing potassium formate (>97.1%) and deionized water. The chemical composition is listed in Table 2. The formate completion fluid usually uses CO purified from industrial tail gas as a synthetic raw material, containing sulfide due to the existence of a certain amount of K2S in KCOOH. The solution was de-aerated by saturating with N2 (gas in 1–1) or CO2 (gas in 1–2) in a separate container overnight before testing. The dissolved oxygen was detected using optical oxygen luminescent sensors (HACH, K1100) to ensure the O2 content within the solution was below 5 ppb. All lines to the autoclave were purged with high pressure N2/CO2 and evacuated by lines 2 and 4 to remove the O2 content within the system. The prepared, de-aerated brine was carefully transferred from the sparging vessel into the closed autoclave containing the test specimens at an ambient pressure and temperature. Then, the autoclave was pressurized and stabilized at 10 bar N2 or CO2 at 25°C, respectively. The solution was heated to 180°C, and the final pressure was 26 bar under an N2 condition and 34 bar under a CO2 condition, as shown in Table 3. The immersion time for corrosion tests began once the solution temperature reached 180°C in the autoclave (Supplementary Figure S1).
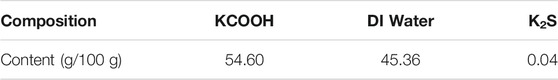
TABLE 2. Chemical composition of formation water.
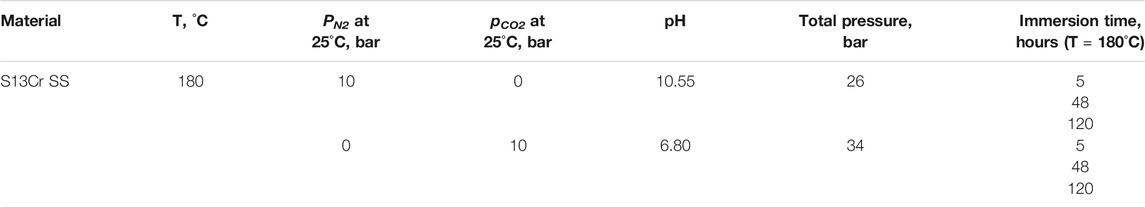
TABLE 3. Test matrix for corrosion tests under different conditions.
A 316L SS static autoclave was utilized to conduct all the weight loss tests as schematically shown in Figure 1. For mass loss experiments, three coupons were mounted on a designed PEEK holder and fully immersed in the test solution. All tests were performed at 180°C with an N2 or CO2 partial pressure of 10 bar at 25°C, and the volume to surface ratio was kept at approximately 30 ml/cm2 (three samples within the autoclave).

FIGURE 1. Schematic diagram of the high-temperature and high-pressure autoclave and the location of mass loss samples.
The original weight (m0) of coupons was measured before the test, while the final weight (m1) was obtained after the removal of corrosion products (ASTM G1-03 standard) (Metals, 2011). The corrosion rate (CR) was reported in mm/year according to the obtained weight loss via Eq. 1:
where t represents the immersion time in hours,
The thermodynamically stable states for S13Cr SS were evaluated by the Pourbaix diagram using OLI software(4). The equilibrium of the aqueous and vapor phase was calculated using Stream Analyzer. Custom was selected as the type of calculation, and the volume of the total inflow was fixed. For thermodynamic calculation, the calculated stream was used in the Corrosion Analyzer. An alloy containing 12% Cr and 88% Fe was selected as the contact surface. In order to determine the total metal cation concentration, metal activities were changed, and the thermodynamics after the mass loss was calculated by iterating over Stream Analyzer.
The coupons after immersion tests were scanned using a scanning electron microscope equipped with an energy-dispersive X-ray detector (SEM/EDS), and X-ray diffraction (XRD) and Raman spectroscopy were performed on the surface to determine the morphology and chemical composition of the crystalline and amorphous corrosion products formed on the surface. The crystalline corrosion product was scanned over a 2-theta range from 10–90o at 0.033°/s on an area of 10 mm × 10 mm using a D8 Advance instrument (Bruker) with Cu Kα radiation; while the surface heterogeneities at the microscopic scale of the corrosion product was detected by confocal Raman microscopy using a LabRAM HR Evolution instrument (HORIBA) with a wavelength of 473 nm combined with a confocal imaging mode to focus on the injection area using the spot size of 1 μm access to frequencies from 200 to 1,200 cm−1. The pit depth was measured by laser scanning confocal microscope (LSCM) measurements after removing the corrosion products according to the standard G46-94 (Metals, 2011, 46). An average pit depth from the 10 deepest pits was used to evaluate the localized corrosion rate (LCR) by the following formula:
where h is the pitting depth in μm after removing corrosion products.
Figure 2 compares the general corrosion rates of S13Cr SS exposed to the formate fluid saturated with N2 or CO2 at 180°C and various immersion times. The highest corrosion rates were observed at the first 5 h under both N2 and CO2 saturated conditions at 180°C. It can be seen that the corrosion rate of S13Cr SS was high (21.94 mm/year) when CO2 was introduced into the formate fluid, in comparison with the value of 1.177 mm/year under the N2 condition. The average mass loss tended to increase with time prolonged; however the slope of the increasing curve decreased with time, which indicates the corrosion rates of S13Cr SS decreased with immersion time, showing a sharply reduction from 5 to 48 h. For a long immersion time of 120 h, the corrosion rate for S13Cr SS was maintained at 0.063 mm/year under the N2 condition, whereas a higher corrosion rate of 1.76 mm/year was recorded after the introduction of CO2.

FIGURE 2. Total mass loss and corrosion rates of S13Cr SS under the 180°C formate condition with N2/CO2 saturated after 5, 48, and 120 h.
The SEM morphology of the corrosion product scales formed on the S13Cr SS surface at various immersion times is given in Figure 3. For the condition with N2, the polishing marks were still visible on the surface after 5 h of exposure (Figure 3A). It is interesting to note that the corrosion products with a “spherical” shape were observed after 48 h of exposure (Figure 3B) and increased in number after 120 h (Figure 3C). The EDS results in Supplementary Figure S2 indicate that the scattered corrosion products were sulfur-rich. Figures 3D–F show the microscopic morphology of S13Cr SS in the formate solution saturated with CO2 at various immersion times and 180°C, indicating the corrosion product scales covered the entire surface with time prolonged. It is noted that the spherical corrosion products rapidly precipitated and are visible on a cracked corrosion product layer after 5 h of exposure, as shown in Figure 3D. The higher magnification showed that the spherical products present a spherical-shaped structure in morphology. After 48 h of exposure, the presence of “sheet”-shaped corrosion products randomly covered the inner layer, as shown in Figure 3E. At 120 h, the sheet-shaped corrosion products gathered into clusters and fully covered the surface, as shown in Figure 3F.

FIGURE 3. SEM morphology of the corrosion products formed on S13Cr SS exposed to the 180°C formate fluid with (A–C) N2 and (D–F) CO2 saturated.
Figure 4 illustrates the XRD patterns of the corrosion product scales formed on the surface of S13Cr SS at various immersion times. In the absence of CO2, as shown in Figure 4A, no crystalline corrosion products were detected after 5 h of immersion time at 180°C. The peaks of FeS at (100), (101), and (111) were detected for the samples immersed in the solution after 48 h which corresponded to a disordered tetragonal mackinawite structure as spherical MkB (Wolthers et al., 2003) and agreed with the spherical feature observed through SEM/EDS in Figure 3E.

FIGURE 4. XRD patterns of the corrosion scale formed on S13Cr SS under the 180°C formate condition with (A) N2 or (B) CO2 saturated after 5, 48, and 120 h.
Figure 4B illustrates the overall XRD patterns of the corrosion product scales of S13Cr SS in CO2-saturated formate fluids at various immersion times. The corrosion products are mainly FeCO3 when the samples were exposed to the CO2-saturated formate solution after 5, 48, and 120 h. However, both peaks for MkA (disordered sheet-like mackinawite) and MkB were detected in the first 5 h. Unlike spherical MkB, MkA has been reported to display sheet-like precipitated aqueous FeS clusters (Wolthers et al., 2003), which display a similar morphology with FeCO3 in the context of this study. The proportion of these two end-member phases was reported to highly depend on the pH value, and thus the formation of MkA at (101) instead of MkB at (101) can be related to the pH drop caused by CO2 infusion. It is also noted that an enhanced austenite peak located at 43.58° was detected, which suggests that the preferential dissolution of martensite took place on the surface in the early stages. However, neither the peaks of austenite nor martensite was detected after 120 h of exposure.
To identify the inner corrosion product layer, Raman spectroscopy was used to supplement XRD measurements. The Raman spectra in Figure 5 relate to three local scans conducted on the S13Cr SS surface at various immersion times. For 5 h (Figure 5A), there was no corrosion product scale detected on the surface. The spectrum in Figure 5B indicates that the peak at around 662 cm−1 is representative of Fe3O4, and the scan in Figure 5C indicates that the peaks corresponding to Fe(II)-S(-II) are located at 213, 282, 384, 485, and 595 cm−1 (Genchev and Erbe, 2016).
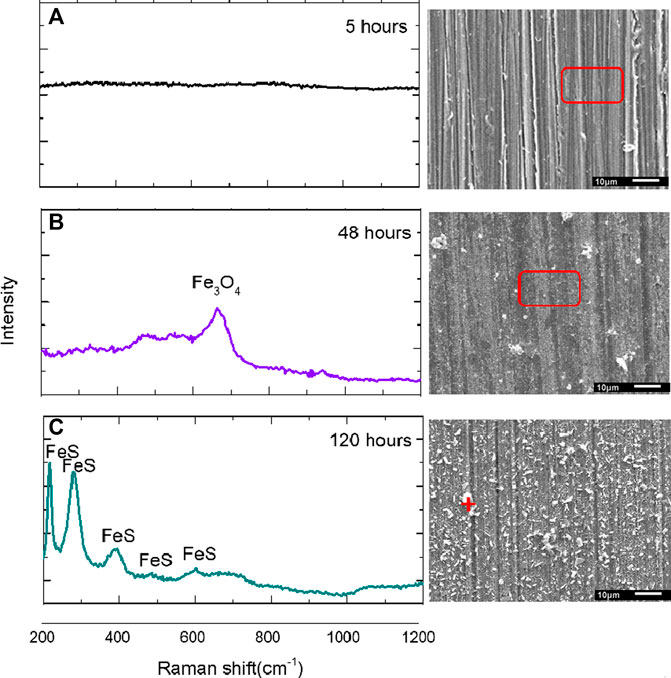
FIGURE 5. Raman spectra of the corrosion scale formed on S13Cr SS in the formate fluid at 180°C after (A) 5 h, (B) 48 h, and (C) 120 h immersion time.
The Raman spectra in Figure 6 relate to six local scans conducted on the corroded S13Cr SS surface exposed to the CO2-saturated formate fluids at various immersion times. The selected points were scanned on the outer layer and inner layer after 5, 48, and 120 h of immersion time. The spectrum in Figure 6A indicates that the peak at around 695 cm−1 is representative of FeCr2O4 (Anthony et al., 1990), and the scan in Figure 6B suggests the peaks corresponding to FeCr2O4 and Cr(OH)3. For the sample exposed to 120 h (Figure 6C), the corroded sample surface was covered with Cr(OH)3 which is located at 707 cm−1 (Zhu et al., 2015b). The composition of the inner layer cannot be detected by XRD from 5 to 120 h, indicating the amorphous feature of this layer.
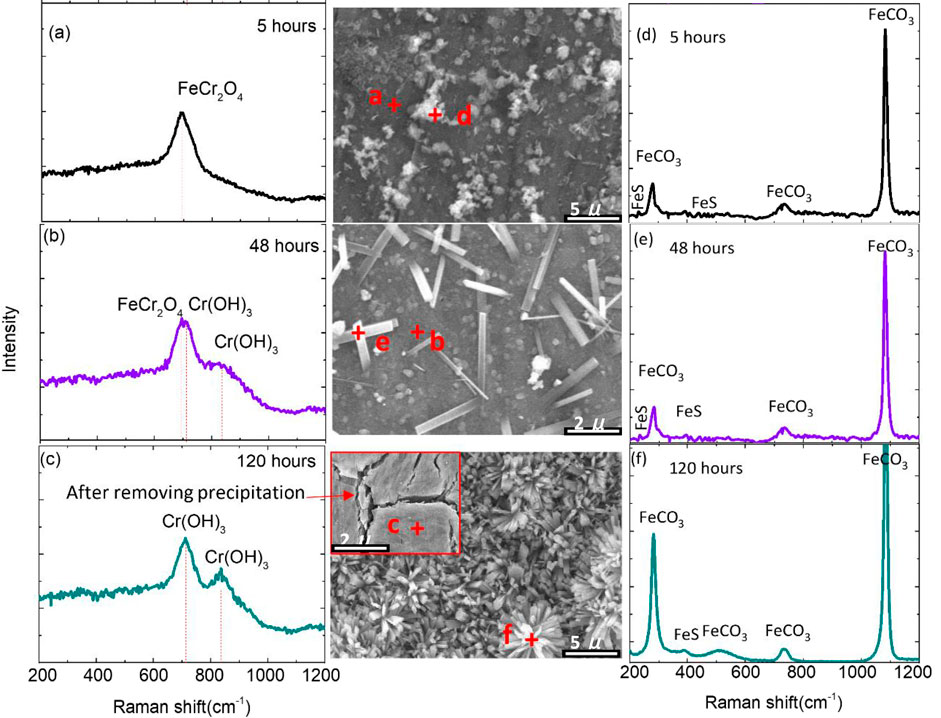
FIGURE 6. Raman spectra of the corrosion scale formed on S13Cr SS after (A,D) 5 h, (B,E) 48 h, and (C,F) 120 h immersion time under CO2-saturated formate condition at 180°C.
Figures 6D,E,F illustrate the conducted Raman spectra on the outer crystalline corrosion product layer. The results indicate that the “spherical”-like and “sheet”-like (scattered/cluster) corrosion products correspond to the mixture of FeCO3 and FeS, respectively; the strong peaks of FeCO3 are located at 187, 292, 730, and 1,087 cm−1 (Ondrus et al., 2003), and the weak peaks of FeS are located at 213 and 384 cm−1 (Genchev and Erbe, 2016). It should be noted that fewer peaks of FeS were detected on the outer surface of S13Cr SS, which could be related to the domination of forming FeCO3 or the transformation from MkB to MkA.
Figure 7 illustrated the cross-sectional of corrosion product scales formed on the surface of S13Cr SS after 120 h under an N2/CO2-saturated formate condition at 180°C. As shown in Figure 7A, the thickness of the Fe3O4 layer was approximately 2.7 μm after 120 h of immersion in the formate fluid. The enrichment of S can be detected in the outer part of the corrosion product scale, which indicates the precipitation of FeS with time, consistent with the observation from top view. Figure 7B showed the corrosion product scale thickened to a thickness of 20 μm for CO2-saturated condition at 120 h. The enrichment of Cr within the corrosion product scale can be related to the formation of FeCr2O4 and Cr(OH)3, which is in agreement with the inner layer feature observed through Raman spectra in Figure 6. Besides, the enrichment of S was detected in the inner layer of the corrosion product, which can be resulted in the preferential precipitation of FeS in the early period. It should be noted that the EDS detection cannot separate S and Mo during line scan; therefore, the distribution of S within a film can be interfered with by Mo in the matrix.
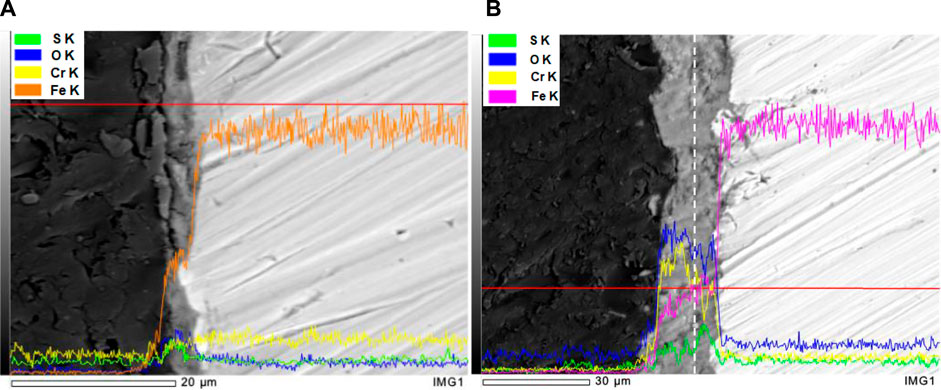
FIGURE 7. Cross section of the corrosion scale formed on S13Cr SS exposed to the formate fluid in (A) N2 and (B) saturated CO2 after 120 h at 180°C.
The SEM images of corroded S13Cr SS samples after removing the corrosion products were observed in Figure 8. Compared to the condition with the infusion of CO2, S13Cr suffered slight corrosion in the N2-saturated formate fluid from 5 to 120 h. The polish marks were still visible; however, they became shallow as the immersion time prolonged. In the CO2-saturated condition, the corrosion product scale can be detected at 5 h (Figure 4 and Figure 6), and the surface of S13Cr SS was significantly corroded as shown in Figure 8B. As shown in Figure 8D, the localized attack can be observed on the surface of S13Cr after 48 h of immersion in the CO2-saturated formate fluid. After 120 h, the few localized corrosion developed to a more severe attack (Figure 8F).
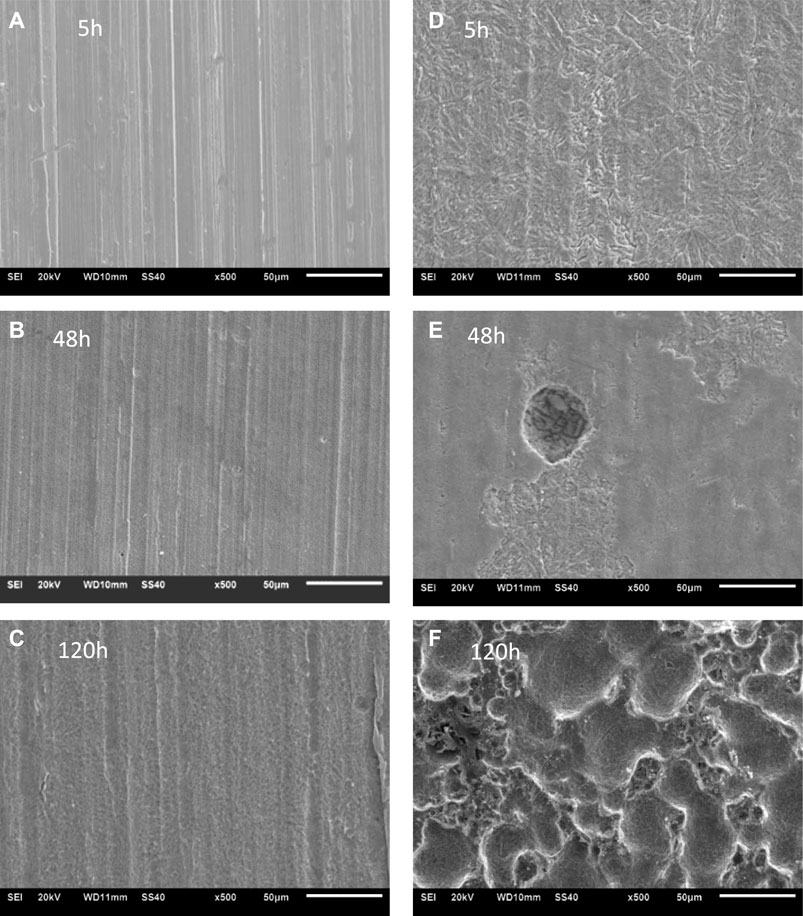
FIGURE 8. SEM images of corroded S13Cr SS samples exposed under the 180°C formate condition with (A–C) N2 and (D–F) CO2 saturated after removing the corrosion products.
The localized corrosion rate of S13Cr SS immersed in CO2-saturated formate fluids was calculated based on the analysis of LSCM measurements on the surface. The highest localized corrosion rate of 0.8 mm/year was determined in the first 48 h. From 48 to 120 h, the development of the pit grew slowly, and the localized corrosion rate declined to 0.45 mm/year after 120 h (note that the error bars were derived from the depth difference of the top ten pits, and the higher value at 48 and 120 h indicates the inhomogeneous development of pitting corrosion), which can be related to the formation of Cr(OH)3 and FeCO3 covering the surface and blocking the aggressive ions such as S (Figure 9).
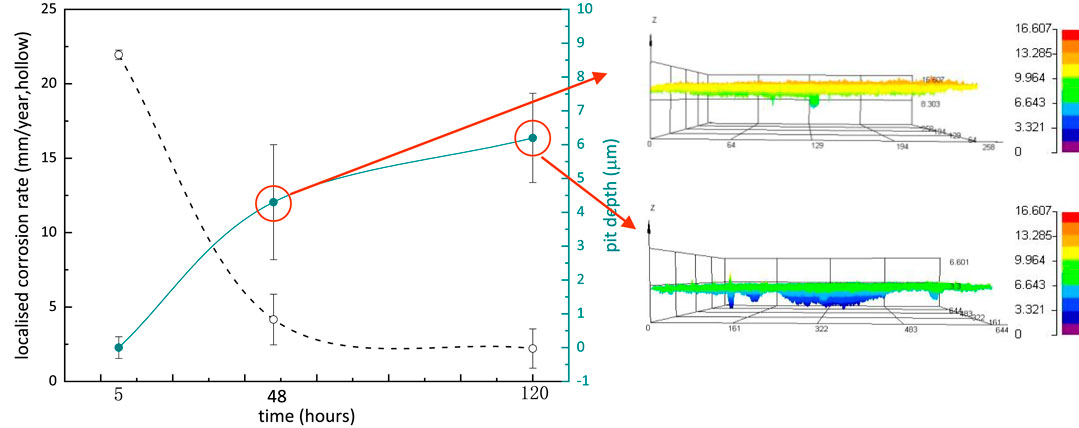
FIGURE 9. Localized corrosion rate and pitting profilometry of corroded S13Cr SS samples after removing the corrosion products.
The formation of the thermodynamically stable corrosion scales on the surface can be predicted via Pourbaix diagrams by Corrosion Analyzer in the OLI system. Figure 10 shows the conducting Pourbaix diagram for Cr and Fe in simulated completion fluids (formate saturated with N2); a total metal cation concentration of 10–5 mol/l was considered (12% Cr cations and 88% Fe cations) at 180°C (Zhao et al., 2019; Yue et al., 2020c). It is acknowledged that the cathodic process contains the following reactions (Yue et al., 2017) and is provided as the navy dash line [a] in Figure 13:
Where reaction (Eq. 3) can be negligible under the pH beyond 10.5, and concentration of HCOOH is negligible as it can be deduced from its pKa [4.40 in diluted solutions at 180°C (HwaáKim et al., 1996)]. Therefore, reaction (Eq. 5) dominates the cathodic reactions in this case.
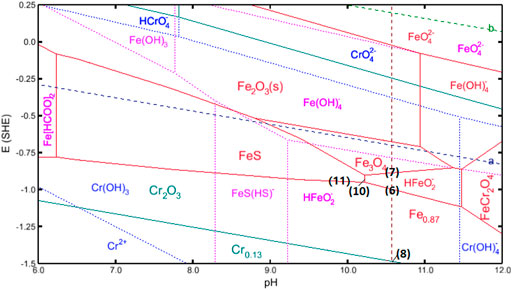
FIGURE 10. Pourbaix diagram for S13Cr SS under the formate condition with the presence of sulfide at 180°C.
The initial corrosion rate was relatively high under such high-temperature conditions, which can be attributed to the fast metal dissolution in the absence of the protective layers (solid/insoluble products), and the results are in agreement with our previous research (Yue et al., 2020a; Yue et al., 2020b; Yue et al., 2020c):
The corrosion rates were reduced sharply after 48 h, accompanied by the detection of the inner Fe3O4 layer, suggesting that the inner Fe3O4 layer plays a major role in blocking the ion transportation and retarding the corrosion process at the material interface. According to the Pourbaix diagram, the formation of Fe3O4 becomes thermodynamically favorable in formate fluids at 180°C and pH 10.55, suggesting the oxidation of the anion HFeO2- (Eq. 7):
For S13Cr SS, the formation of Cr2O3 is expected by reaction (Eq. 8) which coexists with Cr(OH)3 (reaction Eq. 9) in aqueous. However, neither was detected from the Raman analyses and suggests that the amount of Cr2O3 and Cr(OH)3 may be neglected compared to magnetite in the current system so these products may not be detected.
The dissolution of the substrate in the early period by reaction (Eq. 6) causes a reduction of pH and subsequently drives the formation of FeS by the following reaction when the interface pH value reaches 10.2:
where reaction (Eq. 10) is considered as the formation of FeS via precipitation, while the reaction (11) represented the solid reaction for FeS (Rickard, 1995; Liu et al., 2017).
For the environment containing CO2, as shown in Figure 11, the hydrogen evolution reaction line (navy dash line [a]) indicates a positive shift, which can be related to the change in the ion activity induced by CO2. The presence of CO2 can dissolve in the formate solution and hydrate to form H2CO3 through the following reactions (Ikeda et al., 1983):
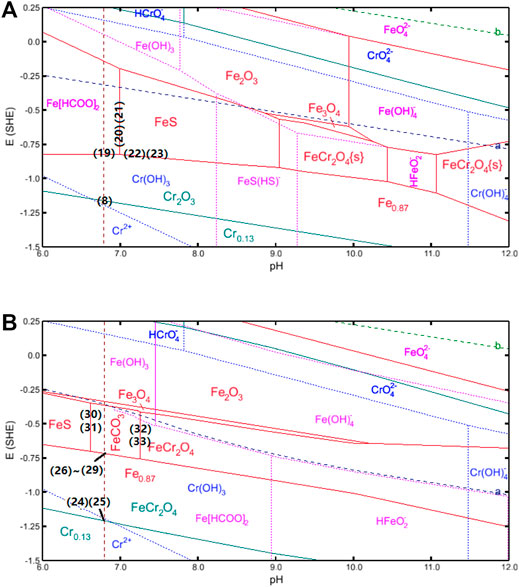
FIGURE 11. Pourbaix diagram for S13Cr SS under the formate condition with the presence of CO2 and sulfide at 180°C after (A) 0 and (B) 5 h of mass loss (0.098 g mass loss per sample).
The weak acid H2CO3 in the formate solution can be dissociated in two steps, as shown in reactions (Eq. 14) and (Eq. 15) (Nesic et al., 1996b). It is noted that the formation of H2CO3 causes a reduced pH to 6.8 and can further react with formate ions to form HCOOH via reaction (Eq. 16) (Bungert et al., 2000).
The cathodic reactions in the CO2-saturated formate solution include not only the reactions (Eqs 3–5) but also the following reactions (Kahyarian and Nesic, 2020):
The reactions (Eq. 4), (Eq. 18), and (Eq. 19) are subsequently accelerated, indicating the fast metal dissolution process at the material interface under the CO2-saturated condition compared to that of the N2-balanced condition. The following anodic reaction is considered in the early stage as shown in Figure 11A:
It is noted that the surface is covered by scattered FeS, suggesting that FeS becomes thermodynamically stable under the current experimental conditions. According to the constructing Pourbaix diagram, as shown in Figure 11A, the FeS phase becomes thermodynamically stable at pH 7.0, which indicates the formation of FeS at high pH. The following reactions are derived by the pH rise:
Besides, reactions (Eq. 22) and (Eq. 23) can also occur based on the potential drive as the pH increase to 7.
After 5 h of mass loss, the increase in mass loss with immersion times made FeCr2O4 thermodynamically stable for Cr in solid-state (the calzo phase in Figure 11B) according to the following reactions (Hua et al., 2019b) in the Pourbaix diagram:
Besides, FeCO3 becomes the thermodynamically stable product after abundant cations in the aqueous, arising via both thermodynamic reactions (Eqs 26–29) (Nesic et al., 1996a) and transformation from FeS and FeCr2O4 derived by pH change according to reactions (Eqs 30–33):
Although the reactions of corrosion products can be predicted by thermodynamics, it should be noted that the dominant reaction as the growth of corrosion products cannot be defined by thermodynamics and that is the limitation of using the Pourbaix diagram.
The corrosion rate (CR) consists of the reaction rate from corrosion layer accumulation (CLAR) and the dissolution in the aqueous phase (DR) (Sun and Nešic, 2008), which can be calculated by the weight of coupons with the corrosion product (ma) according to Eq. 34 and Eq. 35 and is shown in Figure 12.
where M is the mol mass of the main corrosion product, and V is the volume of solution. To simplify the calculation, the S13Cr SS is assumed to be dissolved into iron ions (56 g/mol).
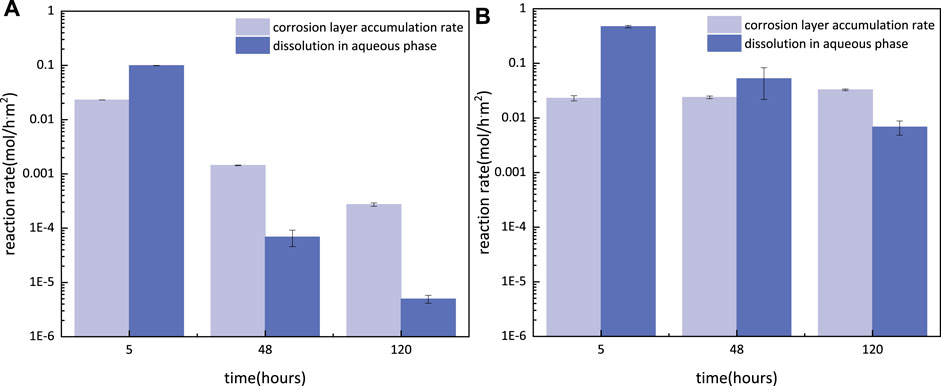
FIGURE 12. CLAR and DR of S13Cr SS under the 180°C formate condition with N2/CO2 saturated after 5, 48, and 120 h.
According to the observation in Figure 3, fewer outer FeS/FeCO3 crystals accumulate on the surface at 5 h, which indicates that the CLAR mainly corresponded to the formation of the inner layer consisting of Fe3O4/FeCr2O4. It is interesting to note that the CLAR of both Fe3O4 and FeCr2O4 was 0.023 mol/hm2, suggesting that more metal dissolution was transferred into Fe [HCOO]2 in CO2-saturated formates than the formation of HFeO2− under N2 conditions.
Under the N2 condition, the DR decreased to the level below 1E-4 mol/hm2 at 48 h, indicating the protection of the inner layer as a barrier against active metal dissolutions. The reaction rate for the growth of the corrosion products decreased with exposure time and reached to the value of 2.7E-4 mol/hm2 after 120 h.
Under the CO2-saturated condition, the CLAR slightly increased after 48 h of immersion, which can be attributed to the formation of the outer layer consisting of FeCO3/FeS on the surface. The reduction in DR at 48 h, however, is still higher than CLAR, indicating the continuous releasing of metal ions from the substrate. As the immersion time prolonged, forming the fully covered outer layer to further block the flux of aggressive ions, resulted in a lower level of DR combined with an increased CLAR at 120 h. However, the CLAR in CO2-saturated conditions was two orders of magnitude higher than that in N2 conditions at 120 h, consistent with the results in Figure 7B where it shows a thicker corrosion product scale. Besides, the DR was still three orders of magnitude higher than that in the N2 condition at 120 h. These results suggest that the dissolution of metal into ions occurred under the protection of the double-layered corrosion product scale.
Although the multi-layered corrosion product scales covered and protected the surface of S13Cr SS under the CO2-containing condition, high DR suggests the presence of defects in the corrosion products consisting of FeS, Cr(OH)3, and FeCO3. The previous literature has reported that the formation of the FeCO3 and Cr(OH)3 on S13Cr SS was controlled by the dissolution–precipitation process and resulted in relatively high defections (Guo et al., 2012; Li et al., 2019b; Zhao et al., 2019). However, the formation of the compact structures for spinel products such as Fe3O4 and FeCr2O4 was considered to provide better corrosion protection than that of the precipitation type (Yue et al., 2020a, 2020b, 2020c; Liu et al., 2021). Besides, the outer corrosion products with sheet-shaped clusters characterized as a looser structure which may cause pore connectivity within the outer layer. Wang et al. (Li et al., 2019a; Wang et al., 2021) illustrated that the localized corrosion at CO2-containing environments was corresponding to the connected pores in the corrosion product scale. The fast kinetics resulted in the small pore sizes as the quicker formation of crystalline FeCO3. Therefore, the formation of the porous outer layer with high CLAR can induce the localized corrosion for S13Cr under CO2-saturated conditions. In contrast, the outer FeS scattered on the compact inner layer with low CLAR in the formate fluid without CO2, showing general corrosion after removal of the corrosion product layer (Figure 8).
The evolution of the double-layered corrosion products in CO2-saturated formate solutions is illustrated in Figure 13. As shown in Figure 13B, the formation of FeCr2O4 acts as the protective layer (in Figure 13A). The FeCr2O4 can be destabilized and gradually transferred into Cr(OH)3. Figure 13C illustrates the precipitation of Cr(OH)3 in the inner layer due to its extremely low solubility product constant (Xu et al., 2013; Liu et al., 2015). Consequently, a Cr-rich inner layer appears instead of a passive film on the surface when the CO2-saturated formate fluid was at 180°C. A Cr-rich inner layer can decrease the corrosion rate at low pH; however, it should be noted that the corrosion scale displayed porous with high defects because FeCO3/FeS grows irregularly and discontinuously, which allows anions to penetrate through the outer layer of corrosion product scales.
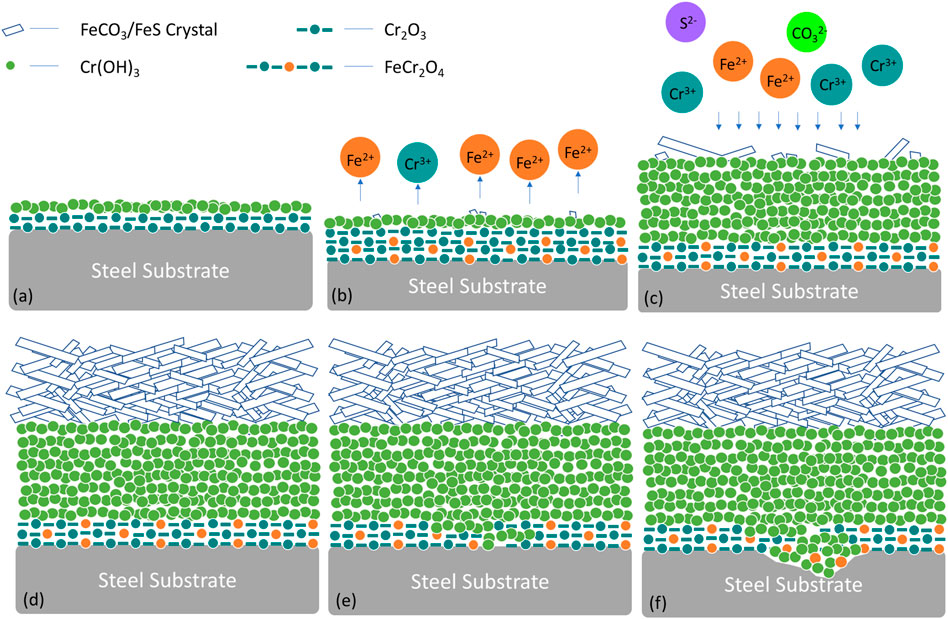
FIGURE 13. Schematic diagram of (A–D) the sequence of the formation of the outer and inner layers of the double-layered corrosion products and (E–F) the development of localized corrosion in CO2-saturated formate solution at 180°C.
Note that there were no Cl− ions present in the formate fluid, which indicates a relatively low localized corrosion risk. However, the hydrolysis of Cr3+ caused an acidified environment within the inner layer of corrosion products. When the pH dropped below 7.3 (Figure 11B), the oxide layer would dissolve. The hydrolytic action of dissolved Cr3+ would subsequently decrease the pH value and result in the development of localized corrosion, as shown in Figures 13D,E.
Figure 14 compares the measured corrosion rate in the formate fluid (tubing outer wall and casing) with those obtained from the literature both in formate fluid and formation water (tubing inner wall) (Leth-Olsen, 2004; Sunaba et al., 2014; Zhao et al., 2018; Qi et al., 2019; Yue et al., 2020b). It reveals that S13Cr shows a lower corrosion rate in the formate fluid than that in formation water. The high corrosion rates were only obtained in the CO2 infusion formate fluid (showing the same corrosion rate with CO2-saturated H2O), which indicates that CO2 is the governing factor in the ultra-deep downhole condition. It is noted that the highest corrosion rate occurred during the injection of lived acid, and the localized corrosion occurs at the defect of the corrosion product scale (Qi et al., 2019). The CO2 would ingress into completion fluid once the localized corrosion induced tubing perforation, which would cause a dramatic increase in the corrosion rate for S13Cr in completion fluid.
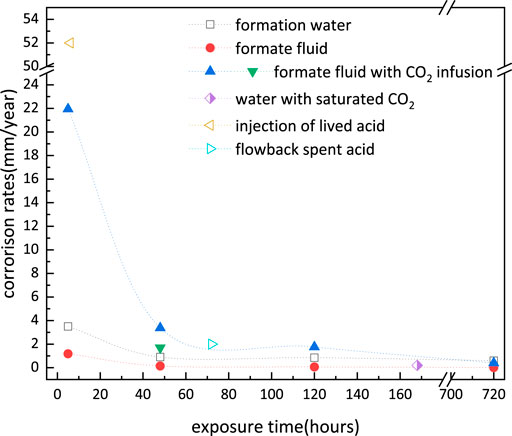
FIGURE 14. Comparison of measured uniform corrosion rates of S13Cr with data obtained from the literature under ultra-deep downhole conditions (180°C).
The research has focused on clarifying the influence of sulfide impurity and CO2 ingress on the corrosion of S13Cr SS as well as the evolution of the corrosion product scales under both CO2-free and CO2-saturated formate fluid conditions. From this work, the following conclusions can be drawn:
• Under N2-deoxygenated formate fluid conditions, the general corrosion rate of S13Cr SS reached 1.177 mm/year after 5 h and reduced to 0.067 mm/year after 120 h of exposure, compared to high corrosion rates of 21.94 and 1.76 mm/year for samples exposed to the CO2-saturated formate fluid condition after 5 and 120 h, respectively.
• A thin Fe3O4 layer was detected on S13Cr SS under N2-deoxygenated formate fluid conditions. The presence of sulfide in formate brine can result in the formation of disordered tetragonal mackinawite MkB after 120 h of exposure. With the ingress of CO2, the formation of the inner corrosion product layer on S13Cr SS was composed of FeCr2O4 after 5 h and then transformed to Cr(OH)3 with time prolonged. The acidification on the surface results in the formation of a combination of disordered mackinawite of MkA and MkB, accompanied by the formation of a unique FeCO3 morphology which presented as “sheet” crystalline after 48 h of exposure and developed into clusters after 120 h.
• For the system containing sulfide, the formation of FeS, Fe3O4, and HFeO2− became thermodynamically stable. The reaction rate of HFeO2− was higher in the first 5 h, whereas the accumulation for solid products as a barrier layer became favorable in kinetics after 48 h. Under CO2-saturated conditions, the formation of Fe [HCOO]2, FeS, FeCr2O4, Cr(OH)3, and FeCO3 became thermodynamically stable. Both the reaction rates for dissolution and corrosion layer accumulation are high from 5 to 120 h. The thicker corrosion product did not provide effective protection and induced localized corrosion after 48 h of exposure.
The original contributions presented in the study are included in the article/Supplementary Material; further inquiries can be directed to the corresponding authors.
XY, YH, and LZ contributed to the conception and design of the study. LH, XY, and ZQ organized the database. XY and ZY performed the statistical analysis. XY wrote the first draft of the manuscript. All authors contributed to manuscript revision and read and approved the submitted version.
This work was supported by the National Natural Science Foundation of China (Grant Nos. 51871027 and 52101069), the China Postdoctoral Science Foundation (No. 2021M690345), and the Postdoctoral Research Foundation of Shunde Graduate School of University of Science and Technology Beijing (Nos. 2020BH013 and 2020BH010).
Author LH was employed by company State Key Laboratory of Advanced Power Transmission Technology, Global Energy Interconnection Research Institute Co., Ltd.,.
The remaining authors declare that the research was conducted in the absence of any commercial or financial relationships that could be construed as a potential conflict of interest.
All claims expressed in this article are solely those of the authors and do not necessarily represent those of their affiliated organizations, or those of the publisher, the editors, and the reviewers. Any product that may be evaluated in this article, or claim that may be made by its manufacturer, is not guaranteed or endorsed by the publisher.
The Supplementary Material for this article can be found online at: https://www.frontiersin.org/articles/10.3389/fmats.2021.802136/full#supplementary-material
Anthony, J. W., Bideaux, R. A., Bladh, K. W., and Nichols, M. C. (1990). Handbook of Mineralogy. Tucson: Mineral Data Publ.
Askari, M., Aliofkhazraei, M., Jafari, R., Hamghalam, P., and Hajizadeh, A. (2021). Downhole Corrosion Inhibitors for Oil and Gas Production - a Review. Appl. Surf. Sci. Adv. 6, 100128. doi:10.1016/j.apsadv.2021.100128
Banaś, J., Lelek-Borkowska, U., Mazurkiewicz, B., and Solarski, W. (2007). Effect of CO2 and H2S on the Composition and Stability of Passive Film on Iron Alloys in Geothermal Water. Electrochimica Acta 52, 5704–5714. doi:10.1016/j.electacta.2007.01.086
Bungert, D., Maikranz, S., Sundermann, R., Downs, J., Benton, W., Dick, M., et al. (2000). “The Evolution and Application of Formate Brines in High-Temperature/high-Pressure Operations,” in IADC/SPE Drilling Conference (London: Society of Petroleum Engineers). doi:10.2118/59191-ms
Clarke-Sturman, A., and Sturla, P. (1988). Aqueous Polysaccharide Compositions. Eur. patent 259, 16.
Ding, J., Zhang, L., Li, D., Lu, M., Xue, J., and Zhong, W. (2013). Corrosion and Stress Corrosion Cracking Behavior of 316L Austenitic Stainless Steel in High H2S-CO2-Cl− Environment. J. Mater. Sci. 48, 3708–3715. doi:10.1007/s10853-013-7168-1
Genchev, G., and Erbe, A. (2016). Raman Spectroscopy of Mackinawite FeS in Anodic Iron Sulfide Corrosion Products. J. Electrochem. Soc. 163, C333–C338. doi:10.1149/2.1151606jes
Guo, S., Xu, L., Zhang, L., Chang, W., and Lu, M. (2012). Corrosion of alloy Steels Containing 2% Chromium in CO2 Environments. Corrosion Sci. 63, 246–258.
Hamza, A., Hussein, I. A., Jalab, R., Saad, M., and Mahmoud, M. (2021). Review of Iron Sulfide Scale Removal and Inhibition in Oil and Gas Wells: Current Status and Perspectives. Energy Fuels 35, 14401–14421. doi:10.1021/acs.energyfuels.1c02177
He, W., Knudsen, O. Ø., and Diplas, S. (2009). Corrosion of Stainless Steel 316L in Simulated Formation Water Environment with CO2-H2S-Cl−. Corrosion Sci. 51, 2811–2819. doi:10.1016/j.corsci.2009.08.010
Hoar, T. P., and Jacob, W. R. (1967). Breakdown of Passivity of Stainless Steel by Halide Ions. Nature 216, 1299–1301. doi:10.1038/2161299a0
Howard, S. K., Downs, J., and others, (2009). “Formate Brines for HP/HT Well Control: New Insights into the Role and Importance of the Carbonate/Bicarbonate Additive Package,” in SPE International Symposium on Oilfield Chemistry (London: Society of Petroleum Engineers). doi:10.2118/121550-ms
Howard, S. K., and others, (1995). “Formate Brines for Drilling and Completion: State of the Art,” in SPE Annual Technical Conference and Exhibition (London: Society of Petroleum Engineers). doi:10.2118/30498-ms
Hua, Y., Barker, R., Wang, C., and Neville, A. (2019a). “Comparison of Corrosion Products/Scales on X65 Carbon Steel in a NaCl Solution and a Complex Brine at Different CO 2 Partial Pressures,” in CORROSION 2019 (Houston, Texas, USA: NACE International).
Hua, Y., Xu, S., Wang, Y., Taleb, W., Sun, J., Zhang, L., et al. (2019b). The Formation of FeCO3 and Fe3O4 on Carbon Steel and Their Protective Capabilities against CO2 Corrosion at Elevated Temperature and Pressure. Corrosion Sci. 157, 16. doi:10.1016/j.corsci.2019.06.016
Ikeda, A., Ueda, M., and Mukai, S. (1983). CO2 Corrosion Behavior and Mechanism of Carbon Steel and Alloy Steel.
Kahyarian, A., and Nesic, S. (2020). On the Mechanism of Carbon Dioxide Corrosion of Mild Steel: Experimental Investigation and Mathematical Modeling at Elevated Pressures and Non-ideal Solutions. Corrosion Sci. 173, 108719. doi:10.1016/j.corsci.2020.108719
Kim, M. H., Kim, C. S., Lee, H. W., and Kim, K. (1996). Temperature Dependence of Dissociation Constants for Formic Acid and 2,6-dinitrophenol in Aqueous Solutions up to 175 °C. J. Chem. Soc. Faraday Trans. 92, 4951–4956. doi:10.1039/ft9969204951
Leth-Olsen, H. (2005). “CO2 Corrosion in Bromide and Formate Well Completion Brines,” in SPE International Symposium on Oilfield Corrosion (London: Society of Petroleum Engineers). doi:10.2118/95072-ms
Leth-Olsen, H. (2004). “CO2 Corrosion of Steel in Formate Brines for Well Applications,” in CORROSION 2004 (New Orleans, Luisiana, USA: NACE-04357).
Li, D., Zhang, L., Wang, X., Yang, Z., Yue, X., Lu, M., et al. (2018). “Study on the Corrosion Performance of C110 Tubing in Formate Completion Fluid at High Temperature,” in CORROSION 2018 (Houston, Texas, USA: NACE International).
Li, J., Zhang, Z., Zhu, G., Li, T., Zhao, K., Chi, L., et al. (2020). The Origin and Accumulation of Ultra-deep Oil in Halahatang Area, Northern Tarim Basin. J. Pet. Sci. Eng. 195, 107898. doi:10.1016/j.petrol.2020.107898
Li, L., Yan, J., Xiao, J., Sun, L., Fan, H., and Wang, J. (2021). A Comparative Study of Corrosion Behavior of S-phase with AISI 304 Austenitic Stainless Steel in H2S/CO2/Cl- media. Corrosion Sci. 187, 109472. doi:10.1016/j.corsci.2021.109472
Li, S., Zeng, Z., Harris, M. A., Sánchez, L. J., and Cong, H. (2019a). CO2 Corrosion of Low Carbon Steel under the Joint Effects of Time-Temperature-Salt Concentration. Front. Mater. 6, 10. doi:10.3389/fmats.2019.00010
Li, X., Zhao, Y., Qi, W., Xie, J., Wang, J., Liu, B., et al. (2019b). Effect of Extremely Aggressive Environment on the Nature of Corrosion Scales of HP-13Cr Stainless Steel. Appl. Surf. Sci. 469, 146–161. doi:10.1016/j.apsusc.2018.10.237
Liu, H., Cao, L., Xie, J., Yang, X., Zeng, N., Zhang, X., et al. (2019a). “Research and Practice of Full Life Cycle Well Integrity in HTHP Well, Tarim Oilfield,” in International Petroleum Technology Conference. doi:10.2523/19403-ms
Liu, H., Sun, J., Qian, J., Wang, B., Shi, S., Zhu, Y., et al. (2021). Revealing the Temperature Effects on the Corrosion Behaviour of 2205 Duplex Stainless Steel from Passivation to Activation in a CO2-containing Geothermal Environment. Corrosion Sci. 187, 109495. doi:10.1016/j.corsci.2021.109495
Liu, W., Lu, S.-L., Zhang, Y., Fang, Z.-C., Wang, X.-M., and Lu, M.-X. (2015). Corrosion Performance of 3% Cr Steel in CO2-H2S Environment Compared with Carbon Steel. Mater. Corrosion 66, 1232–1244.
Liu, W., Shi, T., Li, S., Lu, Q., Zhang, Z., Feng, S., et al. (2019b). Failure Analysis of a Fracture Tubing Used in the Formate Annulus protection Fluid. Eng. Fail. Anal. 95, 248–262. doi:10.1016/j.engfailanal.2018.09.009
Liu, Y., Xu, L., Lu, M., Meng, Y., Zhu, J., and Zhang, L. (2014). Corrosion Mechanism of 13Cr Stainless Steel in Completion Fluid of High Temperature and High Concentration Bromine Salt. Appl. Surf. Sci. 314, 768–776. doi:10.1016/j.apsusc.2014.07.067
Liu, Y., Zhang, Z., Bhandari, N., Dai, Z., Yan, F., Ruan, G., et al. (2017). New Approach to Study Iron Sulfide Precipitation Kinetics, Solubility, and Phase Transformation. Ind. Eng. Chem. Res. 56, 9016–9027. doi:10.1021/acs.iecr.7b01615
Metals, A. C. G.-1 on. C. of. (2011). Standard Practice for Preparing, Cleaning, and Evaluating Corrosion Test Specimens. West Conshohocken, Pennsylvania, USA: ASTM international.
Nesic, S., Postlethwaite, J., and Olsen, S. (1996a). An Electrochemical Model for Prediction of Corrosion of Mild Steel in Aqueous Carbon Dioxide Solutions. Corrosion 52, 280–294. doi:10.5006/1.3293640
Nesic, S., Thevenot, N., Crolet, J. L., and Drazic, D. (1996b). “Electrochemical Properties of Iron Dissolution in the Presence of CO2 - Basics Revisited,” in NACE-96003 (Denver, Colorado: NACE International), 23.
Ondrus, P., Veselovsky, F., Gabasova, A., Hlousek, J., Srein, V., Vavrin, I., et al. (2003). Primary Minerals of the Jáchymov Ore District. J. Geosciences 48, 19–147.
Pessu, F., Barker, R., and Neville, A. (2017). Pitting and Uniform Corrosion of X65 Carbon Steel in Sour Corrosion Environments: the Influence of CO2, H2S, and Temperature. Corrosion 73, 1168–1183. doi:10.5006/2454
Qi, W., Wang, J., Li, X., Cui, Y., Zhao, Y., Xie, J., et al. (2019). Effect of Oxide Scale on Corrosion Behavior of HP-13Cr Stainless Steel during Well Completion Process. J. Mater. Sci. Technol. 64, 9. doi:10.1016/j.jmst.2019.10.009
Refaey, S. A. M., Taha, F., and El-Malak, A. M. A. (2005). Corrosion and Inhibition of Stainless Steel Pitting Corrosion in Alkaline Medium and the Effect of Cl− and Br− Anions. Appl. Surf. Sci. 242, 114–120. doi:10.1016/j.apsusc.2004.08.003
Rickard, D. (1995). Kinetics of FeS Precipitation: Part 1. Competing Reaction Mechanisms. Geochimica et cosmochimica acta 59, 4367–4379. doi:10.1016/0016-7037(95)00251-t
Sekine, I., and Chinda, A. (1984). Comparison of the Corrosion Behavior of Pure Fe, Ni, Cr, and Type 304 Stainless Steel in Formic Acid Solution. Corrosion 40, 95–100. doi:10.5006/1.3593929
Sun, W., and Nešić, S. (2008). Kinetics of Corrosion Layer Formation: Part 1-Iron Carbonate Layers in Carbon Dioxide Corrosion. Corrosion 64, 334–346. doi:10.5006/1.3278477
Sunaba, T., Ito, T., Miyata, Y., Asakura, S., Shinohara, T., Yakou, T., et al. (2014). Influence of Chloride Ions on Corrosion of Modified Martensitic Stainless Steels at High Temperatures under a CO2Environment. Corrosion 70, 988–999. doi:10.5006/1141
Teng, X., Yang, X., and Xu, T. (2016). Formate Completion Fluid Technology. Beijing: Petroleum Industry Press.
Vedage, H., Ramanarayanan, T. A., Mumford, J. D., and Smith, S. N. (1993). Electrochemical Growth of Iron Sulfide Films in H2S-Saturated Chloride media. Corrosion 49, 114–121. doi:10.5006/1.3299205
Wang, C., Hua, Y., Nadimi, S., Taleb, W., Barker, R., Li, Y., et al. (2021). Determination of Thickness and Air-Void Distribution within the Iron Carbonate Layers Using X-ray Computed Tomography. Corrosion Sci. 179, 109153. doi:10.1016/j.corsci.2020.109153
Wolthers, M., Van der Gaast, S. J., and Rickard, D. (2003). The Structure of Disordered Mackinawite. Am. Mineral. 88, 2007–2015. doi:10.2138/am-2003-11-1245
Xu, B., Yuan, B., Wang, Y., and Zhu, L. (2018). H2S-CO2 Mixture Corrosion-Resistant Fe2O3-Amended Wellbore Cement for Sour Gas Storage and Production wells. Construction Building Mater. 188, 161–169. doi:10.1016/j.conbuildmat.2018.08.120
Xu, L., Guo, S., Chang, W., Chen, T., Hu, L., and Lu, M. (2013). Corrosion of Cr Bearing Low alloy Pipeline Steel in CO2 Environment at Static and Flowing Conditions. Appl. Surf. Sci. 270, 395–404. doi:10.1016/j.apsusc.2013.01.036
Yang, Z., Du, C., Li, W., Zhang, L., Wang, Z., Li, D., et al. (2019). “Effects of pH Buffer on the Corrosion Behavior of C110 Tubing in Formate Completion Fluid with the Mix of CO2 at High Temperature,” in NACE International Corrosion Conference Proceedings (Houston, Texas, USA: NACE International), 1–11.
Yue, X., Zhang, L., Li, D., Honda, H., Lu, M., Wang, Z., et al. (2017). Effect of Traces of Dissolved Oxygen on the Passivation Stability of Super 13Cr Stainless Steel under High CO2/H2S Conditions. Int. J. Electrochem. Sci. 12, 7853–7868. doi:10.20964/2017.08.33
Yue, X., Zhang, L., Ma, L., Lu, M., Neville, A., and Hua, Y. (2020a). Influence of a Small Velocity Variation on the Evolution of the Corrosion Products and Corrosion Behaviour of Super 13Cr SS in a Geothermal CO2 Containing Environment. Corrosion Sci. 178, 108983.
Yue, X., Zhang, L., Sun, C., Xu, S., Wang, C., Lu, M., et al. (2020b). A Thermodynamic and Kinetic Study of the Formation and Evolution of Corrosion Product Scales on 13Cr Stainless Steel in a Geothermal Environment. Corrosion Sci. 169, 108640. doi:10.1016/j.corsci.2020.108640
Yue, X., Zhang, L., Wang, Y., Xu, S., Wang, C., Lu, M., et al. (2020c). Evolution and Characterization of the Film Formed on Super 13Cr Stainless Steel in CO2-saturated Formation Water at High Temperature. Corrosion Sci. 163, 108277. doi:10.1016/j.corsci.2019.108277
Zhao, Y., Chang, L., Zhang, T., Xie, J., Chen, Y., Xu, D., et al. (2020). Effect of the Flow Velocity on the Corrosion Behavior of UNS S41426 Stainless Steel in the Extremely Aggressive Oilfield Environment for the Tarim Area. CORROSION 76, 654–665. doi:10.5006/2813
Zhao, Y., Hua, Y., Liu, B., Li, X., Xie, J., Zeng, G., et al. (2021a). The Development of a Mechanistic-Chemometrics Model with Multi-Degree of freedom for Pitting Corrosion of HP-13Cr Stainless Steel under Extremely Oilfield Environments. Corrosion Sci. 181, 109237. doi:10.1016/j.corsci.2021.109237
Zhao, Y., Li, X., Zhang, C., Zhang, T., Xie, J., Zeng, G., et al. (2018). Investigation of the Rotation Speed on Corrosion Behavior of HP-13Cr Stainless Steel in the Extremely Aggressive Oilfield Environment by Using the Rotating Cage Test. Corrosion Sci. 145, 307–319. doi:10.1016/j.corsci.2018.10.011
Zhao, Y., Xie, J., Zeng, G., Zhang, T., Xu, D., and Wang, F. (2019). Pourbaix Diagram for HP-13Cr Stainless Steel in the Aggressive Oilfield Environment Characterized by High Temperature, High CO2 Partial Pressure and High Salinity. Electrochimica Acta 293, 116–127. doi:10.1016/j.electacta.2018.08.156
Zhao, Y., Zhang, T., Xiong, H., and Wang, F. (2021b). Bridge for the Thermodynamics and Kinetics of Electrochemical Corrosion: Modeling on Dissolution, Ionization, Diffusion and Deposition in Metal/solution Interface. Corrosion Sci. 191, 109763. doi:10.1016/j.corsci.2021.109763
Zhu, J., Xu, L., and Lu, M. (2015a). Electrochemical Impedance Spectroscopy Study of the Corrosion of 3Cr Pipeline Steel in Simulated CO2-saturated Oilfield Formation Waters. Corrosion 71, 854–864. doi:10.5006/1494
Zhu, J., Xu, L., Lu, M., Zhang, L., and Chang, W. (2015b). Interaction Effect between Cr(OH)3 Passive Layer Formation and Inhibitor Adsorption on 3Cr Steel Surface. RSC Adv. 5, 18518–18522. doi:10.1039/c4ra15519j
Zhu, S. D., Wei, J. F., Bai, Z. Q., Zhou, G. S., Miao, J., and Cai, R. (2011a). Failure Analysis of P110 Tubing String in the Ultra-deep Oil Well. Eng. Fail. Anal. 18, 950–962. doi:10.1016/j.engfailanal.2010.11.013
Keywords: potassium formate, super 13Cr SS, high temperature, thermodynamics, kinetics
Citation: Yue X, Huang L, Qu Z, Yang Z, Zhang L and Hua Y (2022) Formation and Evolution of the Corrosion Scales on Super 13Cr Stainless Steel in a Formate Completion Fluid With Aggressive Substances. Front. Mater. 8:802136. doi: 10.3389/fmats.2021.802136
Received: 26 October 2021; Accepted: 06 December 2021;
Published: 28 January 2022.
Edited by:
Dake Xu, Northeastern University, ChinaReviewed by:
Ziming Wang, Xiamen University, ChinaCopyright © 2022 Yue, Huang, Qu, Yang, Zhang and Hua. This is an open-access article distributed under the terms of the Creative Commons Attribution License (CC BY). The use, distribution or reproduction in other forums is permitted, provided the original author(s) and the copyright owner(s) are credited and that the original publication in this journal is cited, in accordance with accepted academic practice. No use, distribution or reproduction is permitted which does not comply with these terms.
*Correspondence: Lei Zhang, emhhbmdsZWlAdXN0Yi5lZHUuY24=; Yong Hua, bGVvLmh1YXlvbmdAZ21haWwuY29t
Disclaimer: All claims expressed in this article are solely those of the authors and do not necessarily represent those of their affiliated organizations, or those of the publisher, the editors and the reviewers. Any product that may be evaluated in this article or claim that may be made by its manufacturer is not guaranteed or endorsed by the publisher.
Research integrity at Frontiers
Learn more about the work of our research integrity team to safeguard the quality of each article we publish.