 Jie Xiao
 Xiang Long2
94% of researchers rate our articles as excellent or good
Learn more about the work of our research integrity team to safeguard the quality of each article we publish.
Find out more
ORIGINAL RESEARCH article
Front. Mater. , 20 December 2021
Sec. Structural Materials
Volume 8 - 2021 | https://doi.org/10.3389/fmats.2021.801452
This article is part of the Research Topic Strain Hardening Cementitious Composites: material development, performance characterization, structural, and 3D printing applications View all 13 articles
The bond performance between steel bar and cement-based materials was the prerequisite for the two materials to work together, and previous studies showed that the bond behavior of the steel bars and cement-based materials will vary with the kinds of cement-based materials. For this reason, this paper adopted 12 direct pullout test specimens including three types of concrete and two types of steel bars. The strain of the steel bar at six measuring points was measured with a strain gauge. Based on the measured strain and free end slip of the steel bars, the distribution of steel stress, bond stress, and relative slip and the bond slip relation along the anchorage length were obtained and analyzed for different concrete and different steel bars. Based on these test results of steel strain and relative slip at six measuring points, the anchorage position function could be established in consideration of anchorage position, which was conducive to the establishment of an accurate bond–slip relationship. In addition, the anchorage length of the steel bar in Engineered Cementitious Composites (ECC) calculated from the equilibrium equation of critical limit state is only half of the anchorage length calculated in the current Code for Design of Concrete Structures (GB 50010-2010) in China. It is suggested to establish the critical anchorage length formula suitable for ECC in future studies.
Cement-based materials are widely used in civil buildings, bridges, tunnels, and other fields because of its advantages of convenient supply of raw material, low cost, good durability, and so on (Fu et al., 2021; Lei et al., 2021; Lam et al., 2021; Wang et al., 2020; Wang et al., 2021a; Wang et al., 2021b; Zhang et al., 2021). As one of the advanced cement-based materials, Engineered Cementitious Composites (ECC) has received more and more attention from both engineers and researchers because of its superior strain-hardening behavior, crack control capability, and ductile property (Cai et al., 2021; Hu et al., 2019; Xiong et al., 2021a; Xiong et al., 2021b; Yu et al., 2021; Yu et al., 2017; Zhou et al., 2019). Experimental studies have confirmed that the ultimate tensile strain of ECC could exceed 3%, which is about 100–300 times as large as that of ordinary concrete and 5-10 times as large as that of steel bar (Li et al., 2002; Xu and Wang 2008). The bond performance between steel reinforcement and cement-based materials was the prerequisite for the two materials to work together and played an important role in ensuring reliable force transfer from the steel reinforcement to surrounding cement-based materials. Effective bonding between the steel bar and the cement-based material is essential for the two materials to work stably and cooperatively. Poor bonding performance will weaken the load-bearing capacity of the component, which will lead to structural failure.
Over the past years, many scholars have carried out some investigations on the bond performance of steel bars in ECC. Wang et al. (2015) carried out pullout tests to evaluate the influences of the properties of matrix materials on the bond behaviors between BFRP bars and cementitious materials and found that the bond strength of the ECC specimen was higher than that of the cement mortar specimen under the same cover thickness and embedment length. Lee et al. (2016) found that the bond strength between steel reinforcement and ECC could be significantly higher than that between steel reinforcement and normal concrete. Deng et al. (2018) carried out direct pullout tests of the steel bar in ECC by changing the bar diameter, bar shape, cover thickness, fiber volume content, and ECC strength and found that the ultimate bond strength of ECC and steel bars is better than the extreme bond strength of ordinary concrete and steel bars. Deng et al. (2018) also built the position function and proposed an accurate bond–slip relationship according to the distribution of bond stress along the anchorage length. Cai et al. (2020) investigated the bond–slip performance of steel reinforcement embedded in ECC as well as concrete and found that the bond strength between steel reinforcement and ECC was higher than that between steel reinforcement and concrete due to the superior tensile ductility of ECC. Xiao et al. (2021) carried out an direct pullout experiment to explore the influence of rebar diameter and type, cover layer thickness, embedment length, and fiber volume content on the bond behavior of the rebar embedded in ECC and found that as the embedment length increased, the bond stress distribution in the bonded section became increasingly nonuniform. Huang et al. (2020) examined the variation in bond stress along the anchorage length of glass fiber reinforced polymer (GFRP) bar tendons via strain gauges attached to the GFRP bars and established a more accurate bond stress and slip constitutive model of the GFRP bars and concrete. Hossain et al. (2020) performed pullout tests on specimens with different parameters such as bar type, bar diameter, embedded length, and concrete types to study the bond strength between GFRP bars and ECC and found that the bond strengths of GFRP bars embedded in the ECC were larger than that embedded in the normal concrete. As the foundation of finite element analysis and engineering design of reinforced concrete, the bond–slip relationship between steel bar and concrete will directly affect the reliability of analysis results. Krstulovic-opara et al. (1994) found that the bond performance was significantly affected by the tensile strength and strain capacity of the matrix. Therefore, compared with traditional cement-based materials such as concrete and fiber-reinforced concrete, the bond performance of steel bar in ECC may be quite different.
In the past few years, many studies have been conducted on the bond performance of deformed steel bars in concrete under service periods. According to the test results, various bond strength models and bond stress–slip constitutive models have been proposed assuming that the bonding stress is uniformly distributed over the embedded length, and the average bond stress is equal to the applied load divided by the contact area between the steel bar and the surrounding concrete (Zhao and Jin 2002). However, in practical engineering, the distribution of bond stress is different along the anchorage length. Therefore, it is necessary to take this difference into account to establish a more accurate bond–slip relationship. Previous studies have shown that the tensile strength and strain capacity of the matrix had a major impact on the bonding performance (Krstulovic-Opara et al., 1994; Choi et al., 2017). Therefore, the bond behavior of the steel bars in ECC may be different from the bond behavior of the steel bars in traditional brittle materials (such as concrete and fiber-reinforced concrete). For this reason, this paper adopted twelve direct pullout test specimens including three types of concrete and two types of steel bars. The strain of the steel bar at six measuring points was measured with strain gauges. Bonding stress could be calculated by these strains of the steel bar. Based on these test results of steel strain and relative slip at six measuring points, an accurate bond–slip relationship could be established in consideration of anchorage position.
Engineered cementitious composites (ECC), normal strength concrete (NSC), and steel fiber-reinforced concrete (SFRC) were constituted with the mixture formulations provided in Table 1. The ECC and SFRC both contained Ordinary Portland cement (P.O 42.5R), Class Ⅰ high-calcium fly ash, silica sand, superplasticizer, and water. The difference between the ECC and SFRC is that polyvinyl alcohol (PVA) fiber is used in ECC, while steel fiber concrete contains steel fiber. The characteristics of PVA fiber and steel fiber used in this study are listed in Table 2. The NSC contained Ordinary Portland cement (P.O. 42.5R), river sand, gravel, water, and superplasticizer. The 28-day average compressive strengths of ECC, NSC, and SFRC are 48, 50, and 75 MPa, respectively.
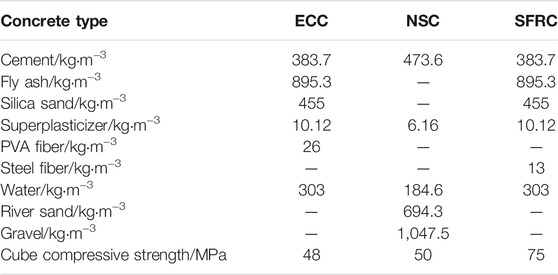
TABLE 1. Mix proportion used for the three types of concrete (by weight).
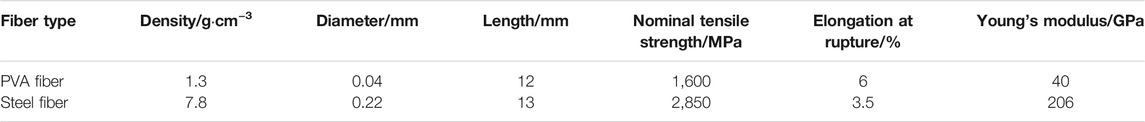
TABLE 2. Characteristics of PVA fiber and steel fiber.
A common horizontal concrete mixer with a volume of 30 l was used to mix the components and prepare cement-based material samples, as shown in Figure 1. The dispersion of PVA fibers in the ECC is a key factor in achieving ideal mechanical properties. In this paper, the clusters of PVA fibers purchased from the market were placed in a plastic mold with a diameter of 150 mm and a height of 300 mm, and then the plastic mold was turned upside down on a smooth wooden board. Then, a demolding gun connected to the demolding air pump was inserted into the small hole at the bottom of the plastic mold, which can make PVA fibers evenly dispersed under the action of the airflow, as shown in Figure 2. The steel fibers were also evenly added into the SFRC mixture during the mixing process in order to avoid the congestion of the steel fibers. In order to test the tensile properties of ECC material, fresh ECC mixtures were poured into standard-size dog bone specimens, as shown in Figure 3A. The results of the tensile performance test showed that the ultimate tensile strain of ECC used in this paper exceeds 3% and met the requirements of ECC, as shown in Figure 3B. The design value of the tensile strength
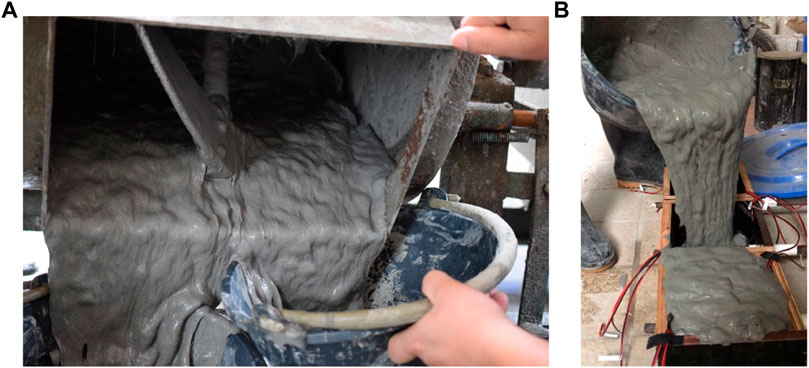
FIGURE 1. Production process of ECC specimens: (A) ECC material that has been stirred and (B) specimen casting.
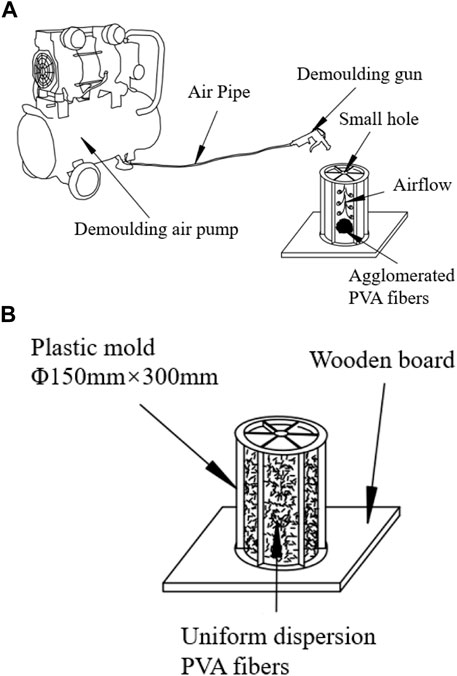
FIGURE 2. The uniform dispersion PVA fiber by a demolding air pump: (A) before PVA fiber dispersion and (B) after PVA fiber dispersion.
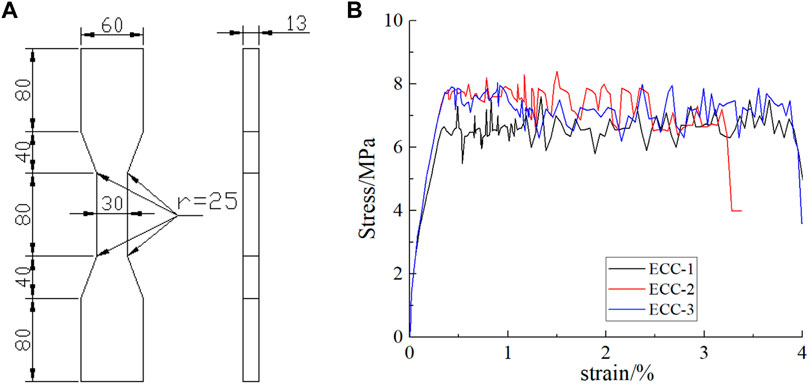
FIGURE 3. Design and tensile property of the adapted ECC in the experiment: (A) dimension of dog-bone specimen (Unit mm) and (B) tensile stress–strain curves of ECC.
The pullout test is one of the most widely used test methods on investigating the bond performance between steel bar and cement-based materials due to the convenience of specimen manufacturing, the simple operation of test apparatus, and the easy analysis of the test results. In this paper, the pullout test was employed to study the bond performance between steel bar and cement-based materials. Direct pullout test specimen is to embed a steel bar horizontally into the concrete cube along its central axis. In order to ensure that the thickness of the protective layer is sufficient to make the failure mode of the specimen result in pullout failure, the side length of the concrete cube was designed to be 160 mm. A PVC pipe with a length of 60 mm was placed in the nonbonded region in the concrete cube, and the PVC pipe was filled with polyurethane foam to avoid concrete flowing into it during casting. The steel bar extends 50 mm from the free end and 360 mm from the loading end, and the length of the bond region was 100 mm, as shown in Figure 4. The experiment was divided into four groups, each of which consisted of three identical test specimens. The type of concrete used in the first three groups was different, and the type of steel bar used in the last group was different. Within the 100-mm anchorage length of each specimen, six strain gauges were pasted at equal intervals, each about 20 mm apart, as shown in Figure 4. The symbol E-C16 represents that the concrete of the specimen was ECC and the steel bar was ribbed steel bar with a diameter of 16 mm. The symbol E-C16R denoted that the concrete of the specimen was ECC and the steel bar was a plain round bar with a diameter of 16 mm. The symbol P-C16 meant that the concrete of the specimen was normal concrete and the steel bar was ribbed steel bar with a diameter of 16 mm. The symbol SF-C16 indicated that the concrete of the specimen was SFRC and the steel bar was ribbed steel bar with a diameter of 16 mm. The yield strength of the ribbed steel bar was 415.06 MPa and the yield strength of the plain round bar was 252.99 MPa and the testing data can be found in the literature (Xiao et al., 2021).
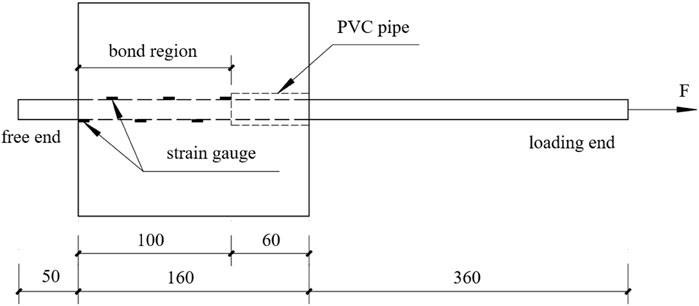
FIGURE 4. Details of test specimen (Unit: mm).
The pullout test was carried out on the experimental machine shown in Figure 5. The concrete specimens with the embedded steel bar were placed in a self-made steel frame, which consisted of two 25-mm-thick square steel plates. The two square steel plates were connected to each other by four 20-mm-diameter steel rods located at the corners. The distance between the two steel plates was set to 50 cm to ensure there was sufficient space for the installation of linear variable differential transformers (LVDTs). There was a 30-mm-diameter hole in the center of the steel frame bottom plate to allow the steel bar to pass through. A universal testing machine with a maximum tensile force of 1,000 kN was adopted to apply the pullout load. The pullout load was applied at a rate of 0.5 mm/min in displacement loading mode until failure. Assuming that the bond stress is uniformly distributed along the longitudinal direction, the formula below can be used to calculate the average bond strength between steel bar and concrete:
where P denotes the pullout force, d represents the diameter of the steel bar, and
Since the BF segment was long and near the loading end, the loading force was large, and the deformation generated could not be ignored. Therefore, the deformation of the BF segment should be taken into consideration when calculating the net slip of the loading end. The deformation of the steel bar in segmented BF could be expressed as
where
Therefore, the average relative slip of the steel bar and the matrix along the anchorage section could be expressed as follows:
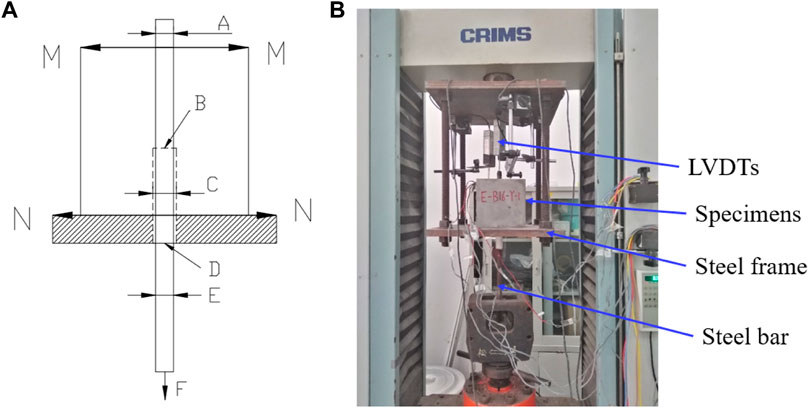
FIGURE 5. Schematic diagram of loading apparatus and measurement position: (A) diagrammatic view and (B) photograph.
The relationship of bond stress and slip was one of the most important experimental results for studying the bond performance between steel bars and concrete. The stress–slip relationships of the pullout tests of the four groups of the specimens in this paper are shown in Figure 6. For ordinary concrete P-C16, when the slip increased to about 1.5 mm, the tensile force slowly approached the ultimate load, and when the bond stress reached the maximum value, the concrete split due to the hoop tensile force exceeded the tensile strength of the concrete. The width of the cracks formed was relatively large in the form of brittle failure. For the SFRC SF-C16, the failure mode of SF-C16 was different from the failure mode of P-C16. Although there was a large crack the same as P-C16, the concrete of SF-C16 specimen did not split with brittle sound, forming a shear failure mode. In addition, the phenomenon of some steel fibers sinking was observed during casting of the concrete specimens, so the bond strength was lower than the results of other scholars, and the slip was lower than that of P-C16, which may be that the fiber sinking reduced the bond performance of steel bar and SFRC. Compared with P-C16 and SF-C16, the crack forms of specimen E-C16 were different. Although the failure mode was also shear failure, the surface of ECC specimen would find fine and intensive cracks that were hard to be observed by the naked eyes. The cracks were radially distributed from the center to the edge, and the number of the cracks on the surface of E-C16 was much more than that on the surface of P-C16 and SF-C16. This is attributed to that ECC had excellent crack control capability and ductile property. However, the shear strength of the pullout test ECC specimen E-C16R with a plain round bar was relatively small. At the initial stage, the shear stress of E-C16R was mainly supported by the chemical adhesion. Once the slip reached a certain value, the bond stress would decrease, and the slip would increase. The steel bar would be pulled out from the ECC, and it was difficult to find cracks on the surface of the specimen E-C16R, indicating that the bond performance was poor.
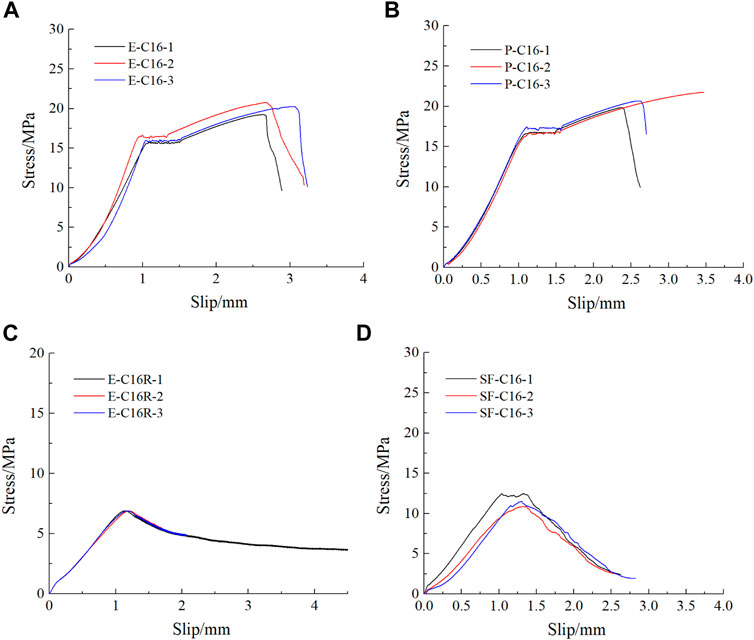
FIGURE 6. Bond–slip curve: (A) E-C16, (B) P-C16, (C) E-C16R, and (D) SF-C16.
Since the strains of the steel bar under different loading levels could be measured by the strain gauges attached to the steel bar, the stress distribution of the steel bar along the anchorage length could be calculated, as shown in Figure7. The steel tension gradients of E-C16 and SF-C16 were the same, and their steel tension force started from 6 to 30 kN. The steel tension gradients of P-C16 were twice those of E-C16 and SF-C16 and the steel tension force of P-C16 started from 12 to 60 kN. As the bond strength of the specimen E-C16R was small, the tensile force of the steel bar was small as well and the steel tension force of E-C16R started from 1.5 to 3.5 kN. It is shown in Figure 7 that the stress distribution curves of the steel bars along the anchorage length were similar in the four types of specimens. The stresses of the steel bars were relatively gentle at the loading end and free end, but relatively steep in the middle. As the load increased, the stress of the steel bar at the loading end increased, but the free end did not change much. The comparison between the specimen E-C16 and SF-C16 showed that the gradient of the steel bar stress variation of E-C16 was smaller than that of SF-C16. This meant that the steel bar stress of E-C16 was relatively stable with the variation of the anchoring position. The stresses of the steel bars of E-C16 at the free end were obviously larger than those of SF-C16 with the increase in the reinforcement pulling force. This showed that the PVA fibers played a good bridge effect on the concrete matrix. When the tension force of the steel bar was the same, the stress of the steel bar in P-C16 at each anchorage position was larger than that in E-C16 and SF-C16. The stress gradient of the steel bar in P-C16 was relatively obvious, which indicated that the bond strength of P-C16 was relatively high. With the increase in the tension force of the steel bar, the stress of the steel bar in E-C16R showed a great change at the loading end, while the stress of the steel bar at the distance of 60 mm from the loading end decreases almost to zero. Such an obvious change indicated that the anchorage performance of E-C16R was significantly lower than that of the ribbed steel bar.
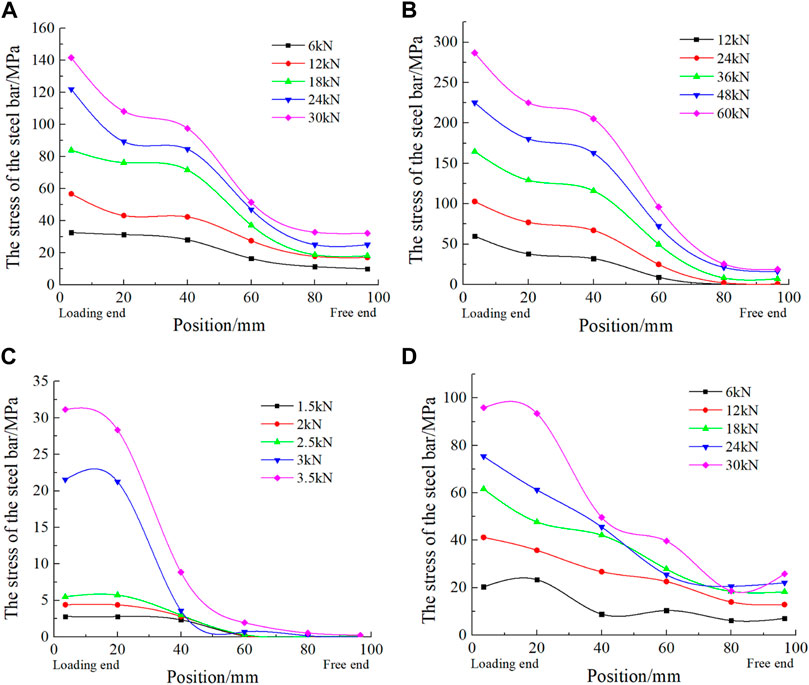
FIGURE 7. Distribution rule of the stress of the steel bar along the anchorage length: (A) E-C16, (B) P-C16, (C) E-C16R, and (D) SF-C16.
In this paper, the strain gauge pasted on the surface of the steel bar was used to measure the strain of the steel bar at six measurement points along the bond region. Then the bond stress at each measurement point instead of the average stress of each interval was directly calculated according to the calculation method adopted in reference Xu and Wang (2008). Assuming that the strain of the steel bar was smoothly distributed in the bond region, and the bond region was divided into five sections by the measurement points, and the length of each section was h, the following formulas can then be obtained:
Eq. 7 is subtracted from Eq. 6:
Take the derivative of Eq. 9 and substitute it into the right-hand side of Eq. 8:
Ignore the error term and arrange
The following formula can be obtained from the microsegment equilibrium of the steel bar, as shown in Figure 8:
Substitute Eq. 12 into Eq. 11 to obtain the following formula:
Considering that its boundary conditions were
where
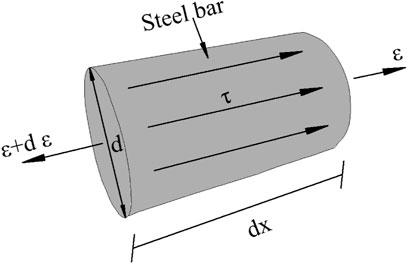
FIGURE 8. The microsegment equilibrium of steel bar.
Through Eq. 14, the bond stress under different uniaxial tensile loads was calculated. If these bond stresses were added up along the anchorage length, the bond stress multiplied by the circumference of the steel bar should be equal to the load applied to the steel bar at the loading end. If there was any difference between the two forces, the negative of the difference value should be adjusted according to the principle of equal distribution. Then, a smooth curve was used to express the general trend of the variations of the bond stress along the anchorage length, so that the area under the curve of bond stress distribution multiplied by the circumference of the steel bar was equal to the load applied to the steel bar at the loading end, and the curve of the distribution of bond stress along the anchorage length was obtained, as shown in Figure 9. The distance from the free end was defined as the X-coordinate, and the calculated stress in each strain recording point was defined as the Y-coordinate.
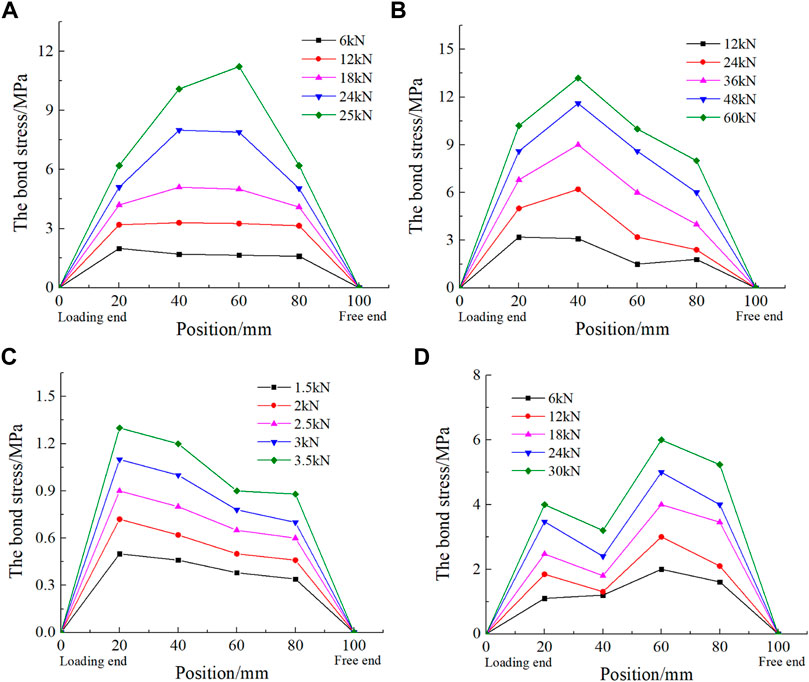
FIGURE 9. The relationship between bond stress and anchorage position: (A) E-C16, (B) P-C16, (C) E-C16R, and (D) SF-C16.
As is shown in Figure 9, no matter what kind of specimens, the distribution of bond stress along the anchorage length had a similar trend. That is, at each tensile load level, the stress along the anchorage length increased from the free end to the loading end. There were also some differences in the distribution of bond stress along the anchorage length for different specimens. For specimen E-C16, with the increase of the load applied to the steel bar at the loading end, the position of the maximum bond stress gradually approached the free end, and the stress in the middle of the anchorage position gradually became plump, indicating that the PVA fiber played a good bridging role. For specimen P-C16, at the initial stage of loading, the position of the maximum bond stress was close to the loaded end, but with the increase in the load applied to the steel bar at the loaded end, the stress at 60 mm away from the loaded end became plump and bore most of the tension force, gradually becoming the maximum bond stress. For specimen SF-C16, with the increase in tension force, the bond stress peak values of the specimen appeared at 20 and 60 mm away from the loading end. The peak points of the bond stress moved right with the increase in the tensile force. It was speculated that the good connection of steel fiber left and right hooks made the concrete work well together. For specimen E-C16R, the peak points of the bond stress mainly appeared at 40 mm away from the loading end, and the peak value of its bond stress at each tensile load level was far less than that of the specimen with the ribbed steel bar.
From the measured slip of the loading end and the free end, the slip between steel bar and cement-based material at any position in the anchorage length could be calculated. It meant that this slip could be determined by the displacement difference between reinforcing bar and cement-based material at each point. In the test, the strain of the steel bar
After obtaining the deformation of each microsegment and the deformation of the cement-based materials, the nonuniform deformation coefficient
The relative slip
where x is the distance away from the free end and h is the length of the bond region. According to the above method, the relative slip of the steel bar and cement-based materials at each point within the anchorage length could be calculated under any load, as shown in Figure 10.
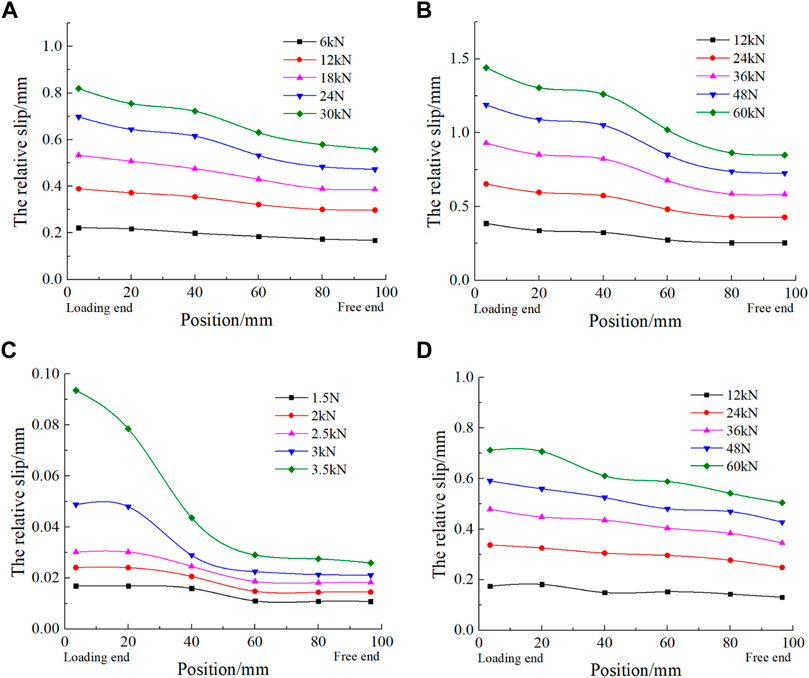
FIGURE 10. Relationship between slip and position: (A) E-C16, (B) P-C16, (C) E-C16R, and (D) SF-C16.
According to the result as shown in Figure 10, in the case of 12 and 24 kN, the relative slip fitting of the SFRC SF-C16 was very smooth, indicating that the adhesion force of the free end of the steel bar was lost at the early stage of the experiment and the shear lag effect was not obvious. However, for normal concrete specimens P-C16, the slip at the loading end was larger than that at the free end, and the shear lag effect occurred. For the E-C16 member with high toughness, the concrete integrity became better due to the connection between aggregates through PVA fiber with good hydrophilicity. The difference between the relative slip of the loading end and the relative slip of the free end was not particularly obvious, which indicated that ECC had good toughness and high ductility. Compared with specimen E-C16, it was obvious that the bond performance of E-C16R was very poor. Although the difference between the relative slip of the loading end and the relative slip of the free end was also not particularly obvious in the early stage, at the moment of the failure, the difference between the relative slip of the loading end and the relative slip of the free end became larger and the shear lag effect occurred.
Since the bond stress between steel bar and cement-based materials along the anchorage length would vary with the position, it was impossible to measure every strain of the steel bar along the anchorage length. In this paper, the bond–slip relationship was studied according to the anchorage points glued with strain gauges. Assuming that there was a bond–slip relationship at each measuring point, each specimen had a bond–slip relationship at the anchorage positions of 20, 40, 60, and 80 mm. According to the bond stress and its corresponding slip at each point along the anchorage length of the steel bar under all levels of load mentioned above, the bond–slip expressions at different positions could be fitted. After several trial calculations, it was found that the bond–slip relation at different anchorage points could be fitted by a cubic polynomial as follows:
where
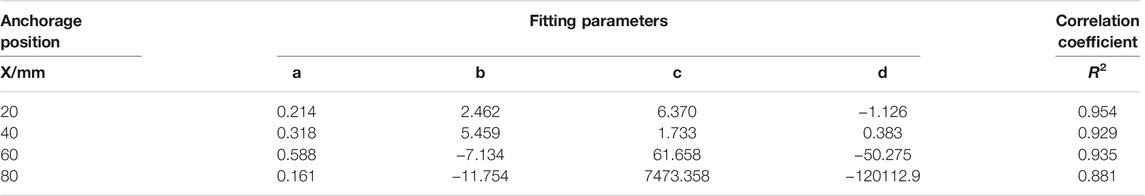
TABLE 3. The fitting result for the bond-slip relation of specimens E-C16.
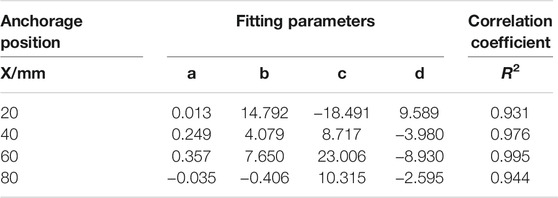
TABLE 4. The fitting result for the bond–slip relation of specimens P-C16.
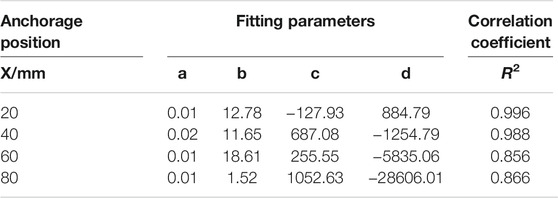
TABLE 5. The fitting result for the bond–slip relation of specimens E-C16R.
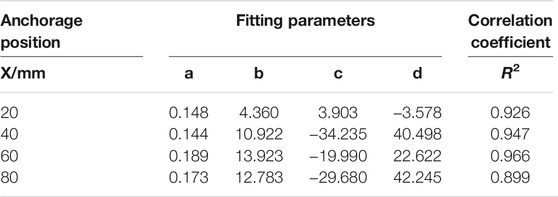
TABLE 6. The fitting result for the bond–slip relation of specimens SF-C16.
Figure 11 shows the bond slip curves of each specimen at different positions along the anchorage length in the loading process. It can be seen from the figure that the bond stress was not uniformly distributed at different anchorage points, but varied, obeying the cubic polynomial. Therefore, it was necessary to use the bonding test to establish the bond slip constitutive relation considering the influence of anchorage position.
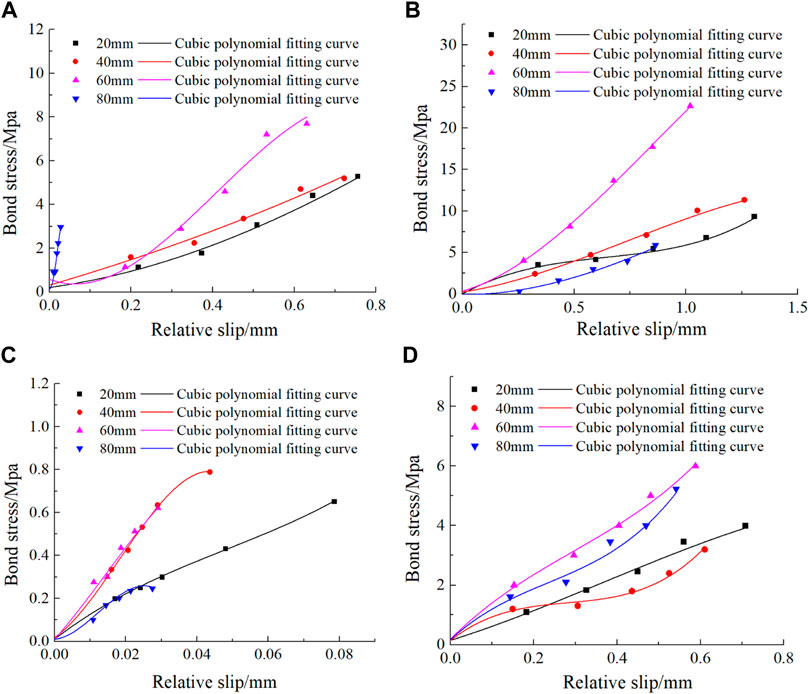
FIGURE 11. The relationship between bond stress and relative slip at different anchorage positions: (A) E-C16, (B) P-C16, (C) E-C16R, and (D) SF-C16.
The anchorage position function was a relative function that described the relative magnitude of the bond stiffness at different positions. Generally, the following methods were used to obtain the following: according to the abovementioned, the curve of the variation law of steel stress along the anchorage length was obtained firstly, and then the distribution of bond stress along the anchorage length was obtained by the stress of the steel bar. Next, the curve of the variation law of the relative slip along the anchorage length was drawn, and finally the distribution curve of bond stress

FIGURE 12. Position function: (A) E-C16, (B) P-C16, (C) E-C16R, and (D) SF-C16.
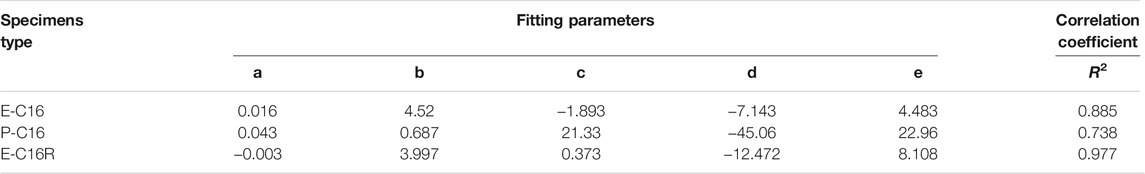
TABLE 7. The fitting results of specimens E-C16R, E-C16, and P-C16 at different anchorage positions.
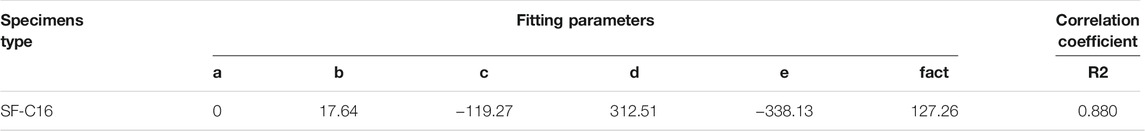
TABLE 8. The fitting results of specimens SF-C16 at different anchorage positions.
According to Tables 7, 8; Figure 12 above, the anchorage position functions of four different kinds of specimens could be obtained. The anchorage position function of the specimens E-C16 is as follows:
The anchorage position function of the specimens P-C16 is as follows:
The anchorage position function of the specimens E-C16R is as follows:
The anchorage position function of the specimens SF-C16 is as follows:
Since the number of test specimens was limited, the anchorage position function of the steel bars and cement-based materials discussed herein was mainly for comparison, and by comparison, the expression function varied with the change of cement-based materials. The bond–slip relation obtained by the pullout test could not reflect the influence of bond position, but in fact, the bond–slip constitutive relation varied with anchorage position. In order to describe this variation, an anchorage position function could be determined on the basis of the basic bond–slip relationship that was already known, and the bond–slip constitutive relation along anchorage length was expressed by multiplying the basic bond–slip relationship with the anchorage position function. The basic bond–slip relation adopted the average bond–slip constitutive relation
where
There are two kinds of failure modes for the steel bar embedded in ECC under the tension force F: one is failure due to the steel bar being pulled apart; the other is failure due to the interface between the steel bar and ECC being sheared off. For the determined steel bar and ECC, the yield stress of the steel bar is a determined value, while the anchorage force applied by the ECC on the steel bar increases with the increase of the anchoring length La. When the anchorage length increases to a certain value, the anchorage force can be equal to the yield force of the steel bar, which means the anchorage failure occurs simultaneously with the yield of the steel bar. This particular anchorage length is called the “critical anchorage length.” The state in which the anchorage force is equal to the yield force of the steel bar is called “anchorage limit state.” It can be seen that the critical anchorage length is actually the minimum anchorage length that the steel bar cannot be pulled out in ECC when the tension force F reaches the yield force of the steel bar. The anchorage limit state is the state that the yield stress of the steel bar and the ultimate bond stress between the steel bar and ECC reach at the same time. Assume that under the critical limit state, the critical anchorage length of the steel bar in ECC is
The relation between the force F applied on the steel bar and the yield strength of the steel bar
The calculation formula of critical anchorage length
In this paper, the diameter of the ribbed steel bar is 16 mm, the yield strength of the ribbed steel bar is 400 MPa, and the design value of ECC’s tensile strength is 4.58 MPa. By substituting these values into Eq. 25, the critical anchorage length of the ribbed steel bar in ECC can be calculated to be 97 mm (
However, in the current Code for Design of Concrete Structures (GB 50010-2010) in China, when making full use of the tensile strength of the steel bar, the anchorage length of tensile steel bar should be calculated as follows:
where
In this paper, experimental results for the influence of concrete type and steel bar type on the bond performance between steel bar and cement-based materials through the pullout test were presented and discussed. From this investigation, the following conclusions can be drawn:
1) Compared with failure modes of the pull-out specimens containing normal concrete (P-C16) and SFRC (SF-C16), it was found that fine and intensive cracks that were hard to be observed by naked eyes appeared on the surface of the pullout specimens containing ECC (E-C16). These cracks of E-C16 were radially distributed from the center to the edge, and the number of the cracks on the surface was much more than that on the other two specimens. This showed that ECC had excellent crack control capability and ductile property.
2) The strain of the steel bar at six measuring points was measured with strain gauge. Based on the measured strain and free end slip of the steel bars, the distribution of steel stress, bond stress, and relative slip and the bond slip relation along the anchorage length were obtained and analyzed for different concrete and different steel bars. Anchorage position function was established in consideration of anchorage position, which was conducive to the establishment of an accurate bond–slip relationship.
3) It was safe and conservative to use the calculation formula of critical anchorage length in the current Code for Design of Concrete Structures (GB 50010-2010) in China to calculate the critical anchorage length of the steel bar in ECC. It is suggested to establish the critical anchorage length formula suitable for ECC in future studies.
Yuexiu Transport Infrastructure Co., Ltd. is mainly engaged in the investment, construction and operation management of toll highways, bridges and ports in Guangdong province and other high-growth provinces of China. In order to extend the service life of the bridge deck and substructure and to reduce material consumption over the life of the bridge and highway, all the authors participated the project on engineered cementitious composite materials and expect to particularly replace the traditional concrete expansion joints.
The original contributions presented in the study are included in the article/supplementary material; further inquiries can be directed to the corresponding author.
JX, XL, and HJ conceived and designed the study. MY, LL, FM, and DD performed the experiments. JX, MY, and ZH wrote the paper. JX, XL, and HJ reviewed and edited the manuscript. All authors contributed to the article and approved the submitted version.
The research presented was funded by the National Natural Science Foundation of China (51778150) and the National Natural Science Foundation of China (51808133), Natural Science Foundation of Guangdong Province in China (2016A030313699), and Guangzhou Municipal Science and Technology Project China (201804010422).
XL and MY were employed by the company Yuexiu Transport Infrastructure Co., Ltd.
The remaining authors declare that the research was conducted in the absence of any commercial or financial relationships that could be construed as a potential conflict of interest.
All claims expressed in this article are solely those of the authors and do not necessarily represent those of their affiliated organizations, or those of the publisher, the editors, and the reviewers. Any product that may be evaluated in this article, or claim that may be made by its manufacturer, is not guaranteed or endorsed by the publisher.
The authors would like to thank the National Natural Science Foundation of China for funding this project. The laboratory of school of civil and transportation engineering at Guangdong University of Technology is also gratefully acknowledged for providing all the resources required for this work.
Cai, J., Pan, J., Tan, J., and Li, X. (2020). Bond Behaviours of Deformed Steel Rebars in Engineered Cementitious Composites (ECC) and concrete. Construction Building Mater. 252, 119082. doi:10.1016/j.conbuildmat.2020.119082
Cai, Z., Liu, F., Yu, J., Yu, K., and Tian, L. (2021). Development of Ultra-high Ductility Engineered Cementitious Composites as a Novel and Resilient Fireproof Coating. Construction Building Mater. 288, 123090. doi:10.1016/j.conbuildmat.2021.123090
Choi, W.-C., Jang, S.-J., and Yun, H.-D. (2017). Bond and Cracking Behavior of Lap-Spliced Reinforcing Bars Embedded in Hybrid Fiber Reinforced Strain-Hardening Cementitious Composite (SHCC). Composites B: Eng. 108, 35–44. doi:10.1016/j.compositesb.2016.09.086
Deng, M., Pan, J., and Sun, H. (2018). Bond Behavior of Steel Bar Embedded in Engineered Cementitious Composites under Pullout Load. Construction Building Mater. 168, 705–714. doi:10.1016/j.conbuildmat.2018.02.165
Fu, C., Fang, D., Ye, H., Huang, L., and Wang, J. (2021). Bond Degradation of Non-uniformly Corroded Steel Rebars in concrete. Eng. Structures 226, 111392. doi:10.1016/j.engstruct.2020.111392
Hossain, K. M. A., Alam, S., Anwar, M. S., and Julkarnine, K. M. Y. (2020). Bond Strength of Fibre-Reinforced Polymer Bars in Engineered Cementitious Composites. Proc. Inst. Civil Eng. - Construction Mater. 173 (1), 1–13. doi:10.1680/jcoma.17.00020
Hu, B., Zhou, Y., Xing, F., Sui, L., and Luo, M. (2019). Experimental and Theoretical Investigation on the Hybrid CFRP-ECC Flexural Strengthening of RC Beams with Corroded Longitudinal Reinforcement. Eng. Structures 200, 109717. doi:10.1016/j.engstruct.2019.109717
Huang, H., Yuan, Y., Zhang, W., Hao, R., and Zeng, J. (2020). Bond Properties between GFRP Bars and Hybrid Fiber-Reinforced concrete Containing Three Types of Artificial Fibers. Construction Building Mater. 250, 118857. doi:10.1016/j.conbuildmat.2020.118857
Krstulovic-Opara, N., Watson, K. A., and Lafave, J. M. (1994). Effect of Increased Tensile Strength and Toughness on Reinforcing-Bar Bond Behavior. Cement and Concrete Composites 16 (2), 129–141. doi:10.1016/0958-9465(94)90007-8
Lam, L., Huang, L., Xie, J.-H., and Chen, J.-F. (2021). Compressive Behavior of Ultra-high Performance concrete Confined with FRP. Compos. Structures 274, 114321. doi:10.1016/j.compstruct.2021.114321
Lee, S. W., Kang, S.-B., Tan, K. H., and Yang, E.-H. (2016). Experimental and Analytical Investigation on Bond-Slip Behaviour of Deformed Bars Embedded in Engineered Cementitious Composites. Construction Building Mater. 127, 494–503. doi:10.1016/j.conbuildmat.2016.10.036
Lei, W., Zeng, X., Yang, H., and Lv, X. (2021). Investigation and Application of Fractal Theory in Cement-Based Materials: A Review. Fractal Fractional 5 (4), 247. doi:10.3390/fractalfract5040247
Li, V. C., Wu, C., Wang, S. X., Ogawa, A., and Saito, T. (2002). Interface Tailoring for Strain-Hardening Polyvinyl Alcohol Engineered Cementitious Composite (PVA-ECC). ACI Mater. J. 99 (5), 463–472. doi:10.1016/S0042-207X(02)00187-2
Wang, H., Sun, X., Peng, G., Luo, Y., and Ying, Q. (2015). Experimental Study on Bond Behaviour between BFRP Bar and Engineered Cementitious Composite. Construction Building Mater. 95, 448–456. doi:10.1016/j.conbuildmat.2015.07.135
Wang, L., Guo, F., Lin, Y., Yang, H., and Tang, S. W. (2020). Comparison between the Effects of Phosphorous Slag and Fly Ash on the C-S-H Structure, Long-Term Hydration Heat and Volume Deformation of Cement-Based Materials. Construction Building Mater. 250, 118807. doi:10.1016/j.conbuildmat.2020.118807
Wang, L., Jin, M., Zhou, S., Tang, S., and Lu, X. (2021a). Investigation of Microstructure of C-S-H and Micro-mechanics of Cement Pastes under NH4NO3 Dissolution by 29Si MAS NMR and Microhardness. Measurement 185, 110019. doi:10.1016/j.measurement.2021.110019
Wang, L., Li, G., Li, X., Guo, F., and Tang, S. (2021b). Influence of Reactivity and Dosage of MgO Expansive Agent on Shrinkage and Crack Resistance of Face Slab concrete. Cement and Concrete Composites 125, 104333. doi:10.1016/j.cemconcomp.2021.104333
Xiao, J., Long, X., Ye, M., Jiang, H., Liu, L., and Zhai, K. (2021). Experimental Study of Bond Behavior between Rebar and PVA-Engineered Cementitious Composite (ECC) Using Pull-Out Tests. Front. Mater. 8, 15. doi:10.3389/fmats.2021.633404
Xiong, Y., Xu, G., Wu, D., Fang, S., and Tang, Y. (2021a). Investigation of Using the Ceramic Polishing brick Powder in Engineered Cementitious Composites. J. Building Eng. 43, 102489. doi:10.1016/j.jobe.2021.102489
Xiong, Y., Yang, Y., Fang, S., Wu, D., and Tang, Y. (2021b). Experimental Research on Compressive and Shrinkage Properties of ECC Containing Ceramic Wastes under Different Curing Conditions. Front. Mater. 8, 1. doi:10.3389/fmats.2021.727273
Xu, S., and Wang, H. (2008). Experimental Study on Bond-Slip between Ultra High Toughness Cementitious Composites and Steel Bar. Eng. Mech. 25 (11), 53–061. doi:10.1016/S1872-5791(08)60058-5
Yu, K., McGee, W., Ng, T. Y., Zhu, H., and Li, V. C. (2021). 3D-printable Engineered Cementitious Composites (3DP-ECC): Fresh and Hardened Properties. Cement Concrete Res. 143, 106388. doi:10.1016/j.cemconres.2021.106388
Yu, K. Q., Wang, Y. C., Yu, J. T., and Xu, S. L. (2017). A Strain-Hardening Cementitious Composites with the Tensile Capacity up to 8. Construction Building Mater. 137, 410–419. doi:10.1016/j.conbuildmat.2017.01.060
Zhang, J., Huang, J., Fu, C., Huang, L., and Ye, H. (2021). Characterization of Steel Reinforcement Corrosion in concrete Using 3D Laser Scanning Techniques. Construction Building Mater. 270, 121402. doi:10.1016/j.conbuildmat.2020.121402
Zhao, Y., and Jin, W. (2002). Test Study on Bond Stress-Slip Relationship of concrete and Steel Bar. J. Building Structures 23 (1), 32–37. doi:10.1007/BF02960786
Keywords: bond-behavior, engineered cementitious composite, pull-out tests, anchorage position function, critical anchorage length
Citation: Xiao J, Long X, Ye M, Jiang H, Liu L, Mo F, Deng D and Huang Z (2021) Bond–Slip Law Between Steel Bar and Different Cement-Based Materials Considering Anchorage Position Function. Front. Mater. 8:801452. doi: 10.3389/fmats.2021.801452
Received: 25 October 2021; Accepted: 15 November 2021;
Published: 20 December 2021.
Edited by:
Kequan Yu, Tongji University, ChinaReviewed by:
Lei Wang, Xi’an University of Architecture and Technology, ChinaCopyright © 2021 Xiao, Long, Ye, Jiang, Liu, Mo, Deng and Huang. This is an open-access article distributed under the terms of the Creative Commons Attribution License (CC BY). The use, distribution or reproduction in other forums is permitted, provided the original author(s) and the copyright owner(s) are credited and that the original publication in this journal is cited, in accordance with accepted academic practice. No use, distribution or reproduction is permitted which does not comply with these terms.
*Correspondence: Haibo Jiang, aGJqaWFuZ0BnZHV0LmVkdS5jbg==
Disclaimer: All claims expressed in this article are solely those of the authors and do not necessarily represent those of their affiliated organizations, or those of the publisher, the editors and the reviewers. Any product that may be evaluated in this article or claim that may be made by its manufacturer is not guaranteed or endorsed by the publisher.
Research integrity at Frontiers
Learn more about the work of our research integrity team to safeguard the quality of each article we publish.