 Alexander D. Greenhalgh1
 Liurukara D. Sanjeewa2Piotr Luszczek3
 Vasileios Maroulas4Orlando Rios1
 David J. Keffer1*†
- 1Department of Material Science and Engineering, University of Tennessee, Knoxville, TN, United States
- 2University of Missouri Research Reactor, Columbia, MO, United States
- 3Department of Electrical Engineering and Computer Science, University of Tennessee, Knoxville, TN, United States
- 4Department of Mathematics, University of Tennessee, Knoxville, TN, United States
As a powerful analytical technique, atom probe tomography (APT) has the capacity to acquire the spatial distribution of millions of atoms from a complex sample. However, extracting information at the Ångstrom-scale on atomic ordering remains a challenge due to the limits of the APT experiment and data analysis algorithms. The development of new computational tools enable visualization of the data and aid understanding of the physical phenomena such as disorder of complex crystalline structures. Here, we report progress towards this goal using two steps. We describe a computational approach to evaluate atomic ordering in the crystal structure by generating radial distribution functions (RDF). Atomic ordering is rendered as the Fractional Cumulative Radial Distribution Function (FCRDF) which allows for greater visibility of local compositions at short range in the structure. Further, we accommodate in the analysis additional parameters such as uncertainty in the atomic coordinates and the atomic abundance to ascertain short-range ordering in APT data sets. We applied the FCRDF analysis to synthetic and experimental APT data sets for Ni3Al. The ability to observe a signal of atomic ordering consistent with the known L12 crystal structure is heavily dependent on spatial uncertainty, irrespective of abundance. Detection of atomic ordering is subject to an upper limit of spatial uncertainty of atoms described with Gaussian distributions with a standard deviation of 1.3 Å. The FCRDF analysis was also applied to the APT data set for a six-component alloy, Al1.3CoCrCuFeNi. In this case, we are currently able to visualize elemental segregation at the nanoscale, though unambiguous identification of atomic ordering at the Ångstrom (nearest-neighbor) scale remains a goal.
Introduction
An unambiguous understanding of structure provides the essential link between developing a predictive relationship between material processing and component performance. Many valuable material characterization techniques provide spatially averaged information on the structure, essential for bulk properties but insufficient for uncovering the nuances that exist in the local ordering of atomic systems. Atom probe tomography (APT) stands out as an analytical technique that targets local structure, due to an ability to resolve spatial coordinates and identities of atoms. The potential for extracting the maximum amount of information from APT data sets motivates the continued exploration of new data analysis techniques.
Routine structural characterization techniques such as powder x-ray diffraction provide important spatially averaged structural information. To investigate local fluctuations within this average, very high-resolution techniques are required. As a state-of-the-art technique, APT has becoming an important tool to study novel materials, such as High Entropy Alloys (HEAs), alloys made with equal proportions of five or more elements, where the distribution of atoms at the atomic level is thought to be crucial to material properties. APT provide a three-dimensional (3D) element mapping allowing scientists to map out the local chemical nature of complex alloys. APT can perform nearly in atomic resolution level and provide quantitative chemical analysis. Furthermore, APT has a high spatial resolution (∼0.1–0.3 nm in depth and 0.3–0.5 nm laterally at best) with high sensitivity (∼10 ppm), and therefore, APT can be used to probe the local atomic structure, averaged-out in bulk property characterization techniques such as powder X-ray diffraction. (Gault et al., 2010a) Because the understanding of multiphase microstructures, segregation at phase boundary and dislocations, local composition fluctuations and unique atomic configurations are a prerequisite for the future development of mechanical properties of HEA, analytical tools such as APT are essential in this field. (Cairney et al., 2015; Marceau et al., 2015; Diao et al., 2019; Kuo et al., 2019; Hu et al., 2020).
Although, APT experiments can provide coordinates of millions of atoms, it is constrained by two primary limitations. The presence of data sparsity (only about one third of atoms are spatially resolved) and noise (uncertainty in the atomic coordinates on the order) are ongoing issues. These issues limit the accurate determination of atomic positions in the crystal structure. Therefore, interpreting atomic ordering on the Ångstrom scale from the APT data has been a great challenge and a subject of great interest among the materials and computational scientific communities. In the past, numerous efforts have generated Radial Distribution Function (RDFs) from APT data (Sudbrack et al., 2004; Sudbrack et al., 2006; Geiser et al., 2007; Haley et al., 2009; Gault et al., 2010b; Blum et al., 2012; Zhou et al., 2013; Hernández-Saz et al., 2016; Dumitraschkewitz et al., 2017; Mukherjee et al., 2017; Zhao et al., 2018; Inoue et al., 2021), however, data integrity remains a fundamental concern. Further, due to limitations in spatial resolution of the APT data, the calculated RDF could be prone to misinterpretation regarding crystal structure and the presence of short-range ordering.
Despite all these limitations, short-range ordering of complex alloys was determine using APT data by employing a computational approach called the generalized multicomponent short-range order (GM-SRO) as a function of atomic radial distances. The GM-SRO method utilizes a shell-based counting of atoms in a three-dimensional (3D) radial distances and it is very similar to the construction of RDF using experimental APT data. (Rentenberger and Karnthaler, 2003; Santodonato et al., 2015; Owen et al., 2017; Qiu et al., 2017; Mo et al., 2019; Pandey et al., 2019) In the data processing, the GM-SRO method can account for limited detector efficiency and spatial resolution of the experimental APT data. In general, a positive value of GM-SRO means a co-segregation (clustering) of a particular atom within a certain crystallographic shell. On the other hand, the negative value of GM-SRO indicates the anti-segregation (ordering) of the considered elements within the crystallographic shell. If the GM-SRO value is zero or very closer to zero, indicates the randomness of the system. Marceau et al. (Marceau et al., 2015) discusses the drawbacks of GM-SRO method in the presence of instrument detector efficiency and the spatial resolution using Fe-Al system. As authors presented, enforcing both detector efficiency and spatial resolution to the GM-SRO calculation leads the GM-SRO values closer to zero indicating the randomness of the structure by obscuring the true nature of the SRO. (De Geuser et al., 2006; Haley et al., 2009; Ceguerra et al., 2012) Because of the limitations of the APT experiment, recent work suggests caution in the interpretation or spatial coordinates. (Gault et al., 2021).
It has also been recently shown that machine learning algorithms, based on topological data analysis, are able to categorize local neighborhoods in experimental APT data sets by crystal structure with near perfect accuracy. (Spannaus et al., 2021) This “material fingerprinting” classification was applied to high-entropy alloy APT datasets containing body-centered cubic (bcc) and face-centered cubic (fcc) crystal structures. Local atomic configurations were assigned a topological descriptor in the form of a persistence diagram, by which it was classified. This work provides an important example, despite the inherent noise in the dataset, that there remains significant information in the atomic coordinates that can be extracted through advanced data analysis techniques.
Therefore, the exploration of new computational methods is essential to understand the nanoscale structure of complex alloys. In HEA research, computational methods can provide very accurate atomic scale information ultimately responsible for materials’ physical behavior. For example, computational methods can be applied to derive the radial distribution function (RDF), which allow us to evaluate the structure of HEAs at the atomistic level. (Plimpton, 1995; Lee et al., 2005; El Azrak et al., 2020) Moreover, it is possible to convert an RDF into a Fractional Cumulative Radial Distribution Function (FCRDF) which allows for greater visibility of local compositions from short to medium range in the structure. Validating computational simulations to experimental data is crucial to optimize not only the experimental tools but also to understand the mechanical properties of the HEA.
In this work, we propose a novel combination of data mining to interpret APT data and interrogate atomic scale ordering of a binary alloy with a well-known atomic ordering, Ni3Al, and an HEA, Al1.3CoCrCuFeNi. Herein, an innovative computational approach was developed to visualize complex local correlations between atoms using simulated RDF patterns. Our computational approach confirmed that synthetic structural models can be produced to match the RDF data obtained from the APT experiment. This allows us to understand the effect noise and abundancy of Ni3Al and Al1.3CoCrCuFeNi at the local level. The combination of an innovative computational approach and advanced experimental methods allowed us to extract and evaluate correlations between atoms within complex structures such as HEAs, which will eventually help to improve castability, develop compositions compatible with powder production and understand strengthening mechanisms. (Savin et al., 1999; Czeppe and Wierzbinski, 2000)
Computational and Experimental Methods
RDF, CRDF, and FCRDF Definitions
A multicomponent material containing N elements, can be described by an N×N matrix of pairwise component RDFs. Because the matrix is symmetric, only N (N+1)/2 of these pairwise RDFs are unique. In the case of a binary alloy, such as our example material, Ni3Al, there are three unique RDFs, Ni-Ni, Al-Al and Ni-Al. The Al-Ni RDF is the same as the Ni-Al RDF. Any A-B RDF describes the distribution of atoms of type B around atoms of type A. In neutron and x-ray total scattering experiments, only a total RDF is observable. This total RDF is a combination of the pairwise component RDFs weighted by the relative strength of scattering of the constituent elements. In simulation, the pairwise RDFs are directly calculated. If one is interested in the direct comparison of a simulation RDF with an experimental RDF, one can generate the total RDF from the pairwise component RDFs. Because an APT data set provides the same category of data as simulations (namely spatial coordinates of atoms and their atomic identity), pairwise component RDFs can be directly calculated from APT data sets. In this work, only pairwise component RDFs, obtained either from computation or from APT experiment are reported. Henceforth, the term RDF is used and it explicitly refers to a pairwise component RDF.
Any A-B RDF can be integrated up to an arbitrary value of r along the radial dimension to provide the number of atoms of type B within a sphere of size r centered on an atom of type A. This integral of the RDF is designated a cumulative RDF or CRDF. When the upper limit of integration is chosen only to include nearest neighbors, the CRDF is described as a coordination number of B about A. However, the CRDF has a more general meaning since it can be evaluated at any arbitrary value of r.
Any complete set of pairwise component can be normalized on the basis of cumulative fraction of atom types. This function is called the fractional cumulative RDF, or FCRDF. In Figure 1, the RDFs and FCRDFs of a perfect (0 K) crystal structure of Ni3Al are plotted. Four FCRDFs are shown in Figure 1B, representing the cumulative fraction of atoms of type A around atoms of type B for all (A,B) combinations of Ni and Al. The FCRDFs are not all independent. At any value of r, the Ni-Ni and Ni-Al FCRDFs sum to unity, because the system is a binary alloy and any atom that is not Ni must be Al. The Al-Al and Al-Ni FCRDFs also sum to unity.
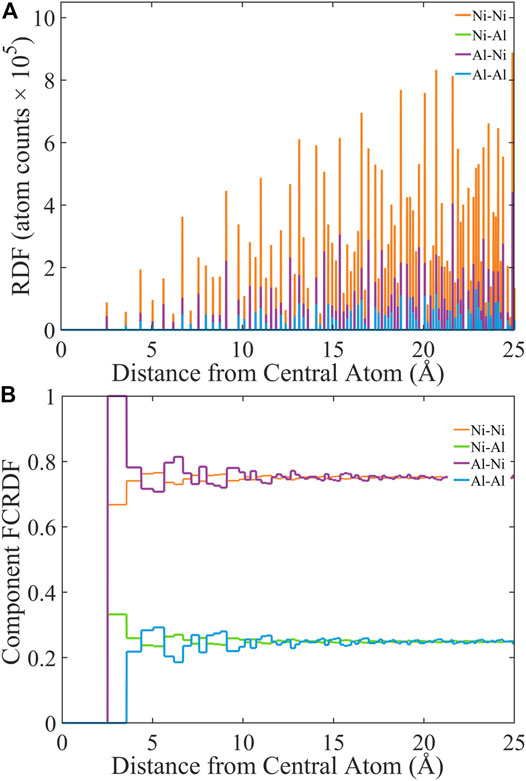
FIGURE 1. Computational approach to generate (A) RDF and (B) FCRDF data using the Ni3Al fcc parent structure (inset) with lattice parameters of 3.577 Å and space group Pm-3m.
We can exploit this interdependence to present the FCRDFs in a manner that is visually more communicative. In Figure 2, we show the FCRDFs about Ni (A) and Al (B). The most important component of this visualization of the FCRDF is that any deviation from the bulk composition (75% Ni and 25% Al) represents atomic ordering. Let’s examine the FCRDF plots to understand how they capture the atomic ordering in Ni3Al. The Strukturbericht designation for this structure is L12. (Villars et al., 1984) Because L12 is an fcc structure, both Ni and Al have twelve nearest neighbors. However, all twelve of the nearest neighbors of Al are Ni. Therefore, the FCRDF about Al (Figure 2A) indicates 100% Ni in the range of radial distance greater than or equal to the nearest neighbor distance and less than the next-nearest neighbor distance. In L12, eight of the twelve nearest neighbors of Ni are Ni and four are Al. Therefore, the FCRDF about Ni (Figure 2B) indicates 66.7% Ni and 33.3% Al in this same radial range. In this perfect crystal, no fraction appears at distances less than the nearest neighbor distance because no atoms occupy that excluded volume. As the radial distance increases, the FCRDF accommodates first the next-nearest neighbors then incrementally yet more distant neighbors. Eventually this FCRDF must approach the bulk value of the alloy. In the Ni3Al example, the bulk value of 75%/25% Ni/Al is very nearly reached by 25 Å, Figure 2.
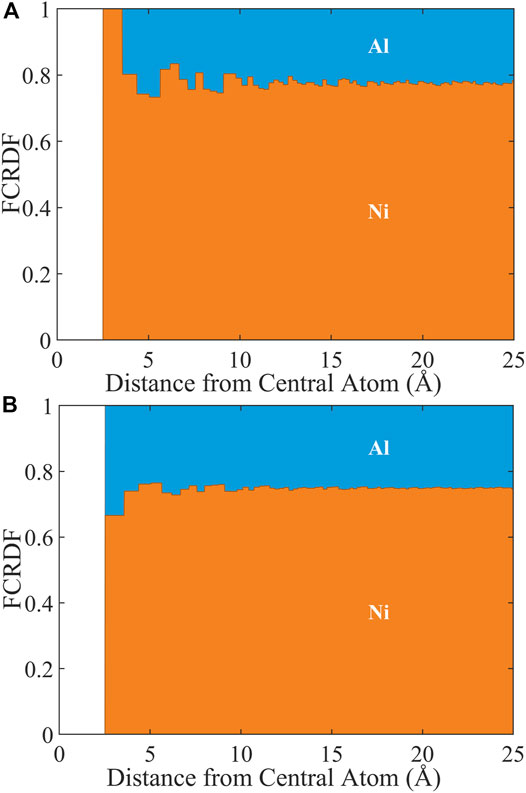
FIGURE 2. FCRDF data sets generated from ordered fcc Ni3Al structure with lattice parameters of 3.577 Å and space group Pm-3m. (A) FCRDF of Al; (B) FCRDF of Ni.
Atomic Ordering Metric Definitions
The plots of the FCRDF shown in Figure 2 effectively visualize atomic ordering. In this work we also explored effort to generate an atomic ordering metric, specifically designed to interpret the FCRDF, which takes the form of a dimensionless scalar number that characterizes atomic ordering in a material. Here, we report only one candidate metric, which eliminated many of the artifacts associated with other proposed metrics. For a binary alloy, the atomic ordering metric, FA,O, is defined as
where rmin and rmax define a radial range and nr is the number of discretized values of r in that range. The
As noted, this choice of metric came about through an iterative process. The use of the bulk average FCRDF rather than a local average did not sufficiently weight sharp transitions at small r. The need to define a lower radial limit, rmin, arose to avoid statistically unreliable data at very small r where the volume of the spherical shell approaches zero as r3. (This problem will be discussed further below.). The need to define an upper radial limit, rmax, arose in order to compare different materials on a standard scale. In this work, we chose rmin = 1.00 Å and rmax = 50.0 Å. The calculated FA,O for the synthetic data set in Figure 2 is FA,O = 1.67. We identify this as the ideal FA,O value, (Fid). In other words, Fid is the metric when 100% of the atoms are present and there is no spatial noise. Subsequently, we report the scaled atomic ordering metric, FA,O/Fid, bound between zero and unity. The local average, ⟨FCRDF(r)⟩, was obtained by averaging over the nearest 5 points symmetrically about r. For multicomponent systems, the atomic ordering metric can be determined by an average over all unique elemental boundary lines in the FCRDF plots.
Synthetic Data Sets
The purpose of this work is to use the FCRDF and atomic ordering metric to characterize atomic ordering in APT data sets. In order to validate the technique, we created a suite of synthetic data sets in order to demonstrate how the analysis tool works on known systems. The data quality issues of interest are (Gault et al., 2010a) number of atoms in the data set (Cairney et al., 2015), fraction of the atoms in the material captured by the data set, i.e., the relative abundance of atoms in the sample, and (Diao et al., 2019) noise in the spatial coordinates of the atoms. The number of atoms were set to approximately 400,000 since that is the number of atoms in the APT data set for Ni3Al to which we will compare. The other two parameters, abundance and noise, were varied. We created a full matrix with four values of noise and three values of abundance. The noise is reported as the standard deviation of a Gaussian distribution in each dimension, x, y and z. It ranges from 0 Å (no noise) to 2.00 Å, which is comparable to experiment and previous APT simulated structures (Hyde et al., 2017). The spatial resolution achieved in the APT experiment depends not only upon the instrument, but the temperature and manner in which the experiment is run, e.g., voltage mode versus laser mode (Larson et al., 2013; Miller and Forbes, 2014). These instrumental issues, while important, impact the application of the FCRDF approach, only in that they change the magnitude of the uncertainty in the spatial coordinates. As a reminder, a standard deviation of 2.0 Å in one spatial dimension corresponds to 99.7% of the population falling within a range from −6.0 Å to +6.0 Å. The abundance ranges from 100% (no missing atoms) to 40%, comparable to APT data sets. The number of atoms in the synthetic data sets are independent of abundance. We began with larger crystals data sets with a higher fraction of missing atoms.
This set of twelve structures was generated twice, once from a perfectly ordered Ni3Al according to L12 and one perfectly disordered Ni3Al in which the atoms were randomly distributed. The twenty-four systems are summarized in Supporting Information, Supplementary Table 1. The purpose in examining both ordered and disordered synthetic data sets is to quantitatively identify the strengths and limitations of this technique in terms of providing true positive, false positive, true negative and false negative indications of atomic ordering.
Atom Probe Tomography
APT sample preparation was performed using a Thermo Fisher Nova 200 dual beam scanning electron microscope (SEM) with a focused ion beam (FIB). The APT tips were prepared using standard procedures including FIB lift-out and sharpening using a 30 kV Ga+ beam for bulk milling and a 2 kV beam for final cleaning. (Thompson et al., 2007) APT was carried out on a CAMECA LEAP 4000XHR in both laser and voltage mode. For laser mode, a 60–80 pJ laser energy, 200 kHz pulse repetition rate, a 30 K base temperature, and a 0.5% detection rate were used. For voltage mode, a 20% pulse fraction, 50 K base temperature, 200 kHz pulse repetition rate, and 0.5% detection rate were used. The results were reconstructed and analyzed using CAMECA’s integrated visualization and analysis software (IVAS 3.8.2). All compositional measurements using the peak decomposition routine were background corrected. APT was performed on Ni3Al and Al1.3CoCrCuFeNi alloys.
Analysis Algorithm
The analysis algorithm used in this work to identify atomic ordering in APT samples is described in Figure 3. Conceptually, the analysis provides both a statistical validation and physical validation of the FCRDF generated from the APT experiment. The top data flow in Figure 3 represents a straight-forward manipulation of the experimental data set to generate a FCRDF. The middle data flow represents a statistical model that takes the form of a synthetic data set with the same number of atoms and composition as the experimental data set. A proposed model of the atomistic structure, including atomic ordering, is then subject to the data sparsity and noise conditions similar to the experiment. From this statistical model the same process is used to generate a FCRDF. The bottom data flow represents a physical model based on the same atomistic model used in the statistical process. In this case, the peaks in the RDF of the atomistic model are subject to experimental broadening and result in a third FCRDF.
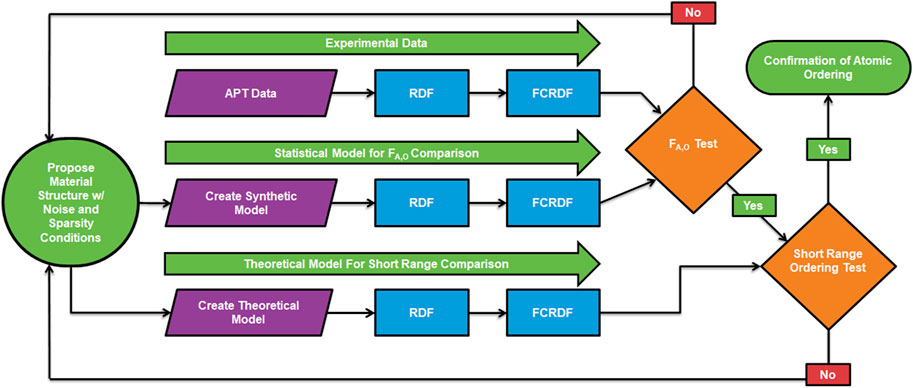
FIGURE 3. The algorithm for identification of atomic structure in APT data sets. See text in Section 2.5 for complete description.
The algorithm has two points of comparison. The first compares the FCRDF of the experimental data with the statistical model. If the similarity is not sufficiently high, as measured by a combination of the shape of the curve and the ordering metric, then a new model is proposed. If the comparison is good, then a second level of comparison is made. This second level is needed due to the amount of uncertainty in the positions of the atoms in the APT data sets. The second comparison is intended to ensure that matches from the statistical model make sense in the light of a physical model of the atomic structure. A model that passes both the statistical and physical comparison is said to have confirmed the proposed atomic ordering. At this stage, we do not present a definitive proof of uniqueness of the model. It remains a possibility that for some materials, more than one proposed model of atomic ordering could potentially satisfy both the statistical and physical criteria. However, given the current level of the resolution of APT instruments, there is good value in identifying a model that satisfies both criteria. Below, we will provide an example of this algorithm where the atomic ordering is known.
Results and Discussion
FCRDF of Ni3Al Synthetic Data Sets
Figure 2 displays the calculated FCRDF for Ni3Al parent compound with 100% abundance and zero noise which can be considered as the perfect Ni3Al structure without any disorder. The large deviations in the fraction of atomic distribution from the bulk average indicate the regular atomic ordering of Ni3Al. Further, the validation of the synthetic data sets is critical to the success of the FCRDF calculations of Ni3Al. Therefore, our approach is to generate FCRDF data by introducing different degrees of noise and abundance to the parent Ni3Al structure and matching the synthetic data with the FCRDF data generated from the APT experiment. The FCRDF plots for Ni3Al synthetic data sets as a function of abundance and noise are shown in Figure 4. Only the atomic ordering around Al is shown here; the atomic ordering of Ni is provided in the supporting information, Supplementary Figure S1. In Figure 4A, twelve FCRDF plots are shown for an atomically ordered crystal structure, according to L12. In Figure 4B, twelve FCRDF plots correspond to random distribution of Ni and Al on the same fcc lattice.
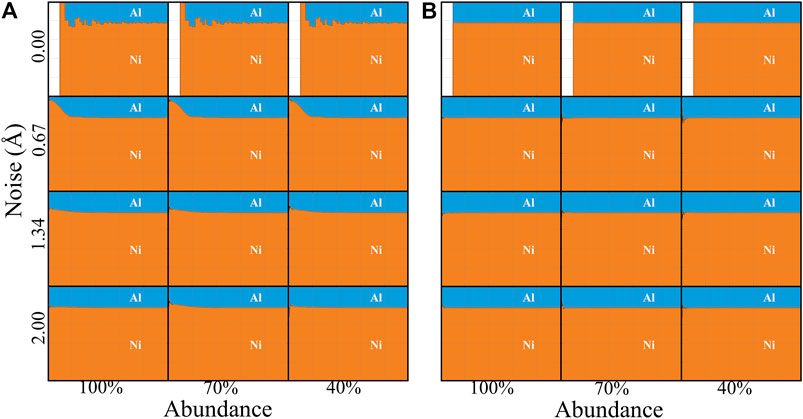
FIGURE 4. FCRDF data sets of Ni3Al within the atomic rang of 0–25 Å (x-axis of each individual plot). The data is plotted Noise (Å) against Abundance (%). (A) atomic ordering of Al in ordered Ni3Al structures; (B) atomic ordering of Al in random Ni3Al structures.
There are several important observations to take from Figure 4. First, by comparing the three FCRDF plots in the same row in Figure 4A, it can be established that the positive identification of atomic ordering is not significantly impacted by abundance. Atomic ordering can still clearly be seen even when only 40% of the atoms are present. Analogously, by comparing the three FCRDF plots in the same row in Figure 4B, it can be established that the correct absence of atomic ordering is not influenced by abundance. The presence of noise in the data does in fact negatively impact the ability to see atomic ordering in the FCRDF. The effect can be observed by comparing the four FCRDF plots in any column of Figure 4A. As a distinctive feature, in Figure 4A, at a noise level of 0.67 Å atomic ordering are smeared together. With the increase in noise, the smearing worsens until at a noise level of 2.0 Å, there is very little residual signature of atomic ordering. By comparing the four FCRDF plots in the same column in Figure 4B, it can be established that the correct absence of atomic ordering is not influenced by noise. We also note that the excluded volume seen at small values of r in the absence of noise is filled with atoms as soon as noise is introduced. This occurs because a Gaussian distribution around nearest neighbors and next nearest neighbors places some atoms in the excluded volume, a feature that is also seen in real APT data sets (Miller et al., 2003; Miller and Kenik, 2004; Boll et al., 2007; Haley et al., 2009). Since all plots using randomized atomic positions (Figure 4B) show no atomic ordering, it can be concluded that the FCRDF technique successfully identifies true negatives and never returns false positives. However, based on the plots in Figure 4A, it can be concluded that the FCRDF is capable of returning true positive identification of atomic ordering in data sets with little or no noise regardless of the abundance (up to the limit studied here). However, the presence of sufficient noise can smear out the information in the FCRDF resulting in a false negative, namely the failure to correctly identify the presence of atomic ordering.
The identification of atomic ordering is also reflected in the atomic ordering metric. As mentioned previously, for the perfect structure FA,O/Fid value is a unity, and this can be considered as our true positive case. The opposite of the true positive case (true negative) where we assume zero noise with 100% abundancy in the random Ni3Al structure and it produces FA,O/Fid value of 0.00119. As displayed in Figure 4, at true negative, there is almost no deviation of the atomic ordering within the range of 0–25 Å. An absence of atomic ordering is observed by applying the maximum noise (2 Å) and lowest abundance (40%) for both ordered and disordered Ni3Al structures. The fitting data produced a false negative (FA,O/Fid = 0.0283) and true negative (FA,O/Fid = 0.0279) for the ordered and random Ni3Al structures, respectively.
FCRDF of Ni3Al Experimental Data
In Figure 5, we present the FCRDF around Ni (A) and Al (b) from 0–25 Å for the experimental APT data set of Ni3Al containing 396,254 atoms. Of these atoms, 77.6% were Ni and 22.4% were Al. At first glance there appears to be little signature of atomic ordering in the experimental data set. Based on the analysis above, this is because of the noise in the spatial coordinates rather than the abundance of atoms. The normalized atomic ordering metric of Ni3Al obtained from the APT data is FA,O/Fid = 0.0351.
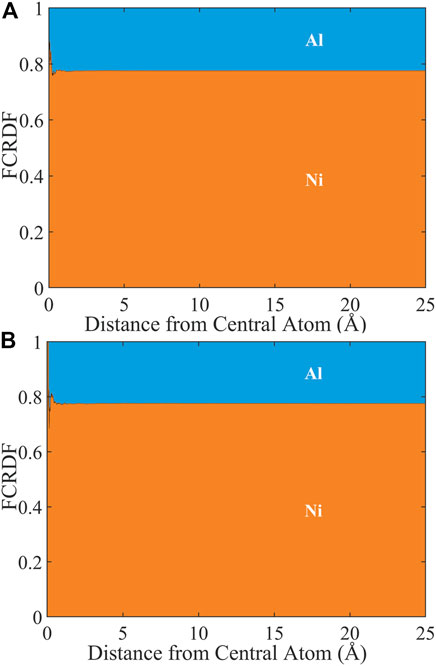
FIGURE 5. FCRDF generated from experimental APT data sets of Ni3Al: (A) FCRDF around Ni; (B) FCRDF around Al.
Intriguingly, the FCRDF generated from a synthetic data set with the noise of 1.34 Å and 40% abundance of ordered Ni3Al structure is remarkably similar to the FCRDF data obtained from the APT data, Figure 6. As a reminder, a Gaussian distribution with a standard deviation of 1.34 Å corresponds to 99.7% of the population falling within −4 Å to +4 Å. Figures 6A–D summarizes the short-range FCRDF around Ni and Al from the APT data set and the synthetic data set with 1.34 Å noise and 40% abundance, respectively. Interestingly the deviation of the FCRDF from bulk values appears at very small distances, which lie in the excluded volume region of a system without noise. The statistical reliability of the FCRDF depends upon the number of atoms at a given radial value. Because the sampling volume shrinks as r3 with decreasing radial position, the sampling is unreliable at very small r, where there are almost no atoms. The FCRDF below 0.25 Å (greyed-out in Figure 6A through 6D) should be ignored as noise due to small sampling volume. However, in the region from 0.25 Å and greater, it is still worthwhile investigating whether any meaningful signature of atomic ordering can be extracted as pointed in Figure 6. Visually, we observe a similarity in the experimental and synthetic FCRDFs about both Ni and Al. In the case of the structure about a central Al atom, we observe a distinct enrichment in Ni and depletion of Al in both the experimental and synthetic FCRDFs, with peaks centered about 0.35 Å with a maximum atom fraction over 0.8. Since the bulk composition is 0.75 Ni, this signal represents Ni enrichment about the Al. In the case of a central Al atom, we observe a weaker enrichment in Al in both FCRDFs in both regions.
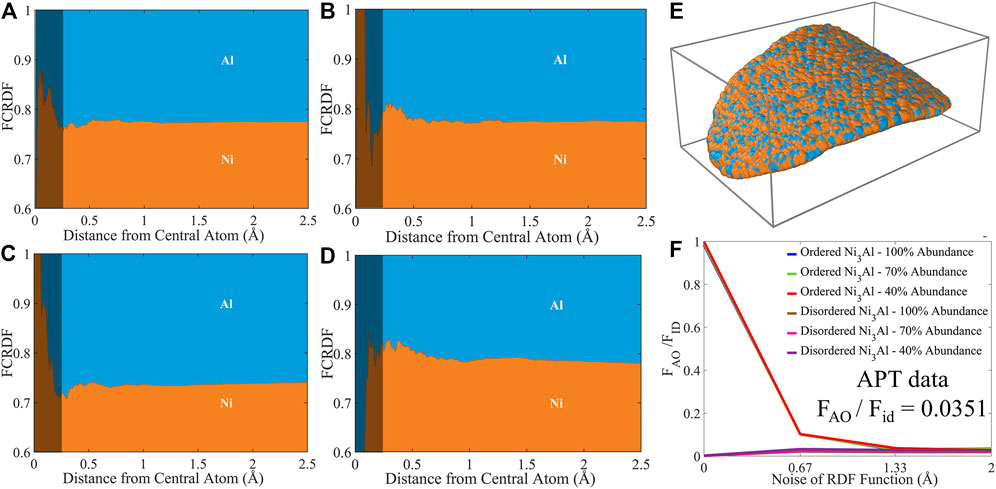
FIGURE 6. FCRDF data sets of Ni3Al within the atomic range of 0–2.5 Å (A) and (B) FCRDF data generated using APT data around Ni and Al, respectively. (C) and (D) FCRDF data generated using the ordered Ni3Al structure with 1.34 Å noise and 40% abundance around Ni and Al, respectively. The grayed-out section from 0.0 to 0.25 Å in (A) through (D) corresponds to a region with statistically unreliable signal due to small sampling volume. (E) Visualization of atoms in APT data. (F) comparison of atomic ordering metric for simulated and experimental data.
The FCRDF shown in Figures 6C,D were generated from an ordered synthetic data set, subject to data sparsity and coordinate noise. The similarity with the FCRDF generated from experiment is therefore a first step in the validation of the model. It is worthwhile to compare the analogous FCRDF from a comparable synthetic data set generated from a model without any order, as shown in Figure Supplementary Figure 2A,2B. In that case we do not observe the enrichment of Ni about Al or the more modest enrichment of Al around Ni. We observe only a flat profile about the mean of 75% Ni subject to increasing noise with a reduction in radial distance for the same statistical reasons described above, namely a reduction in sampling volume that scales as the radial distance cubed. In the statistically valid region, the fluctuation in the composition is no larger than +/− 2%. Importantly, there is no peak that exceeds 80% Ni about Al as observed in the FCRDFs of both the experimental and ordered synthetic data sets.
In order to interpret the signal of atomic ordering observed in Figure 6, we present a model of the FCRDF in the presence of the uncertainty in atomic coordinates as present in the experimental signal. In Figure 7, we provide an illustration of a model of Ni3Al, in which the closest Ni-Ni and Ni-Al neighbors for Ni (Figure 7A) and the closest Al-Al and Al-Ni neighbors for Al (Figure 7B) are expanded in Gaussian distributions about their lattice sites. (Marceau et al., 2015; Owen et al., 2016; Owen et al., 2017) The Gaussians are multiplied by the appropriate number of neighbors of each atom type at each distance. The standard deviation of the Gaussian is the same for all eight Gaussians shown in Figures 7A,B. The FCRDF can be constructed based just on these distributions as shown in Figures 7C,D for Ni and Al, respectively. (We note that the Gaussian in the radial direction approximates the mapping of a three-dimensional Gaussian onto the RDF.) There is clear signature resulting from atomic ordering in this excluded volume space. Because there is no sampling in this model, the curves are reliable at all values of r. The clearest signal is the enrichment of Ni about Al (Figure 6D) due to the fact that 100% of the nearest-neighbors around Al are Ni. One also observes a maximum in the Al fraction around Ni at about 3 Å. This Al enrichment results from the fact that one third of the nearest neighbors of Ni are Al, which is greater than the bulk composition of one fourth Al.
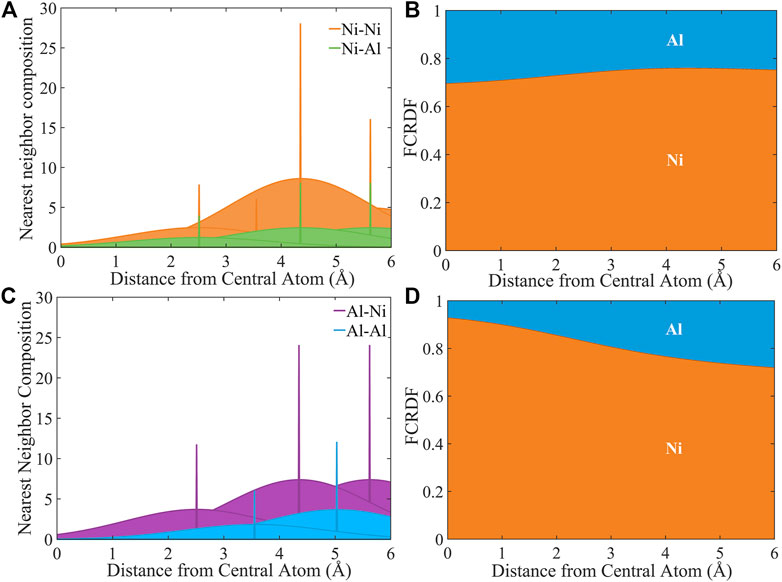
FIGURE 7. Extraction of information within atomic excluded volume from APT data sets of Ni3Al. (A) and (B) Four closest neighbors of Ni and Al expanded in Gaussian distributions. (C) and (D) The cumulative fractional RDFs resulting from (A) and (B).
Guided by this model, we can return to an examination of the short-range FCRDF of the synthetic and APT data sets shown in Figure 6. For the FCRDF around Al, we do observe the predicted increase in Ni fraction with decreasing r in both the experimental and synthetic data sets (Figures 6B,D), until the signal becomes unreliable below 0.25 Å. For the FCRDF around Ni, we do observe the predicted modest increase in Al fraction with decreasing r in both the experimental and synthetic data sets (Figures 6A,C), until the signal becomes unreliable below 0.25 Å.
Figures 6, 7 provide some indication that the signal of atomic ordering is present in statistical sense and consistent with the physical model. However, there are two additional factors that should be considered before a conclusive observation is drawn. First, APT data should be compared with randomly disordered synthetic data to eliminate the possibility of a false positive. Second, it is important to note the differences in the overall composition between the synthetic data set and the APT data. The synthetic data set adheres to the perfect crystalline stoichiometry of 75% Ni and 25% Al, whereas the atoms resolved in the APT data set correspond to ∼78% Ni and ∼22% Al.
Figure 8 allows direct comparison between the ordered and disordered synthetic sets and APT data. In Figures 8A,B, the FCRDF for the APT data set is compared with a disordered set and with two ordered sets with different amounts of spatial uncertainty (standard deviations of 1.34 and 2.0 Å). As seen before in Figure (Hu et al., 2020), the similarity between the experimental set and the ordered synthetic data set with standard deviation of 1.34 Å is most compelling. However, in Figures 8C,D, the data is normalized to account for the variation in bulk composition, so that the FCRDF should go to unity at long r irrespective of composition. From this comparison, the correspondence of the experimental data to the ordered 1.34 Å is somewhat weakened. When normalizing by the composition however, the experimental signal of atomic ordering is further degraded. The APT data quickly reaches the average bulk nickel value faster than either ordered synthetic data set. From this analysis, we conclude that, for this experimental data set, the degree of uncertainty is such that a false negative result (the absence of order) is difficult to distinguish from a true positive.
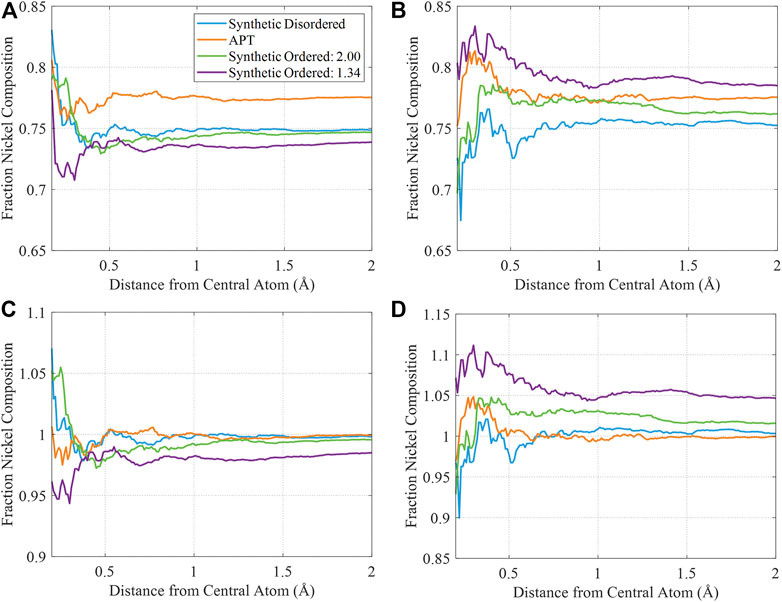
FIGURE 8. Fractional nickel composition of the various sets of FCRDF data in the atomic range of 0.2–2.0 Å (A) and (B) Fractional nickel composition of each set of FCRDF data. (C) and (D) Normalized FCRDF data, accounting for the differences in composition between the synthetic and APT data. All synthetic data has 40% abundance.
As a final aspect of this investigation of the Ni3Al, we explored the effect of asymmetry in the spatial coordinates. It is well established that the uncertainty in the z dimension of the APT data sets is less than (nominally a third of) the noise in the x and y dimensions, based on the instrument and reconstruction algorithm (Larson et al., 2013; Miller and Forbes, 2014). In order to take advantage of this difference in resolution, samples can be oriented such that a particular plane is normal to the z-axis. This orientation minimizes out-of-plane uncertainty relative to in-plane uncertainty and has previously been exploited to identify characteristics of local ordering (Sudbrack et al., 2004; Inoue et al., 2021). In the case of the Ni3Al sample examined in this work, to our knowledge, a crystallographic plane was not oriented along the z-axis. Therefore, any special ability to exploit the asymmetry of the uncertainty in the spatial coordinates does not apply to this case. However, due to the importance of sample orientation, we created an additional synthetic data set with 40% abundance and a standard deviation of noise of 1.34 Å in the x and y dimensions and 0.442 Å (one third of the x and y noise) in the z dimension, which corresponded to the (001) crystallographic plane. The resulting FCRDF in the range of 0–2.5 Å is shown in Supplementary Figure S3. There is a significant difference between the short-range FCRDFs for the asymmetric case (Supplementary Figure S3A,B) and the corresponding symmetric case (Figures 6C,D). There is greater enrichment of Al around Ni and slightly more enrichment of Ni around Al. The origin of this difference is found in the fact that Ni3Al in the (001) direction is composed of alternating planes of pure Ni and NiAl, which can be seen only in the asymmetric synthetic data set. (See Supplementary Figure S5) From this example, we draw two conclusions. First, the exercise illustrates that the FCRDF method is capable of detecting asymmetry of the uncertainty of spatial coordinates in samples in which a crystallographic plane has been aligned with the z axis of the APT instrument. Second, we infer from this example that the (001) plane of the Ni3Al experimental sample examined in this paper was not aligned in the instrument.
FCRDF of Al1.3CoCrCuFeNi
High Entropy Alloys present unique challenges in materials research. HEAs display the promise of superior mechanical properties, that could significantly change the field of material science if made accessible. Despite the potential of these materials, they have a unique complexity due to the equal element proportions that they are composed of, meaning the complexity of their structure prevents a clear description of their atomic ordering. An unambiguous understanding of the structure of HEAs is necessary to unlock the benefits of their mechanical properties, a task made more complex by the influence that processing methods have on the mechanical properties of HEA. Therefore, understanding the microstructure of HEAs is essential from the technology point of view and has complexity over characterizing a single-phase structure. (Tsai and Yeh, 2014; Sims et al., 2017; George et al., 2019; George et al., 2020; Musico et al., 2020).
As a demonstration of the fact that this computational approach can be extended to multicomponent alloys, we applied the FCRDF approach to an APT data set for the high entropy alloy, Al1.3CoCrCuFeNi. This data set was first published by Santodonato et al. (Santodonato et al., 2015) The APT data set, containing 1,229,923 atoms is visualized in Figure 9A and the composition is reported in Figure 9B. Previous work identified nanoscale phase segregation of a Cu-rich fcc phase, a Cr-Fe enriched bcc phase, and a bcc matrix. The FCRDF about Cu and the FCRDF about Cr are shown in Figures 9C,D, respectively for a radial range from 0 to 50 Å. The aggregation of Cu can be clearly observed in our FCRDF data generated using experimental APT data, as an enrichment in the Cu atom fraction around Cu. An enrichment of Cr around Cr can also be clearly seen using the FCRDF. We note that this level of elemental segregation has been observed by other analytical means. Because of the noise in the spatial coordinates in the APT data set, immediate identification of preferential nearest neighbor pairing has not yet been achieved for this data set. The fact that three phases are present in the sample, complicates the model. However, a process of separating atoms by phase and applying a model as illustrated in Figure 7 can be used to investigate signatures of nearest neighbor clustering in the excluded volume region of the FCRDF. (Santodonato et al., 2015) Furthermore, the ordering metric, FA,O for this data set was 0.0689 with FA,O/Fid = 0.0405. This data set contains clear elemental segregation in the form of three different phases, and therefore, this value must be above the order metric for randomly oriented materials.
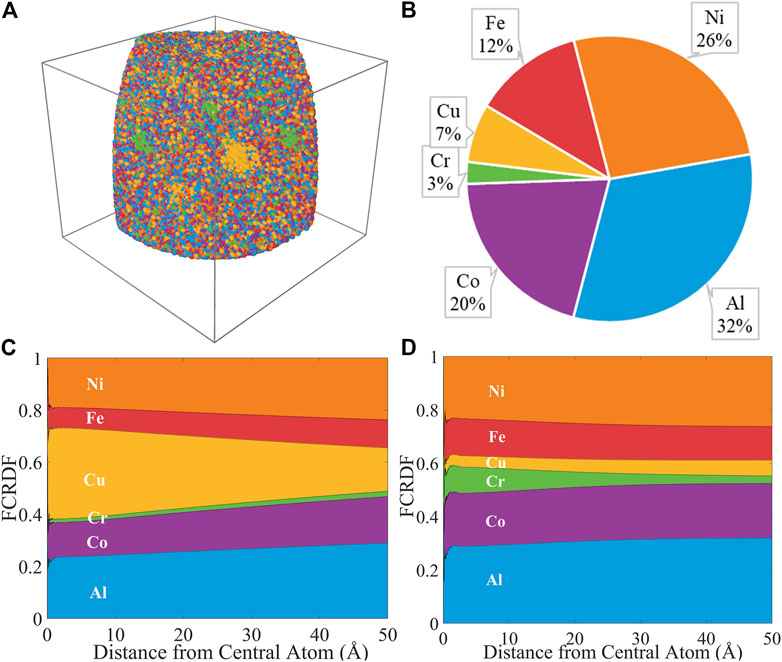
FIGURE 9. (A) A 3D map of Al1.3CoCrCuFeNi APT data; (B) elemental composition map of Al1.3CoCrCuFeNi; calculated FCRDF data of Cu (C) and Cr (D).
Conclusion
In this work, we have developed and proposed the Fractional Cumulative Radial Distribution Function (FCRDF) as a means of visualizing and identifying atomic ordering in atomic data sets. We have also developed and applied an atomic ordering metric to reduce the FCRDF plot into a scalar indicator of chemical ordering in a sample. From the application to a suite of synthetic data sets, the FCRDF technique successfully identifies true negatives (the absence of chemical ordering) and indicates the levels of noise in APT data that would result in a false negative. The FCRDF is also capable of returning true positive identification of atomic ordering in data sets with little or no noise regardless of the abundance (up to the limit studied here). However, the presence of sufficient noise can smear out the information in the FCRDF resulting in a false negative, namely the failure to correctly identify the presence of atomic ordering. The FCRDF process was also applied to an APT sample of Ni3Al. The noise in the spatial coordinates of the atoms smears out much of the atomic ordering signature. However, in the region of excluded volume, the signature of atomic ordering can be interpreted through the FCRDF using a series of Gaussian distributions expanded upon crystal lattice points. Careful evaluation of the experimental APT data and comparison with synthetic data sets of comparable uncertainty and abundance suggests that the resolution of the APT instrument used here does not provide unambiguous confirmation of atomic ordering. The application of the FCRDF process to an APT sample of a phase separated Al1.3CoCrCuFeNi captured elemental aggregation at the nanoscale. The further investigation of atomic ordering of nearest neighbors is underway. Relative to the atom probe instrument, the ability to extract atomic ordering is hampered by uncertainty in spatial coordinates to a much greater extent than by fraction of atoms resolved. With modest noise, the FCRDF approach is able to robustly identify atomic ordering with only 40% of the atoms resolved. Approaches for improving the quantitative characterization of atomic ordering in APT data sets can be pursued through improvements in data analysis algorithms, the coupling with complementary experimental techniques, such as TEM and XRD, and improvements in the APT instrument that lead to a reduction in the uncertainty in spatial coordinates.
Data Availability Statement
The raw data supporting the conclusions of this article will be made available by the authors, without undue reservation.
Author Contributions
CRediT (Contributor Roles Taxonomy) author statement Alex Greenhalgh—Methodology, Software, Validation, Investigation, Writing—Original Draft, Visualization, Formal Analysis. Liurukara D. Sanjeewa—Writing—Original Draft. Piotr Luszczek—Conceptualization, Funding Acquisition, Writing—Review and Editing. Vasileios Maroulas—Conceptualization, Funding Acquisition, Writing – Review & Editing. Orlando Rios—Conceptualization, Funding Acquisition, Writing—Review and Editing. David J. Keffer—Conceptualization, Project Administration, Supervision, Writing—Original Draft, Writing—Review and Editing, Formal Analysis.
Funding
This research was sponsored by the Critical Materials Institute, an Energy Innovation Hub funded by the United States Department of Energy (DOE), Office of Energy Efficiency and Renewable Energy, Advanced Manufacturing Office and Eck Industries. This research also received seed funding from an interdisciplinary seed grant at the University of Tennessee, Knoxville.
Conflict of Interest
The authors declare that the research was conducted in the absence of any commercial or financial relationships that could be construed as a potential conflict of interest.
Publisher’s Note
All claims expressed in this article are solely those of the authors and do not necessarily represent those of their affiliated organizations, or those of the publisher, the editors, and the reviewers. Any product that may be evaluated in this article, or claim that may be made by its manufacturer, is not guaranteed or endorsed by the publisher.
Acknowledgments
APT was conducted at ORNL’s Center for Nanophase Materials Sciences (CNMS), which is a U.S. DOE Office of Science User Facility.
Supplementary Material
The Supplementary Material for this article can be found online at: https://www.frontiersin.org/articles/10.3389/fmats.2021.797418/full#supplementary-material
References
Blum, I. D., Isheim, D., Seidman, D. N., He, J., Androulakis, J., Biswas, K., et al. (2012). Dopant Distributions in PbTe-Based Thermoelectric Materials. J. Elec. Mater. 41 (6), 1583–1588. doi:10.1007/s11664-012-1972-2
Boll, T., Al-Kassab, T., Yuan, Y., and Liu, Z. G. (2007). Investigation of the Site Occupation of Atoms in Pure and Doped Intermetallic. Ultramicroscopy 107 (9), 796–801. doi:10.1016/j.ultramic.2007.02.011
Cairney, J. M., Rajan, K., Haley, D., Gault, B., Bagot, P. A. J., Choi, P.-P., et al. (2015). Mining Information from Atom Probe Data. Ultramicroscopy 159, 324–337. doi:10.1016/j.ultramic.2015.05.006
Ceguerra, A. V., Moody, M. P., Powles, R. C., Petersen, T. C., Marceau, R. K. W., and Ringer, S. P. (2012). Short-range Order in Multicomponent Materials. Acta Cryst. Sect A. 68, 547–560. doi:10.1107/s0108767312025706
Czeppe, T., and Wierzbinski, S. (2000). Structure and Mechanical Properties of NiAl and Ni3Al-Based Alloys. Int. J. Mech. Sci. 42 (8), 1499–1518. doi:10.1016/s0020-7403(99)00087-9
De Geuser, F., Lefebvre, W., and Blavette, D. (2006). 3D Atom Probe Study of Solute Atoms Clustering during Natural Ageing and Pre-ageing of an Al-Mg-Si alloy. Philos. Mag. Lett. 86 (4), 227–234. doi:10.1080/09500830600643270
Diao, H., Ma, D., Feng, R., Liu, T., Pu, C., Zhang, C., et al. (2019). Novel NiAl-Strengthened High Entropy Alloys with Balanced Tensile Strength and Ductility. Mater. Sci. Eng. A 742, 636–647. doi:10.1016/j.msea.2018.11.055
Dumitraschkewitz, P., Gerstl, S. S. A., Uggowitzer, P. J., Loffler, J. F., and Pogatscher, S. (2017). Atom Probe Tomography Study of As-Quenched Al-Mg-Si Alloys. Adv. Eng. Mater. 19 (4), 1600668. doi:10.1002/adem.201600668
El Azrak, H., Hassani, A., Sbiaai, K., and Hasnaoui, A. (2020). Investigating the Potentialities of Ni3Al alloy Formation on Ni Substrates: Molecular Dynamics Simulation. J. Cryst. Growth 537, 125607. doi:10.1016/j.jcrysgro.2020.125607
Gault, B., Moody, M. P., De Geuser, F., La Fontaine, A., Stephenson, L. T., Haley, D., et al. (2010). Spatial Resolution in Atom Probe Tomography. Microsc. Microanal. 16 (1), 99–110. doi:10.1017/s1431927609991267
Gault, B., La Fontaine, A., Moody, M. P., Ringer, S. P., and Marquis, E. A. (2010). Impact of Laser Pulsing on the Reconstruction in an Atom Probe Tomography. Ultramicroscopy 110 (9), 1215–1222. doi:10.1016/j.ultramic.2010.04.017
Gault, B., Klaes, B., Morgado, F. F., Freysoldt, C., Li, Y., De Geuser, F., et al. (2021). Reflections on the Spatial Performance of Atom Probe Tomography in the Analysis of Atomic Neighbourhoods. Microsc. Microanal., 1–11. doi:10.1017/S1431927621012952
Geiser, B. P., Kelly, T. F., Larson, D. J., Schneir, J., and Roberts, J. P. (2007). Spatial Distribution Maps for Atom Probe Tomography. Microsc. Microanal. 13 (6), 437–447. doi:10.1017/s1431927607070948
George, E. P., Raabe, D., and Ritchie, R. O. (2019). High-Entropy Alloys. Nat. Rev. Mater. 4 (8), 515–534. doi:10.1038/s41578-019-0121-4
George, E. P., Curtin, W. A., and Tasan, C. C. (2020). High Entropy Alloys: A Focused Review of Mechanical Properties and Deformation Mechanisms. Acta Mater. 188, 435–474. doi:10.1016/j.actamat.2019.12.015
Haley, D., Petersen, T., Barton, G., and Ringer, S. P. (2009). Influence of Field Evaporation on Radial Distribution Functions in Atom Probe Tomography. Philos. Mag. 89 (11), 925–943. doi:10.1080/14786430902821610
Hernández-Saz, J., Herrera, M., Delgado, F. J., Duguay, S., Philippe, T., Gonzalez, M., et al. (2016). Atom-scale Compositional Distribution in InAlAsSb-Based Triple junction Solar Cells by Atom Probe Tomography. Nanotechnology 27 (30), 305402. doi:10.1088/0957-4484/27/30/305402
Hu, R., Jin, S., and Sha, G. (2020). Application of Atom Probe Tomography in Understanding High Entropy Alloys: 3D Local Chemical Compositions in Atomic Scale Analysis. Prog. Mater. Sci. 117, 1–23. doi:10.1016/j.pmatsci.2020.100740
Hyde, J. M., DaCosta, G., Hatzoglou, C., Weekes, H., Radiguet, B., Styman, P. D., et al. (2017). Analysis of Radiation Damage in Light Water Reactors: Comparison of Cluster Analysis Methods for the Analysis of Atom Probe Data. Microsc. Microanal. 23 (2), 366–375. doi:10.1017/s1431927616012678
Inoue, K., Yoshida, S., and Tsuji, N. (2021). Direct Observation of Local Chemical Ordering in a Few Nanometer Range in CoCrNi Medium-Entropy alloy by Atom Probe Tomography and its Impact on Mechanical Properties. Phys. Rev. Mater. 5 (8), 085007. doi:10.1103/physrevmaterials.5.085007
Kuo, C. H., Shassere, B., Poplawsky, J., Yamamoto, Y., and Babu, S. S. (2019). Validation of an alloy Design Strategy for Stable Fe-Cr-Al-Nb-X Ferritic Alloys Using Electron Microscopy and Atom Probe Tomography. Mater. Charact. 158, 109987. doi:10.1016/j.matchar.2019.109987
Larson, D. J., Prosa, T. J., Ulfig, R. M., Geiser, B. P., and Kelly, T. F. (2013). Local Electrode Atom Probe Tomography: A User's Guide. New York: Springer.
Lee, S.-G., Kim, S.-P., Lee, K.-R., and Chung, Y.-C. (2005). Atomic-level Investigation of Interface Structure in Ni-Al Multilayer System: Molecular Dynamics Simulation. J. Magn. Magn. Mater. 286, 394–398. doi:10.1016/j.jmmm.2004.09.098
Marceau, R. K. W., Ceguerra, A. V., Breen, A. J., Raabe, D., and Ringer, S. P. (2015). Quantitative Chemical-Structure Evaluation Using Atom Probe Tomography: Short-Range Order Analysis of Fe-Al. Ultramicroscopy 157, 12–20. doi:10.1016/j.ultramic.2015.05.001
Miller, M. K., and Forbes, R. G. (2014). Atom-Probe Tomography: The Local Electrode Atom Probe. New York: Springer.
Miller, M. K., and Kenik, E. A. (2004). Atom Probe Tomography: a Technique for Nanoscale Characterization. Microsc. Microanal. 10 (3), 336–341. doi:10.1017/s1431927604040577
Miller, M. K., Shen, T. D., and Schwarz, R. B. (2003). Atom Probe Studies of Metallic Glasses. J. Non-Crystalline Sol. 317 (1), 10–16. doi:10.1016/s0022-3093(02)02001-x
Mo, N., McCarroll, I., Tan, Q., Ceguerra, A., Liu, Y., Cairney, J., et al. (2019). Understanding Solid Solution Strengthening at Elevated Temperatures in a Creep-Resistant Mg-Gd-Ca alloy. Acta Mater. 181, 185–199. doi:10.1016/j.actamat.2019.09.058
Mukherjee, S., Kodali, N., Isheim, D., Wirths, S., Hartmann, J. M., Buca, D., et al. (2017). Short-Range Atomic Ordering in Nonequilibrium Silicon-Germanium-Tin Semiconductors. Phys. Rev. B 95 (16), 161402. doi:10.1103/physrevb.95.161402
Musico, B. L., Gilbert, D., Ward, T. Z., Page, K., George, E., Yan, J. Q., et al. (2020). The Emergent Field of High Entropy Oxides: Design, Prospects, Challenges, and Opportunities for Tailoring Material Properties. Apl Mater. 8 (4), 040912. doi:10.1063/5.0003149
Owen, L. R., Playford, H. Y., Stone, H. J., and Tucker, M. G. (2016). A New Approach to the Analysis of Short-Range Order in Alloys Using Total Scattering. Acta Mater. 115, 155–166. doi:10.1016/j.actamat.2016.05.031
Owen, L. R., Playford, H. Y., Stone, H. J., and Tucker, M. G. (2017). Analysis of Short-Range Order in Cu3Au Using X-ray Pair Distribution Functions. Acta Mater. 125, 15–26. doi:10.1016/j.actamat.2016.11.048
Pandey, P., Makineni, S. K., Samanta, A., Sharma, A., Das, S. M., Nithin, B., et al. (2019). Elemental Site Occupancy in the L1(2) A(3)B Ordered Intermetallic Phase in Co-Based Superalloys and its Influence on the Microstructure. Acta Mater. 163, 140–153. doi:10.1016/j.actamat.2018.09.049
Plimpton, S. (1995). Fast Parallel Algorithms for Short-Range Molecular Dynamics. J. Comput. Phys. 117 (1), 1–19. doi:10.1006/jcph.1995.1039
Qiu, Y., Hu, Y. J., Taylor, A., Styles, M. J., Marceau, R. K. W., Ceguerra, A. V., et al. (2017). A Lightweight Single-phase AlTiVCr Compositionally Complex alloy. Acta Mater. 123, 115–124. doi:10.1016/j.actamat.2016.10.037
Rentenberger, C., and Karnthaler, H. P. (2003). TEM Study of the Friction Stress Acting on Edge Dislocations in Ni3Al. Intermetallics 11 (6), 601–609. doi:10.1016/s0966-9795(03)00040-2
Santodonato, L. J., Zhang, Y., Feygenson, M., Parish, C. M., Gao, M. C., Weber, R. J., et al. (2015). Deviation from High-Entropy Configurations in the Atomic Distributions of a Multi-Principal-Element alloy. Nat. Commun. 6, 5964. doi:10.1038/ncomms6964
Savin, O. V., Stepanova, N. N., Akshentsev, Y. N., Baum, B. A., Sazonova, V. A., and Turkhan, Y. E. (1999). Structure and Properties of Ni3Al Alloyed with a Third Element: I. Effect of Alloying on Phase Equilibria. Fiz Met. Metalloved. 88 (4), 69–75.
Sims, Z. C., Rios, O. R., Weiss, D., Turchi, P. E. A., Perron, A., Lee, J. R. I., et al. (2017). High Performance Aluminum-Cerium Alloys for High-Temperature Applications. Mater. Horiz. 4 (6), 1070–1078. doi:10.1039/c7mh00391a
Spannaus, A., Law, K. J. H., Luszczek, P., Nasrin, F., Micucci, C. P., Liaw, P. K., et al. (2021). Materials Fingerprinting Classification. Comput. Phys. Commun. 266, 108019. doi:10.1016/j.cpc.2021.108019
Sudbrack, C. K., Isheim, D., Noebe, R. D., Jacobson, N. S., and Seidman, D. N. (2004). The Influence of Tungsten on the Chemical Composition of a Temporally Evolving Nanostructure of a Model Ni-Al-Cr Superalloy. Microsc. Microanal. 10 (3), 355–365. doi:10.1017/s1431927604040589
Sudbrack, C. K., Noebe, R. D., and Seidman, D. N. (2006). Direct Observations of Nucleation in a Nondilute Multicomponent alloy. Phys. Rev. B 73 (21), 1–4. doi:10.1103/physrevb.73.212101
Thompson, K., Lawrence, D., Larson, D. J., Olson, J. D., Kelly, T. F., and Gorman, B. (2007). In Situ site-specific Specimen Preparation for Atom Probe Tomography. Ultramicroscopy 107 (2-3), 131–139. doi:10.1016/j.ultramic.2006.06.008
Tsai, M-H., and Yeh, J-W. (2014). High-Entropy Alloys: A Critical Review. Mater. Res. Lett. 2 (3), 107–123. doi:10.1080/21663831.2014.912690
Villars, P., Calvert, L. D., and Pearson, W. B. (1984). Handbook of Crystallographic Data for Intermetallic Phases. Acta Cryst. Sect A. 40, C444. doi:10.1107/s010876738408689x
Zhao, H., Gault, B., Ponge, D., Raabe, D., and De Geuser, F. (2018). Parameter Free Quantitative Analysis of Atom Probe Data by Correlation Functions: Application to the Precipitation in Al-Zn-Mg-Cu. Scr. Mater. 154, 106–110. doi:10.1016/j.scriptamat.2018.05.024
Keywords: atom probe tomography, radial distribution function, high entropy alloy, atomic ordering, data mining
Citation: Greenhalgh AD, Sanjeewa LD, Luszczek P, Maroulas V, Rios O and Keffer DJ (2021) Assessment of Local Observation of Atomic Ordering in Alloys via the Radial Distribution Function: A Computational and Experimental Approach. Front. Mater. 8:797418. doi: 10.3389/fmats.2021.797418
Received: 18 October 2021; Accepted: 08 December 2021;
Published: 23 December 2021.
Edited by:
Louis Santodonato, Santo Science, United StatesReviewed by:
Fuyang Tian, University of Science and Technology Beijing, ChinaFrançois Vurpillot, Université de Rouen, France
Copyright © 2021 Greenhalgh, Sanjeewa, Luszczek, Maroulas, Rios and Keffer. This is an open-access article distributed under the terms of the Creative Commons Attribution License (CC BY). The use, distribution or reproduction in other forums is permitted, provided the original author(s) and the copyright owner(s) are credited and that the original publication in this journal is cited, in accordance with accepted academic practice. No use, distribution or reproduction is permitted which does not comply with these terms.
*Correspondence: David J. Keffer, ZGtlZmZlckB1dGsuZWR1
†ORCID ID: David J. Keffer, orcid.org/0000-0002-6246-0286