 Wenchao Jin
 Hui Guo
 Pei Sun
 Yansong Wang
- School of Mechanical and Automotive Engineering, Shanghai University of Engineering Science, Shanghai, China
In order to get insight information of the band structure of acoustic metamaterials (AMMs) in condensed matter, periodic lattice structures are analyzed using Bloch’s theorem. Typical approaches of the band structure computation methods, topology optimization, and tunable abilities cannot overcome the gap between the two-dimensional (2D) AMMs theoretical and three-dimensional (3D) specimens’ experimental data yet. In this work, the variation in the results of the band structure obtained from the 2D mathematical model computed with respect to the 3D experimental models, and related cause of the variation is explored. The band structures and mode shapes of the 2D AMMs, quasi-2D models, and 3D specimen models are followed to reveal the boundary conditions and source for the observed differences in band structures. The cause for the discrepancies is verified by using the finite element method (FEM) with corresponding boundary conditions. It is found that outcomes from computational data of the 2D AMMs model are diverted significantly by means of bandgap, band structure, and stress distribution in counterparts of the 3D specimen model. This approach can provide assistance for computing the band structure of 2D AMMs for practical applications.
Introduction
Acoustic metamaterials (AMMs) are basically composite materials with a periodic structure composed of two or more elastic media (Kushwaha et al., 1993). Lately, AMMs have been attracted attention due to the distinctive characteristic of acoustic or elastic waves not being propagated at the specific frequency. Different from single-negative AMMs are mainly used for vibration isolation (An et al., 2020; Chen et al., 2021; Huang et al., 2021), AMMs with double-negative characteristics can be used in unique device designing such as acoustic cloaking (Chen and Chan, 2007; Munteanu and Chiroiu, 2011; Zheng et al., 2014), acoustic imaging (Deng et al., 2009; Molerón and Daraio, 2015; Laureti et al., 2016), waveguiding (Casadei et al., 2012; Cao et al., 2018; Ghasemi Baboly et al., 2018; Cao et al., 2019; Sirota et al., 2021), and acoustic focusing (Li et al., 2012; Al Jahdali and Wu, 2016; Chen et al., 2018). The tunable AMMs also be proposed to provide multiple functions, such as active acoustic metalens (Zhang et al., 2021) and tunable acoustic metasurface (Cao et al., 2021). and Exhibiting exclusive phenomena and feasibility to compute at ease in the counterpart of one- and three-dimensional (1D and 3D) AMMs, the two-dimensional (2D) AMMs have been studied at theoretical and experimental levels (Ding et al., 2010; Dorodnitsyn and Van Damme, 2016; Yu et al., 2017; An et al., 2018; Sang and Sandgren, 2018; Guo et al., 2019; Cheng et al., 2020; Sun et al., 2020; Wang et al., 2020). The general research is carried out the two steps, namely calculation of the band structures of 2D AMMs and experiment with the transmittance of corresponding specimens. The band structure can be obtained by theoretical or numerical methods under the applied 2D boundary conditions (Sigalas and Soukoulis, 1995; Axmann and Kuchment, 1999; Kafesaki and Economou, 1999; Cao et al., 2004a; b; Rabczuk et al., 2004; Ning et al., 2020; Wang et al., 2021). However, the used specimens during the experiments are actually 3D structures, which creates differences with respect to the 2D AMMs model for computing (Bertoldi et al., 2008; Mohammadi et al., 2008; Lv et al., 2013; Shan et al., 2014; Wang et al., 2014; Billon et al., 2019; Gao et al., 2019; Li et al., 2019; Faiz et al., 2020; Muhammad et al., 2020; Huo et al., 2021). The specimens for the experiments are arrayed in 2D periodically, while their physical structure scale is measured in 3D. Notably, the 2D AMMs model is a simplified ideal model, though the comparison of band structure computed by a model with experimental results can be devoid of some practical vibration modes, which may cause inconsistent results. The wave dispersion of the 2D AMMs model and its 3D specimens are analyzed, and significant differences are found in previous research (Krushynska et al., 2017). However, the height range of 3D cases in this research is limited to 0.1–0.5a, and the large height specimen is not considered. Typically, epoxy is used as a matrix material in AMMs, and such a relatively hard material can reduce the influence of the variation in height.
In this work, the computing models for 2D AMMs are defined to compute band structure and transmittance. The results are compared with the corresponding outcomes obtained by different 3D specimen models. In experiments, the specimen of 2D AMMs are actually 3D and 2D is its periodicity. In this case, there will be some difference between the 2D numerical computation results and 2D AMMs specimen experiments results. In this paper, we use the numerical computation results of 3D specimen models to investigate the discrepancies between its results and the 2D numerical computation results. The observed differences between them show the limitation of using computation results of 2D AMMs model to compare with experimental results. The two factors are analyzed to verify the variation i.e., the mode shape displacement distribution of each section along the
Initially, the basic calculation based on the theories of 2D AMMs and corresponding specimens are briefly introduced. Thereafter, the difference in the calculated results are presented, and related reasons is verified. The final concluding remarks is given for detailed analyses.
Mathematical Model of Acoustic Metamaterials
Here, a 2D AMMs consists of an array of straight and infinite cylinders arranged in a square matrix is considered. This kind of structure is widely used since the AMMs were studied(Mead, 1996; Krushynska et al., 2017; Mazzotti et al., 2019). Figure 1 illustrates the lattice structure, where
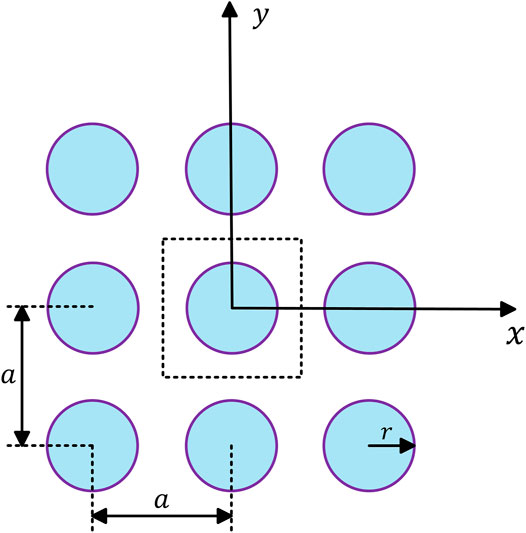
FIGURE 1. The lattice structure of the 2D AMMs.
Based on the considered structure of the 2D AMMs, the corresponding specimen model is shown in Figure 2. It is worth noting that the unit cell of the specimen is 2D periodic array, while its physical structure model is appeared to be in 3D. The distribution of medium in the
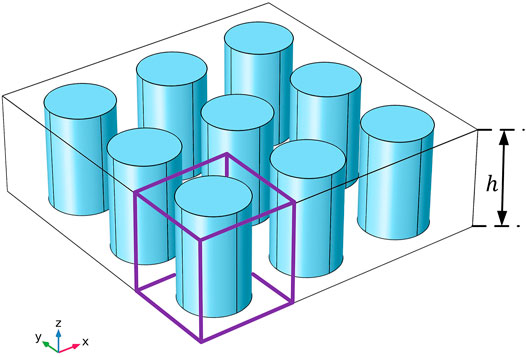
FIGURE 2. The specimen model of the corresponding 2D AMMs.
The equation of motion of an elastic wave propagates in an isotropic medium, can be expressed as
where,
In the case of 2D in-plane mode (
The stress
where,
where,
In 2D periodic array, the structure dimension is expended up to infinity in the
where
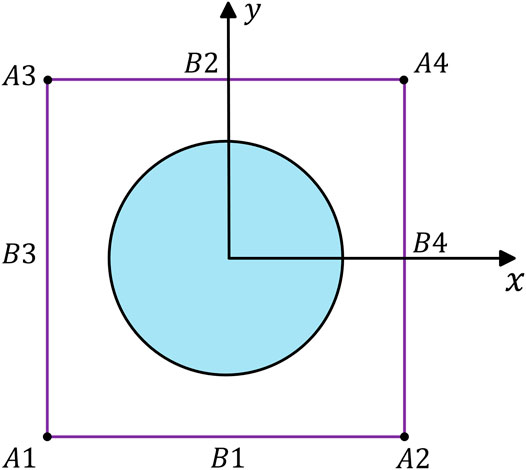
FIGURE 3. The schematic diagram of 2D unit cell and boundary conditions.
However, in the 3D specimen model, the unit cell has periodicity and finiteness in
where,
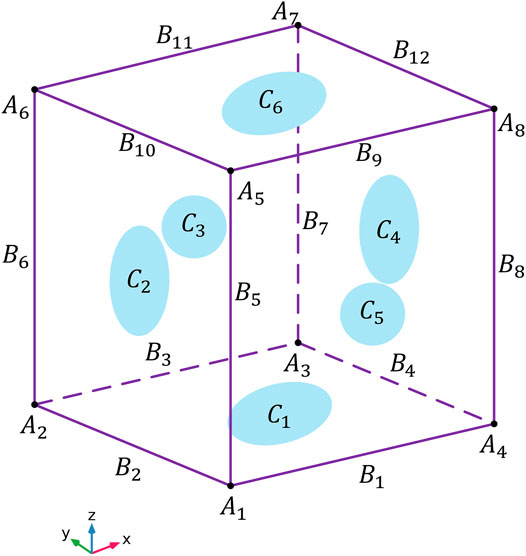
FIGURE 4. The schematic diagram of a unit cell in the 3D specimen model and its boundary conditions. The A, B, and C denote the points, lines, and surfaces nodes of the unit cell.
In order to apply the finite element method (FEM), the continuous systems need to be segmented into discrete one. The Eq. 6 can be expressed as the following equation
Here,
For a given value of the wave vector
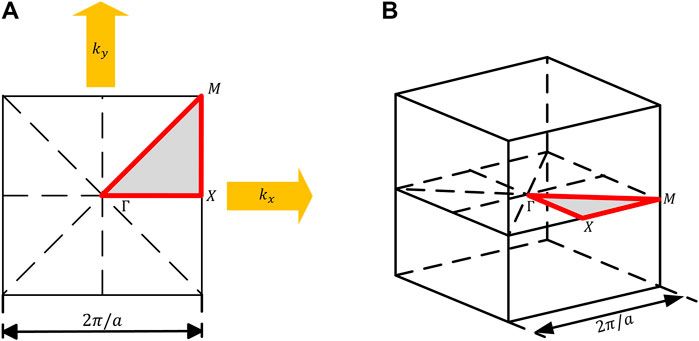
FIGURE 5. The Brillouin zone of (A) 2D AMMs and (B) 3D specimen model. The grey areas indicate the irreducible Brillouin zone and the red lines indicate their contours.
Numerical Analyses
The band structure of the 2D AMMs model and corresponding 3D specimen model with different heights are computed to prove that there are the reasonable differences between them. The clear logic behind the differences is confirmed by computing the band structure of 2D AMMs’ specimens model i.e., 3D specimen model with modified physical conditions. The transmittance is also calculated to verify the accuracy of the band structure.
Differences Between the 2D Acoustic Metamaterials and 3D Specimens Model
In this example, a 2D AMMs, which consisted of straight and infinite cylinders arranged in the square matrix, as shown in Figure 1, with the lattice constant
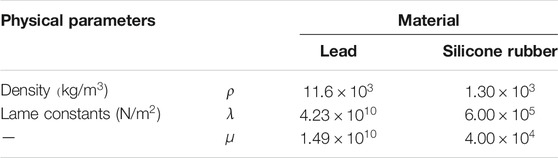
TABLE 1. Physical parameters of lead and silicone rubber (Kittel et al., 1996).
In addition to the band structure, the transmittance along the
Here,
where,
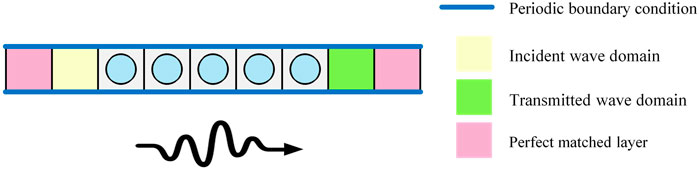
FIGURE 6. The finite structure for transmittance computation.
Based on the aforementioned structure, the band structure and the transmittance are computed. The dynamic responses of the system are investigated via FEM using the commercial software COMSOL Multiphysics. For wave propagation problems, using 12 degrees of freedom can generally obtain a solution with an error rate of less than 1%. With the quadratic elements used in FEM models, 6 second-order elements are sufficient for each wave period. Therefore, in order to determine the mesh size, the wavelength can be obtained by
where,
In order to get clarification for the difference in values, the quasi-2D AMMs model is considered. The ideal 2D AMMs models have no displacement along the z-axis direction. For specimen models, they are completely free and can have displacement in any direction. In order to make the connection between the two cases more clearly, a quasi-2D AMMs model as a midpoint is created. The quasi-2D AMMs model is based on the 3D specimen model and is restricted in the displacement along the z-axis direction. Thus, the additional boundary condition is
where,
By sweeping the Bloch wave vector along the contour of an irreducible Brillouin zone (Figure 5), the corresponding band structure is obtained. By using different frequencies of the incident wave in the finite structure, the transmittance can be obtained. Figure 7 shows the band structure of the 2D AMMs model, quasi-2D model, and 3D specimen models with the given height of
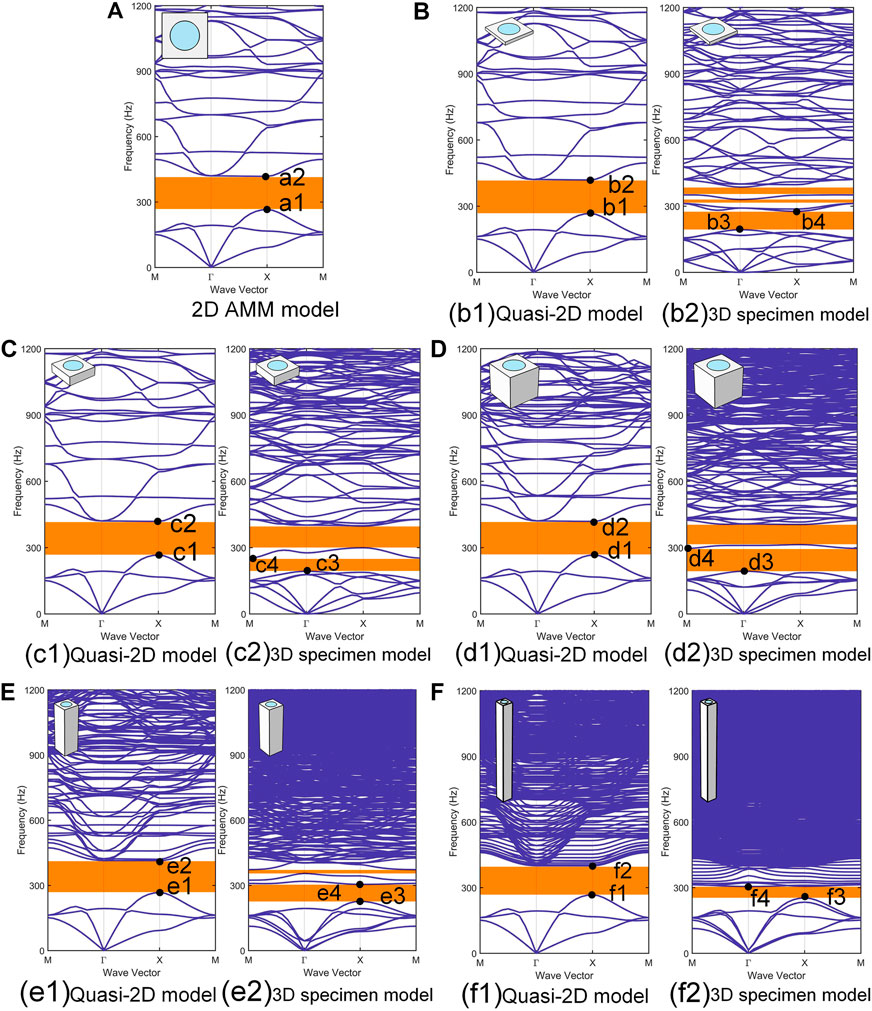
FIGURE 7. The band structure and corresponding transmittance of (A) 2D AMMs model and (b1, c1, d1, e1, f1) the quasi-2D models and (b2, c2, d2, e2, f2) specimen models with the height set as
The band structure of the 2D AMMs (Figure 7A) and quasi-2D model with smaller heights [Figure 7 (b1, c1, d1, e1, f1)] are similar. To evaluate band structure difference between 2D AMMs model and quasi-2D model quantitatively, the error rate of the energy band can be obtained by
where,
The band structure of the quasi-2D model [Figure 7 (b1, c1, d1, e1, f1)] and 3D specimen model [Figure 7 (b2, c2, d2, e2, f2)] with different heights showed a significant difference. Even at smaller heights [Figure 7 (b1, b2)], the band structure is significantly different. At a height of
In order to understand the physical mechanism due to the variation in the band structure, the mode shapes at the edges of the first bandgap are presented in Figure 8. By comparing the 2D AMMs and quasi-2D models, the obtained mode shape at the edges of the first bandgap are similar [Figure 8 (a1–f1), (a2–f2)]. The mode shapes of both upper edges and lower edges are observed as the translational motion mode. The movement of scatterer is dominant at the lower edges. At the upper edges, the movement of the matrix becomes dominant. This is a typical local resonance phenomenon. Further, by comparing the quasi-2D model and 3D specimen model, the observed mode shapes of both upper and lower edges showed a significant variation. The displacement fields of the quasi-2D model at the high-symmetry point
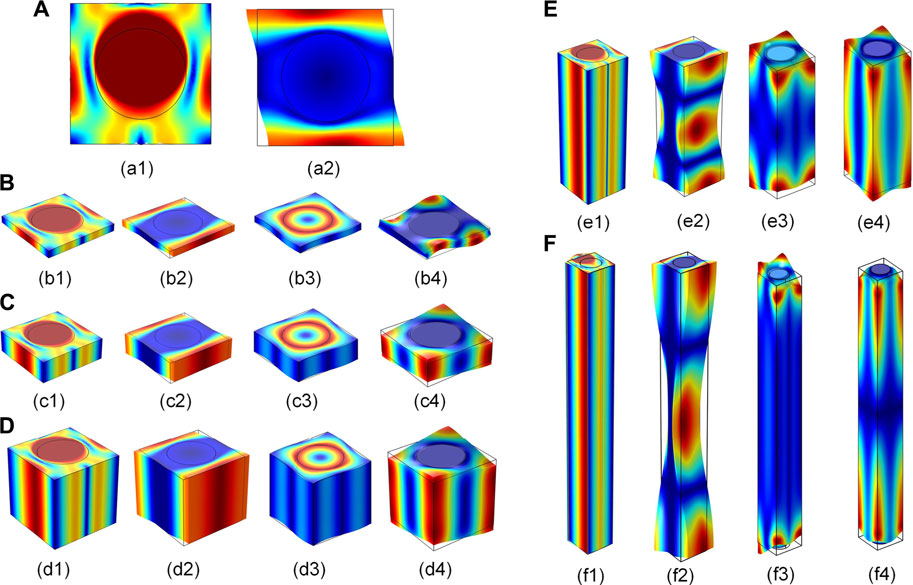
FIGURE 8. Mode shapes of the first bandgap edges in Figure 7.
According to the band structure and mode shapes of the different models above, a method to reduce the discrepancies between 2D AMMs and corresponding 3D specimen model is proposed. It is clear that at the lower height (
The transmittance along
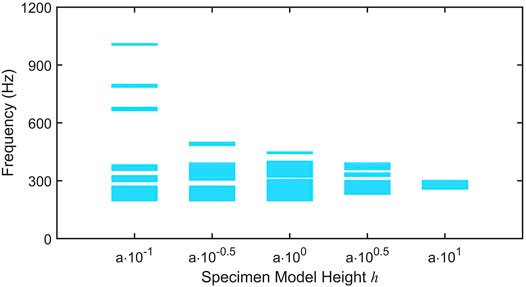
FIGURE 9. The Γ ̵X band structure and corresponding transmittance of (A) 2D AMMs model, (b1–b5) the quasi-2D model and (c1–c5) the specimen models with the height set as
The
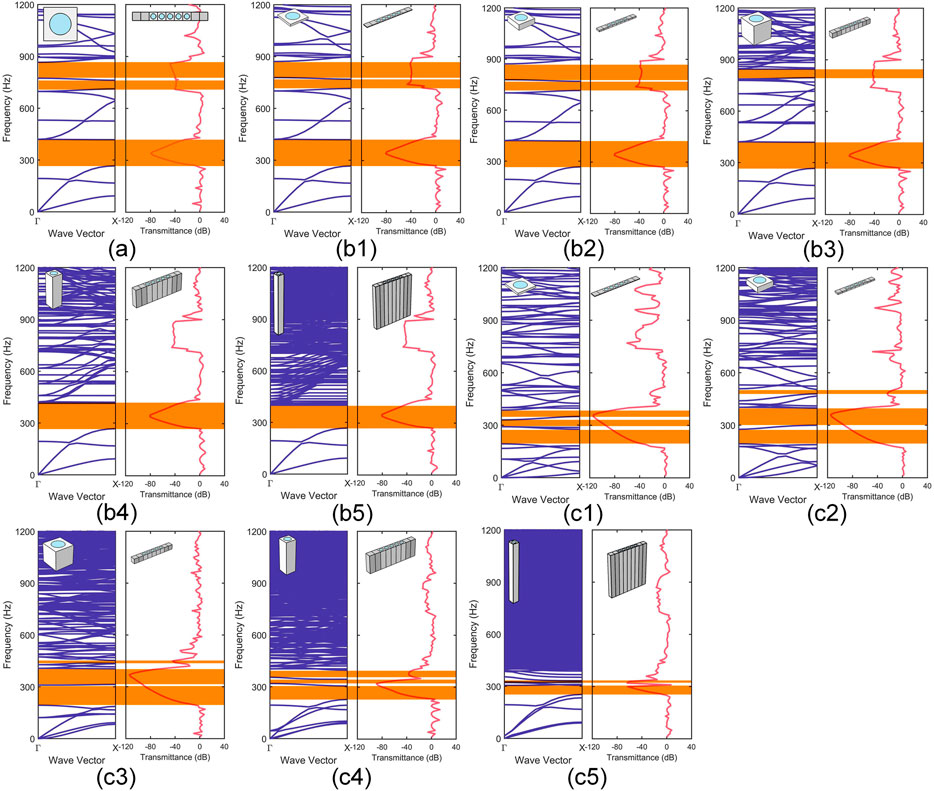
FIGURE 10. The Γ ̵X bandgap frequency range of specimen models with the different heights.
The Bandgaps of Four-point Star and Cross Ligament Acoustic Metamaterials
In order to verify the prevalence of differences in the 3D specimen models with different heights, the investigations by considering two AMMs’ specimen models are carried out. Figure 11 shows the structures of two AMMs. The physical parameters of the matrix and scatterer are the same as the previous model i.e., silicone rubber and the lead, respectively, as listed in Table 1. The
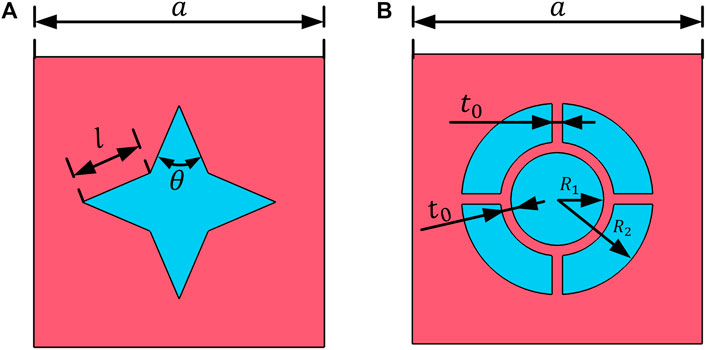
FIGURE 11. The structure of two AMMs. Red and blue represent the matrix and scatterer, respectively. (A) The four-point star AMMs with lattice constant
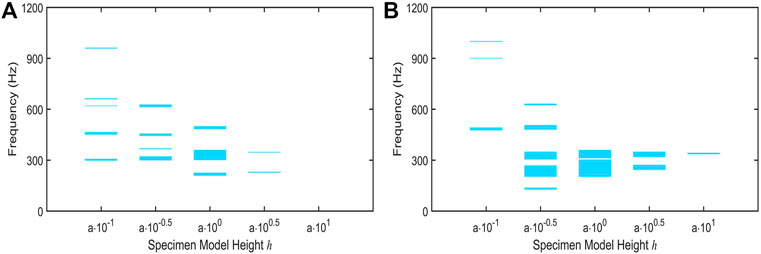
FIGURE 12. The
Verification of the Existed Causes of Difference
To investigate the exact cause for the difference, the displacement along the
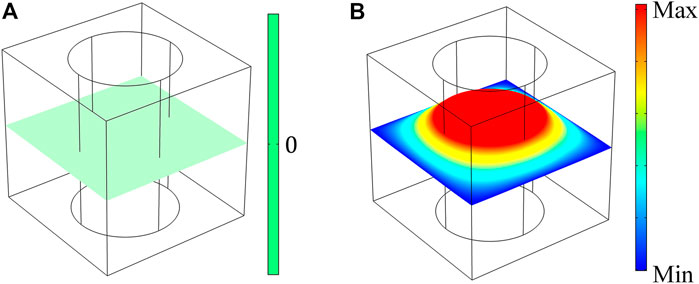
FIGURE 13. The displacement along the
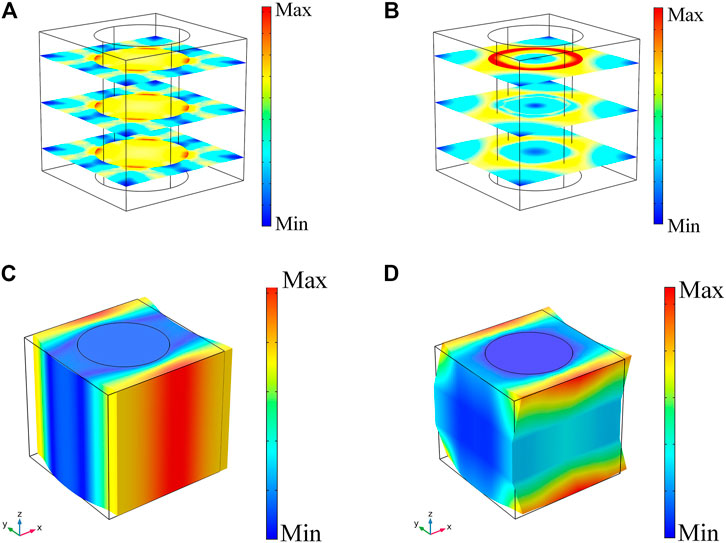
FIGURE 14. The stress distribution of different sections along
On the other hand, in the 2D AMMs model, stress distribution of each section along the
As revealed above, the 2D AMMs and quasi-2D models showed quite similarities in results up to a certain extent. While the 2D AMMs and corresponding 3D specimen models showed a significant difference in the physical properties, and 3D specimen models with different heights have significant divergence in physical properties of materials. Therefore, the computation results of the 2D AMMs can be useful to get insight information from experimental results, meanwhile, data computed with 3D specimen models with different heights can provide reliability in terms of theoretical and experiments study. After noticeable differences between the 2D and 3D cases, 3D specimen models are indispensable especially for the larger heights and softer materials.
Conclusion
In this study, the difference in band structures between 2D AMMs and 3D specimen models are demonstrated and analyzed. The mathematical models of 2D AMMs and specimen models are reviewed to identify computation conditions in the band structure. The band structures are obtained by FEM and verified by transmittance behavior. The difference between the structure of the energy bands can prove that there are dissimilarities in the physical characteristics of 2D AMMs and 3D specimen models. It is noteworthy that variation in the height of unit cell can cause significant variation in band structures. The quasi-2D models’ band structures are also computed to investigate the true reason for variation in band structure. The changes of the mode shapes cause the variation, and these are revealed below. The mode shapes at the edges of the first bandgap are investigated. The other two 2D AMMs’ specimen models, namely four-point star and cross ligament AMMs with different heights are computed to verify divergent physical properties. The difference in the displacement along
Data Availability Statement
The raw data supporting the conclusion of this article will be made available by the authors, without undue reservation.
Author Contributions
WJ, HG, and PS conceived and designed the manuscript. YW and TY revised it. All authors contributed to the article and approved the submitted version.
Funding
This work was supported by the Project of National Natural Science Foundation of China (No. 52172371), and partly supported by the Program for Professor of Special Appointment (Eastern Scholar) at Shanghai Institutions of Higher Learning, Program of Shanghai Academic/Technology Research Leader (No. 21XD1401100), and Technical Service Platform for Vibration and Noise Testing and Control of New Energy Vehicles (No. 18DZ2295900).
Conflict of Interest
The authors declare that the research was conducted in the absence of any commercial or financial relationships that could be construed as a potential conflict of interest.
Publisher’s Note
All claims expressed in this article are solely those of the authors and do not necessarily represent those of their affiliated organizations, or those of the publisher, the editors and the reviewers. Any product that may be evaluated in this article, or claim that may be made by its manufacturer, is not guaranteed or endorsed by the publisher.
References
Al Jahdali, R., and Wu, Y. (2016). High Transmission Acoustic Focusing by Impedance-Matched Acoustic Meta-Surfaces. Appl. Phys. Lett. 108 (3), 031902. doi:10.1063/1.4939932
An, X., Fan, H., and Zhang, C. (2018). Elastic Wave and Vibration Bandgaps in Two-Dimensional Acoustic Metamaterials with Resonators and Disorders. Wave Motion 80, 69–81. doi:10.1016/j.wavemoti.2018.04.002
An, X., Lai, C., Fan, H., and Zhang, C. (2020). 3D Acoustic Metamaterial-Based Mechanical Metalattice Structures for Low-Frequency and Broadband Vibration Attenuation. Int. J. Sol. Struct. 191-192, 293–306. doi:10.1016/j.ijsolstr.2020.01.020
Axmann, W., and Kuchment, P. (1999). An Efficient Finite Element Method for Computing Spectra of Photonic and Acoustic Band-Gap Materials. J. Comput. Phys. 150 (2), 468–481. doi:10.1006/jcph.1999.6188
Bertoldi, K., Boyce, M. C., Deschanel, S., Prange, S. M., and Mullin, T. (2008). Mechanics of Deformation-Triggered Pattern Transformations and Superelastic Behavior in Periodic Elastomeric Structures. J. Mech. Phys. Sol. 56 (8), 2642–2668. doi:10.1016/j.jmps.2008.03.006
Billon, K., Ouisse, M., Sadoulet-Reboul, E., Collet, M., Butaud, P., Chevallier, G., et al. (2019). Design and Experimental Validation of a Temperature-Driven Adaptive Phononic crystal Slab. Smart Mater. Struct. 28 (3), 035007. doi:10.1088/1361-665x/aaf670
Cao, W.-K., Wu, L.-T., Zhang, C., Ke, J.-C., Cheng, Q., Cui, T.-J., et al. (2019). Asymmetric Transmission of Acoustic Waves in a Waveguide via Gradient index Metamaterials. Sci. Bull. 64 (12), 808–813. doi:10.1016/j.scib.2019.01.002
Cao, W. K., Wu, L. T., Zhang, C., Song, G. Y., Ke, J. C., Cheng, Q., et al. (2018). Acoustic Surface Waves on Three-Dimensional Groove Gratings with Sub-wavelength Thickness. Appl. Phys. Express 11 (8), 087301. doi:10.7567/apex.11.087301
Cao, W. K., Zhang, C., Wu, L. T., Guo, K. Q., Ke, J. C., Cui, T. J., et al. (2021). Tunable Acoustic Metasurface for Three-Dimensional Wave Manipulations. Phys. Rev. Appl. 15 (2), 024026. doi:10.1103/PhysRevApplied.15.024026
Cao, Y., Hou, Z., and Liu, Y. (2004a). Convergence Problem of Plane-Wave Expansion Method for Phononic Crystals. Phys. Lett. A 327 (2-3), 247–253. doi:10.1016/j.physleta.2004.05.030
Cao, Y., Hou, Z., and Liu, Y. (2004b). Finite Difference Time Domain Method for Band-Structure Calculations of Two-Dimensional Phononic Crystals. Solid State Commun. 132 (8), 539–543. doi:10.1016/j.ssc.2004.09.003
Casadei, F., Delpero, T., Bergamini, A., Ermanni, P., and Ruzzene, M. (2012). Piezoelectric Resonator Arrays for Tunable Acoustic Waveguides and Metamaterials. J. Appl. Phys. 112 (6), 064902. doi:10.1063/1.4752468
Chen, C., Guo, Z., Liu, S., Feng, H., and Qiao, C. (2021). Hybrid Acousto-Elastic Metamaterials for Simultaneous Control of Low-Frequency Sound and Vibration. J. Appl. Phys. 129 (5), 054902. doi:10.1063/5.0028332
Chen, D.-C., Zhu, X.-F., Wei, Q., Wu, D.-J., and Liu, X.-J. (2018). Broadband Acoustic Focusing by Airy-like Beams Based on Acoustic Metasurfaces. J. Appl. Phys. 123 (4), 044503. doi:10.1063/1.5010705
Chen, H., and Chan, C. T. (2007). Acoustic Cloaking in Three Dimensions Using Acoustic Metamaterials. Appl. Phys. Lett. 91 (18), 183518. doi:10.1063/1.2803315
Cheng, Q., Guo, H., Yuan, T., Sun, P., Guo, F., and Wang, Y. (2020). Topological Design of Square Lattice Structure for Broad and Multiple Band Gaps in Low-Frequency Range. Extreme Mech. Lett. 35, 100632. doi:10.1016/j.eml.2020.100632
Deng, K., Ding, Y., He, Z., Zhao, H., Shi, J., and Liu, Z. (2009). Theoretical Study of Subwavelength Imaging by Acoustic Metamaterial Slabs. J. Appl. Phys. 105 (12), 124909. doi:10.1063/1.3153976
Ding, C., Hao, L., and Zhao, X. (2010). Two-dimensional Acoustic Metamaterial with Negative Modulus. J. Appl. Phys. 108 (7), 074911. doi:10.1063/1.3493155
Dorodnitsyn, V., and Van Damme, B. (2016). Two-dimensional Fluid-Filled Closed-Cell Cellular Solid as an Acoustic Metamaterial with Negative index. Phys. Rev. B 93 (13), 134302. doi:10.1103/PhysRevB.93.134302
Faiz, M. S., Addouche, M., Zain, A. R. M., Siow, K. S., Chaalane, A., and Khelif, A. (2020). Experimental Demonstration of a Multichannel Elastic Wave Filter in a Phononic crystal Slab. Appl. Sci. 10 (13), 4594. doi:10.3390/app10134594
Gao, N., Li, J., Bao, R.-h., and Chen, W.-q. (2019). Harnessing Uniaxial Tension to Tune Poisson's Ratio and Wave Propagation in Soft Porous Phononic Crystals: an Experimental Study. Soft Matter 15 (14), 2921–2927. doi:10.1039/C8SM02468E
Ghasemi Baboly, M., Reinke, C. M., Griffin, B. A., El-Kady, I., and Leseman, Z. C. (2018). Acoustic Waveguiding in a Silicon Carbide Phononic Crystals at Microwave Frequencies. Appl. Phys. Lett. 112 (10), 103504. doi:10.1063/1.5016380
Guo, F., Guo, H., Sun, P., Yuan, T., and Wang, Y. (2019). Study on Band gap Properties of Two-Dimensional Phononic Crystals Based on Generalized Viscoelastic Modeling. Mod. Phys. Lett. B 33 (32), 1950403. doi:10.1142/s0217984919504037
Huang, H., Cao, E., Zhao, M., Alamri, S., and Li, B. (2021). Spider Web-Inspired Lightweight Membrane-type Acoustic Metamaterials for Broadband Low-Frequency Sound Isolation. Polymers 13 (7), 1146. doi:10.3390/polym13071146
Huo, S.-y., Chen, J.-j., Huang, H.-b., Wei, Y.-j., Tan, Z.-h., Feng, L.-y., et al. (2021). Experimental Demonstration of valley-protected Backscattering Suppression and Interlayer Topological Transport for Elastic Wave in Three-Dimensional Phononic Crystals. Mech. Syst. Signal Process. 154, 107543. doi:10.1016/j.ymssp.2020.107543
Kafesaki, M., and Economou, E. N. (1999). Multiple-scattering Theory for Three-Dimensional Periodic Acoustic Composites. Phys. Rev. B 60 (17), 11993–12001. doi:10.1103/PhysRevB.60.11993
Kittel, C., McEuen, P., and McEuen, P. (1996). Introduction to Solid State Physics. New York: Wiley.
Krushynska, A. O., Miniaci, M., Kouznetsova, V. G., and Geers, M. G. D. (2017). Multilayered Inclusions in Locally Resonant Metamaterials: Two-Dimensional versus Three-Dimensional Modeling. J. Vib. Acoust. 139 (2), 024501–024504. doi:10.1115/1.4035307
Kushwaha, M. S., Halevi, P., Dobrzynski, L., and Djafari-Rouhani, B. (1993). Acoustic Band Structure of Periodic Elastic Composites. Phys. Rev. Lett. 71 (13), 2022–2025. doi:10.1103/PhysRevLett.71.2022
Laureti, S., Hutchins, D. A., Davis, L. A. J., Leigh, S. J., and Ricci, M. (2016). High-resolution Acoustic Imaging at Low Frequencies Using 3D-Printed Metamaterials. AIP Adv. 6 (12), 121701. doi:10.1063/1.4968606
Li, D., Zigoneanu, L., Popa, B.-I., and Cummer, S. A. (2012). Design of an Acoustic Metamaterial Lens Using Genetic Algorithms. J. Acoust. Soc. Am. 132 (4), 2823–2833. doi:10.1121/1.4744942
Li, J., Wang, Y., Chen, W., Wang, Y.-S., and Bao, R. (2019). Harnessing Inclusions to Tune post-buckling Deformation and Bandgaps of Soft Porous Periodic Structures. J. Sound Vib. 459, 114848. doi:10.1016/j.jsv.2019.114848
Lv, H., Tian, X., Wang, M. Y., and Li, D. (2013). Vibration Energy Harvesting Using a Phononic crystal with point Defect States. Appl. Phys. Lett. 102 (3), 034103. doi:10.1063/1.4788810
Maurin, F., Claeys, C., Deckers, E., and Desmet, W. (2018). Probability that a Band-gap Extremum Is Located on the Irreducible Brillouin-Zone Contour for the 17 Different Plane Crystallographic Lattices. Int. J. Sol. Struct. 135, 26–36. doi:10.1016/j.ijsolstr.2017.11.006
Mazzotti, M., Bartoli, I., and Miniaci, M. (2019). Modeling Bloch Waves in Prestressed Phononic Crystal Plates. Front. Mater. 6, 74. doi:10.3389/fmats.2019.00074
Mead, D. M. (1996). Wave Propagation in Continuous Periodic Structures: Research Contributions from Southampton, 1964-1995. J. Sound Vib. 190 (3), 495–524. doi:10.1006/jsvi.1996.0076
Mohammadi, S., Eftekhar, A. A., Khelif, A., Hunt, W. D., and Adibi, A. (2008). Evidence of Large High Frequency Complete Phononic Band Gaps in Silicon Phononic crystal Plates. Appl. Phys. Lett. 92 (22), 221905. doi:10.1063/1.2939097
Molerón, M., and Daraio, C. (2015). Acoustic Metamaterial for Subwavelength Edge Detection. Nat. Commun. 6 (1), 1–6. doi:10.1038/ncomms9037
Muhammad, C. W., Lim, J. T. H., and Zhao, Z. (2020). Lightweight Architected Lattice Phononic Crystals with Broadband and Multiband Vibration Mitigation Characteristics. Extreme Mech. Lett. 41, 100994. doi:10.1016/j.eml.2020.100994
Munteanu, L., and Chiroiu, V. (2011). On Three-Dimensional Spherical Acoustic Cloaking. New J. Phys. 13 (8), 083031. doi:10.1088/1367-2630/13/8/083031
Ning, S., Yang, F., Luo, C., Liu, Z., and Zhuang, Z. (2020). Low-frequency Tunable Locally Resonant Band Gaps in Acoustic Metamaterials through Large Deformation. Extreme Mech. Lett. 35, 100623. doi:10.1016/j.eml.2019.100623
Rabczuk, T., Belytschko, T., and Xiao, S. P. (2004). Stable Particle Methods Based on Lagrangian Kernels. Comput. Methods Appl. Mech. Eng. 193 (12-14), 1035–1063. doi:10.1016/j.cma.2003.12.005
Sang, S., and Sandgren, E. (2018). Study of Two-Dimensional Acoustic Metamaterial Based on Lattice System. J. Vib. Eng. Technol. 6 (6), 513–521. doi:10.1007/s42417-018-0068-6
Shan, S., Kang, S. H., Wang, P., Qu, C., Shian, S., Chen, E. R., et al. (2014). Harnessing Multiple Folding Mechanisms in Soft Periodic Structures for Tunable Control of Elastic Waves. Adv. Funct. Mater. 24 (31), 4935–4942. doi:10.1002/adfm.201400665
Sigalas, M. M., and Soukoulis, C. M. (1995). Elastic-wave Propagation through Disordered And/or Absorptive Layered Systems. Phys. Rev. B 51 (5), 2780–2789. doi:10.1103/PhysRevB.51.2780
Sirota, L., Sabsovich, D., Lahini, Y., Ilan, R., and Shokef, Y. (2021). Real-time Steering of Curved Sound Beams in a Feedback-Based Topological Acoustic Metamaterial. Mech. Syst. Signal Process. 153, 107479. doi:10.1016/j.ymssp.2020.107479
Sun, P., Zhang, Z., Guo, H., Liu, N., and Wang, Y. (2020). Hierarchical Square Honeycomb Metamaterials with Low-Frequency Broad Bandgaps and Flat Energy Bands Characteristics. J. Appl. Phys. 128 (23), 235102. doi:10.1063/5.0014846
Wang, H., Zhang, Y., Lin, W., and Qin, Q.-H. (2020). A Novel Two-Dimensional Mechanical Metamaterial with Negative Poisson's Ratio. Comput. Mater. Sci. 171, 109232. doi:10.1016/j.commatsci.2019.109232
Wang, L., Zheng, H., Zhao, M., Shi, L., and Hou, S. (2021). Petrov-Galerkin Method for the Band Structure Computation of Anisotropic and Piezoelectric Phononic Crystals. Appl. Math. Model. 89, 1090–1105. doi:10.1016/j.apm.2020.08.026
Wang, P., Casadei, F., Shan, S., Weaver, J. C., and Bertoldi, K. (2014). Harnessing Buckling to Design Tunable Locally Resonant Acoustic Metamaterials. Phys. Rev. Lett. 113 (1), 014301. doi:10.1103/PhysRevLett.113.014301
Yu, X., Lu, Z., Cui, F., Cheng, L., and Cui, Y. (2017). Tunable Acoustic Metamaterial with an Array of Resonators Actuated by Dielectric Elastomer. Extreme Mech. Lett. 12, 37–40. doi:10.1016/j.eml.2016.07.003
Zhang, C., Cao, W. K., Wu, L. T., Ke, J. C., Jing, Y., Cui, T. J., et al. (2021). A Reconfigurable Active Acoustic Metalens. Appl. Phys. Lett. 118 (13), 133502. doi:10.1063/5.0045024
Keywords: acoustic metamaterials, band structure computation, finite element method, discrepancy analysis, bloch’s theorem
Citation: Jin W, Guo H, Sun P, Wang Y and Yuan T (2021) Numerical Investigation of Discrepancies Between Two-Dimensional and Three-Dimensional Acoustic Metamaterials. Front. Mater. 8:759740. doi: 10.3389/fmats.2021.759740
Received: 17 August 2021; Accepted: 16 September 2021;
Published: 30 September 2021.
Edited by:
Yun Jing, The Pennsylvania State University (PSU), United StatesReviewed by:
Cheng Zhang, Wuhan University of Technology, ChinaHao-Wen Dong, Beijing Institute of Technology, China
Xu Wang, Tongji University, China
Copyright © 2021 Jin, Guo, Sun, Wang and Yuan. This is an open-access article distributed under the terms of the Creative Commons Attribution License (CC BY). The use, distribution or reproduction in other forums is permitted, provided the original author(s) and the copyright owner(s) are credited and that the original publication in this journal is cited, in accordance with accepted academic practice. No use, distribution or reproduction is permitted which does not comply with these terms.
*Correspondence: Hui Guo, aGdzdWVzQDE2My5jb20=