 Xianlun Leng
 Chuan Wang1,2†
95% of researchers rate our articles as excellent or good
Learn more about the work of our research integrity team to safeguard the quality of each article we publish.
Find out more
ORIGINAL RESEARCH article
Front. Mater. , 25 November 2021
Sec. Mechanics of Materials
Volume 8 - 2021 | https://doi.org/10.3389/fmats.2021.740388
The preparation of transparent materials suitable for simulating different rock and soil masses is the foundation for image-based physical modeling tests in studying deformation and failure mechanisms in geotechnical media. A transparent cemented soil (TCS) with similar geotechnical properties of natural soil and soft rock was prepared using fused quartz as the skeleton, hydrophobic fumed silica powder as the cement and mixed mineral oil of 15# white oil and n-dodecane as the pore fluid. Eleven groups of TCS samples with different shear strengths were synthesized by adjusting the content or mass ratio of the cement and particle size or gradation of the skeleton. Contrasting tests of unconsolidated-undrained triaxial compression were carried out and the mechanical characteristics of TCS were analyzed, showing that the stress-strain relationship, shear strength and failure mode of TCS are similar to those of natural soil. The mechanical parameters of TCS undergo complex variation with the factors, and the mesoscopic mechanism of the changes therein was revealed with the help of optical microscope photos. The similarity ratio of TCS to soft rock was derived according to geometries and stress conditions of laboratory model tests, demonstrating the feasibility of using TCS as similar materials to soft rock. Moreover, empirical formulas for the change of shear strength parameters with the factors were fitted to facilitate the preparation of TCS with target shear strength in the future. The findings can provide a basis for preparing transparent similar materials to natural soil and soft rock in physical modeling tests.
The observation of deformation and failure of rock and soil mass through laboratory model tests is important when trying to reveal catastrophic evolution mechanisms in geotechnical engineering; however, traditional model tests based on natural geotechnical materials do not allow observing catastrophic evolution processes therein, which hinders the development of model tests. To solve the problem, researchers have developed a set of technologies for visual tests based on transparent soils (Mannheimer and Oswald, 1993; Pincus et al., 1994). This technology allows visualization of deformation and failure evolution in a rock and soil mass (Sadek et al., 2003; White et al., 2003) by replacing natural geotechnical materials with synthetic transparent soils to conduct model tests and combining this with optical image processing technologies, such as digital image correlation (DIC) and particle image velocimetry (PIV) (White et al., 2001; Take and Bolton, 2002). One of the key points of this technology is to prepare transparent soils with similar mechanical properties to conventional rock and soil mass.
Transparent soil used in the technology is a two-phase medium consisting of both the skeleton and pore fluid components (Iskander et al., 2015; Ganiyu et al., 2016). Materials representing the skeleton mainly include fused quartz, fused silica, fumed silica, amorphous silica and silica gel (Ganiyu et al., 2016). Mixed liquid with a refractive index the same as the skeleton is used as the pore fluid and the commonly used pore fluid includes mixed mineral oil containing n-dodecane and 15# white oil and a solution formed by dissolving solid calcium bromide in water (Zhang et al., 2014; Kong et al., 2016). At present, two conventional methods are used to synthesize transparent soil.
The first method is to synthesize transparent soil by using (micron-scale) amorphous silica (Pincus et al., 1994; Iskander, 1998; Iskander et al., 2002a) or fumed silica (Gill and Lehane, 2001; Hird and Stanier, 2010) as the skeleton: such soil has similar geotechnical properties to soft clay. Researchers (Pincus et al., 1994; Iskander, 1998; Iskander et al., 2002a) prepared transparent soil using amorphous silica with four different particle sizes (1.4, 10, 25, and 175 μm) and proved that the transparent soil has similar stress–strain responses, consolidation behavior, and hydraulic conductivity to common clay as evinced by triaxial test data. Afterwards, by changing the particle size and gradation of amorphous silica, further studies of mechanical properties of such transparent soil (Lei et al., 2019; Wu et al., 2020b) indicated that the cohesion and angle of internal friction of such transparent clay are about 10 kPa and 14–18°, respectively. Such transparent clay is mainly used in physical modeling tests, such as pile sinking in soft clay (McKelvey et al., 2004; Hird and Stanier, 2010) and consolidation and drainage of soft clay foundation (Liu and Iskander, 2010; Beckett and Augarde, 2011).
The second is to synthesize transparent soil using (millimeter-scale) fused silica (Cao et al., 2011; Sun and Liu, 2014) or fused quartz (Iskander and Liu, 2010; Ezzein and Bathurst, 2011; Guzman and Iskander, 2013; Kashuk et al., 2014), or (nano-scale) silica gel (Iskander et al., 2002b; Sadek et al., 2002) as the skeleton: such soil shows similar geotechnical properties to sand. Experimental investigations indicated that the angle of internal friction of transparent sand prepared with amorphous silica gel ranges from 29 to 42° (Iskander et al., 2002b; Sadek et al., 2002) and those prepared by fused silica or fused quartz is about 38–45° (Cao et al., 2011; Kong et al., 2013; Guzman et al., 2014; Kong et al., 2014). The three types of transparent sand have no, or little, cohesion (≤1 kPa). Such transparent sand is mainly used in physical modeling tests, such as tests on deformation of soil mass around driven piles and uplift-resistant piles (Yuan et al., 2019; Zhou et al., 2019; Chen et al., 2020), stability of tunneling (Ahmed and Iskander, 2011a; Ahmed and Iskander, 2011b; Zhang et al., 2018), soil-geosynthetic interactions (Bathurst and Ezzein, 2015), deformation of simplified slopes under effects of water (Sui and Zheng, 2018; Maghsoudi et al., 2020) and pore flow characteristics of porous media (Serrano et al., 2011; Liang et al., 2019; Wu et al., 2020b).
Furthermore, Kong et al. (2020) and Wu et al. (2020a) recently synthesized a variety of new transparent soil with the same strength, compression, and consolidation characteristics as natural silt by using materials such as Ultrez10, NaOH powder, Aristoflex AVC, and purified water. Such transparent soil has been rarely used in model tests due to the cost of the raw materials or unsatisfactory geotechnical properties (such as a low angle of internal friction).
Defects reducing the strength (the angle of internal friction or cohesion) mean that the aforementioned transparent soil can only be used to simulate a few specific rock and soil masses and is difficult to form physical models in more complex shapes, such as steep slopes and underground caverns. Therefore, it is important to prepare transparent soil with strength akin to that of common geotechnical materials for performing relevant model tests. By combining the advantages of the above two conventional methods for preparing transparent soil, Wei et al. (2019); Lanting et al. (2020) prepared a transparent cemented soil (TCS) by adding fumed silica powder (cement) into fused quartz-based transparent sand and proved that its mechanical and hydraulic properties make it suitable for simulating common clay. There is a lack of further research into the quantitative mixing ratio of each component, particle size and gradation of the skeleton and compactness of the soil mass in TCS, so it is difficult to apply it directly to physical models.
By referring to the idea of Wei et al. (2019); Lanting et al. (2020) for preparing TCS, a nano-scale hydrophobic fumed silica powder as cement was added to the preparation of transparent sand as described in previous studies (Iskander and Liu, 2010; Ezzein and Bathurst, 2011; Guzman et al., 2014; Kong et al., 2014) and a new TCS was prepared. By controlling the contents and mass ratios of fused quartz and silica powder as well as the particle size distribution of fused quartz, TCS showed geotechnical properties akin to those of common clay or soft rock. In view of the factors affecting the geotechnical properties, 11 groups of test schemes under different mixing ratios in TCS were designed, and influences of the factors on geotechnical parameters (such as cohesion, angle of internal friction, and Young’s modulus) of TCS and their correlations were assessed through unconsolidated-undrained (UU) triaxial shear tests. Moreover, the influence mechanism of the factors on the strength was analyzed from a mesoscopic perspective, and the feasibility of using TCS as a substitute for natural clay and similar materials to soft rock was discussed. This could provide a basis for the use of transparent similar materials for clay and soft rock in physical modeling in geotechnical engineering.
Fused quartz was used as the skeleton of TCS. Iskander and Liu (2010) first used fused quartz as the material representing the skeleton of a transparent sand. Ezzein and Bathurst (2011) found that fused quartz is similar to natural sand in terms of the structure and shape and can replace sand in meso-structural terms. Other experimental studies (Kong et al., 2013; Guzman et al., 2014; Kong et al., 2014) show that fused quartz has similar mechanical properties to sand and can replace sand in terms of the mechanical properties. The fused quartz used (purchased from Xinyi Wanhe Mining Co., Ltd, and shown in Figure 1A) was classified into three groups according to particle sizes of 0.2–0.5, 0.5 to 1.0, and 1.0–2.0 mm. The specific gravity and refractive index of the particles separately are 2.2 and 1.4585 in each group. In the natural state of accumulation, the dry densities of three groups of fused quartz are 1.40, 1.25, and 1.10 g/cm3, and their void ratios are 36, 43, and 50%, respectively.
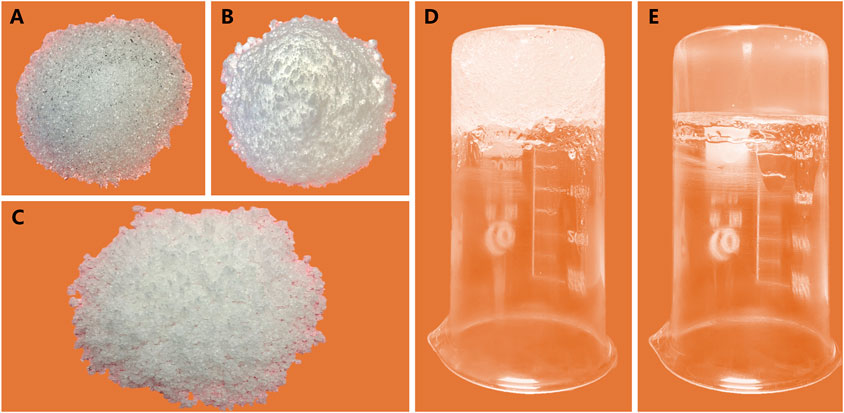
FIGURE 1. Components and preparation process of TCS: (A) fused quartz; (B) hydrophobic fumed silica powder; (C) mixture of fused quartz, hydrophobic fumed silica powder and mixed mineral oil; (D) unsaturated cemented soil (white and opaque); (E) saturated cemented soil (colorless and transparent).
Mixed mineral oil containing n-dodecane and 15# white oil was used as the pore fluid of TCS. To prevent refraction of light between the pores and skeleton to ensure high transparency of TCS, it is necessary to prepare a pore fluid whose refractive index is consistent with that of fused quartz. At 26°C, the refractive indexes of n-dodecane and 15# white oil (both were purchased from Guangdong Wengjiang Chemical Reagent Co., Ltd) are 1.424 and 1.469, respectively. The refractive index of mixed mineral oil increases with increasing temperature. In general, when the mass ratio of n-dodecane to 15# white oil is 1:3.5 to 1:8, the refractive indexes of mixed mineral oil and fused quartz are consistent or similar. The refractive index of mixed mineral oil can be reduced by adding n-dodecane when it is higher than that of fused quartz and can be increased by adding 15# white oil as it is lower than that of fused quartz.
Nano-scale hydrophobic fumed silica powder was utilized as cement of TCS. The method for preparing transparent soil by adding (micron-scale) silica powder into mixed mineral oil was proposed by Stanier et al. (2014) and it has been proved that the transparent soil has similar mechanical properties to natural soft clay. Limited by the inconsistent refractive indexes of silica powder and fused quartz, the combination of fused quartz and transparent clay is opaque. By contrast, the nano-scale hydrophobic fumed silica powder used in the study (purchased from Bengbu Jingxi Glass Products Co., Ltd, and shown in Figure 1B) is a modified fumed silica, which is a white powder with particle sizes of 15 nm and finer, a density of about 0.07 g/cm3 in its natural state, a high specific surface area, and good dispersibility. Most importantly, the refractive index of silica powder is similar to that of fused quartz, which means that the mixture of silica powder, fused quartz and mixed mineral oil has high transparency. Moreover, such silica powder is hydrophobic (lipophilic) and can adsorb the mixed mineral oil, therefore can be adsorbed onto the surface of fused quartz after mixing with fused quartz and mixed mineral oil. The fused quartz particles can bind to each other due to the surface adsorbed with silica powder, thus manifesting the properties of clay particles.
The process of preparing TCS can be divided into the following five steps:
1) The mixed mineral oil of n-dodecane and 15# white oil was prepared to make the refractive index 1.458 5. The fused quartz (Figure 1A) was cleaned and dried to remove impurities and water on the surface. The mixed mineral oil and the fused quartz were sealed for later use.
2) The mixing ratios of fused quartz (Figure 1A), silica powder (Figure 1B), and mixed mineral oil were determined. Multiple tests show that the mass ratio of silica powder to fused quartz in TCS should be 2–20% and it is difficult to prepare TCS if the mass ratio of silica powder is less than 2%. To facilitate uniform mixing and compaction, the mass
where,
3) The fused quartz, silica powder, and mixed mineral oil were blended, so that silica powder was adsorbed onto the surface of fused quartz particles. The fused quartz particles were bound to each other through silica powder to form different sizes of block structures. In this case, the mixture was light-white in color (Figure 1C).
4) The soil blocks were tamped layer-by-layer. After each layer was tamped, the surface was scraped before tamping the next layer. The height of each tamped layer should not exceed 30 mm. On this basis, cemented soil with an air-void ratio (the ratio of the volume of air-voids to the total volume of solids and fluid-voids) of 5–19% could be prepared. In this case, the saturation of the cemented soil was 75–85% and it was light milky white or colorless and semi-transparent due to incomplete saturation (Figure 1D).
5) The cemented soil obtained in the previous step was placed in a vacuum box to remove trapped air for 5–6 h and then an appropriate amount of mixed mineral oil was added for saturation until the cemented soil was completely saturated. The cemented soil was transparent after saturation (Figure 1E).
To ascertain the effects of the content and mass ratio of silica powder, particle size and gradation of fused quartz on the geotechnical properties of TCS, 11 groups of TCS with different shear strengths were synthesized and UU triaxial shear tests were conducted by using SJ-1A.G triaxial shear apparatus. The test scheme and basic information pertaining to the TCS are summarized in Table 1, where the amount of mixed mineral oil in the specimens was determined by Formula 1. The particle size distribution in each group of TCS is shown in Figure 2. The proportioned TCS was placed into a geotechnical instrument for specimen preparation according to a certain mass, and specimens measuring 39.1 mm in diameter and 80 mm in height were prepared with an air-void ratio of 8–19% and saturation of about 80%. The confining pressures set in triaxial shear tests were 50, 100, and 200 kPa considering the low stress state in the model tests, and the rate of vertical compression displacement was 0.368 mm/min.
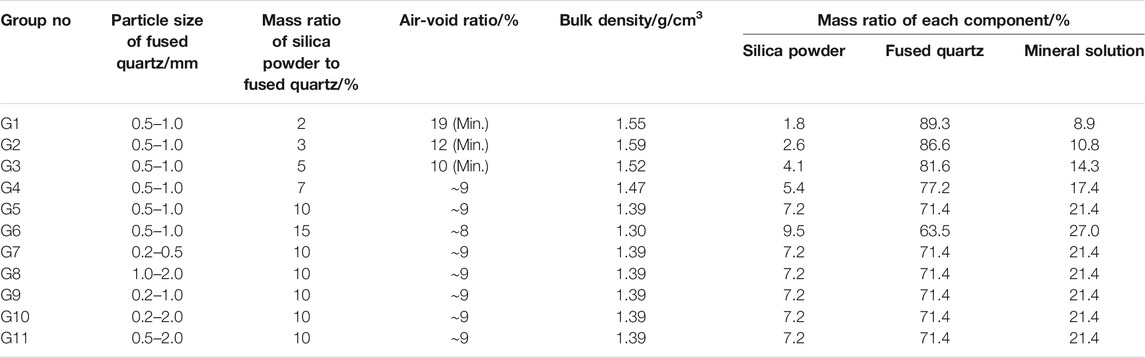
TABLE 1. Summary of test groups and specimens.

FIGURE 2. Particle size distribution curves of all groups in the study.
Figure 3 shows the stress–strain responses of specimens with different amounts of silica powder (the content of fused quartz is constant). Two groups of data obtained under the conditions that the mass ratios of silica powder are 2 and 3% correspond to test groups G1 and G2 in Table 1. In the two groups, the contents of fused quartz are 132 g (1.375 g/cm3), while the contents of silica powder are 2.64 g (0.028 g/cm3) and 3.96 g (0.041 g/cm3), respectively. The group of data obtained under the condition that the mass ratio of silica powder is 0%, recorded as the group G0, are extracted from the research of Wei et al. (2019). The test conditions of the three groups are generally consistent, while the main difference lies in the content of silica powder in the groups. Therefore, the three groups form contrasting groups with the content of silica powder as a single variable under the constant mass of fused quartz. As shown in Figure 3, under a constant content of fused quartz, the stress–strain curves of TCS containing silica powder (G1 and G2) have consistent morphologies and inflection points, which show significant differences with TCS without silica powder (G0). Furthermore, such differences become more significant with increasing confining pressure. Under the same strain conditions, the stress on specimens containing more silica powder (G2) is greater, which is particularly significant at the low confining pressure of 50 kPa (Figure 3A). Under a high confining pressure (200 kPa), the stress–strain curves of groups G1 and G2 are similar, indicating that geotechnical properties of TCS containing silica powder with mass ratios of 2 and 3% are consistent under high stress (Figure 3C).
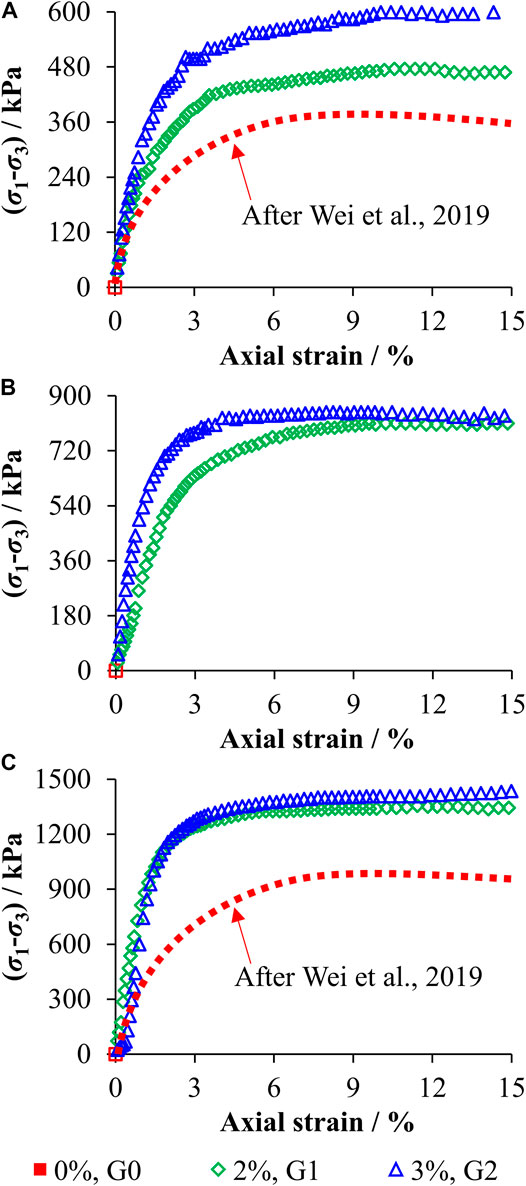
FIGURE 3. Stress–strain responses of TCS with different amounts of silica powder (the amount of fused quartz is constant) at confining pressures of 50 (A), 100 (B), and 200 kPa (C).
Figure 4 illustrates the stress–strain responses of TCS with different mass ratios of silica powder (the air-void ratios are constant). The four groups of data obtained at mass ratios of silica powder of 5, 7, 10, and 15% correspond to test groups G3 to G6 in Table 1. In the four groups, the air-void ratio of the specimens is 10–8%. Although the densities of the specimens and amounts of mixed mineral oil in the four groups are different, they do not change independently, but vary with the mass ratio of silica powder. Therefore, the tests on the four groups can still be considered as contrasting tests with the mass ratio of silica powder as a single variable. Similarly, to ensure a consistent air-void ratio in each group, the mass ratio of fused quartz correspondingly decreases with the increase in mass ratio of silica powder. As shown in Figure 4, at a constant air-void ratio, the increase in the mass ratio of silica powder has no influence on the morphology of the stress–strain curves of TCS, while the inflection points occur at a slightly lower strain as the mass ratio of silica powder increases. Under the same strain conditions, the stress acting on TCS with large mass ratios of silica powder is small, indicating that the increase of the mass ratio of silica powder can soften TCS.
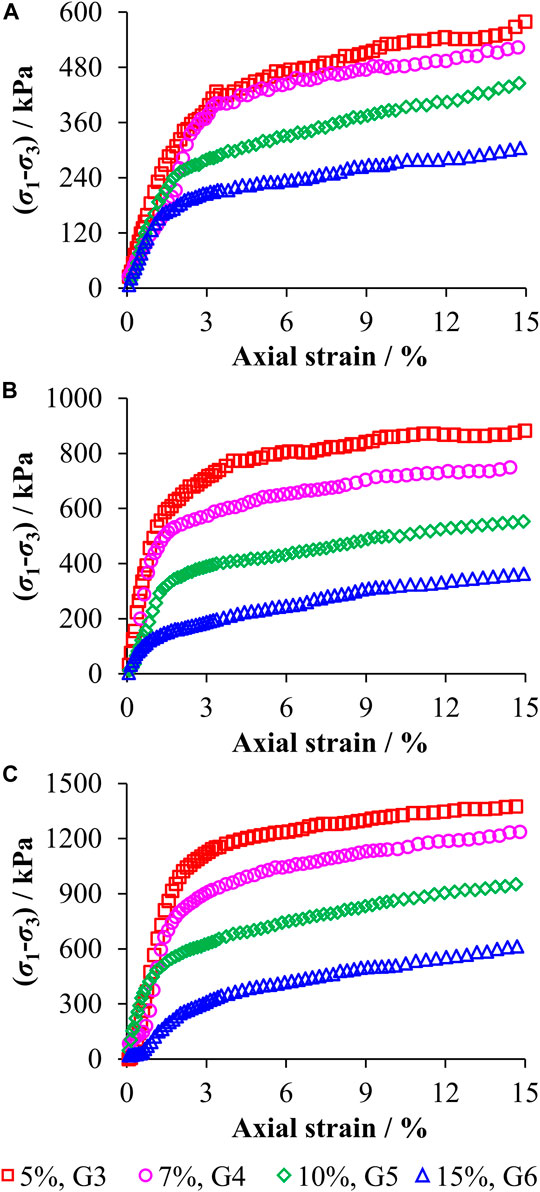
FIGURE 4. Stress–strain responses of TCS with different mass ratios of silica powder (the amount of fused quartz varies with the mass ratios of silica powder) at confining pressures of 50 (A), 100 (B), and 200 kPa (C).
Figure 5 shows the stress–strain responses of TCS with different particle sizes of fused quartz under the conditions of constant mass ratio of silica powder and air-void ratio. The three groups of data obtained from TCS with particle sizes of fused quartz of 0.5–1.0, 0.2 to 0.5 and 1.0–2.0 mm correspond to the test groups G5, G7 and G8 in Table 1. The three groups have same masses of fused quartz and silica powder, while different particle sizes of fused quartz, so they are contrasting groups with the particle size of fused quartz as a single variable. As demonstrated in Figure 5, the stress–strain curves of TCS with three different particle sizes show basically same morphologies, while the inflection points appear slightly early with the increase of the particle size. Under the same strain conditions, TCS with the different particle sizes of 0.5–1.0, 0.2 to 0.5, and 1.0–2.0 mm are ranked in descending order according to stress.
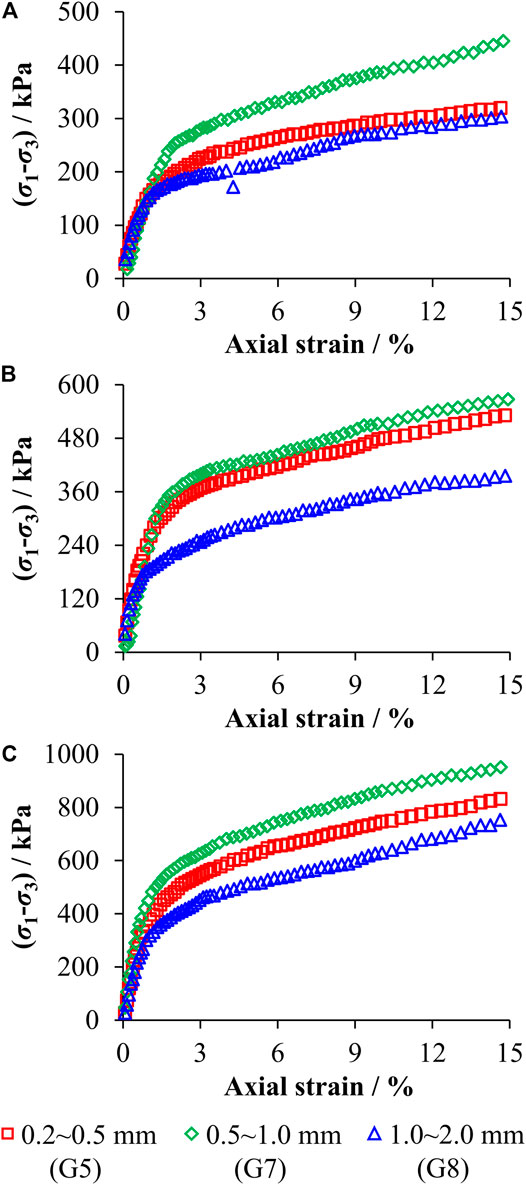
FIGURE 5. Stress–strain responses of TCS with different particle sizes of fused quartz at confining pressures of 50 (A), 100 (B), and 200 kPa (C).
Figure 6 shows the stress–strain responses of TCS with different particle gradations of fused quartz as the mass ratios of silica powder and air-void ratio are constant. Three groups of data obtained when using fused quartz with gradations of 0.2–1.0, 0.2 to 2.0 and 0.5–2.0 mm separately correspond to test groups G9 to G11 in Table 1. The three groups of TCS have identical masses of fused quartz and silica powder, while different particle gradations of fused quartz, so tests on the groups are contrasting tests with the gradation of fused quartz as a single variable. Figure 6 demonstrates that the morphologies and inflection points of the stress–strain curves of TCS with different particle gradations are similar. Under the same strain conditions, TCS with different particle gradations of 0.2–1.0, 0.5 to 2.0, and 0.2–2.0 mm are ranked in descending order according to stress. Such differences in stress are significant at the lower confining pressure of 50 kPa, while negligible at the higher confining pressure of 200 kPa.
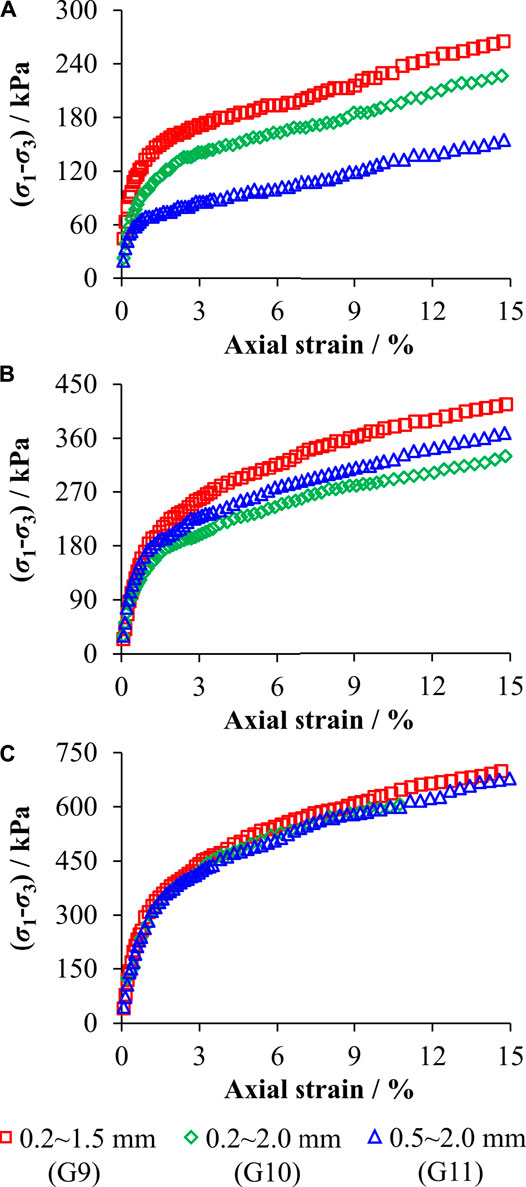
FIGURE 6. Stress–strain responses of TCS with different particle gradations of fused quartz at confining pressures of 50 (A), 100 (B), and 200 kPa (C).
Figure 7 (corresponding to Figure 3) shows the changes in geotechnical parameters (the cohesion and angle of internal friction were obtained by drawing the Mohr-Coulomb strength envelopes) of TCS with different contents of silica powder in test groups G0 to G2. As illustrated, when the amount of fused quartz is consistent, with the increase in amount of silica powder (Figure 7C), the cohesion of the specimens increases significantly, while the angle of internal friction increases slowly (Figure 7A). Young’s modulus of the specimens increases significantly with the increase of the confining pressure, consistent with natural rock and soil material behavior. Under the same confining pressure, Young’s modulus gradually increases with increasing amount of silica powder (Figure 7B).
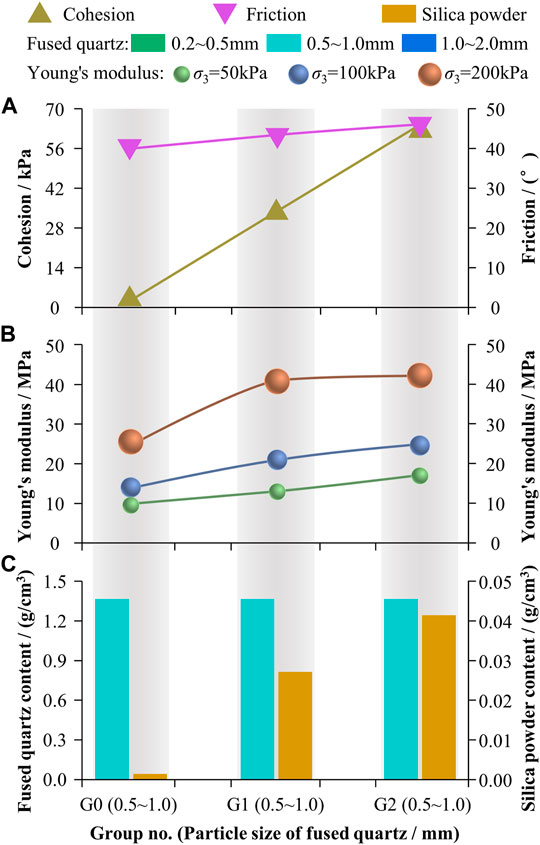
FIGURE 7. Variations in geotechnical parameters of TCS with different amount of silica powder.
Figure 8 shows the changes in geotechnical parameters of TCS with different mass ratios of silica powder in test groups G3 to G6. This shows that with the increase of the mass ratio of silica powder (accompanied by the decrease in the mass ratio of fused quartz, and shown in Figure 8C), the cohesion and angle of internal friction tend to decrease (Figure 8A). Young’s modulus of TCS increases significantly with confining pressure. At the same confining pressure, Young’s modulus decreases significantly with increasing mass ratio of silica powder (Figure 8B).
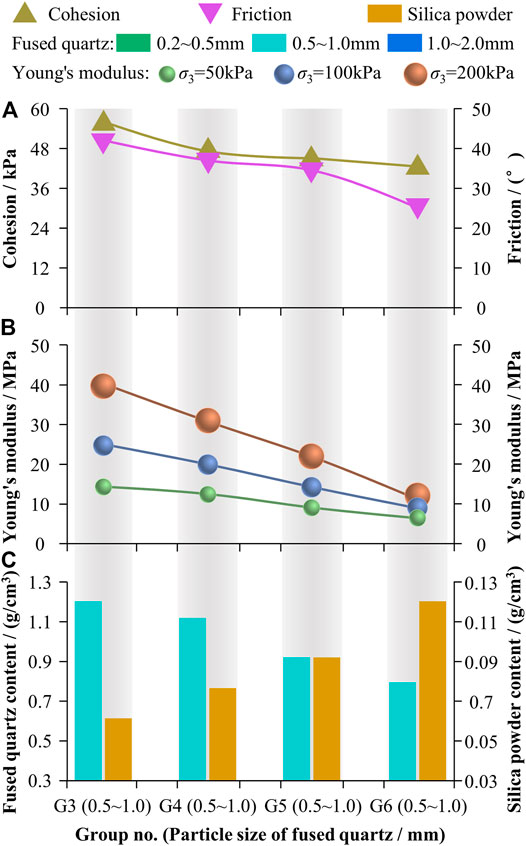
FIGURE 8. Variations in geotechnical parameters of TCS with different mass ratios of silica powder.
Figure 9 shows the microscopic characteristics of TCS with different mass ratios of silica powder. Figures 9A–C are photos taken with an optical microscope, and Figures 9D–F are schematic diagrams of the microscopic photos. When the mass ratio of silica powder is 5% (Figures 9A–D), the particles of fused quartz in TCS are interlocked; unconnected pores among the particles are formed and are filled with mixture of silica powder and mixed mineral oil. In this case, the shear strength of TCS is high due to the interlocking effect of the fused quartz particles. As the mass ratio of silica powder increases to 10%, the number of pores among the fused quartz particles increases, and connected pores are formed partially (Figures 9B–E). At this time, the interlocking effect of the fused quartz particles is decreased, as a result of which the shear strength of TCS is decreased. When the mass ratio of silica powder increases to 15%, the number of connected pores is increased, causing some fused quartz particles to be suspended in the mixture of silica powder and mixed mineral oil (Figures 9C–F). At this time, the interlocking effect among the fused quartz particles is greatly reduced, and accordingly, the shear strength of TCS is significantly reduced.
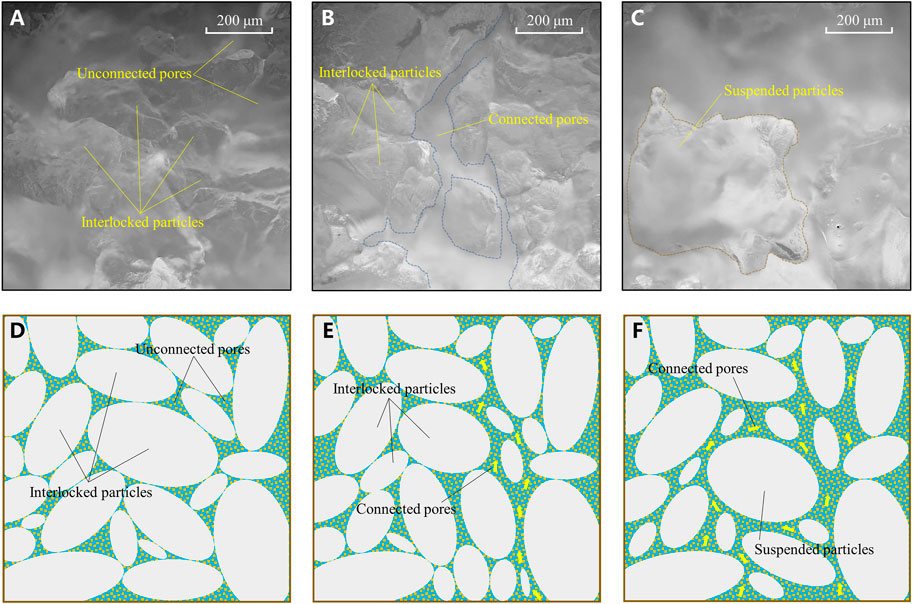
FIGURE 9. Mesoscopic characteristics of TCS with mass ratios of silica powder of 5% (A–D), 10% (B–E) and 15% (C–F).
The changes in geotechnical parameters of TCS with different particle sizes of fused quartz in the test groups G5, G7, and G8 are shown in Figure 10; in the three groups of TCS with different particle sizes of fused quartz, the group with the particle size of 0.5–1.0 mm has the maximum cohesion, angle of internal friction, and Young’s modulus, followed by that with a particle size of 0.2–0.5 mm, while the minimum values are found when using a particle size of 1.0–2.0 mm: grading exerts a significant influence on the cohesion and Young’s modulus, while having little influence on the angle of internal friction of TCS in the three groups.
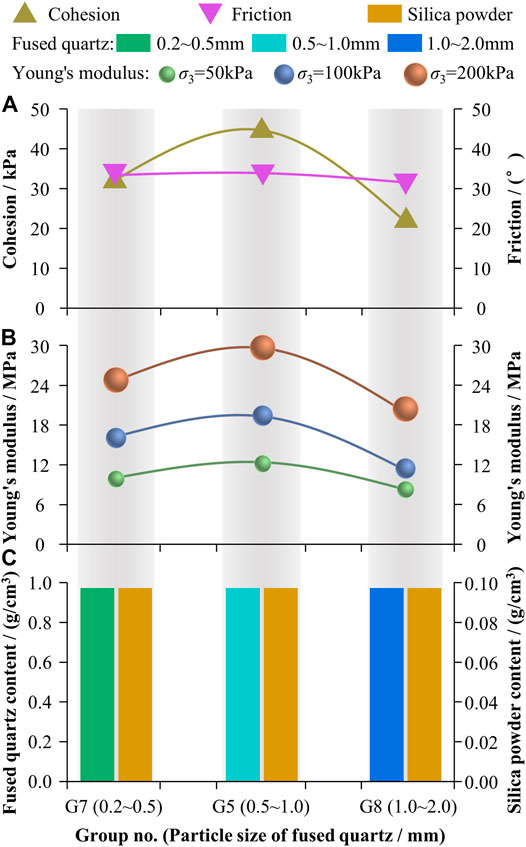
FIGURE 10. Variations in geotechnical parameters of TCS with different particle sizes of fused quartz.
Figure 11 shows changes in the geotechnical parameters of TCS with different particle gradations of fused quartz in test groups G9 to G11. Among the three groups of TCS with different particle gradations of fused quartz, the group with the gradation of 0.2–1.0 mm has the largest cohesion and smallest angle of internal friction. The cohesion and angle of internal friction of the group with the gradation of 0.2–2.0 mm are lower but the minimum cohesion and the maximum angle of internal friction are found in the group with the gradation of 0.5–2.0 mm. The three groups of TCS with different gradations exhibit small differences in Young’s modulus under a high confining pressure of 200 kPa. Under a low confining pressure of 50 kPa, the groups are ranked in the same order in terms of Young’s moduli as they are for the apparent cohesion. In general, different gradations of fused quartz significantly affect the cohesion, while slightly influencing the angle of internal friction and Young’s modulus of TCS in the three groups.
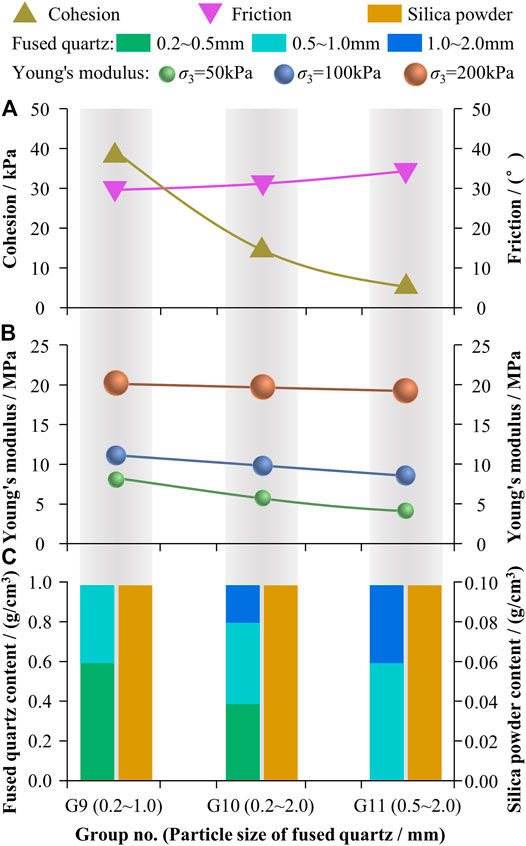
FIGURE 11. Variations in geotechnical parameters of TCS with different particle gradations of fused quartz.
Figure 12 illustrates the mesoscopic characteristics of TCS with different gradations of fused quartz. When the content of fine particles of fused quartz is low (Figures 12A–D), coarse particles of fused quartz are strongly interlocked. The interlocked coarse particles bear the main part of shear force acting on TCS, which makes TCS display high shear strength. As the content of fine particles increases (accompanied by the decrease of coarse particles) (Figures 12B–E), the pores among coarse particles are filled by the fine particles, so that the interlocking effect of coarse particles is weakened, resulting in a decrease in the shear strength of TCS. When the amount of fine particles dominates in TCS (Figures 12C–F), coarse particles are surrounded by fine particles and seem to be suspended in TCS from the mesoscopic view. In this case, the interlocking effect is greatly decreased due to the suspended state of coarse particles, and accordingly, the shear strength of TCS is significantly decreased.

FIGURE 12. Mesoscopic characteristics of TCS with different particle gradations of fused quartz: 0.5–2.0 mm in group G11 (A–D), 0.2–2.0 mm in group G10 (B–E) and 0.2–1.0 mm in group G9 (C–F).
Figure 13 shows the stress–strain responses of the specimens with different mass ratios of silica powder in test groups G2, G3, and G5 under a confining pressure of 200 kPa (Figure 13A) and their corresponding failure modes (Figures 13B–D)). As shown, 1) as the mass ratio of silica powder increases from 3% (Figure 13B) to 5% (Figure 13C), and 10% (Figure 13D), the cohesion of the specimens increases significantly. In this case, the compressed specimens are less likely to disintegrate, and the integrity of the specimen is improved. 2) When the mass ratio of silica powder is less than 10%, the specimens will disintegrate to different degrees after removing the latex films around them (Figures 13B,C). Particularly, when the mass ratio of silica powder is less than 3%, the specimens have a very low cohesion and they disintegrate after compression and removal of the latex film. 3) It can be seen from more intact specimens that shear failure mainly occurs in the specimens and the failure characteristics are similar to those of clay or soft rock (Figure 13D). Such a phenomenon verifies the feasibility of using TCS in model tests in geotechnical engineering from the perspective of failure.
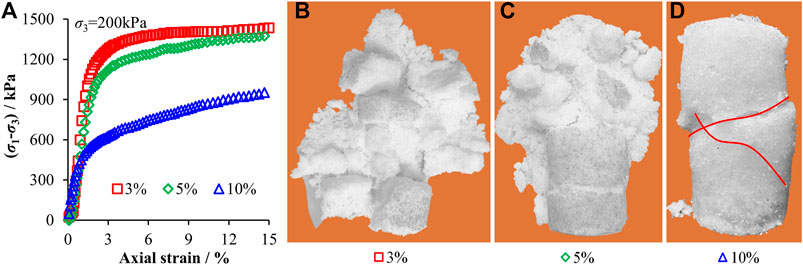
FIGURE 13. Stress–strain responses (A) and failure modes of the specimens with different mass ratios (separately 3% (B), 5% (C), and 10% (D)) of silica powder.
Figures 14, 15 show the stress–strain responses of the specimens with different particle sizes (specimens in groups G5, G7, and G8 in Figure 14) and gradations (specimens in groups G9 to G11 in Figure 15) of fused quartz under a confining pressure of 200 kPa and their corresponding failure modes. As shown, 1) shear failure occurs in specimens with different particle sizes and gradations of fused quartz after compression, which is similar to those of natural clay or soft rock. 2) In specimens with three different particle sizes of fused quartz, the specimen with the larger particles is less intact after compression; there is basically no clear shear band in the specimen with a particle size of 0.2–0.5 mm of fused quartz after compression (Figure 14B), while significant shear failure occurs in the specimen with particle sizes of 1.0–2.0 mm after compression (Figure 14D). 3) In the specimens with three different gradations of fused quartz, the specimen with the gradation of 0.2–1.0 mm of fused quartz is more intact after compression (Figure 15B), with no clear shear band being found, however shear failure can be seen in the specimens with gradations of 0.2–2.0 and 0.5–2.0 mm after compression (Figures 15C,D).
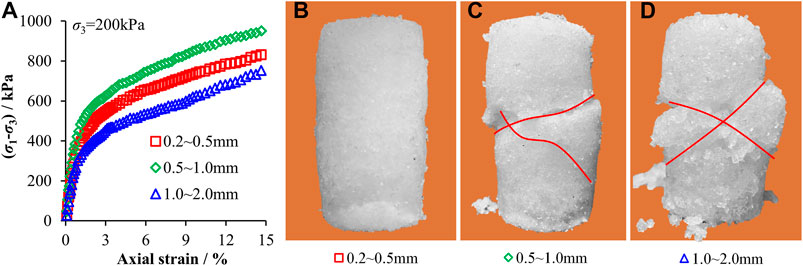
FIGURE 14. Stress–strain responses (A) and failure modes of the specimens with different particle sizes (separately 0.2–0.5 mm (B), 0.5–1.0 mm (C) and 1.0–2.0 mm (D)) of fused quartz.
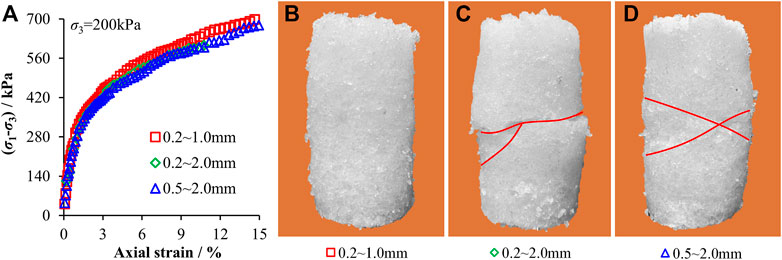
FIGURE 15. Stress–strain responses (A) and failure modes of the specimens with different particle gradations (separately 0.2–1.0 mm (B), 0.2–2.0 mm (C) and 0.5–2.0 mm (D)) of fused quartz.
A variety of transparent soils have been developed in the past 2 decades, such as transparent sand (Iskander et al., 2002b; Sadek et al., 2002; Iskander and Liu, 2010; Cao et al., 2011; Ezzein and Bathurst, 2011; Guzman and Iskander, 2013; Kashuk et al., 2014; Sun and Liu, 2014) and transparent clay (Pincus et al., 1994; Iskander, 1998; Gill and Lehane, 2001; Iskander et al., 2002a; Hird and Stanier, 2010; Wu et al., 2020a; Kong et al., 2020). However, there are some defects in shear strength of these transparent soils, such as low cohesion of transparent sand and low angle of internal friction of transparent clay, making it difficult to form physical models in complex shapes and limiting the application of these transparent soils in model tests. TCS prepared in the study overcomes the defects inherent to the use of these transparent soils, showing similar mechanical parameters and failure characteristics to natural rock and soil masses, making it an appropriate substitute for a variety of geotechnical materials suitable for laboratory model testing. By adjusting the particle size and gradation of fused quartz and the mass ratio of silica powder in TCS, the mechanical properties of TCS can be accurately controlled, so that it can be used to simulate multiple types of natural rock and soil. The model tests using TCS are essentially similarity model tests wherein the model materials (TCS) have to meet the requirements that main mechanical properties are similar to the prototype materials (rock and soil mass).
Previous studies have proved that particle characteristics affect the shear strength of soils (Ganju et al., 2021; Lu et al., 2021). For example, the angle of internal friction was found to increase with increasing particle size in natural sand through triaxial compression tests using sand with different particle sizes (Li, 2013; Vangla and Latha, 2015). Moreover, various shear strength expressions of sandy soils were fitted based on the correspondence between the gradation parameters (such as the coefficients of uniformity
Since mechanical properties of TCS are significantly affected by gradation characteristics (Section 4.1.2), establishing expressions of mechanical properties varying with the gradation will be helpful for the preparation of TCS with target mechanical properties. Figure 16 illustrates the variations of cohesion and internal friction angle of TCS with different gradations in Table 1. As suggested in previous studies (Belkhatir et al., 2012; Bayat and Bayat, 2013; Sezer, 2013; Havaee et al., 2015), the coefficient of uniformity,
where
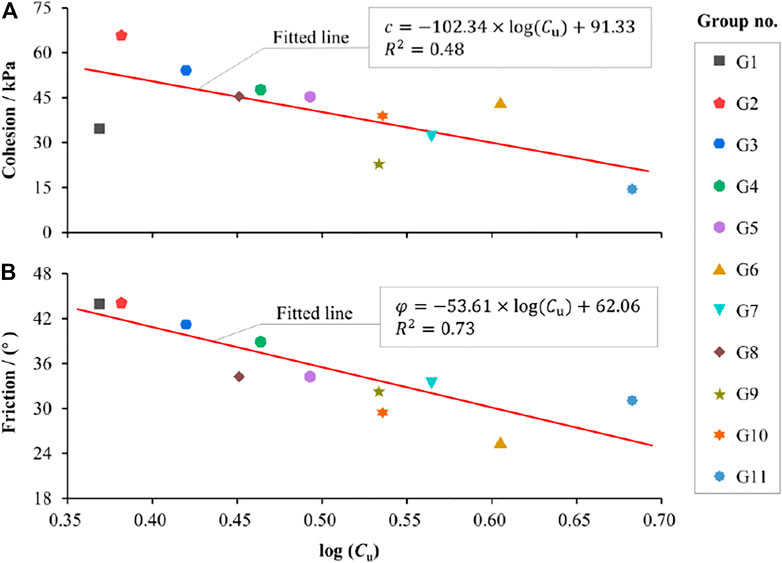
FIGURE 16. The relationship between the particle characteristics of TCS and the strength parameters: variations of cohesion (A) and internal friction angle (B) with the coefficient of uniformity of the particle gradation.
Based on Eqs 2–4, TCS with the target strength can be prepared by adjusting the particle gradation in the future.
The similarity of the stress–strain relationship is the basis of using TCS as a substitute for natural clay. It can be seen from Figures 3–6 that the shape of stress–strain curves of TCS is ideal elastoplastic type or strain softening type, which is similar to that of natural clay (Huang et al., 2016). Figure 17 illustrates the envelopes of the stress–strain curves of TCS prepared according to 11 schemes in Table 1. As shown, (1) under different particle sizes and gradations of fused quartz and different mass ratios of silica powder, the stress–strain curves of TCS change significantly. By adjusting the particle size of fused quartz and the mass ratio of silica powder, the stress–strain curves of TCS match those of natural clay. (2) Compared with several existing typical transparent geomaterials, such as transparent granular soil (Li et al., 2020), TCS (Wei et al., 2019), transparent glass soil (Kong and Lu, 2014), transparent glass sand (Kong et al., 2013) and Transparent silica gel (Iskander et al., 2002b) used in model tests, the TCS prepared in the present work has a similar stress–strain relationship to them. The difference is that the stress–strain curves of TCS used in this research can be controlled across a wider range, thus TCS has stronger applicability in simulating different natural clays.
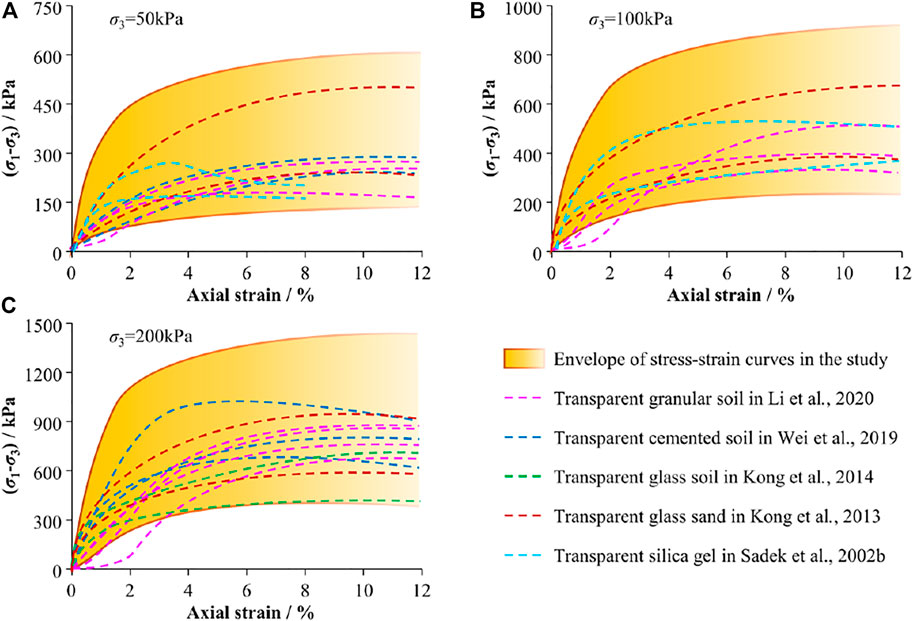
FIGURE 17. Envelopes of stress–strain curves of the specimens in Table 1 at confining pressures of 50 (A), 100 (B) and 200 kPa (C).
The changes in geotechnical parameters (Figures 7, 8, 10, and 11) show that the geotechnical parameters of TCS change with large ranges: cohesion varies from 5 to 65 kPa, the angle of internal friction varies from 25 to 44°, and Young’s modulus from 5 to 17 MPa (
The failure of the TCS specimens under triaxial compression (Figures 13–15) is mainly due to shearing, and the distribution, number, and dip angle of the shear zones in the specimens are similar to those in natural clay (Huang et al., 2016), so TCS can be used to simulate failure process of natural clay.
TCS differs from rock in terms of its mechanical properties, so it cannot be directly used as a substitute for rock. To expand the applicability of TCS in model tests, the feasibility of using TCS as similar materials to soft rock in model tests was explored based on the principle of similar mechanical properties of hard soil and soft rock. Subscripts P and M separately represent the prototype and model, and
Ignoring the self-weight of a rock mass, the main physical similarity constants of TCS are as follows:
where,
Based on the requirement that the stress–strain relationships in the prototype and the model should be expressed by the same equation, the following formulae are derived:
By substituting Formulae 5–7 into Formula 8, Formula 8 can be rewritten as follows:
If Formulae 9, 10 are equal, the similarity index is:
and as
The similarity constant of stress can be selected at will without considering the self-weight.
When considering the self-weight of both rock and soil, the similarity constants of the materials should include
where,
Based on principles of elastic mechanics and similarity, the similarity index can be calculated as follows:
where,
In similarity model tests, besides that Formulae 12, 14, and 15 governing the main similarity constants should be satisfied, the requirement for a similar strength should also be met. The strength of TCS is expressed as the Mohr–Coulomb shear strength and its parameters include the cohesion and angle of internal friction. The shear strength is consistent with the dimension of stress. When selecting the strength index of simulated materials, it can be converted according to the following formulae:
where,
The angle of internal friction
where,
In conclusion, in the similarity model tests of TCS, the similarity index must satisfy:
In accordance with Formula 19, if the geometric similarity constant is 100, the geotechnical parameters of the prototype materials corresponding to TCS materials can be obtained (Table 2) from where it can be seen that TCS is applicable as a similar material to soft rock, such as dolomite (Liu et al., 2021), marl (Ferrero and Migliazza, 2009), shale (Geng et al., 2016), siltstone (Su et al., 2007), or claystone (Hu et al., 2014).
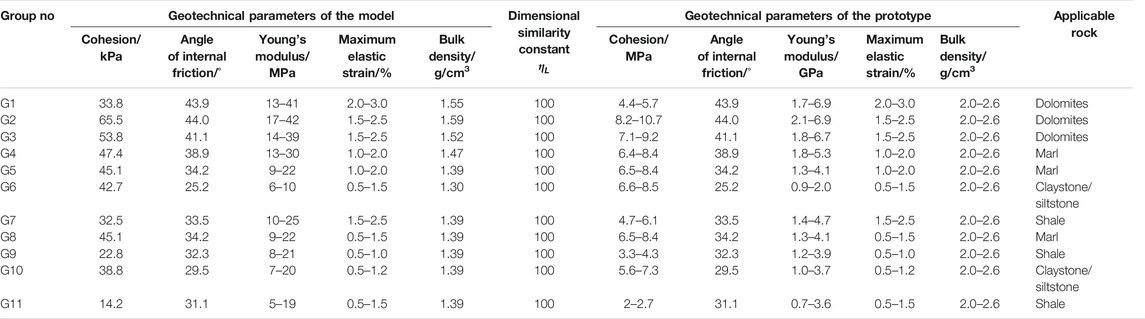
TABLE 2. Summary of geotechnical parameters of TCS (model) and its applicable rock (prototype) based on similarity theory.
TCS is usually required to reach a fully saturated state to realize their high transparency in physical model tests, therefore, measuring the mechanical properties of saturated TCS is the premise to the development of physical model tests using TCS (Iskander et al., 2015; Ganiyu et al., 2016). When measuring the shear strength parameters of saturated soil specimens, consolidated undrained (CU) or consolidated drained (CD) triaxial compression tests should be conducted; however, during the consolidation or drainage of saturated TCS specimens, the pore fluid (mixed mineral oil) drained from the specimens will corrode rubber products (such as the latex membrane and rubber O-ring seals), resulting in a failure of the test and even instrument damage. Therefore, CU or CD tests of TCS specimens with complete saturation were not performed in the study, but as an alternative, UU tests on specimens with a saturation ratio of about 80% were conducted. There is a certain difference in mechanical properties between TCS with saturation ratios of about 80 and 100% (the study of unsaturated silt clay (Kererat, 2019) with similar micro-structure to TCS shows that the difference is within 15% in terms of strength parameters), but this small difference does not affect the investigation of the mechanical characteristics such as strength, stiffness, and failure of TCS.
The cementation arising from use of silica powder is the key element that distinguishes TCS from transparent sand and work on the cementation mechanism is significant for further study of the mechanical behavior of TCS. Although Yang et al. (2020) used scanning electron microscopy to study the micro-structural characteristics of TCS and ascertained the changes in the cement and skeleton of TCS before and after compression, the cementation mechanism of silica powder remains unclear: The mechanism of action of silica powder in adsorbing mixed mineral oil warrants further study.
A type of TCS was prepared by using fused quartz as the skeleton, nano-scale hydrophobic fumed silica powder as a cement, and mixed mineral oil containing n-dodecane and 15# white oil as the pore fluid: the recipe and preparation methods of TCS were also validated. By conducting 11 groups of triaxial shear tests to assess the effects of four main factors of the skeleton and cement on the strength characteristics of TCS, changes in the stress–strain curves, geotechnical parameters, mesoscopic structures, and failure characteristics of TCS were analyzed. Finally, the feasibility of using TCS as a substitute for clay and similar materials to soft rock in model tests was proved and the optimum similarity ratio of TCS was determined. The results indicated that:
1) By properly grading fused quartz with the particles of 0.2–0.5, 0.5 to 1.0, and 1.0–2.0 mm and adding 2–15% of silica powder and corresponding mixed mineral oil, TCS with a cohesion of 5–65 kPa, angle of internal friction of 25–44°, and Young’s modulus of 5–42 MPa (when
2) When the particle size, gradation and content of fused quartz are constant, the strength and stiffness of TCS increase with increasing amount of silica powder. Of them, the cohesion and Young’s modulus increase significantly, while the angle of internal friction rises less. As the mass ratio of silica powder increases (accompanied by the decrease in the mass ratio of fused quartz), the strength and stiffness of TCS gradually decrease and the cohesion, angle of internal friction, and Young’s modulus decrease to a significant extent.
3) At a constant mass ratio of silica powder, the changes in strength and stiffness of TCS with particle size of fused quartz are as follows: TCS values with particle sizes of fused quartz of 0.5–1.0, 0.2 to 0.5, and 1.0–2.0 mm are ranked in descending order. In the three groups of TCS with the gradations of fused quartz of 0.2–1.0, 0.2 to 2.0, and 0.5–2.0 mm, the gradation of fused quartz affects the cohesion to a significant extent, while only slightly affecting the angle of internal friction and Young’s modulus.
4) The stress–strain relationship, geotechnical parameters, and shear failure mode of TCS are similar to those of clay and soft rock. Accurate control can be realized by adjusting the content and mass ratio of silica powder and particle size and the gradation of fused quartz, therefore, TCS can be used as a substitute for natural clay and similar materials to soft rock in visual physical modeling tests based on transparent soil.
The original contributions presented in the study are included in the article/Supplementary Material, further inquiries can be directed to the corresponding author.
XL designed the research. CW and RP conducted the experimental research and processed the corresponding data. XL and CW wrote the first draft of the manuscript. QS helped to organize the manuscript. JC revised and edited the final version.
This work was supported by the National Natural Science Foundation of China (No. 52079135), the International Partnership Program of the International Cooperation Bureau of Chinese Academy of Sciences (No. 131551KYSB20180042), and the National Key Research and Development Program (No. 2017YFF0108705).
The authors declare that the research was conducted in the absence of any commercial or financial relationships that could be construed as a potential conflict of interest.
All claims expressed in this article are solely those of the authors and do not necessarily represent those of their affiliated organizations, or those of the publisher, the editors and the reviewers. Any product that may be evaluated in this article, or claim that may be made by its manufacturer, is not guaranteed or endorsed by the publisher.
Ahmed, M., and Iskander, M. (2011a). “Transparent Soil Model Tests and FE Analyses on Tunneling Induced Ground Settlement,” in Geo-Frontiers Congress 2011: Advances in Geotechnical Engineering, Dallas, Texas, United States, March 13–16, 2011, 3381–3390. doi:10.1061/41165(397)346
Ahmed, M., and Iskander, M. (2011b). “Tunnel Face Support Pressure and Associated Risk,” in Geo-Risk 2011: Risk Assessment and Management, Atlanta, Georgia, United States, June 26–28, 2011, 939–947. doi:10.1061/41183(418)101
Bathurst, R. J., and Ezzein, F. M. (2015). Geogrid and Soil Displacement Observations during Pullout Using a Transparent Granular Soil. Geotech. Test. J. 38 (5), 20140145–20140685. doi:10.1520/gtj20140145
Bayat, E., and Bayat, M. (2013). Effect of Grading Characteristics on the Undrained Shear Strength of Sand: Review with New Evidences. Arab J. Geosci. 6 (11), 4409–4418. doi:10.1007/s12517-012-0670-y
Beckett, C. T. S., and Augarde, C. E. (2011). A Novel Image-Capturing Technique for the Experimental Study of Soil Deformations during Compaction. Geotech. Test. J. 34 (6), 103517–103578. doi:10.1520/GTJ103517
Belkhatir, M., Arab, A., Della, N., and Schanz, T. (2012). Experimental Study of Undrained Shear Strength of Silty Sand: Effect of Fines and Gradation. Geotech. Geol. Eng. 30 (5), 1103–1118. doi:10.1007/s10706-012-9526-1
Cao, Z., Liu, J., and Liu, H. (2011). “Transparent Fused Silica to Model Natural Sand,” in Pan-Am CGS Geotechnical Conference, Toronto, Ontario, Canada, October 2–6, 2011, 1–6.
Chen, Z., and Guo, N. (2019). New Developments of Mechanics and Application for Unsaturated Soils and Special Soils. Rock Soil Mech. 40 (1), 1–54. doi:10.16285/j.rsm.2017.2577
Chen, Q., Dong, G., Wang, C., Zhu, B., and Zhao, X. (2020). Characteristics Analysis of Soil Arching Effect behind Pile Based on Transparent Soil Technology. J. Southwest. Jiaotong Univ. 55 (3), 509–522. doi:10.3969/j.issn.0258-2724.20190744
Ezzein, F. M., and Bathurst, R. J. (2011). A Transparent Sand for Geotechnical Laboratory Modeling. Geotech. Test. J. 34 (6), 103808–104601. doi:10.1520/GTJ103808
Ferrero, A. M., and Migliazza, M. R. (2009). Theoretical and Numerical Study on Uniaxial Compressive Behaviour of Marl. Mech. Mater. 41 (5), 561–572. doi:10.1016/j.mechmat.2009.01.011
Ganiyu, A. A., Rashid, A. S. A., and Osman, M. H. (2016). Utilisation of Transparent Synthetic Soil Surrogates in Geotechnical Physical Models: A Review. J. Rock Mech. Geotechn. Eng. 8 (4), 568–576. doi:10.1016/j.jrmge.2015.11.009
Ganju, E., Kılıç, M., Prezzi, M., Salgado, R., Parab, N., and Chen, W. (2021). Effect of Particle Characteristics on the Evolution of Particle Size, Particle Morphology, and Fabric of Sands Loaded under Uniaxial Compression. Acta Geotech. 16, 3489–3516. doi:10.1007/s11440-021-01309-3
Geng, Z., Chen, M., Jin, Y., Yang, S., Yi, Z., Fang, X., et al. (2016). Experimental Study of Brittleness Anisotropy of Shale in Triaxial Compression. J. Nat. Gas Sci. Eng. 36, 510–518. doi:10.1016/j.jngse.2016.10.059
Chaney, R., Demars, K., Gill, D., and Lehane, B. (2001). An Optical Technique for Investigating Soil Displacement Patterns. Geotech. Test. J. 24 (3), 324–329. doi:10.1520/GTJ11351J
Guzman, I. L., and Iskander, M. (2013). Geotechnical Properties of Sucrose-Saturated Fused Quartz for Use in Physical Modeling. Geotech. Test. J. 36 (3), 20120182–20120454. doi:10.1520/gtj20120182
Guzman, I. L., Iskander, M., Suescun-Florez, E., and Omidvar, M. (2014). A Transparent Aqueous-Saturated Sand Surrogate for Use in Physical Modeling. Acta Geotech. 9 (2), 187–206. doi:10.1007/s11440-013-0247-2
Havaee, S., Mosaddeghi, M. R., and Ayoubi, S. (2015). In Situ surface Shear Strength as Affected by Soil Characteristics and Land Use in Calcareous Soils of central Iran. Geoderma 237-238, 137–148. doi:10.1016/j.geoderma.2014.08.016
Hird, C., and Stanier, S. (2010). “Modelling Helical Screw Piles in clay Using a Transparent Soil,” in Proceedings of the 7th International Conference on Physical Modelling in Geotechnics, Zurich, Switzerland, 28th June–1st July, 2010, 769–774.
Hu, D. W., Zhang, F., and Shao, J. F. (2014). Experimental Study of Poromechanical Behavior of Saturated Claystone under Triaxial Compression. Acta Geotech. 9 (2), 207–214. doi:10.1007/s11440-013-0259-y
Huang, M., Yao, Y., Yin, Z., Liu, E., and Lei, H. (2016). An Overview on Elementary Mechanical Behaviors,constitutive Modeling and Failure Criterion of Soils. Chin. Civil Eng. J. 49 (7), 9–35. doi:10.15951/j.tmgcxb.2016.07.002
Iskander, M., and Liu, J. (2010). Spatial Deformation Measurement Using Transparent Soil. Geotech. Test. J. 33 (4), 102745–103321. doi:10.1520/GTJ102745
Iskander, M. G., Liu, J., and Sadek, S. (2002a). Transparent Amorphous Silica to Model Clay. J. Geotech. Geoenviron. Eng. 128 (3), 262–273. doi:10.1061/(asce)1090-0241(2002)128:3(262)
Iskander, M. G., Sadek, S., and Liu, J. (2002b). Optical Measurement of Deformation Using Transparent Silica Gel to Model Sand. Int. J. Phys. Model. Geotech. 2 (4), 13–26. doi:10.1680/ijpmg.2002.2.4.13
Iskander, M., Bathurst, R. J., and Omidvar, M. (2015). Past, Present, and Future of Transparent Soils. Geotech. Test. J. 38 (5), 20150079–20150401. doi:10.1520/GTJ20150079
Iskander, M. (1998). “Transparent Soils to Image 3D Flow and Deformation,” in 2nd International Conference on Imaging Technologies - Techniques and Applications in Civil Engineering, Davos, Switzerland, May 25–30, 1997, 255–264.
Kashuk, S., Mercurio, S. R., and Iskander, M. (2014). Visualization of Dyed NAPL Concentration in Transparent Porous media Using Color Space Components. J. Contaminant Hydrol. 162-163, 1–16. doi:10.1016/j.jconhyd.2014.04.001
Kererat, C. (2019). Effect of Oil-Contamination and Water Saturation on the Bearing Capacity and Shear Strength Parameters of Silty sandy Soil. Eng. Geol. 257, 105138. doi:10.1016/j.enggeo.2019.05.015
Kong, G., and Lu, L. (2014). Performances of One New Transparent Glass Soil. Mater. Res. Innov. 18 (Suppl. 2), S2–S537. doi:10.1179/1432891714z.000000000470
Kong, G., Liu, L., Liu, H., and Zhou, H. (2013). Triaxial Tests on Deformation Characteristics of Transparent Glass Sand. Chin. J. Geot. Eng. 35 (6), 1140–1146.
Kong, G., Liu, L., Liu, H., and Cao, Z. (2014). Comparative Analysis of the Strength Characteristics of Transparent Glass Sand and Standard Sand. J. Build. Mater. 17 (2), 250–255. doi:10.3969/j.issn.1007-9629.2014.02.012
Kong, G., Sun, X., Li, H., and Cao, Z. (2016). Effect of Pore Fluid on Strength Properties of Transparent Soil. Chin. J. Geot. Eng. 38 (2), 377–384. doi:10.11779/CJGE201602024
Kong, G., Zhou, Y., Yang, Q., Wang, C., and Chen, Y. (2020). Geotechnical Properties of a New Transparent clay. Int. J. Geomech. 20 (12), 06020032. doi:10.1061/(asce)gm.1943-5622.0001880
Lanting, W., Qiang, X., Shanyong, W., Cuilin, W., and Xu, J. (2020). The Morphology Evolution of the Shear Band in Slope: Insights from Physical Modelling Using Transparent Soil. Bull. Eng. Geol. Environ. 79 (4), 1849–1860. doi:10.1007/s10064-019-01649-1
Lei, H., Liu, Y., Zhai, S., Tu, C., and Liu, M. (2019). Visibility and Mechanical Properties of Transparent clay. Chin. J. Geot. Eng. 41 (S2), 53–56. doi:10.11779/CJGE2019S2014
Li, Y., Zhou, H., Liu, H., Ding, X., and Zhang, W. (2020). Geotechnical Properties of 3D-Printed Transparent Granular Soil. Acta Geotech. 16 (6), 1789–1800. doi:10.1007/s11440-020-01111-7
Li, Y. (2013). Effects of Particle Shape and Size Distribution on the Shear Strength Behavior of Composite Soils. Bull. Eng. Geol. Environ. 72 (3), 371–381. doi:10.1007/s10064-013-0482-7
Liang, Y., Chen, P., Lin, J., and Sun, Z. (2019). Pore Flow Characteristics of Porous media Based on Transparent Soil Technology. Chin. J. Geot. Eng. 41 (7), 1361–1366. doi:10.11779/CJGE201907022
Liu, J., and Iskander, M. G. (2010). Modelling Capacity of Transparent Soil. Can. Geotech. J. 47 (4), 451–460. doi:10.1139/T09-116
Liu, H., Gao, K., and Zhu, X. (2021). Experimental Study on Dynamic Fatigue Properties of Dolomite Samples under Triaxial Multilevel Cyclic Loading. Bull. Eng. Geol. Environ. 80 (1), 551–565. doi:10.1007/s10064-020-01954-0
Lu, Y., Chen, J., Huang, J., Feng, L., Yu, S., Li, J., et al. (2021). Post-cyclic Mechanical Behaviors of Undisturbed Soft clay with Different Degrees of Reconsolidation. Appl. Sci. 11 (16), 7612. doi:10.3390/app11167612
Maghsoudi, M. S., Jamshidi Chenari, R., and Farrokhi, F. (2020). A Multilateral Analysis of Slope Failure Due to Liquefaction-Induced Lateral Deformation Using Shaking Table Tests. SN Appl. Sci. 2 (8), 1–11. doi:10.1007/s42452-020-03234-8
Mannheimer, R. J., and Oswald, C. J. (1993). Development of Transparent Porous Media with Permeabilities and Porosities Comparable to Soils, Aquifers, and Petroleum Reservoirs. Ground Water 31 (5), 781–788. doi:10.1111/j.1745-6584.1993.tb00851.x
McKelvey, D., Sivakumar, V., Bell, A., and Graham, J. (2004). Modelling Vibrated Stone Columns in Soft clay. Proc. Inst. Civil Eng. Geotechn. Eng. 157 (3), 137–149. doi:10.1680/geng.2004.157.3.137
Pincus, H., Iskander, M., Lai, J., Oswald, C., and Mannheimer, R. (1994). Development of a Transparent Material to Model the Geotechnical Properties of Soils. Geotech. Test. J. 17 (4), 425–433. doi:10.1520/gtj10303j
Sadek, S., Liu, J., and Iskander, M. G. (2002). Geotechnical Properties of Transparent Silica. Can. Geotech. J. 39 (1), 111–124. doi:10.1139/T01-075
Sadek, S., Iskander, M. G., and Liu, J. (2003). Accuracy of Digital Image Correlation for Measuring Deformations in Transparent media. J. Comput. Civ. Eng. 17 (2), 88–96. doi:10.1061/(asce)0887-3801(2003)17:2(88)
Serrano, R. F., Iskander, M., and Tabe, K. (2011). 3D Contaminant Flow Imaging in Transparent Granular Porous media. Géotechn. Lett. 1 (3), 71–78. doi:10.1680/geolett.11.00027
Sezer, A. (2013). Simple Models for the Estimation of Shearing Resistance Angle of Uniform Sands. Neural Comput. Applic 22 (1), 111–123. doi:10.1007/s00521-011-0668-5
Stanier, S. A., Black, J. A., and Hird, C. C. (2014). Modelling Helical Screw Piles in Soft clay and Design Implications. Proc. Inst. Civil Eng. Geotechn. Eng. 167 (5), 447–460. doi:10.1680/geng.13.00021
Su, C. D., Zhai, X. X., Xu, R. G., and Li, G. (2007). “Analysis on the Deformation and Strength Characteristics of Siltstone under Different Stress States,” in International Symposium on Mining Science and Safety Technology, Jiaozuo, Henan, China, April 16–19, 2007, 391–397.
Sui, W., and Zheng, G. (2018). An Experimental Investigation on Slope Stability under Drawdown Conditions Using Transparent Soils. Bull. Eng. Geol. Environ. 77 (3), 977–985. doi:10.1007/s10064-017-1082-8
Sun, J., and Liu, J. (2014). Visualization of Tunnelling-Induced Ground Movement in Transparent Sand. Tunnel. Undergr. Space Techn. 40, 236–240. doi:10.1016/j.tust.2013.10.009
Take, W., and Bolton, M. (2002). “The Use of Centrifuge Modelling to Investigate Progressive Failure of Overconsolidated clay Embankments,” in Workshop on Constitutive amd Centrifuge Modelling, Monte Verita, Switzerland, July 8–13, 2001, 191–197.
Vangla, P., and Latha, G. M. (2015). Influence of Particle Size on the Friction and Interfacial Shear Strength of Sands of Similar Morphology. Int. J. Geosynth. Ground Eng. 1 (1), 1–12. doi:10.1007/s40891-014-0008-9
Wei, L., Xu, Q., Wang, S., Wang, C., and Chen, J. (2019). Development of Transparent Cemented Soil for Geotechnical Laboratory Modelling. Eng. Geol. 262, 105354. doi:10.1016/j.enggeo.2019.105354
White, D., Take, W., Bolton, M., and Munachen, S. (2001). “A Deformation Measurement System for Geotechnical Testing Based on Digital Imaging, Close-Range Photogrammetry, and PIV Image Analysis,” in Proceedings of the International Conference on Soil Mechanics and Geotechnical Engineering, Istanbul, Turkey, August 27–31, 2001, 539–542.
White, D. J., Take, W. A., and Bolton, M. D. (2003). Soil Deformation Measurement Using Particle Image Velocimetry (PIV) and Photogrammetry. Géotechnique 53 (7), 619–631. doi:10.1680/geot.2003.53.7.619
Wu, Y., Chen, M., Zhou, Y., and Liu, J. (2020a). Distribution and Basic Characteristics of New Transparent clay. Chin. J. Geot. Eng. 42 (S1), 141–145. doi:10.11779/CJGE2020S1028
Wu, Y., Li, J., Jiang, H., and Kong, G. (2020b). Consolidation and Permeability Characteristics of Transparent Clay with Different Grain Composition. J. Northeast. Univ. 41 (6), 875–880. doi:10.12068/j.issn.1005-3026.2020.06.020
Yang, X., Jin, G., Huang, M., and Tang, K. (2020). Material Preparation and Mechanical Properties of Transparent Soil and Soft Rock for Model Tests. Arab J. Geosci. 13 (10), 1–10. doi:10.1007/s12517-020-05325-7
Yuan, B., Xiong, L., Zhai, L., Zhou, Y., Chen, G., Gong, X., et al. (2019). Transparent Synthetic Soil and its Application in Modeling of Soil-Structure Interaction Using Optical System. Front. Earth Sci. 7, 276. doi:10.3389/feart.2019.00276
Zhang, Y., Li, L., and Wang, S. (2014). Experimental Study on Pore Fluid for Forming Transparent Soil. J. Zhejiang Univ. 48 (10), 1828–1834. doi:10.3785/j.issn.1008-973X.2014.10.017
Zhang, J., Li, S., Zhang, Q., Zhang, X., Yang, L., Li, P., et al. (2018). Experimental Research on Destruction Characteristics of Tunnel Mud Inrush Using Transparent Soils. China J. Highw. Transp. 31 (10), 177–189.
Keywords: transparent cemented soil, hydrophobic fumed silica powder, fused quartz, preparation method, triaxial shear test, strength characteristics
Citation: Leng X, Wang C, Pang R, Sheng Q and Chen J (2021) Material Preparation and Geotechnical Properties of Transparent Cemented Soil for Physical Modeling. Front. Mater. 8:740388. doi: 10.3389/fmats.2021.740388
Received: 13 July 2021; Accepted: 09 November 2021;
Published: 25 November 2021.
Edited by:
Dongchan Jang, Korea Advanced Institute of Science and Technology, South KoreaReviewed by:
Hamid Akbarzadeh, McGill University, CanadaCopyright © 2021 Leng, Wang, Pang, Sheng and Chen. This is an open-access article distributed under the terms of the Creative Commons Attribution License (CC BY). The use, distribution or reproduction in other forums is permitted, provided the original author(s) and the copyright owner(s) are credited and that the original publication in this journal is cited, in accordance with accepted academic practice. No use, distribution or reproduction is permitted which does not comply with these terms.
*Correspondence: Xianlun Leng, eGxsZW5nQHdocnNtLmFjLmNu
†These authors have contributed equally to this work and share first authorship
Disclaimer: All claims expressed in this article are solely those of the authors and do not necessarily represent those of their affiliated organizations, or those of the publisher, the editors and the reviewers. Any product that may be evaluated in this article or claim that may be made by its manufacturer is not guaranteed or endorsed by the publisher.
Research integrity at Frontiers
Learn more about the work of our research integrity team to safeguard the quality of each article we publish.