 Théo A. Ghafour
 Julien Colmars2
 Philippe Boisse
- 1Institut de Recherche Technologique Matériaux Métallurgie Procédés (IRT M2P), Metz, France
- 2Université de Lyon, LaMCoS, CNRS, INSA-Lyon F-69621, Villeurbanne, France
Most of the numerical simulations of dry textile reinforcements forming are based on a macroscopic approach and continuous material models whose behavior is assumed to be elastic (linear or nonlinear). On the one hand, the experience shows that under loading/unloading stresses, residual inelastic deformations are observed. On the other hand, among the deformations that a woven reinforcement undergoes during forming, in most cases, only bending is subject to loading/unloading stresses. The first objective of this work is to highlight the inelastic bending behavior of textile reinforcements during a forming process and to find the possible origins of inelasticity. The second objective is to find the cases generating bending loading/unloading during forming as well as to study the influence of the bending inelasticity on forming simulation. For this purpose, the inelastic bending behavior was characterized by three-point bending tests. Then, the Dahl friction model was adapted to bending to describe the inelastic behavior. Finally, this model was implemented in a finite element code based on shell elements allowing the study of the influence of taking into account the inelastic behavior in bending on the numerical simulation of forming.
Introduction
The use of composite materials is in continuous growth in many industrial sectors such as aeronautics (Irving and Soutis, 2019; McIlhagger et al., 2020), automotive (Liu et al., 2016; Lee et al., 2019), sports accessories (Collotta et al., 2018; Fleischmann et al., 2018), etc. The excellent mechanical characteristics of continuous fiber composite materials offer the opportunity to develop lighter materials, with high performances.
The properties of composite materials are highly dependent on the orientation of the fibers. This can be controlled successfully in the case of flat panels, but much more difficult in the case of double curve complex shapes. The control of the fiber orientations of the final composite part allows to optimize its mechanical behavior for a given load specification. To help in this task, a considerable amount of research has been carried out over the last 20 years on the simulation of the forming of woven reinforcements. These simulations make it possible to determine the orientation of the fibers after the forming of the woven reinforcement as well as the appearance and development of defects such as wrinkles (Hancock and Potter, 2006; Ten Thije and Akkerman, 2009; Boisse et al., 2011; Walther et al., 2012; Gereke et al., 2013; Mitchell et al., 2016; Mallach et al., 2017; Kärger et al., 2018).
In the LCM processes (Rudd and Long, 1997; Advani and Hsiao, 2012), the first stage consists of forming a dry woven reinforcement and the second stage consists of injecting the resin and solidifying the part. In this context, the present study focuses on the forming stage of the dry woven reinforcements. Most of the simulations of forming processes are based on a macroscopic approach and continuous material models whose behavior is assumed to be elastic (Peng and Cao, 2005; Allaoui et al., 2011; Peng and Rehman, 2011; Gereke et al., 2013; Schirmaier et al., 2017; Bussetta and Correia, 2018), hypoelastic (Yu et al., 2005; Khan et al., 2010) or hyperelastic (Charmetant et al., 2012; Belnoue et al., 2016; Gong et al., 2016). However, the experience shows that the behavior of dry woven reinforcements is inelastic: for example, a reinforcement based on glass fibers was formed and then the punch was removed (Figure 1). If the behavior of the reinforcement was elastic, it would return to the initial position after the release of the punch. While the reinforcement did not maintain the geometry imposed by the punch, it did not return to the initial position. This experiment highlighted the inelastic behavior of the fibrous reinforcements. This inelastic behavior can be explained by the presence of slippage between the fibers and the yarns during forming. These slips are associated with friction and thus with inelastic behavior of the material.
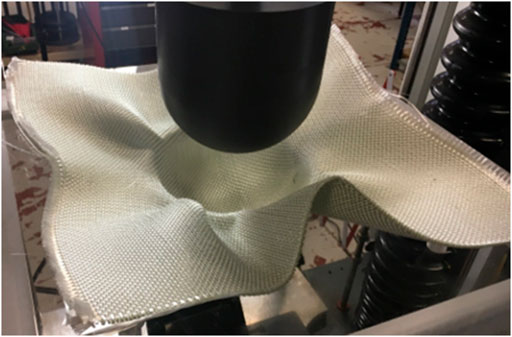
FIGURE 1. A punch release after hemispherical forming of a textile reinforcement based on glass fibers.
Elasto-plastic behavior models have been used to describe the inelastic behavior of laminated composites (Hochard et al., 2005; Krasnobrizha et al., 2016) and dry reinforcements (Denis et al., 2018). In contrast, the inelastic behavior of fibrous reinforcements is not necessarily associated with plasticity. For example, it is possible to fold and unfold a piece of woven reinforcement without damaging the material. Moreover, woven reinforcements are stored in rolls and often flattened to be used.
When forming woven reinforcements, tension in the direction of the fibers, in-plane shear and bending are deformation modes describing their deformation mechanism. The tensile stiffness is much greater than the other stiffnesses. In-plane shear is the principal mode of deformation of woven reinforcements when the shape to be produced is double-curved. It is thanks to the low rigidity associated with this mode of deformation that it is possible to give a woven reinforcement a non-developable geometry. The in-plane shear behavior of textile composite reinforcements has been studied extensively (Lebrun et al., 2003; Harrison et al., 2004; d’Agostino et al., 2015; Boisse et al., 2017). The out-of-plane bending rigidity governs the geometry of the wrinkles obtained during the forming of the reinforcements (Boisse et al., 2011; Boisse et al., 2018).
It has been shown that in-plane shear loading/unloading is rare during the forming of fibrous reinforcements (Ghafour et al., 2019). However, it is frequent for bending: the reinforcement is subjected to loading/unloading in bending when it passes over an edge radius of the forming tool. Thus, these non-monotonous bending loadings that occur during forming make appear the inelastic behavior of the reinforcement. The aim of this work is to study the influence of inelasticity in bending on the simulation of the forming of textile reinforcements.
This manuscript proposes a version of Dahl’s friction model allowing to take into account the inelastic bending behavior of a fibrous reinforcement. This model describes this complex mechanical behavior in a very satisfactory way, while being relatively easy to use.
The first objective of this work was to characterize the mechanical behavior of woven reinforcements in bending by means of three-point bending tests (Jin et al., 2012; Mathieu et al., 2015) and cantilever tests (Peirce, 1930; ASTM, 2002; Liang et al., 2014). The three-point bending tests made it possible to impose loading/unloading in bending and thus to highlight the inelastic nature of these materials. The Dahl friction model (Dahl, 1976) was then adapted to bending to describe the inelastic behavior in this mode of deformation.
The resulting model was then implemented in an finite element code based on shell elements specific to textile reinforcements (Hamila et al., 2009). This allowed a simulation-experimental comparison of bending characterization tests to validate the use of this model for woven reinforcements.
Finally, the influence of taking into account the inelastic behavior in bending on the numerical simulation of the forming process was studied for wrinkling forming as well as for a hemispherical forming case.
Analysis of Mechanical Behavior in Bending
The Bending Tests
The bending behavior of woven reinforcements can be characterized using Peirce’s device (Peirce, 1930), which is a cantilever test. Its exploitation is based on the assumption of linearity between bending moment and curvature. The device is made of two plates, the first one is horizontal and the second one is inclined at an angle
Extensions of Pierce’s test were performed by de Bilbao et al. (2010) and Liang et al. (2014) in order to find a non-linear relationship between bending moment and curvature. These works are based on the determination of the curvature along the deformed reinforcement by optical measurement.
The KES-FB-2 bending test is another standard test used for woven reinforcements (Kawabata, 1980; Lomov et al., 2003). This test was developed by Kawabata and allows the bending moment to be recorded as a function of the curvature during bending loading. This test provides a non-linear relationship between bending moment and curvature. On the other hand, this test is designed for clothing fabrics and is not always adapted to composite reinforcements which can be stiffer and thicker.
Another device, based on the same principle as the Kawabata bending test, has been proposed (Ropers et al., 2016; Sachs and Akkerman, 2017). This device allows to monitor temperature and strain rate.
At the macroscopic scale, standard bending tests use two simple models relating bending moment to curvature: Peirce’s linear elastic model (Peirce, 1930) and Grosberg’s non-elastic model (Grosberg, 1966; Grosberg and Kedia, 1996).
Some works (Ngoc et al., 2002; de Bilbao et al., 2010) have used the Dahl friction model to describe the inelastic bending behavior of woven reinforcements.
The Model of Dahl
Dahl’s model (Dahl, 1976) was originally developed to describe the dry friction occurring in a rolling bearing system. This model is a dynamic regularization of the Coulomb model, in the meaning that the friction at a point will be a function of the history of the motion, of the set of intermediate positions having led to this point.
The time derivative of the frictional force is considered:
where
Dahl assumes that the evolution of the frictional force
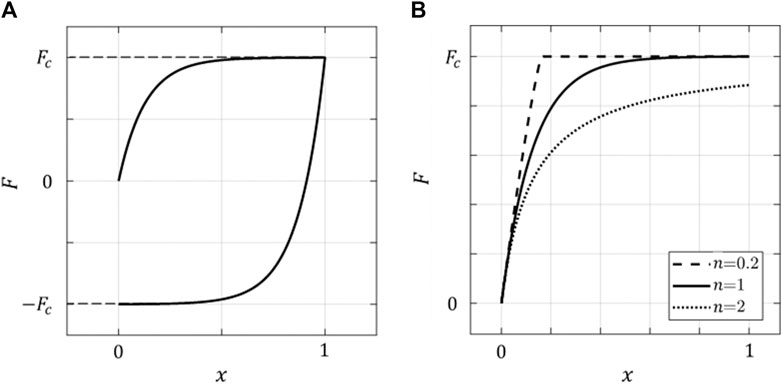
FIGURE 2. The model of Dahl: (A) Typical function of the frictional force, (B) Shape parameter n.
The following differential relationship is established:
The parameter
This model has been used to describe the bending behavior of woven reinforcements (Ngoc et al., 2002; de Bilbao et al., 2010). The bending stiffness of woven reinforcements is assumed to be mainly due to friction between the yarns and the layers constituting the woven fabric.
The model of Dahl applied to the moment-curvature relationship can be written in the form:
where
This Dahl model, which is based on friction behavior, is well suited to inelastic behavior in bending because it is related to the friction between the fibers.
In this work, the bending behavior was characterized by three-point bending tests as well as cantilever tests. The cantilever bending tests do not allow the woven reinforcement to be subjected to unloading. However, three-point bending tests allow this to be done. Thus, these latest tests have allowed us to study the inelastic bending behavior of the woven reinforcements. The cantilever bending tests were nevertheless carried out in order to compare the relationships between the bending moment and the curvature obtained from these tests with those obtained from the three-point bending tests for the loading phase. The bending behavior relationships sought in this work are based on the Dahl model adapted to bending, and in the form of a relationship between moment and curvature so that they are adapted to the finite element code used.
Bending Tests: Material and Method
The material studied in this work is a woven reinforcement based on glass fibers: 3D orthogonal non-crimp woven fabric (Pazmino et al., 2014; Naouar et al., 2015) with a thickness of approximately 3 mm (Figures 3A,B).
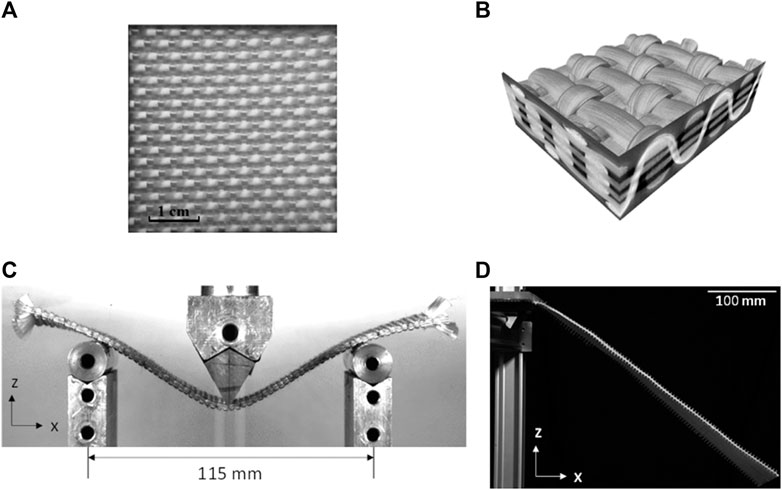
FIGURE 3. Glass-based 3D woven reinforcement: (A) image, (B) 3D tomography reconstruction (Naouar et al., 2015). (C) Three-point bending test, (D) Cantilever bending test.
To carry out the three-point bending test (Figure 3C), the experimental protocol consists of placing a specimen of the reinforcement between two supports and then moving the loading pin down to impose loads/unloads. The loading phases were controlled in displacement while the unloading phases were controlled in load (unloading until zero force). The specimen was initially oriented along x-axis for the weft direction and y-axis for the warp direction.
The equipment that was used: a computer-controlled tensile machine (Lloyd LF Plus 1 kN); a 100 N load cell; a support carrying two 16 mm diameter cylindrical supports; and a camera connected to the computer to monitor the reinforcement during the test. The specimens are 210 × 55 × 3 mm in size.
For the cantilever bending test, the specimen was fixed on one side with a metal support (blocking any displacement/rotation) and allowed to bend under its own weight (Figure 3D). A camera connected to a computer was used to take an image of the deformed sample. The specimens are 445 × 70 × 3 mm in size.
For the three-point bending test, the bending moment
This woven reinforcement is quasi-balanced and the bending moment-curvature behavior is considered to be the same in the warp and weft directions.
Determination of the Bending Curvature
For the three-point bending test, several images were obtained for each test. Each image corresponds to a time t during loading/unloading. For the cantilever bending test, only one image was obtained for each test. The software “Fiji” (Schindelin et al., 2012) was used to extract from each image experimental points belonging to the mid-line of the specimen. Once the experimental mid-line was obtained, a polynomial
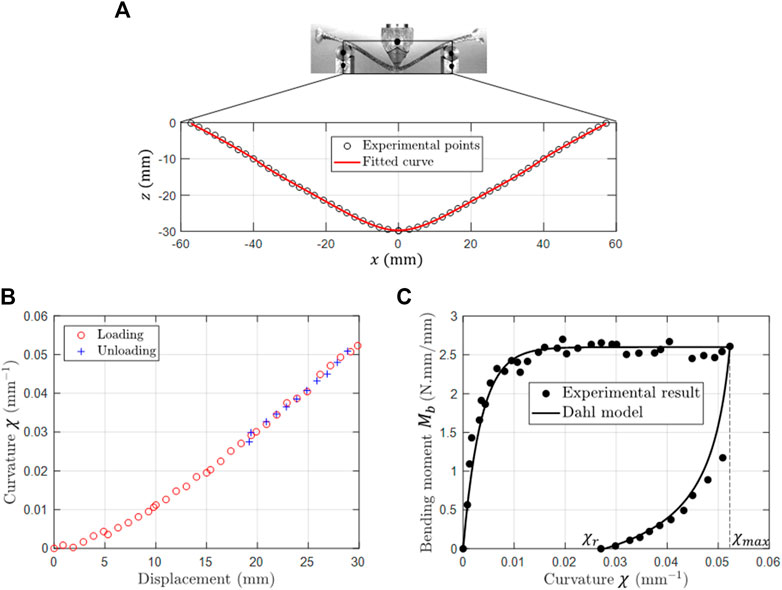
FIGURE 4. Three-point bending test (A) experimental points and fitted curve of the mid-line at time t, (B) bending curvature at the point of application of the load as a function of the displacement, (C) bending moment as a function of the curvature at the point of application of the load for a loading/unloading.
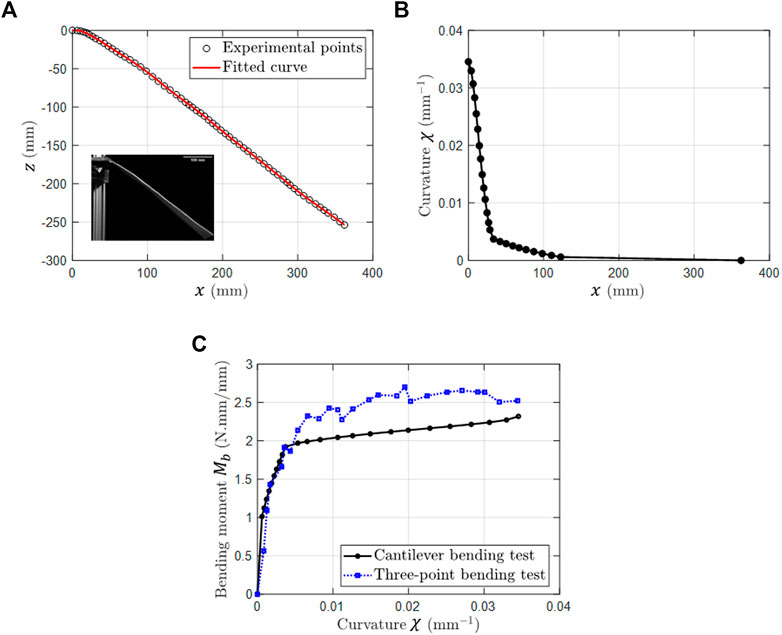
FIGURE 5. Cantilever bending test (A) experimental points and fitted curve of the mid-line of the deformed reinforcement, (B) curvature as a function of
The curvature was calculated from
Determination of the Bending Moment
For the three-point bending test, the calculation of the moment was carried out on the mid-line of the deformed sample. The bending moment was determined at the point of application of the load on the updated configuration provided by the images of the sample. At any time t, the point of contact between the supports and the fabric was also updated (Figure 6).
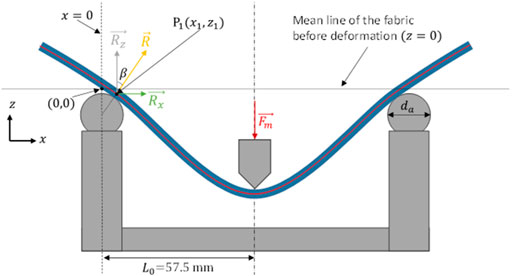
FIGURE 6. Point of contact between support and fabric; and direction of support reactions.
In the initial state, the mid-line of the woven reinforcement is assumed to coincide with the horizontal axis (
The Geometric Relationships Give:
with
The studied woven reinforcement remains horizontal on the two supports when it is not subjected to any effort: its own weight is not important enough to make it bend. Thus, the own weight is neglected in the calculation of the moment.
The bending moment at the point of load application is given by:
with
For the cantilever bending test, the bending moment at any point A along the deformed sample was calculated as follows:
where
Bending Test Results and Behavior Modelling
Three-Point Bending Tests
Figure 7A shows the load-displacement curve corresponding to a loading/unloading in bending. The loading phase was controlled in displacement while the unloading phase was controlled in load (unloading until zero force). This curve clearly shows that the behavior of the studied reinforcement is inelastic. In addition, after a loading/unloading, the reinforcement did not return to its initial configuration: a residual deformation was obtained. Figure 7B corresponds to alternating loading/unloading. This figure shows that the residual displacement at zero force of each load/unload depends on the imposed displacement during the loading phase: the greater the imposed displacement, the greater the residual displacement.
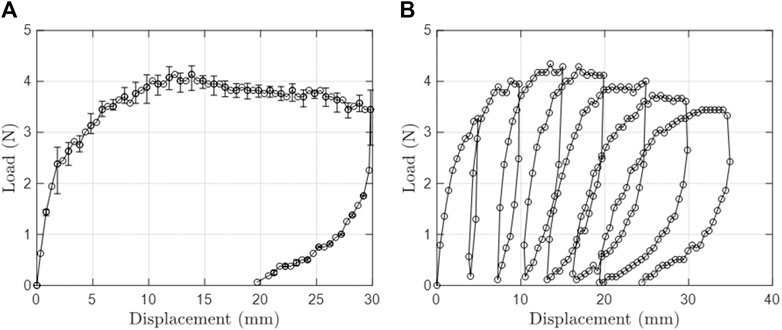
FIGURE 7. Experimental load-displacement curve (A) one loading/unloading, (B) several loadings/unloadings.
In order to get an idea of the interaction between the different fiber layers, the variation of the direction of the cross sections during the loading phase of a three-point bending test was studied. This study is interesting because it allowed, with a macroscopic scale test, to find a possible source of inelasticity which is the friction between the different layers of fibers.
Dot marks have been drawn on the yarns whose direction is in the plane of the photo. These points were used to define the direction of a cross section of the reinforcement at time t. Figure 8 shows the deformed specimen as well as the cross sections studied at the initial time (Figure 8A) and at the time corresponding to a 30 mm displacement of the loading pin (Figure 8B). These different cross sections were chosen in a way to cover the different zones of the specimen: some sections are close to the loading point, others close to the cylindrical supports and others between these two zones.
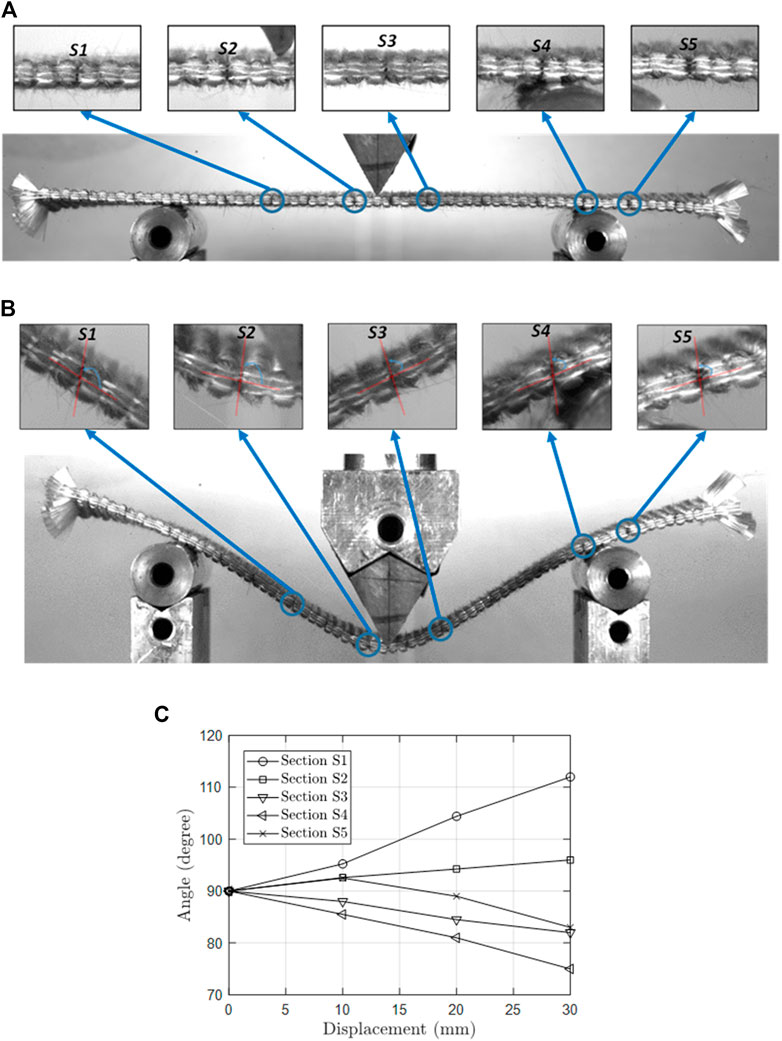
FIGURE 8. Cross sections of the reinforcement (A) initial state, (B) after a displacement of 30 mm. (C) Angle between the different cross sections and the mid-line of the reinforcement during loading.
The cross sections are initially vertical and perpendicular to the mid-line of the reinforcement. Figure 8C shows the evolution of the angle between the different cross sections and the mid-line. The measurement uncertainty is of the order of 3°. This figure shows that the transverse directions do not remain perpendicular to the mid-line of the reinforcement during deformation. This mobility confirms that there is slippage between the layers of fibers, which can cause friction. This explains, in part, the inelastic behavior observed in Figure 7.
Figure 4 shows the results of calculations of the moment and curvature of a loading/unloading in bending, the corresponding load-displacement curve is shown in Figure 7A. After fitting the experimental points belonging to the mid-line by a continuous function (Figure 4A), the curvature was calculated at the point of application of the load using Eq. 4 for each image corresponding to a displacement during the loading/unloading (Figure 4B). This figure shows that the relationship between curvature and displacement is quasi-linear and that this relationship is the same for loading and unloading. The evolution of the moment as a function of the curvature is shown in Figure 4C where a distinction is made between the loading phase and the unloading phase. These two phases take different paths due to the dissipative (inelastic) behavior of the reinforcement.
The bending model of Dahl (Eq. 3) gives the material an inelastic behavior comparable to a perfect elasto-plastic behavior; the bending stiffness is the same for the loading phase and for the unloading phase when the bending moment is zero (Figure 2A). This stiffness is equal to parameter
However, Figure 4C shows that the bending stiffness of the studied reinforcement is not the same for loading and for unloading under zero bending moment: the stiffness at low bending moment is much lower for the unloading phase than for the loading phase. This calls into question the relevance of an analogy with the behavior of a classical elasto-plastic material for which the bending stiffness would be the same for the loading and unloading phases under zero bending moment. This deviation from a classical elasto-plastic material may be due to a phenomenon of reorganization of the fiber networks during the deformation, which modifies the number of contacts between them.
It has been noticed that woven reinforcements have a different mechanical behavior from that of more classical materials: for example, it is possible to fold and unfold a piece of woven reinforcement without damaging the material. Moreover, woven reinforcements are stored in rolls and often flattened to be used. Thus, it is proposed to adapt the inelastic model of Dahl to the woven reinforcements by giving model parameters for the unloading phase that are different from those of the loading phase. The model becomes:
This model was used to describe the bending behavior experimentally found in this work (Figure 4C). For the loading phase the model parameters are:
The parameters of the unloading phase depend on the loading history and more specifically on the curvature
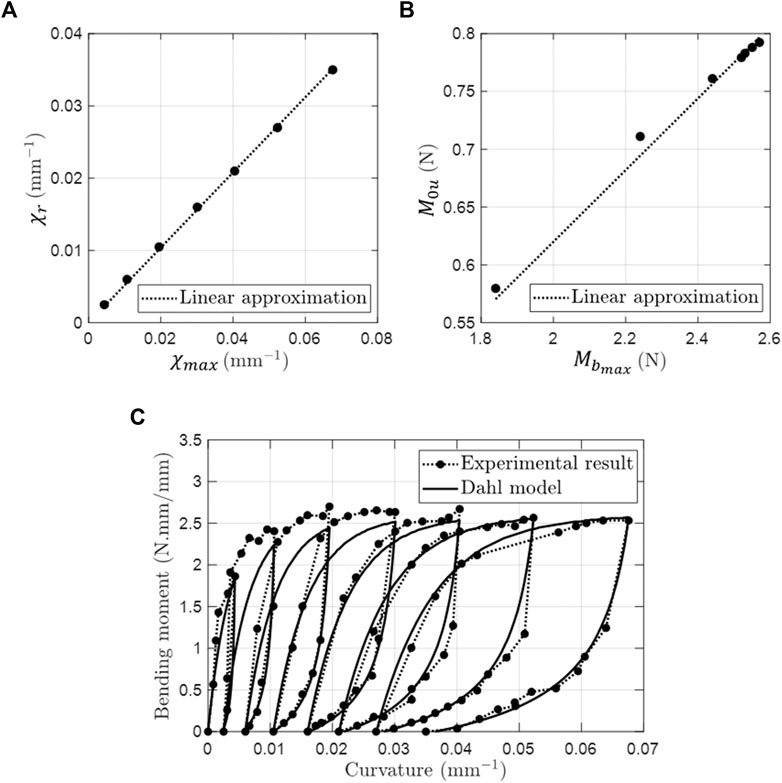
FIGURE 9. (A)
This relationship can be used when determining the parameters of the unloading phase.
For the unloading phase, the representative curve
The parameter
Thus, from the curvature
Figure 9C shows the experimental relationship between the bending moment and the curvature corresponding to the test shown in Figure 7B. Figure 9C also shows the modified Dahl model whose unloading phase parameters were determined using Eqs 9–11.
Cantilever Bending Test
Figure 5 shows the results of the cantilever bending test. The curvature was calculated along the specimen (Figure 5B). The curvature is maximum at the level of the fixed side and decreases rapidly away from this zone to become almost zero for
This test allowed to obtain a non-linear relationship between the bending moment and the curvature (Figure 5C). However, this relationship corresponds to the loading phase since this test does not allow the reinforcement to be subjected to unloading in bending. The relations
Numerical Simulation by the Finite Element Method
On a macroscopic scale, the main objective is to simulate the shaping of the fibrous reinforcements on the scale of the entire part. Among the known macroscopic approaches, there are geometrical kinematic drape modeling approaches (Mack and Taylor, 1956; Van Der Weeën, 1991; Borouchaki and Cherouat, 2002) which only integrate geometric effects (without stress) and mechanical approaches integrating the behavior of the material and the boundary conditions. Among the latters, there are discrete and continuous approaches. Discrete approaches consist in considering the textile as a discontinuous assembly of deformable elements (Sze and Liu, 2005; Boubaker et al., 2007) while continuous approaches assume a continuous material at the macroscopic scale.
Different approaches, whether hypoelastic (Yu et al., 2005; Khan et al., 2010) or hyperelastic (Charmetant et al., 2012; Gong et al., 2016; Belnoue et al., 2016), have given convincing results. These laws are associated with shell or plate finite elements for thin woven fabrics and brick elements for thick woven fabrics.
Most simulations of the shaping of dry fibrous reinforcements are carried out at macroscopic scale and under the assumption of an elastic mechanical behavior of the reinforcements. An elastic (reversible) behavior is expressed by a relationship between load and deformation that remains the same for the loading and unloading phases. This relationship can be linear or non-linear.
In this work, a finite element code using an explicit temporal scheme and based on stress resultant shell elements (Hamila et al., 2009) was used. In this approach, the stresses in the textile reinforcement are represented by the resultant warp and weft tensions (
The virtual work of the internal loads of a woven reinforcement is given by:
With:
Where
For an elastic mechanical behavior model, the relationships between the loads and the deformation fields (
In order to take into account the inelastic behavior in bending, the behavior model
Bending Test Simulations
The objective of this part is to simulate by finite elements the bending tests in order to validate the efficiency of the bending model used in this work to predict the geometries and the loads obtained experimentally. For this purpose, the Dahl model has been implemented in the stress resultant shell elements.
Three-Point Bending Test
The simulation of a loading/unloading in a three-point bending test was carried out to validate the bending model of Dahl.
The orientations of the specimen fibers and boundary conditions used for numerical simulation correspond to those of the experimental test: the reinforcement is placed freely on two cylindrical supports of 16 mm diameter and a loading pin moves down/up to impose loading/unloading. The loading phase corresponds to an imposed displacement of 30 mm. The unloading phase corresponds to a return to zero force.
Figure 10A shows that the load-displacement relationship at the point of application of the force obtained by simulation is consistent with that obtained by experimentation. The mid-lines of the deformed sample obtained by simulation and experimentation are shown in Figure 10B for the end of the loading phase and in Figure 10C at the end of the unloading phase. The geometry of the deformed sample obtained by simulation is consistent with that obtained by experimentation. If during the loading phase the loading pin imposes the displacement of the reinforcement at the point of application of the force, this is not the case after its release where the reinforcement is free to have a residual deformation. At the end of the unloading phase, the residual displacement obtained by simulation is consistent with that obtained by experimentation. The reinforcement would return to its initial configuration (flat and horizontal) if the simulation was done with an elastic behavior model. The inelastic model allowed here to predict the non-elastic return of the reinforcement.
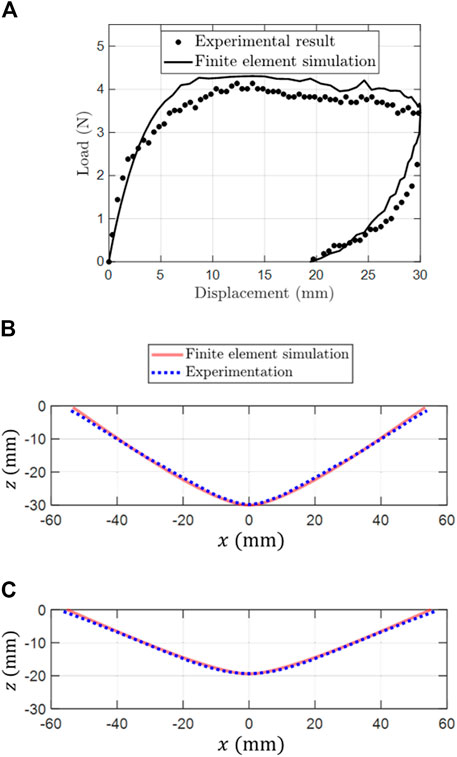
FIGURE 10. Three-point bending test. (A) load/displacement curves at the point of load application. Numerical and experimental geometries of the deformed fabric: (B) at the end of the loading phase and (C) at the end of the unloading phase.
Cantilever Bending Test.
The boundary conditions for this test are as follows: the left end of the specimen is embedded while the rest is free and bends under its own weight. The dimensions of the specimen are: 445 × 70 × 3 mm.
The finite element numerical simulation of the cantilever bending test gave a geometry of the deformed sample that is consistent with that obtained experimentally (Figure 11).
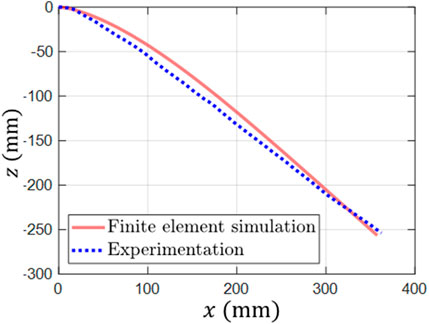
FIGURE 11. Numerical and experimental deformed sample geometry of the cantilever bending test.
Thus, these characterization tests validate the use of the bending model of Dahl and the parameters of this model described in Bending Test Results and Behavior Modelling.
Simulation of Wrinkling Under Longitudinal Compression
The low bending stiffness of the fibrous reinforcements makes them sensitive to buckling when compressed in their plane, which leads to the formation of wrinkles.
In this section, loading/unloading in bending during the formation of wrinkles is highlighted. In addition, the importance of using an inelastic model to simulate wrinkles formation is studied.
For this purpose, a compression in the plane of three samples was applied, by numerical simulation. These three samples corresponded to three different woven reinforcements having, respectively, the bending stiffnesses R1, R2, and R3. R1 corresponds to the bending stiffness of the fabric studied in this work. R2 and R3 are, respectively, 100 times and 1,000 times weaker than R1. Longitudinal compression was applied to 100 × 20 mm specimens by bringing their ends closer together causing out-of-plane deformation. The principle is observed in Figure 12A for the reinforcement whose stiffness is R2. Figure 12B shows the evolution of the curvature as a function of time of an element of this reinforcement during deformation. This figure shows that some areas of the reinforcement are subjected to loading/unloading in bending during wrinkles forming. Hence the interest to study the importance of taking into account the inelastic behavior on the formation of wrinkles.
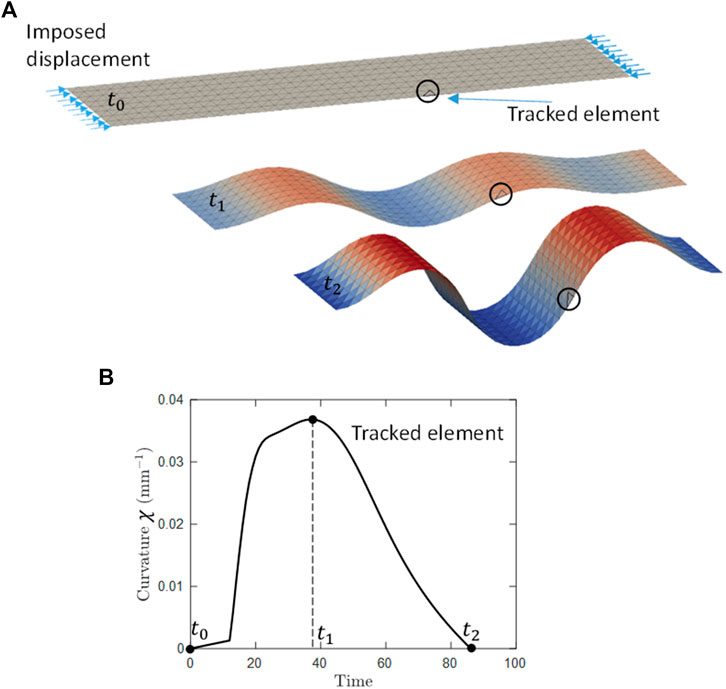
FIGURE 12. (A) Out-of-plane deformation obtained during in-plane compression of a woven reinforcement. (B) Curvature as a function of time of an element of the reinforcement.
Figure 13A shows a comparison between the geometries of the deformed samples obtained by numerical simulations of wrinkling under longitudinal compression using an inelastic behavior model and those obtained with an elastic behavior model for the different bending stiffnesses R1, R2, and R3.
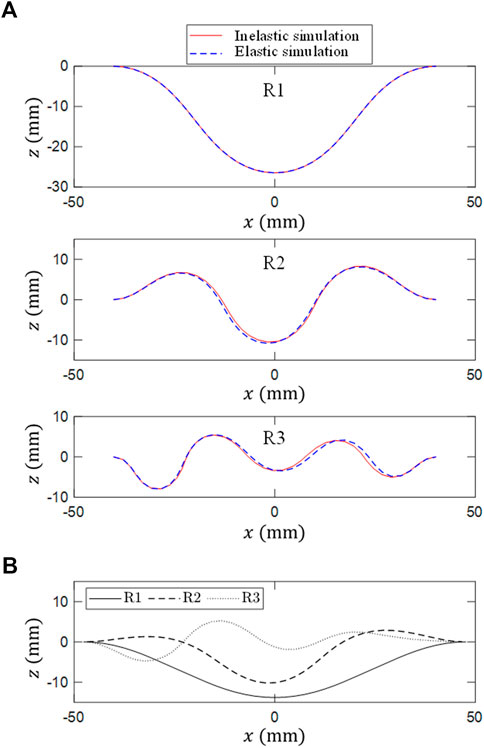
FIGURE 13. (A) Simulation of wrinkling under longitudinal compression of woven reinforcements of stiffness R1, R2 and R3, (B) Deformed shapes of the reinforcements after unloading.
For the R1 stiffness reinforcement, the elastic and inelastic simulations gave the same geometry after deformation. This is due to the fact that this reinforcement was subjected to bending loading without unloading: during the formation of a single wrinkle there are no elements that move from an area with more bending stress to an area with less bending stress.
For the two other stiffnesses R2 and R3, the formation of several wrinkles leads some elements to move from an area with more bending stress to an area with less bending stress (as in Figure 12). Thus, these reinforcements were subjected to loading/unloading and the inelastic mechanism was solicited. This explains the difference between the deformed shapes obtained by simulations with an elastic model and those obtained with an inelastic model. This difference remains small: the number of wrinkles and their amplitudes have not changed significantly.
Figure 13B shows the deformed shapes of the reinforcements after unloading (release of its ends): they do not return to their initial configurations.
Experiments and Simulation of a Hemispherical Forming
In this part the hemispherical forming is studied. This forming geometry presents a double curve shape. The forming was carried out without using a blank holder in order to study the formation of wrinkles in the areas of the reinforcement that were not exposed to the punch.
The punch is a hemisphere of radius
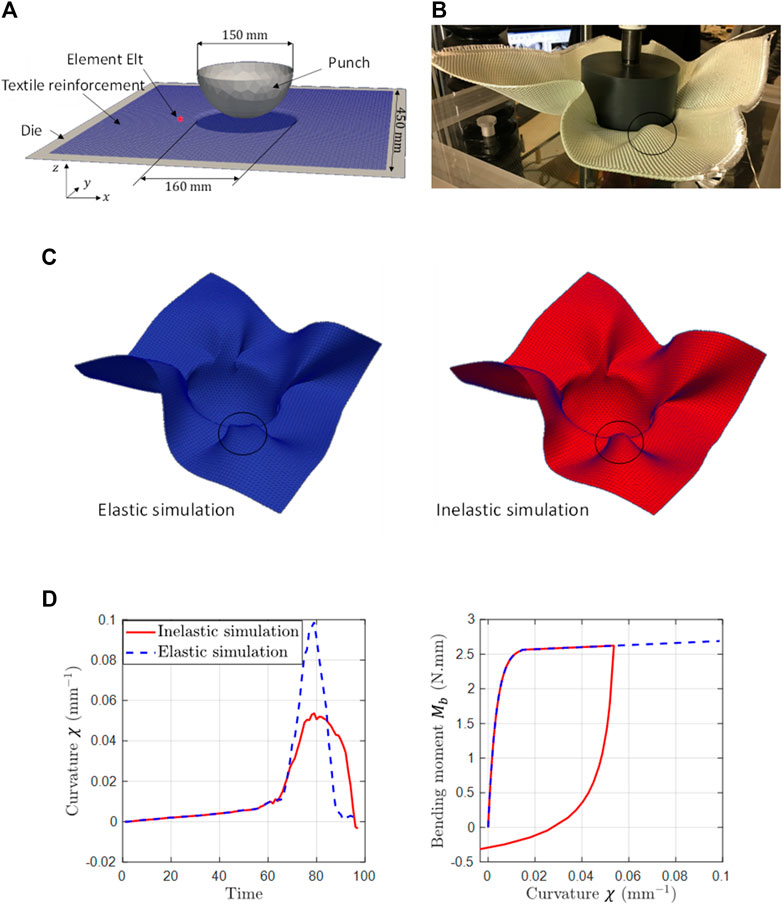
FIGURE 14. Hemispherical forming (A) tool geometry, (B) experimental geometry of the deformed woven reinforcement, (C) numerical geometries obtained with elastic and inelastic behavior models, and (D) the curvature as a function of time and the bending moment as a function of the curvature of the element Elt.
Figure 14D shows the evolution of the curvature as a function of time as well as the bending moment as a function of the curvature of the element Elt (visible in Figure 14A). This element has been chosen in such a way that it is representative of the areas that undergo a loading/unloading when passing through an edge radius of the forming tool. Figure 14D highlights the presence of a loading/unloading in bending during the forming of the reinforcement. This non-monotonous loading is due to the passage of the studied element by an edge radius of the tool. For most forming processes, the passage through an edge radius of the tool is unavoidable and, therefore, some areas of the reinforcement are subjected to loading/unloading in bending. This figure also shows that, for the studied element, the maximum curvature reached for the elastic simulation is greater than the one for the inelastic simulation. This is due to the fact that the areas adjacent to this element, and which are closer to the edge radius, are first subjected to a loading/unloading. In addition, the tangent stiffness increases during the transition from the loading phase to the unloading phase (see relation
Figure 14C shows the numerical geometries obtained at the end of the hemispherical forming of the studied reinforcement with the elastic and inelastic behavior models. These geometries obtained with the two behavior models are not significantly different and are consistent with the one obtained by experimentation (Figure 14B). Small differences were nevertheless observed at the level of the wrinkles: the widths of some wrinkles of the deformed reinforcement corresponding to the inelastic simulation are slightly smaller than those corresponding to the elastic simulation. The encircled wrinkle in Figure 14 shows that the wrinkle width obtained by the inelastic simulation was closer to the one obtained by experimentation than the one obtained by the elastic simulation.
Figure 15 shows the magnitude of the internal bending loads. The differences in loads between the simulation with the elastic model and the one with the inelastic model are significant in some areas (up to 60%). It is necessary to accurately calculate the internal bending moments at the end of the forming process since they determine the internal stresses to be taken into account for the resin injection phase for LCM processes.
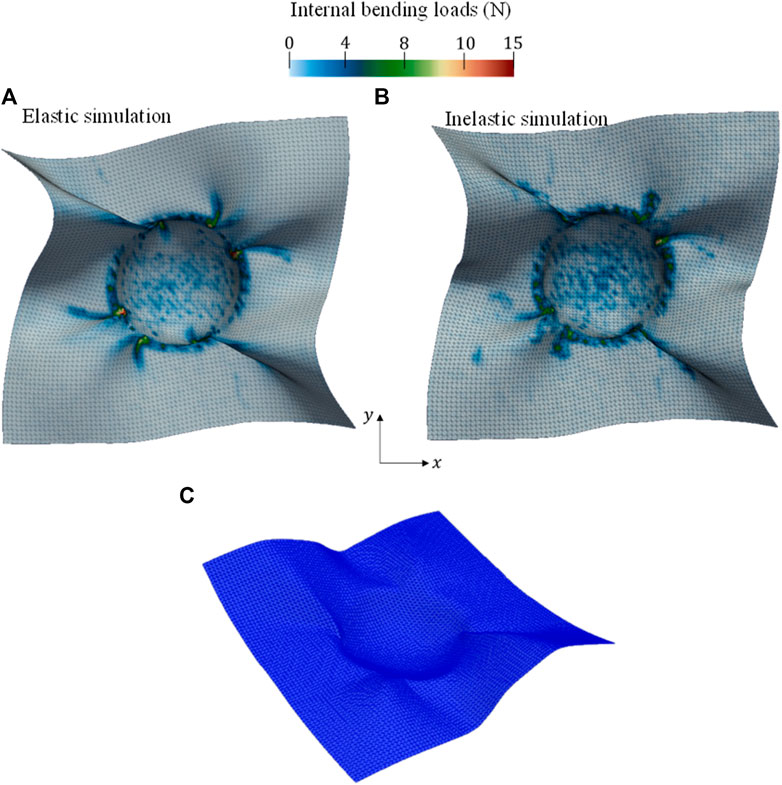
FIGURE 15. Internal bending loads (A) elastic simulation, (B) inelastic simulation. (C) Numerical geometry of the reinforcement after the removal of the hemispherical punch (inelastic simulation) (Colored version online).
In the case of monotonous forming, the final geometry of the preform is mainly imposed from the punch geometry. This explains why simulations with both behavior models (elastic and inelastic) give close geometries. However, in the case of punch removal, the final geometry of the preform is no longer imposed. Thus, this case is interesting to study since it allows to better investigate the relevance of the proposed inelastic model. Figure 15C shows the numerical geometry of the deformed reinforcement obtained after the removal of the hemispherical punch. The reinforcement did not return to its original configuration as in the case of an elastic behavior. This numerical geometry is consistent with that obtained by experimentation (Figure 1).
Conclusion
In this work, the inelastic behavior in bending was highlighted by applying loading/unloading in three-point bending test. Thanks to the optical monitoring of the yarns, a slip between the different layers of fibers was observed. This slippage is expected to generate friction; which explains, in part, the observed inelastic behavior.
The friction model of Dahl was adapted to describe the inelastic behavior in bending of woven reinforcements. Then, this model was implemented in stress resultant shell elements and validated by comparison simulation-experiment of bending tests.
During the forming of a textile reinforcement, the latter is subjected to loading/unloading in bending when passing through an edge radius of the forming tool as well as during the formation of wrinkles. This makes appear the inelastic behavior of the reinforcement. Concerning the geometry of the reinforcement during its forming, numerical simulations with an inelastic behavior model have given results that are close to those obtained with an elastic behavior model. However, the difference becomes significant if the punch or load is released: the simulation with an elastic model does not predict the non-elastic return of the reinforcement.
In addition, simulation with an inelastic behavior model was able to predict accurately the loading/unloading loads of a three-point bending test. The model was then used in a forming simulation to estimate residual stresses.
Further studies at the meso-scopic scale would allow a better understanding of the different sources of dissipations.
Data Availability Statement
The raw data supporting the conclusions of this article will be made available by the authors, without undue reservation.
Author Contributions
All authors listed have made a substantial, direct, and intellectual contribution to the work and approved it for publication.
Funding
This work was supported by the French Ministry of Higher Education and Research.
Conflict of Interest
The authors declare that the research was conducted in the absence of any commercial or financial relationships that could be construed as a potential conflict of interest.
Publisher’s Note
All claims expressed in this article are solely those of the authors and do not necessarily represent those of their affiliated organizations, or those of the publisher, the editors and the reviewers. Any product that may be evaluated in this article, or claim that may be made by its manufacturer, is not guaranteed or endorsed by the publisher.
References
Allaoui, S., Boisse, P., Chatel, S., Hamila, N., Hivet, G., Soulat, D., et al. (2011). Experimental and Numerical Analyses of Textile Reinforcement Forming of a Tetrahedral Shape. Composites A: Appl. Sci. Manufacturing 42, 612–622. doi:10.1016/j.compositesa.2011.02.001
ASTM (2002). Standard Test Method for Stiffness of Fabrics. West Conshohocken, Pennsylvanie: American Society for Testing Materials, D1388–D1396. chapter.
Belnoue, J. P.-H., Nixon-Pearson, O. J., Ivanov, D., and Hallett, S. R. (2016). A Novel Hyper-Viscoelastic Model for Consolidation of Toughened Prepregs under Processing Conditions. Mech. Mater. 97, 118–134. doi:10.1016/j.mechmat.2016.02.019
Boisse, P., Colmars, J., Hamila, N., Naouar, N., and Steer, Q. (2018). Bending and Wrinkling of Composite Fiber Preforms and Prepregs. A Review and New Developments in the Draping Simulations. Composites B: Eng. 141, 234–249. doi:10.1016/j.compositesb.2017.12.061
Boisse, P., Hamila, N., Guzman-Maldonado, E., Madeo, A., Hivet, G., and dell’Isola, F. (2017). The Bias-Extension Test for the Analysis of In-Plane Shear Properties of Textile Composite Reinforcements and Prepregs: a Review. Int. J. Mater. Form. 10, 473–492. doi:10.1007/s12289-016-1294-7
Boisse, P., Hamila, N., Vidal-Sallé, E., and Dumont, F. (2011). Simulation of Wrinkling during Textile Composite Reinforcement Forming. Influence of Tensile, In-Plane Shear and Bending Stiffnesses. Composites Sci. Technol. 71, 683–692. doi:10.1016/j.compscitech.2011.01.011
Borouchaki, H., and Cherouat, A. (2002). Une nouvelle approche géométrique pour le drapage de structures composites. Revue des composites et des matériaux avancés 12, 407–421. doi:10.3166/rcma.12.407-421
Boubaker, B. B., Haussy, B., and Ganghoffer, J. F. (2007). Discrete Models of Woven Structures. Macroscopic Approach. Compos. B Eng. 38, 498–505. doi:10.1016/j.compositesb.2006.01.007
Bussetta, P., and Correia, N. (2018). Numerical Forming of Continuous Fibre Reinforced Composite Material: A Review. Composites Part A: Appl. Sci. Manufacturing 113, 12–31. doi:10.1016/j.compositesa.2018.07.010
Charmetant, A., Orliac, J. G., Vidal-Sallé, E., and Boisse, P. (2012). Hyperelastic Model for Large Deformation Analyses of 3D Interlock Composite Preforms. Composites Sci. Technol. 72, 1352–1360. doi:10.1016/j.compscitech.2012.05.006
Collotta, M., Solazzi, L., Pandini, S., and Tomasoni, G. (2018). New Design Concept of a Downhill Mountain Bike Frame Made of a Natural Composite Material. Proc. IMechE 232, 50–56. doi:10.1177/1754337117712422
d’Agostino, M. V., Giorgio, I., Greco, L., Madeo, A., and Boisse, P. (2015). Continuum and Discrete Models for Structures Including (Quasi-) Inextensible Elasticae with a View to the Design and Modeling of Composite Reinforcements. Int. J. Sol. Struct. 59, 1–17. doi:10.1016/j.ijsolstr.2014.12.014
Dahl, P. R. (1976). Solid Friction Damping of Mechanical Vibrations. AIAA J. 14, 1675–1682. doi:10.2514/3.61511
de Bilbao, E., Soulat, D., Hivet, G., and Gasser, A. (2010). Experimental Study of Bending Behaviour of Reinforcements. Exp. Mech. 50, 333–351. doi:10.1007/s11340-009-9234-9
Denis, Y., Guzman-Maldonado, E., Hamila, N., Colmars, J., and Morestin, F. (2018). A Dissipative Constitutive Model for Woven Composite Fabric under Large Strain. Composites Part A: Appl. Sci. Manufacturing 105, 165–179. doi:10.1016/j.compositesa.2017.11.018
Fleischmann, M., Ehemann, C., Kaufmann, J., and Cebulla, H. (2018). Optimization of Lightweight Axles for an Innovative Carving Skateboard Based on Carbon Fiber Placement. Proceedings 2 (6), 253. doi:10.3390/proceedings2060253
Gereke, T., Döbrich, O., Hübner, M., and Cherif, C. (2013). Experimental and Computational Composite Textile Reinforcement Forming: A Review. Composites Part A: Appl. Sci. Manufacturing 46, 1–10. doi:10.1016/j.compositesa.2012.10.004
Ghafour, T. A., Colmars, J., and Boisse, P. (2019). The Importance of Taking into Account Behavior Irreversibilities when Simulating the Forming of Textile Composite Reinforcements. Compos. Part. A. Appl. Sci. Manuf. 127, 105641. doi:10.1016/j.compositesa.2019.105641
Gong, Y., Peng, X., Yao, Y., and Guo, Z. (2016). An Anisotropic Hyperelastic Constitutive Model for Thermoplastic Woven Composite Prepregs. Composites Sci. Technol. 128, 17–24. doi:10.1016/j.compscitech.2016.03.005
Grosberg, P., and Kedia, S. (1966). The Mechanical Properties of Woven Fabrics. Textile Res. J. 36, 71–79. doi:10.1177/004051756603600109
Grosberg, P. (1966). The Mechanical Properties of Woven Fabrics Part Ii: the Bending of Woven Fabrics. Textile Res. J. 36, 205–211. doi:10.1177/004051756603600301
Hamila, N., Boisse, P., Sabourin, F., and Brunet, M. (2009). A Semi-discrete Shell Finite Element for Textile Composite Reinforcement Forming Simulation. Int. J. Numer. Meth. Engng. 79, 1443–1466. doi:10.1002/nme.2625
Hancock, S. G., and Potter, K. D. (2006). The Use of Kinematic Drape Modelling to Inform the Hand Lay-Up of Complex Composite Components Using Woven Reinforcements. Composites Part A: Appl. Sci. Manufacturing 37, 413–422. doi:10.1016/j.compositesa.2005.05.044
Harrison, P., Clifford, M. J., and Long, A. C. (2004). Shear Characterisation of Viscous Woven Textile Composites: a Comparison between Picture Frame and Bias Extension Experiments. Composites Sci. Technol. 64, 1453–1465. doi:10.1016/j.compscitech.2003.10.015
Hochard, C., Payan, J., and Montagnier, O. (2005). Design and Computation of Laminated Composite Structures. Composites Sci. Technol. 65, 467–474. doi:10.1016/j.compscitech.2004.09.013
Jin, L., Hu, H., Sun, B., and Gu, B. (2012). Three-point Bending Fatigue Behavior of 3D Angle-Interlock Woven Composite. J. Compos. Mater. 46, 883–894. doi:10.1177/0021998311412218
Kärger, L., Galkin, S., Zimmerling, C., Dörr, D., Linden, J., Oeckerath, A., et al. (2018). Forming Optimisation Embedded in a CAE Chain to Assess and Enhance the Structural Performance of Composite Components. Compos. Structures 192, 143–152. doi:10.1016/j.compstruct.2018.02.041
Kawabata, S. (1980). The Standardization and Analysis of Hand Evaluation. Osaka, Japan: The Textile Machinery Society Japan.
Khan, M. A., Mabrouki, T., Vidal-Sallé, E., and Boisse, P. (2010). Numerical and Experimental Analyses of Woven Composite Reinforcement Forming Using a Hypoelastic Behaviour. Application to the Double Dome Benchmark. J. Mater. Process. Technol. 210, 378–388. doi:10.1016/j.jmatprotec.2009.09.027
Krasnobrizha, A., Rozycki, P., Gornet, L., and Cosson, P. (2016). Hysteresis Behaviour Modelling of Woven Composite Using a Collaborative Elastoplastic Damage Model with Fractional Derivatives. Compos. Structures 158, 101–111. doi:10.1016/j.compstruct.2016.09.016
Lebrun, G., Bureau, M. N., and Denault, J. (2003). Evaluation of Bias-Extension and Picture-Frame Test Methods for the Measurement of Intraply Shear Properties of PP/glass Commingled Fabrics. Compos. Structures 61, 341–352. doi:10.1016/S0263-8223(03)00057-6
Lee, J.-M., Kim, B.-M., and Ko, D.-C. (2019). Development of Vacuum-Assisted Prepreg Compression Molding for Production of Automotive Roof Panels. Compos. Structures 213, 144–152. doi:10.1016/j.compstruct.2019.01.092
Liang, B., Hamila, N., Peillon, M., and Boisse, P. (2014). Analysis of Thermoplastic Prepreg Bending Stiffness during Manufacturing and of its Influence on Wrinkling Simulations. Composites Part A: Appl. Sci. Manufacturing 67, 111–122. doi:10.1016/j.compositesa.2014.08.020
Liu, Z., Lu, J., and Zhu, P. (2016). Lightweight Design of Automotive Composite Bumper System Using Modified Particle Swarm Optimizer. Compos. Structures 140, 630–643. doi:10.1016/j.compstruct.2015.12.031
Lomov, S. V., Verpoest, I., Barburski, M., and Laperre, J. (2003). Carbon Composites Based on Multiaxial Multiply Stitched Preforms. Part 2. KES-F Characterisation of the Deformability of the Preforms at Low Loads. Composites Part A: Appl. Sci. Manufacturing 34, 359–370. doi:10.1016/S1359-835X(03)00025-3
Mack, C., and Taylor, H. M. (1956). 39-The Fitting of Woven Cloth to Surfaces. J. Textile Inst. Trans. 47, T477–T488. doi:10.1080/19447027.1956.10750433
Mallach, A., Härtel, F., Heieck, F., Fuhr, J.-P., Middendorf, P., and Gude, M. (2017). Experimental Comparison of a Macroscopic Draping Simulation for Dry Non-crimp Fabric Preforming on a Complex Geometry by Means of Optical Measurement. J. Compos. Mater. 51, 2363–2375. doi:10.1177/0021998316670477
Mathieu, S., Hamila, N., Bouillon, F., and Boisse, P. (2015). Enhanced Modeling of 3D Composite Preform Deformations Taking into Account Local Fiber Bending Stiffness. Composites Sci. Technol. 117, 322–333. doi:10.1016/j.compscitech.2015.07.005
McIlhagger, A., Archer, E., and McIlhagger, R. (2020). Manufacturing Processes for Composite Materials and Components for Aerospace Applications. Polym. composites aerospace industry, 59–81. doi:10.1016/B978-0-08-102679-3.00003-4
Mitchell, C. J., Dangora, L. M., and Sherwood, J. A. (2016). Investigation into a Robust Finite Element Model for Composite Materials. Finite Elem. Anal. Des. 115, 1–8. doi:10.1016/j.finel.2016.02.003
Naouar, N., Vidal-Salle, E., Schneider, J., Maire, E., and Boisse, P. (2015). 3D Composite Reinforcement Meso F.E. Analyses Based on X-ray Computed Tomography. Compos. Structures 132, 1094–1104. doi:10.1016/j.compstruct.2015.07.005
Ngoc, C. N., Bruniaux, P., and Castelain, J. M. (2002). “Modeling Friction for Yarn/fabric Simulation Application to Bending Hysteresis,”. Editors A. Verbraeck, and W. Krug. Proceedings 14th European Simulation Symposium, October 2002, Dresden, Germany, (c) SCS Europe BVBA.
Pazmino, J., Carvelli, V., and Lomov, S. V. (2014). Formability of a Non-crimp 3D Orthogonal Weave E-Glass Composite Reinforcement. Composites Part A: Appl. Sci. Manufacturing 61, 76–83. doi:10.1016/j.compositesa.2014.02.004
Peirce, F. T. (1930). 26-The "Handle" of Cloth as a Measurable Quantity. J. Textile Inst. Trans. 21, T377–T416. doi:10.1080/19447023008661529
P. E. Irving, and C. Soutis in (2019).Polymer Composites in the Aerospace Industry (Cambridge: Woodhead Publishing).
Peng, X. Q., and Cao, J. (2005). A Continuum Mechanics-Based Non-orthogonal Constitutive Model for Woven Composite Fabrics. Composites Part A: Appl. Sci. Manufacturing 36, 859–874. doi:10.1016/j.compositesa.2004.08.008
Peng, X., and Rehman, Z. U. (2011). Textile Composite Double Dome Stamping Simulation Using a Non-orthogonal Constitutive Model. Composites Sci. Technol. 71, 1075–1081. doi:10.1016/j.compscitech.2011.03.010
Ropers, S., Kardos, M., and Osswald, T. A. (2016). A Thermo-Viscoelastic Approach for the Characterization and Modeling of the Bending Behavior of Thermoplastic Composites. Composites Part A: Appl. Sci. Manufacturing 90, 22–32. doi:10.1016/j.compositesa.2016.06.016
Rudd, C. D., and Long, A. C. (1997). Liquid Molding Technologies. Cambridge: Woodhead Pub. doi:10.1533/9781845695446
Sachs, U., and Akkerman, R. (2017). Viscoelastic Bending Model for Continuous Fiber-Reinforced Thermoplastic Composites in Melt. Composites Part A: Appl. Sci. Manufacturing 100, 333–341. doi:10.1016/j.compositesa.2017.05.032
Schindelin, J., Arganda-Carreras, I., Frise, E., Kaynig, V., Longair, M., Pietzsch, T., et al. (2012). Fiji: an Open-Source Platform for Biological-Image Analysis. Nat. Methods 9 (7), 676–682. doi:10.1038/nmeth.2019
Schirmaier, F. J., Dörr, D., Henning, F., and Kärger, L. (2017). A Macroscopic Approach to Simulate the Forming Behaviour of Stitched Unidirectional Non-crimp Fabrics (UD-NCF). Composites Part A: Appl. Sci. Manufacturing 102, 322–335. doi:10.1016/j.compositesa.2017.08.009
S. G. Advani, and K. T. Hsiao in (2012).Manufacturing Techniques for Polymer Matrix Composites (PMCs) (Cambridge: Elsevier).
Sze, K. Y., and Liu, X. H. (2005). A New Skeletal Model for Fabric Drapes. Int. J. Mech. Mater. Des. 2, 225–243. doi:10.1007/s10999-006-9004-0
Ten Thije, R. H. W., and Akkerman, R. (2009). A Multi-Layer Triangular Membrane Finite Element for the Forming Simulation of Laminated Composites. Composites Part A: Appl. Sci. Manufacturing 40, 739–753. doi:10.1016/j.compositesa.2009.03.004
Van Der Weeën, F. (1991). Algorithms for Draping Fabrics on Doubly-Curved Surfaces. Int. J. Numer. Meth. Engng. 31, 1415–1426. doi:10.1002/nme.1620310712
Walther, J., Simacek, P., and Advani, S. G. (2012). The Effect of Fabric and Fiber Tow Shear on Dual Scale Flow and Fiber Bundle Saturation during Liquid Molding of Textile Composites. Int. J. Mater. Form. 5, 83–97. doi:10.1007/s12289-011-1060-9
Keywords: textile composite reinforcements, forming process, finite element method, bending, inelastic behavior
Citation: Ghafour TA, Colmars J and Boisse P (2021) The Dahl’s Model for the Inelastic Bending Behavior of Textile Composite Preforms. Analysis of its Influence in Draping Simulation. Front. Mater. 8:728485. doi: 10.3389/fmats.2021.728485
Received: 21 June 2021; Accepted: 26 July 2021;
Published: 19 August 2021.
Edited by:
Yongqian Shi, Fuzhou University, ChinaReviewed by:
Gang Tang, Anhui University of Technology, ChinaChuyuan Huang, Wuhan University of Technology, China
Yujia He, Hunan University, China
Copyright © 2021 Ghafour, Colmars and Boisse. This is an open-access article distributed under the terms of the Creative Commons Attribution License (CC BY). The use, distribution or reproduction in other forums is permitted, provided the original author(s) and the copyright owner(s) are credited and that the original publication in this journal is cited, in accordance with accepted academic practice. No use, distribution or reproduction is permitted which does not comply with these terms.
*Correspondence: Théo A. Ghafour, dGhlby5naGFmb3VyQGlydC1tMnAuZnI=