 Gang Ma
 Hui Gao1*
 Chong Sun
94% of researchers rate our articles as excellent or good
Learn more about the work of our research integrity team to safeguard the quality of each article we publish.
Find out more
ORIGINAL RESEARCH article
Front. Mater. , 17 January 2022
Sec. Environmental Degradation of Materials
Volume 8 - 2021 | https://doi.org/10.3389/fmats.2021.723986
This article is part of the Research Topic Corrosion and Protection of Materials in the Oil & Gas Industry View all 6 articles
To detect the corrosion resistance of a friction stud welding (FSW) joint in simulated seawater (a 3.5 wt% NaCl solution), the pulse electrochemical deposition method was used for electroplating Ni coating with different duty ratios (50%, 80%, and 100%) on the surface of FSW joint. The microstructure and surface structure of the coating were observed by micro-spectroscopy and other characterization methods. The corrosion behavior of the coating was analyzed by means of macroscopic electrochemical testing. The local corrosion law of joint surface and coating surface defects were innovatively explored by using micro-zone electrochemical scanning system. The coating characterization results showed that, as the duty ratio continues to increase, the coating surface becomes denser and smoother, and the corrosion products such as Fe2O3, Fe3O4, and FeOOH are generated. The results of macroscopic electrochemical experiment indicated that the coating with 100% duty ratio has the lowest corrosion current density and the maximum polarization resistance. The scanning vibrating electrode technique results showed that the corrosion current density in the defect area is higher than that in the coating area, and the maximum corrosion current density decreases with the increase of duty ratio. The localized electrochemical impedance spectroscopy results indicated that the localized impedance at the welded zone was the largest, and with the increase of the pulse duty ratio, the impedance diffusion in the defect area was decreasing.
In recent years, with the development of offshore oil industry, the importance of underwater welding technology of steel structure in the submarine pipeline is becoming more and more prominent (Shen et al., 2019). The friction stud welding (FSW) method has many advantages (Yin et al., 2016; Ma et al., 2018), such as high efficiency, low material consumption, and non-pollution. Therefore, this method has been developing rapidly in the underwater application (Zhang et al., 2016). Many researchers have carried out a series of researches on the application of FSW technology in underwater junction (Nicholas, 1984; Gao et al., 2014), and this technology is gradually applied to the connection of less important comparatively structures such as sacrificial anode. In addition, the FSW equipment (Xu et al., 2015) and welding process (Gao et al., 2014) are researched by the Beijing Institute of Petrochemical Technology. However, the welded joint produced is very complex and is easy to be corroded (Gadala and Alfantazi, 2015), and it will seriously affect the service life and safety of engineering structural steel connections. Hence, it is urgent to study the anti-corrosion of the welded joint materials (Yi, 2019).
In industrial applications, coating protection is very important to prevent metals from being affected by the reaction environment (Nayak et al., 2013). Some scholars mainly focus on the preparation of coatings by electroless plating and electroplating methods (Mei and Jiang, 2015). However, the electroless plating can only be applied when its unique properties are required, and it is more expensive than electroplating (Wu et al., 2010; Yli-Pentti, 2014). For pulse electrochemical deposition, the corrosion resistance of the coating can be improved by adjusting pulse duty ratio, and the coating anti-corrosion is a very important way to ensure the integrity of the base metal (Lv et al., 2018). Some studies on the application of this electroplating have found that the morphology of Ni coating is compact when the duty ratio is 20% (Jing et al., 2017), the corrosion current density can be adjusted by changing the duty ratio (Lu et al., 2017), and the high pulse duty ratio can reduce the porosity of the coating (Kamaraj et al., 2017). On the basis of the above research, it can be seen that the duty ratio has a great influence on the application of pulse electrochemical deposition.
In the early stage, the research group focused on studying the corrosion behavior and corrosion resistance of FSW joint in the air. In addition, the corrosion resistance of welded joints is usually analyzed by the combination of macro electrochemical testing technology and characterization analysis. However, the traditional electrochemical measurement methods cannot be used to in-depth study the local corrosion. In recent years, the scanning vibrating electrode technique (SVET) testing technology is applied to the corrosion research of welded joint. Bertoncello et al. (2015) found that the heat-affected zone near AA2024 is the most prone area to intergranular corrosion. Wang et al. (2012) reported that the current density of base metal decreases gradually with the increase of distance from the heat-affected zone. Besides, the localized electrochemical impedance spectroscopy (LEIS) has also been widely used to study the local corrosion behavior of the coatings and metal substrates (Upadhyay and Battocchi, 2016). Sidane et al. (2015) studied the local corrosion behavior of friction stir welding joint by using LEIS technology, so as to better solve the regional corrosion problem of the joint. Ma et al. (2018) pointed out that there are the largest impedance in the welded zone (WZ) compared with other zones, thus showing the excellent corrosion resistance in the WZ. Nevertheless, the research on the local corrosion behavior of the underwater FSW joints by these two testing techniques has not been reported. Studies have shown that Ni can improve the corrosion resistance of matrix (Deshpande, 2010), and it has antioxidant properties and can promote the formation of stable phase FeOOH, which can better promote the contact between metal matrix and corrosion layer and weaken pitting corrosion (Hu et al., 2012; Zhou et al., 2015). Therefore, the underwater corrosion resistance of Ni electrodeposited on FSW joint of X65 steel was studied in this paper. The findings may provide a new idea to solve the corrosion problem of FSW joint in seawater environment and put forward the corresponding anti-corrosion measures.
In this study, the underwater FSW technology was used to weld two materials (16Mn steel and X65 steel) to obtain the welding specimen (as shown in Figure 1A), and then, the wire cutting was carried out from the middle part of the obtained specimen to prepare the welded joint. X65 steel and 16Mn steel are the welding base metal and stud materials, respectively. The mass percent of chemical compositions are shown in Table 1. The welded sample should retain the stud zone (SZ), upper–heat-affected zone (U-HAZ, near the SZ), WZ, lower–heat-affected zone (L-HAZ, near the BMZ), and base metal zone (BMZ). To illustrate each zone of the specimen more clearly, the surface of welded joint was etched with 4% nitric acid alcohol solution, and the samples were successively polished on various grade SiC papers up to 1200 grit finish. After polishing, the samples were degreased by ultrasonic, rinsed, dehydrated, and dried. The observed cross-sectional photograph of the FSW joint was shown in Figure 1B.
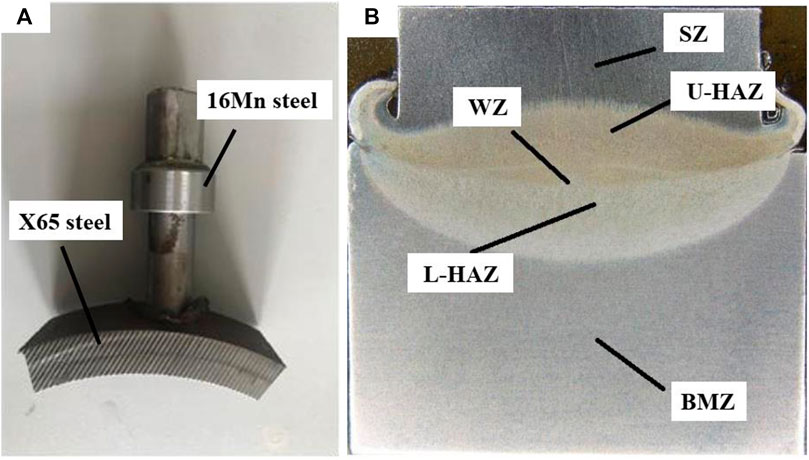
FIGURE 1. FSW weldment (A) and joint cross-sectional morphology (B).

TABLE 1. Chemical compositions (wt%) of X65 steel and 16Mn steel.
The configuration compositions (dosage/g) of electroplating solution are shown as follows (g): nickel sulfate hexahydrate (NiSO4·6H2O, 35); sodium chloride (NaCl, 2); boric acid (H3BO3, 6); anhydrous sodium sulfate (Na2SO4, 10); and sodium dodecyl sulfate (C12H25SO4Na, 0.012). The prepared electroplating solution (pH 7.2) was put into a heater with a temperature of 35°C. Then, the Zahner electrochemical workstation (IM6, Germany) was turned on, and the pulse electroplating was carried out by three electrodes. Ni sheet (50 × 20 × 3 mm) was used as a working electrode (WE, anode material), a saturated calomel electrode (SCE) was the reference electrode (RE), and the welded joint (20 × 20 × 10 mm3) was the counter electrode (CE). The parameters of the pulse interface are as follows: take 250 ms as a cycle, the current density was 10 mA/cm2, the electroplating time was 60 min, and the duty ratios were set at 50%, 80%, and 100%. The above methods were used for electroplating to obtain three Ni coating parts with different duty ratios, and the label of each coating sample was put into the sealed bag for standby.
To investigate the macroscopic morphology and the microstructure of the welding sample before immersion and 24 h after corrosion, an inverted metallographic microscopy (Nikon, ECLIPSE, MA200) and SEM test instrument (HITACHI, S4800) were employed, and the element composition was measured by EDS. In addition, the hardness of the FSW sample in different areas was tested with a micro-hardness tester (AHM-6L, ARCHIMEDES). To detect the microstructure phase composition of the sample and analyze the elemental composition of the corrosion products, the XRD (D8 advance, Germany) was used to test (parameters: grazing incidence angle 2°, diffraction angle 10°–80°, and scanning speed 5°/min). Through the comprehensive analysis of the above characterization results, the main corrosion products are finally defined, and the corresponding experimental conclusions are obtained.
The joint sample and Ni coating samples (10 × 10 mm) were used as WE, respectively. The RE was SCE, and the CE was a platinum grid (15 × 15 mm). The experiment samples of different groups were immersed for 0.5 and 24 h. Then, the electrochemical experiments were carried out by using the VersaSTAT 3F electrochemical workstation (AMETEK, USA). Among them, the electrochemical experiments mainly include open-circuit potential (OCP), electrochemical impedance spectroscopy (EIS), and potentiodynamic polarization (PDP) curve. After the OCP value was stabilized for 30 min, the EIS and PDP curve of each sample immersed for 0.5 and 24 h were measured. The experimental parameters are listed as follows: OCP: the scanning time of each point was 1 s, the scanning duration was 1,800 s, the current range was 0–2 mA, and the voltage range was ±6 V; EIS: the start frequency was 100 kHz, the end frequency was 0.01 Hz, and the sine wave signal amplitude was 10 mV; PDP: the initial potential was −0.5 V, the final potential was 0.5 V, the step height was 1 mV, and the scanning rate was 0.5 mV/s.
The traditional electrochemical methods are difficult to obtain the local corrosion information. Thus, the SVET and LEIS measurement were taken using a VersaSCAN electrochemical scanning system (AMETEK, USA). The welded joint and coating samples with defects were used as WE, and a SCE and a round platinum ring electrode were used as the RE and CE, respectively.
In the experiment, the scanning microprobe worked at a fixed frequency of 10 Hz, and the distance between the tip of the probe and the surface of the sample was about 100 μm. The parameters of SVET experiment are as follows: the scanning area was as 3 × 6 mm, the step size in the X and Y directions was set to 200 μm/s, and the measuring speed and probe moving speed were 500 and 1,000 μm/s. During the LEIS measurements, a 10-mV AC disturbance signal was applied to the sample surface, and other experimental parameters were set in accordance with SVET. The test scanning probe and area were shown in Figure 2.
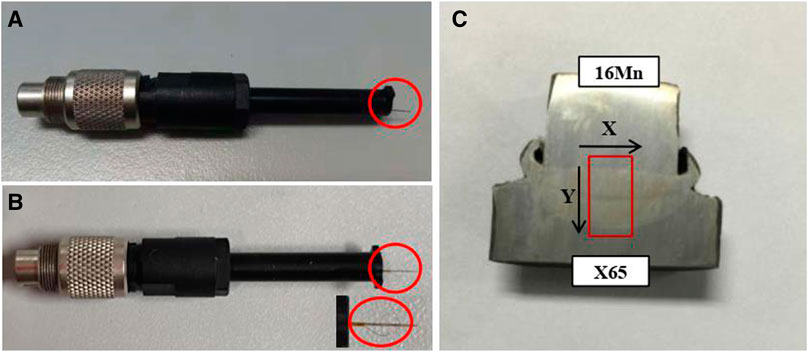
FIGURE 2. Micro-zone electrochemical scanning probe [(A) SVET probe and (B) LEIS probe] and scanning area (C).
Figure 3 shows the metallographic images of SZ, U-HAZ, WZ, L-HAZ, and BMZ after treatment with 4% alcohol nitrate solution before FSW joint immersion.
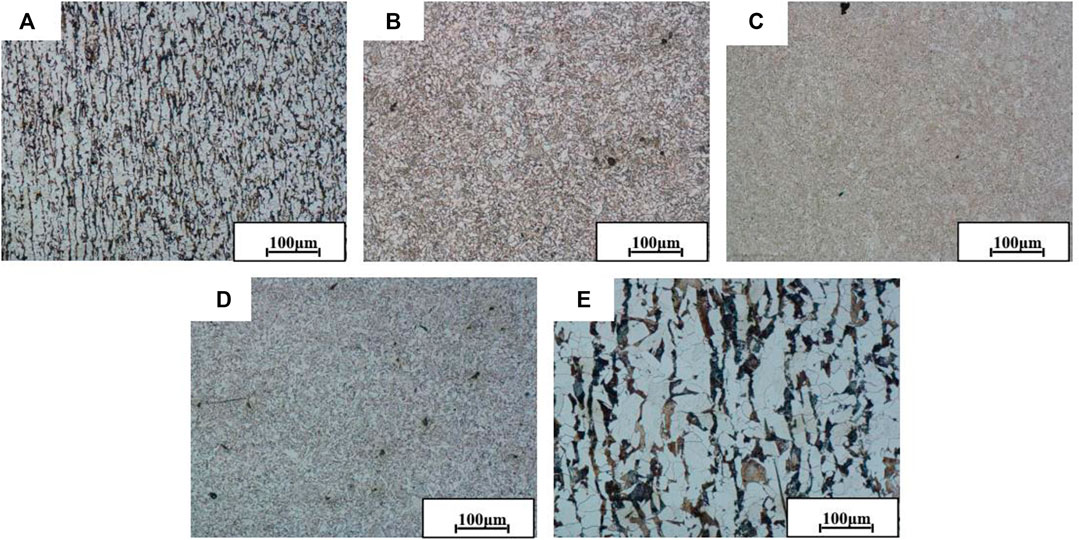
FIGURE 3. Metallographic images of FSW joint at different zones [(A) stud zone (SZ), (B) upper–heat-affected zone (U-HAZ), (C) welded zone (WZ), (D) lower–heat-affected zone (L-HAZ), and (E) base metal zone (BMZ)].
It can be seen from the figure that the grain sizes of different zones from small to large are WZ < HAZ < SZ < BMZ. Figures 3A,E show the metallographic structures of SZ and BMZ. The results show that they have typical microstructure characteristics composed of block wide ferrite and black brown pearlite in a strip. The research shows that the grain size of BMZ is larger than SZ, which may be due to the fact the SZ is affected by the input heat, axial pressure, and agitation to obtain a smaller structure (Costa et al., 2014). Figures 3B,D show the metallographic images of HAZ near the stud and base material. The grain sizes of the two zones are obviously smaller than SZ and BMZ but larger than WZ (as shown in Figure 3C). It is found that the distribution of friction heat is affected by the increasing friction velocity from the outside to the center, which will cause the heat input at the outer edge to be lower than that at the center of WZ, making the heat of WZ more concentrated (Li et al., 2015). Because of WZ is affected by concentrated high heat input, the phenomenon of overheating occurs. This enhances the bonding force between the crystals, resulting in smaller and closer grains in this region (Xie et al., 2011). The microstructure of different regions of welded joint will cause different corrosion resistance, and this part is essential for in-depth study of corrosion resistance of different regions of welded joint.
The hardness values of 10 equidistant points were measured on each line (HV1, HV2, and HV3), revealing the micro-hardness distribution from the SZ to U-HAZ, WZ, L-HAZ, and BMZ, and the results were shown in Figure 4. From the analysis of the test results, the hardness value of SZ was relatively stable, whereas the hardness value of BMZ was higher than SZ. According to the analysis, the hardness value of SZ is basically unchanged due to the fact that heat input obtained by SZ is greater than BMZ (Bousquet et al., 2011).
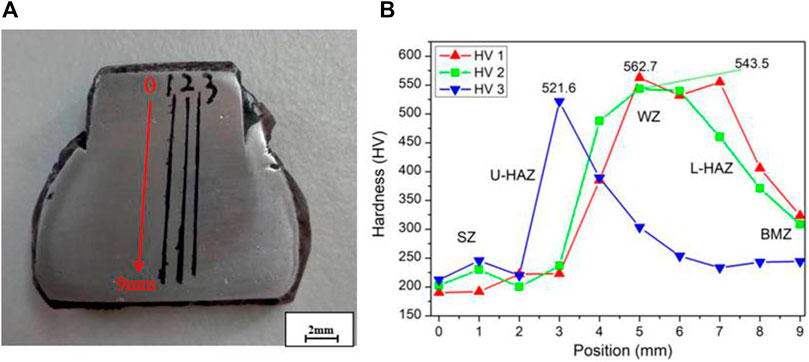
FIGURE 4. Position (A) and result (B) of micro-hardness test for FSW joint.
From SZ to U-HAZ, the hardness value increases continuously and then reaches the peak value (562.7, 543.5, and 521.6 HV) at the central WZ. It can also be seen from Figure 4 that the changing trend of U-HAZ hardness value is steeper than the decreasing trend of L-HAZ hardness value. In the HAZ near BMZ, the decrease of micro-hardness is attributed to the increase of grain size due to the absorption of heat input by solution cooling (Ma et al., 2018). In addition, SZ generates higher heat during rotation, which increases the local temperature of the material surface. The high temperature is sufficient to cause plastic deformation of the material, and then, the material is compressed to connect SZ and BMZ (Chen et al., 2015). Therefore, the hardness of HAZ decreases because of the small stress caused by the axial force extrusion. The results showed that the hardness of BMZ is higher than SZ, and the micro-hardness of WZ is the highest and gradually decreases from the center to the edge.
Figures 5A–C show the SEM images of the Ni coating surface with a duty ratio of 50%, 80%, and 100%. By comparing SEM results, it can be seen that the surface microstructure of the three samples is relatively dense. It shows that the coating has a good bonding effect with the surface of the joint substrate, and the coating is not separated from the substrate. As the duty ratio continues to increase, the surface microstructure becomes more even. Moreover, the surface of the coating with a duty ratio of 100% is relatively smooth compared with the other two coating samples.
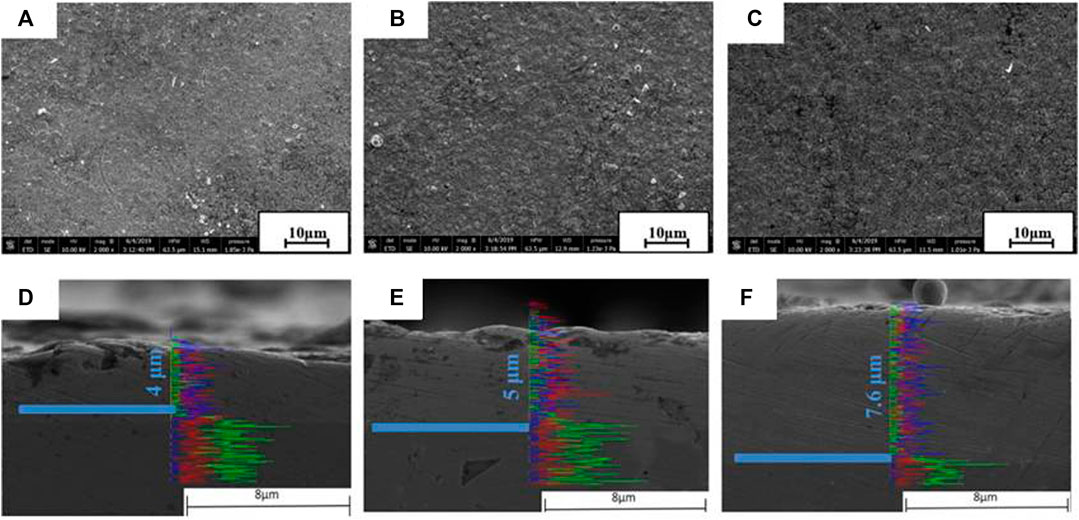
FIGURE 5. Surface and cross-sectional morphology of Ni coatings in the different duty ratios [50% (A/D); 80% (B/E); 100% (C/F)] before corrosion.
To analyze the thickness of the coating under three duty ratios, the SEM morphology of the coating was observed, as shown in Figures 5D–F. It can also be seen that the coating thickness increases with the increase of duty ratio, and the Ni coating samples with a duty ratio of 50%, 80%, and 100% are 4, 5, and 7.6 microns thick, respectively. This indicates that the coating has the best preparation effect under the duty ratio of 100%. The interface between the matrix and the Ni layer was shown by a blue thick solid line.
Figure 6 shows the OCP measured by welded joint and Ni coating samples with different duty ratios after being immersed for 0.5 and 24 h. As the experiment went on, the OCP of samples in different immersion states tended to be stable. To ensure the stability of the test system, the OCP value at 1,800 s can be used for comparison as the OCP is almost stable in 1,800 s.
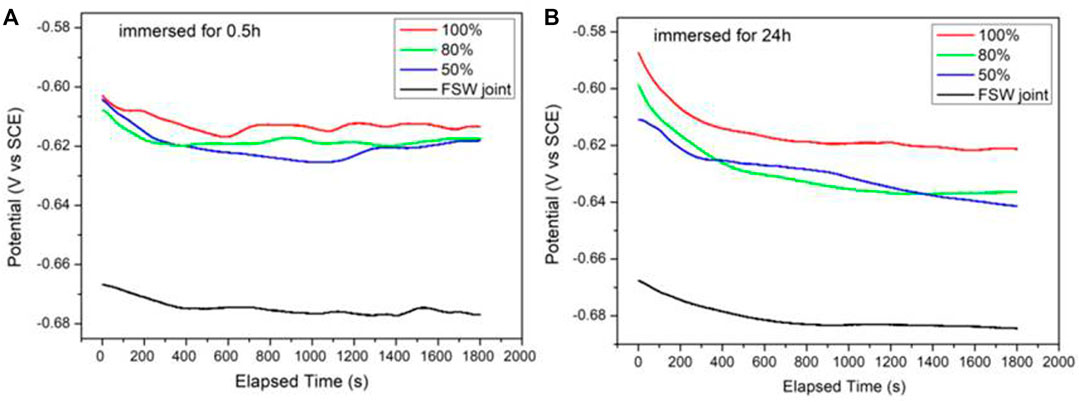
FIGURE 6. Changes of the OCPs for FSW joint and Ni coatings immersed for 0.5 h (A) and 24 h (B) in simulated seawater.
The OCP values measured by each sample at different immersion times were listed in Table 2. It can be seen that there is only a difference of 50–60 mV between FSW joint and Ni-coated samples, and as the duty ratio continues to increase, the OCP of three Ni coating samples moved forward slightly. The increase and decrease of OCP cannot explain the strength of corrosion resistance but can only serve as a sign of system stability. Combined with Figures 6A,B, it can be seen that after 24-h immersion, the OCP of the four samples move in a negative direction as a whole but did not change much.

TABLE 2. OCP of the samples immersed in simulated seawater for 0.5 and 24 h (mV).
Figure 7 shows the Nyquist spectra of each sample after being immersed for 0.5 and 24 h. The change of the arc radius of Nyquist’s capacitive reactance reflected the change of charge transfer resistance. Studies have shown that the larger the arc radius of Nyquist’s capacitive reactance, the better the corrosion resistance (Xiang et al., 2014; Zhang et al., 2014). As shown in Figure 7, the capacitive reactance arc radius of the welded joint is the smallest, which means the smallest charge transfer resistance, strong electrode reaction, and serious corrosion. For the three samples with Ni coating, as the duty ratio continues to increase, the arc radius of the capacitive reactance is increasing, indicating the fact that the charge transfer resistance is increasing and the corrosion resistance is improving. Combined with Figures 7A,B, the capacitive arc radius of FSW joint increases, which indicates that the charge transfer resistance increases with the extension of immersion time. It is found that the above results may be related to the formation of corrosion product film on the sample surface during the immersion process (Liu et al., 2014).
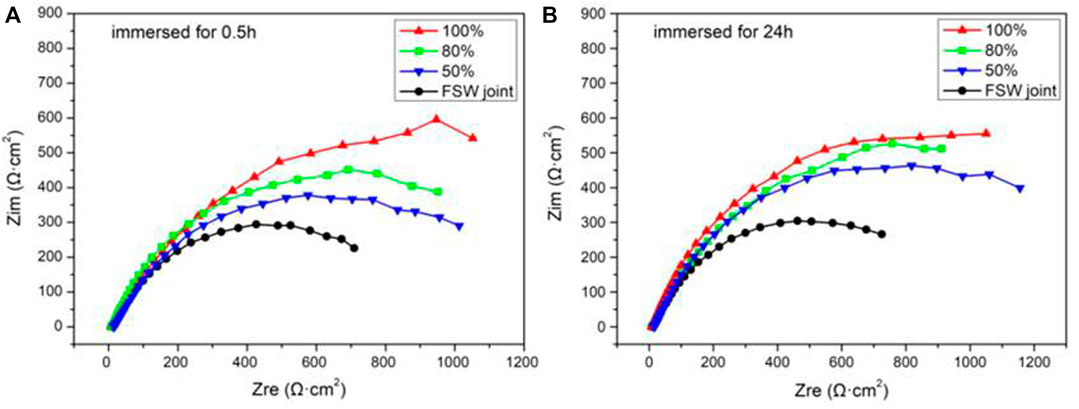
FIGURE 7. Nyquist plots of FSW joint and Ni coatings immersed for 0.5 h (A) and 24 h (B) in simulated seawater.
Figure 8 shows the Bode diagrams of each sample after being immersed for 0.5 and 24 h. It can be seen from Figure 8A that the low-frequency impedance value of the FSW joint is the minimum after 0.5-h immersion, indicating that the joint has the poor corrosion resistance. For the three samples with Ni coating, as the duty ratio continues to increase, the low-frequency impedance value at 0.01 Hz also increases, indicating that the corrosion resistance of the coating was constantly improved. After immersion for 0.5 and 24 h, the impedance modulus at 0.01 Hz of the coating with 100% duty ratio is about 1222.52 and 1183.24 Ω cm2. In combination with Figures 8A,B, the impedance value at 0.01 Hz of the sample decreases on the whole with the extension of immersion time.
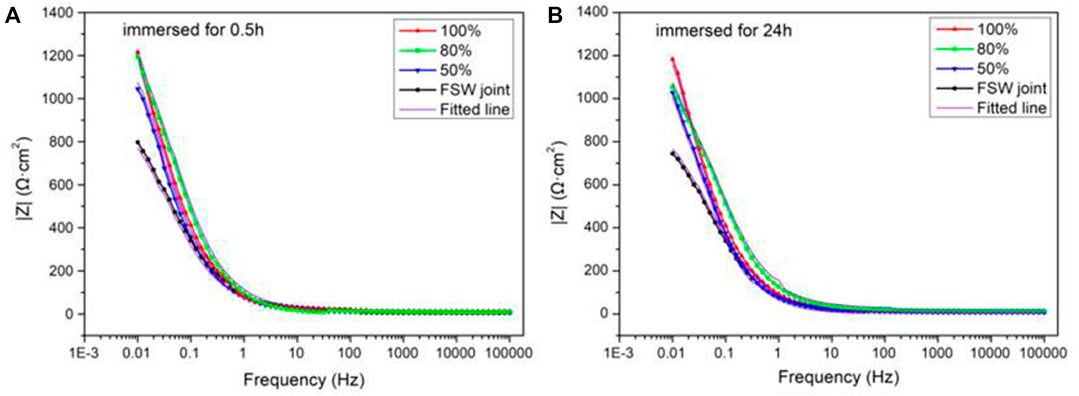
FIGURE 8. Bode plots of FSW joint and Ni coatings immersed for 0.5 h (A) and 24 h (B) in simulated seawater.
The electrochemical corrosion test system can be regarded as an equivalent circuit composed of basic electrochemical components such as resistance and capacitance and can be used to quantitatively analyze the impedance value of each component. In this experiment, ZMAN fitting software was used to analyze the experimental data in Bode diagram. The impedance mode values of FSW joints and coatings with different duty ratios after being immersed for 0.5 and 24 h were fitted with Rs—(Rm|Q1)—(Rct|Q2) (Figure 9A) and Rs—{Rnic|[Q1—(Rct|Q2)]} equivalent circuit (Figure 9B), respectively. Rs represents the solution resistance in the reaction, Rm is the resistance of the corrosion product film formed on the surface of the joint, Rct represents the charge transfer resistance in the reaction, Q1 and Q2 are constant phase angle elements, and Rnic is the resistance of Ni coating.
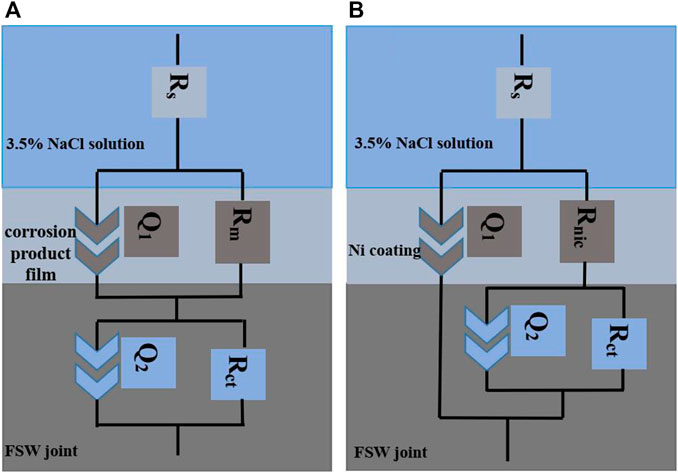
FIGURE 9. Equivalent circuit diagrams [(A) FSW joint and (B) Ni coating with different duty ratios].
Electrochemical impedance fitting parameters are shown in Table 3. According to the data in Table 3, after being immersed for 0.5 h, the polarization resistance (Rnic + Rct) of the sample with 100% duty ratio reached the maximum value of 1,200 Ω cm2, and the polarization resistance (Rm + Rct) of FSW joint reached to a minimum value of 800 Ω cm2. As the immersion time increases, after being immersed for 24 h, the polarization resistance values of samples were 800, 1,000, 1,100 and 1,200 Ω cm2, respectively. It can be seen that the polarization resistance value of the sample is decreased compared with the sample immersed for 0.5 h, indicating that the corrosion rate of the sample surface increases. With the increase of duty ratio, the polarization resistance of each coating sample increases at any immersion time, which indicates that the corrosion resistance of the sample improves with the increase of duty ratio.
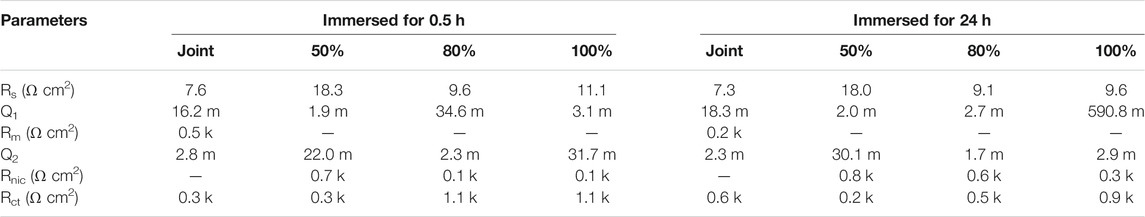
TABLE 3. The fitting impedance parameters of samples after 0.5- and 24-h immersion in simulated seawater.
Figures 10A,B show the polarization curves of each sample after immersion for 0.5 and 24 h. The range of PDP test was set from −500 to +500 mV (vs. SCE), and the scanning rate was 0.5 mV/s. After the polarization curve test completed, Tafel fitting was performed, and the fitting results were shown in Table 4.
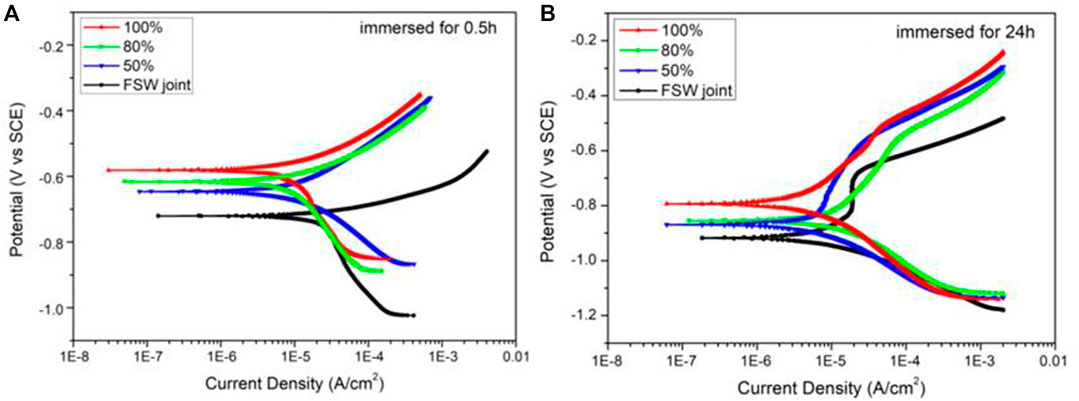
FIGURE 10. PDP for FSW joint and Ni coatings immersed for 0.5 h (A) and immersed for 24 h (B) in simulated seawater.
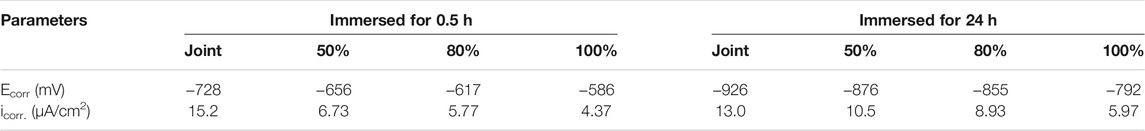
TABLE 4. The fitting results of the potentiodynamic polarization curve.
As shown in Table 4, the corrosion potential of the four kinds of samples changed from −728 to −586 mV after 0.5-h immersion. With the increase of duty ratio, the corresponding corrosion potential value of the three samples with Ni coating keeps moving forward, and the corrosion current density keeps decreasing, indicating that the corrosion resistance is continuously enhancing (Wang et al., 2017). After being immersed for 24 h, the corrosion potential of the samples changed from −926 to −792 mV, and the reaction corrosion rule was similar to that after immersion for 0.5 h. Combined with the immersion conditions of 0.5 and 24 h, it can be seen that the corrosion potential of Ni-coated samples moves negatively and the corresponding corrosion current density increases. It shows that the corrosion resistance decreases with the extension of immersion time. In addition, the corrosion current density of FSW joint changed from 15.2 to 13.0 μA/cm2 after being immersed for 24 h. Studies have shown that may be because the corrosion product film generated on the surface of the joint specimen hinders the corrosion reaction, thus reducing the corrosion current density (Liu et al., 2015; Li et al., 2016).
Corrosion failure usually starts from the defective part of the coating, and the corrosion pits formed become the source of fatigue cracks (Wang et al., 2018). The coating plays a protective role on the surface of pipeline steel joint, but in the actual service process, the welded joint and surface coating will also inevitably produce defects due to mechanical damage such as friction and collision (Bordbar et al., 2013), which seriously affects the service life and safety of engineering structural steel connections. Thus, the local corrosion behavior of the coating with defects on the surface of welded joint was studied by using the local electrochemical testing system.
Figure 11 shows the SVET scan map of the welded joint and the surface defects of coatings with different duty ratios in a 3.5 wt% NaCl solution, and the area composed of X-axis and Y-axis represents the scanning range (3 × 6 mm) of the welded sample. In this experiment, five areas of the joint (WZ is near the central area) should be contained in the longitudinal Y direction. By artificially creating scratch defects on the surface of the coating, the distribution of corrosion current density on the exposed parts was analyzed, so as to explore the corrosion resistance of the coating surface under different duty ratios. The value of corrosion current density is represented by different color areas. The red area represents the highest value, and the black area represents the lowest value.
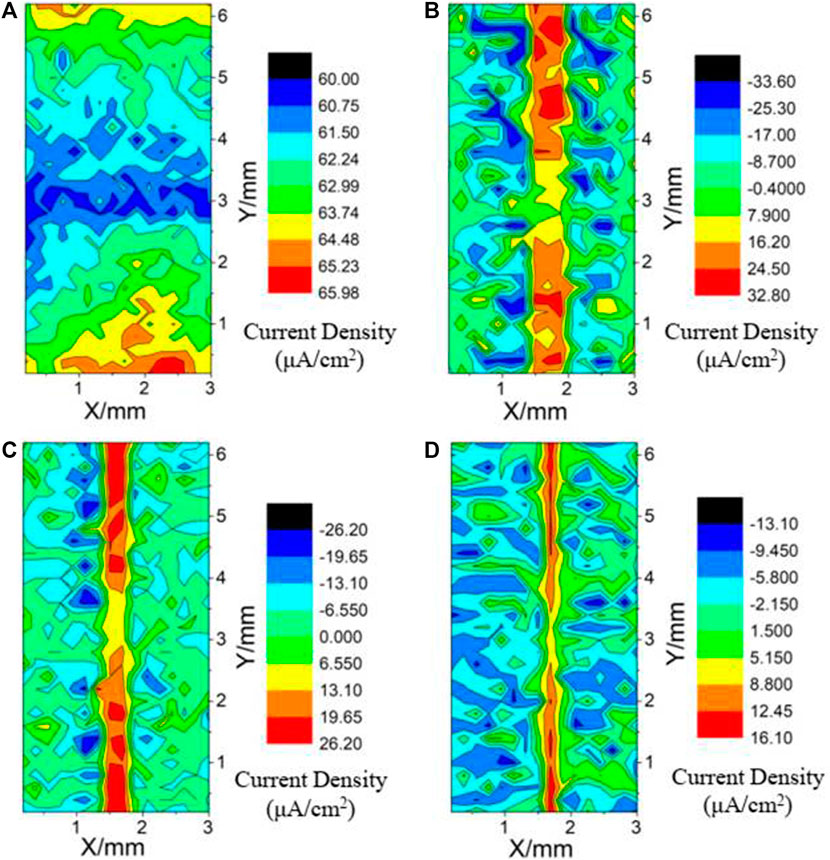
FIGURE 11. SVET maps of samples after immersion in a 3.5 wt% NaCl solution [(A) FSW joint; (B) 50% duty ratio; (C) 80% duty ratio; (D) 100% duty ratio].
As shown in Figure 11A, along the Y-axis starting point (SZ position), it can be seen that there are two almost the same corrosion current density peak areas (approximately 65.98 μA/cm2) in the SZ and BMZ. With the increase of the distance from SZ to BMZ, the corrosion current density decreases and then increases, and the minimum value of WZ is about 60 μA/cm2. It shows that the WZ has better corrosion resistance after welding.
It can also be seen from Figures 11B–D that the corrosion current density of coating defect area is higher than that of coating area on both sides under different duty ratios. With the increase of duty ratio, the maximum corrosion current density (from 32.80 and 26.20 to 16.10 μA/cm2) at the scratch gradually decreases, which indicates that the corrosion resistance of the joint sample is improved by the protective effect of the coating. As shown from the above maps, with the increase of duty ratio, the higher points of scratch area extending to both sides of the coating are less and less. This means that the diffusion degree of coating surface defects is decreasing.
The LEIS test method is improved on the basis of the original macroscopic EIS test, which makes the data acquisition more accurate. To better detect the localized impedance distribution of the FSW joint and its coating surface defects, the LEIS method was taken by moving the probe from the SZ to the BMZ.
Figure 12 shows the LEIS scan map of the welded joint and the surface defects of coatings with different duty ratios in a 3.5 wt% NaCl solution. In this part of the test, the scanning area range of the sample is consistent with that of SVET, and the Z-axis represents the impedance value. The ordinate in Figure 12 represents the local impedance, and the higher the value, the better the corrosion resistance of the sample surface.
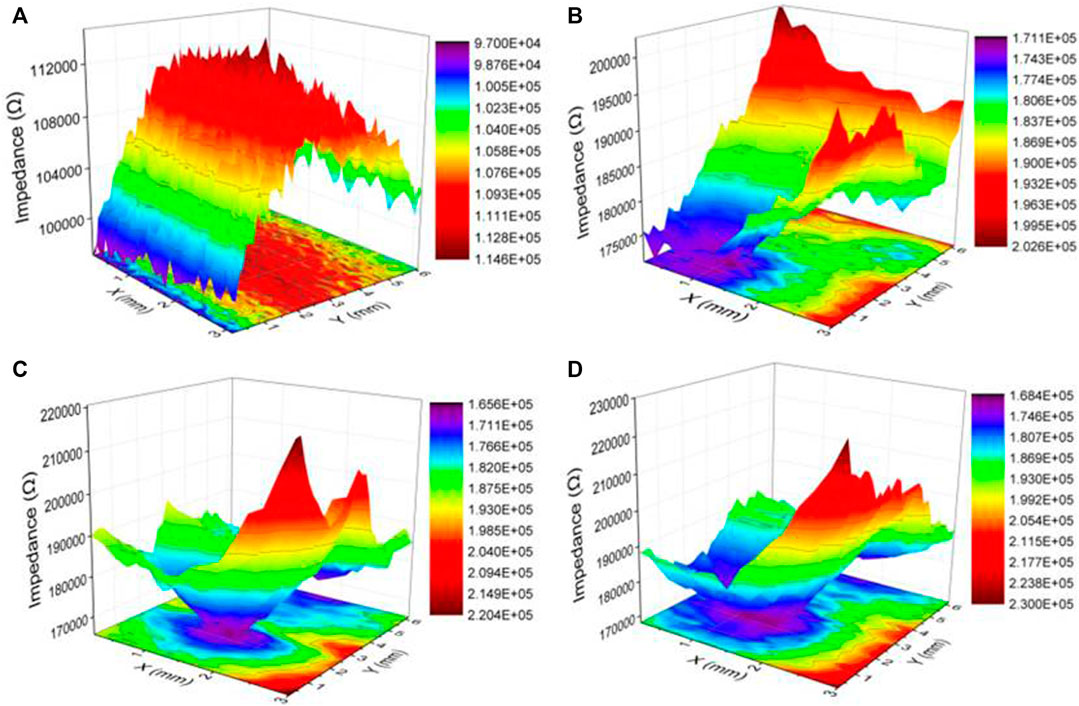
FIGURE 12. LEIS maps of samples after immersion in a 3.5 wt% NaCl solution [(A) FSW joint; (B) 50% duty ratio; (C) 80% duty ratio; (D) 100% duty ratio].
As can be seen from the two-dimensional (2D) map in Figure 12A, the maximum value of impedance (about 114 kΩ) is found in the central WZ. As shown in the 3D map from the SZ to the BMZ, the impedance value first increases and then decreases, and it indicates that the corrosion resistance of WZ is the best in all areas of the welded joint. The 2D maps in Figures 12B–D show that the impedance distribution in the coating area is higher than the defect area, which shows that the Ni coating has a good protective effect on the substrate. With the increase of duty ratio, the corresponding maximum impedance value increases (the 3D maps, from 202 and 220 to 230 kΩ), which shows that the corrosion resistance of the coating is improving. In addition, after the exposed substrate at the defect reacts with the corrosion solution to produce a corrosion diffusion point, the surrounding area around the point will also be corroded, and the corrosion degree of the defect parts gradually slows down during the reaction process.
The welded joint sample after the LEIS test was processed, and then, the metallographic structure of each area was observed and analyzed.
It can be seen from Figure 13A that plenty of corrosion pits appeared in the SZ, which is the most serious local corrosion among all the areas. Figures 13B,D show the metallographic images of HAZ near the stud and base material. It can be seen that the corrosion degree of HAZ is more serious than WZ (as shown in Figure 13C) but much better than BMZ and SZ, and the morphology of leaf fragments could be roughly distinguished in the WZ. It can also be seen that the grain size of BMZ is coarser than that of WZ, and it is possible because the base material is squeezed by the axial stud in the process of welding, resulting in more heat input generated by friction (Moon et al., 2013). It is found that grain refinement may be helpful in improving corrosion resistance (Sarlak et al., 2015), and the analysis shows that the WZ has good corrosion resistance due to the denser microstructure produced by the friction heat, the squeezing action, and the axial force (Ma et al., 2018).
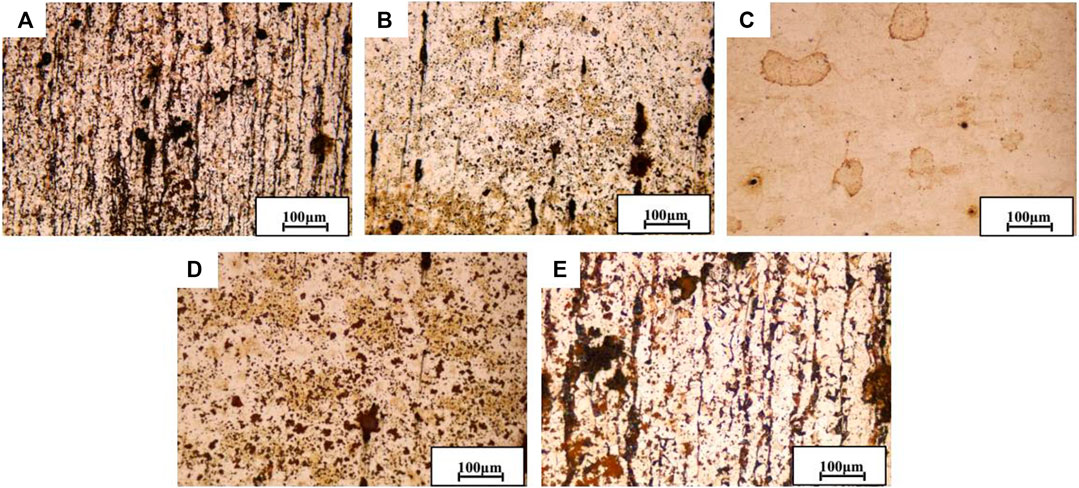
FIGURE 13. Metallographic images of FSW joint after 24-h immersion in simulated seawater at different areas [(A) SZ; (B) U-HAZ; (C) WZ; (D) L-HAZ; (E) BMZ].
Figures 14A–D are SEM images of the surface of FSW joints and Ni coating samples with a duty ratio of 50%, 80%, and 100%, respectively, as well as Figures 14E,F are EDS elements on FSW joints and Ni coating surfaces. As shown in Figure 14A, the polyphasic structures of numerous small islands are distributed between the large lumps and strips of tissue. There are lots of corrosion pits in the surface of welded joint, and some corrosion products have fallen off or formed a corrosion layer.
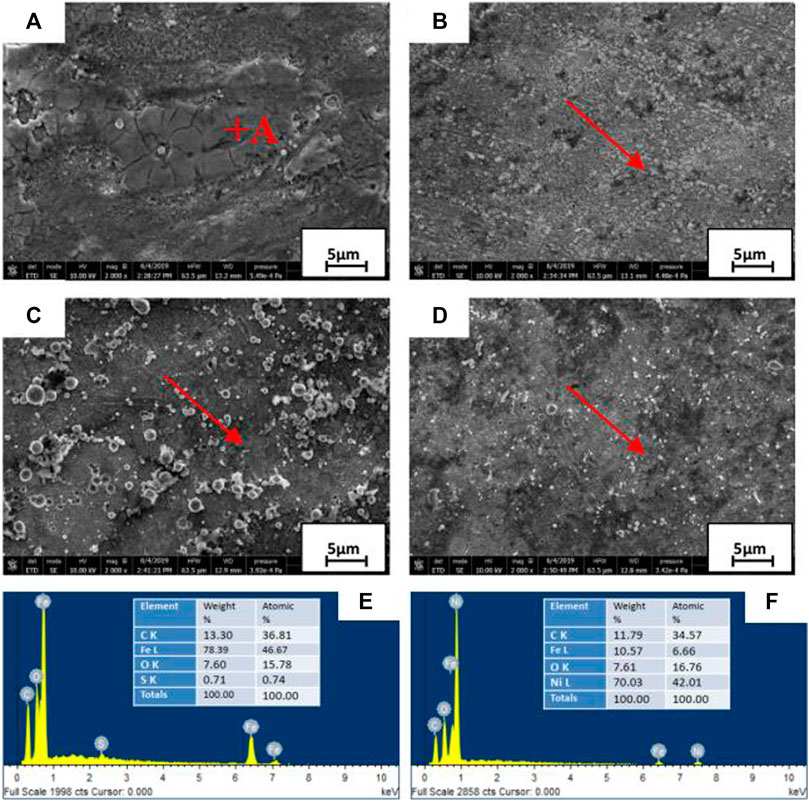
FIGURE 14. SEM and EDS of FSW joint (A), Ni coatings [50% duty ratio (B); 80% duty ratio (C); 100% duty ratio (D)], and EDS elements [FSW joints (E); Ni coating surfaces (F)] after 24-h immersion in simulated seawater.
Point scanning sampling is carried out in the direction of the arrow in Figures 14B–D. By comparing the SEM results of Ni coating samples with three different duty ratios, it can be seen that as the duty ratio continues to increase, the coating surface becomes denser and smoother, and the distribution of corrosion pits and cracks gradually becomes even. Some studies have shown that the pits exist in the product layer generated on the surface of pipeline steel after corrosion (Meng et al., 2008; Cheng et al., 2017), the surface corrosion pits develop rapidly and many cracks are generated in the pits, and, finally, stress corrosion cracking occurs (Jie et al., 2017).
As shown in Figure 14E, the surface of the FSW joint without Ni coating has relatively loose corrosion products. Conduct EDS analysis on it (point A in Figure 14A), and the composition is shown in Figure 14E. The EDS results show that the corrosion products are mainly composed of Fe, C, O, S, and Ni elements, and it is speculated that the corresponding corrosion products are iron oxides such as Fe2O3, Fe3O4, and FeOOH (Eliyan and Alfantazi, 2014; Yang et al., 2019). The test results show that the trace elements such as S were mainly from 16Mn steel matrix. Figure 14F shows that the surface of three coatings after corrosion for 24 h contains C, and it is conjectured that carbon may come from an organic contaminant in the electrolyte, such as oil contacted by the sample surface during machining.
To better determine the corrosion products, XRD test was carried out for further analysis. Figure 15 shows the XRD spectra of FSW joints and three Ni coating samples with different duty ratios after 24-h immersion. The diffraction peaks are mainly assigned to FeOOH, Fe3O4, and Fe2O3. Moreover, even if the duty ratio is different at the same position, the position of the product peak is basically the same, indicating that the duty ratio will not change the corrosion mechanism of the coating in the same immersion system. With the increase of immersion time, the loose corrosion product FeOOH was formed after the corrosion reaction was complete. The experimental results combined with EDS analysis show that the corrosion products were mainly Fe2O3, Fe3O4, and FeOOH (Eliyan and Alfantazi, 2014; Rogowska et al., 2016). Through analysis, the possible reactions on the sample surface are as follows:
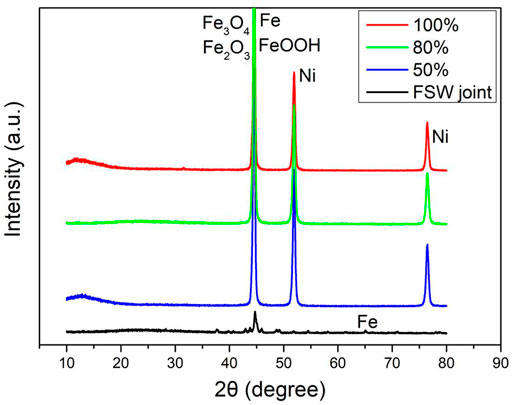
FIGURE 15. XRD analysis of the samples after immersion in simulated seawater for 24 h.
(1) For the three Ni coatings with different duty ratios, as the duty ratio continues to increase, the coating surface is more uniform and denser. The thickness of the coating has also increased, with Ni coating samples a duty ratio of 50%, 80%, and 100% are 4, 5, and 7.6 microns thick. With the extension of immersion time, the EDS results show that the corrosion products are mainly composed of Fe, C, O, S, and Ni elements.
(2) After being immersed for 24 h, the coating sample (100% duty ratio) has the lowest corrosion current density (5.97 μA/cm2) and the maximum polarization resistance (1,200 Ω cm2), so it can be seen that the Ni coating with the maximum duty ratio may effectively improve the corrosion resistance of the joint specimen, among which the sample with a duty ratio of 100% has the excellent corrosion resistance.
(3) The coating with 100% duty ratio has the minimum corrosion current density (about 16.10 μA/cm2) and the maximum impedance (about 230 kΩ). The micro area electrochemical test shows that the impedance value of the coating area is significantly higher than the scratch defect area, and the corrosion current density is lower than the scratch area.
The raw data supporting the conclusion of this article will be made available by the authors, without undue reservation.
GM: conceptualization and writing—original draft. HG: writing—visualization, editing, and funding. CS: writing—review and formal analysis validation. YG: supervision. JZ: resources. ZF: editing.
This work was supported by the Beijing Municipal Natural Science Foundation (grant number 3192013) and the Important Scientific Research Achievements Cultivation Project of Beijing Institute of Petrochemical Technology (grant number PCF-011).
The authors declare that the research was conducted in the absence of any commercial or financial relationships that could be construed as a potential conflict of interest.
All claims expressed in this article are solely those of the authors and do not necessarily represent those of their affiliated organizations or those of the publisher, the editors, and the reviewers. Any product that may be evaluated in this article, or claim that may be made by its manufacturer, is not guaranteed or endorsed by the publisher.
Bertoncello, J. C. B., Manhabosco, S. M., and Dick, L. F. P. (2015). Corrosion Study of the Friction Stir Lap Joint of AA7050-T76511 on AA2024-T3 Using the Scanning Vibrating Electrode Technique. Corrosion Sci. 94, 359–367. doi:10.1016/j.corsci.2015.02.029
Bordbar, S., Alizadeh, M., and Hashemi, S. H. (2013). Effects of Microstructure Alteration on Corrosion Behavior of Welded Joint in API X70 Pipeline Steel. Mater. Des. 45, 597–604. doi:10.1016/j.matdes.2012.09.051
Bousquet, E., Poulon-Quintin, A., Puiggali, M., Devos, O., and Touzet, M. (2011). Relationship between Microstructure, Microhardness and Corrosion Sensitivity of an AA 2024-T3 Friction Stir Welded Joint. Corrosion Sci. 53, 3026–3034. doi:10.1016/j.corsci.2011.05.049
Chao, Y., Jianliang, L., Zili, L., Shouxin, Z., Long, D., and Chengbin, Z. (2019). Study on Interference and protection of Pipeline Due to High-Voltage Direct Current Electrode. Corrosion Rev. 37, 273–281. doi:10.1515/corrrev-2018-0089
Chen, Y., Ding, H., Li, J.-z., Zhao, J.-w., Fu, M.-j., and Li, X.-h. (2015). Effect of Welding Heat Input and post-welded Heat Treatment on Hardness of Stir Zone for Friction Stir-Welded 2024-T3 Aluminum alloy. Trans. Nonferrous Met. Soc. China 25, 2524–2532. doi:10.1016/S1003-6326(15)63871-7
Cheng, Y., Li, Z., Zhao, Y., Xu, Y., Liu, Q., and Bai, Y. (2017). Effect of Main Controlling Factor on the Corrosion Behaviour of API X65 Pipeline Steel in the CO2/oil/water Environment. Acmm 64, 371–379. doi:10.1108/ACMM-04-2016-1665
Costa, M. I., Verdera, D., Vieira, M. T., and Rodrigues, D. M. (2014). Surface Enhancement of Cold Work Tool Steels by Friction Stir Processing with a Pinless Tool. Appl. Surf. Sci. 296, 214–220. doi:10.1016/j.apsusc.2014.01.094
Deshpande, K. B. (2010). Validated Numerical Modelling of Galvanic Corrosion for Couples: Magnesium alloy (AE44)-Mild Steel and AE44-Aluminium alloy (AA6063) in Brine Solution. Corrosion Sci. 52, 3514–3522. doi:10.1016/j.corsci.2010.06.031
Eliyan, F. F., and Alfantazi, A. (2014). Investigating the Significance of Bicarbonate with the Corrosion of High-Strength Steel in CO2-Saturated Solutions. J. Materi Eng. Perform. 23, 4082–4088. doi:10.1007/s11665-014-1200-8
Gadala, I. M., and Alfantazi, A. (2015). A Study of X100 Pipeline Steel Passivation in Mildly Alkaline Bicarbonate Solutions Using Electrochemical Impedance Spectroscopy under Potentiodynamic Conditions and Mott-Schottky. Appl. Surf. Sci. 357, 356–368. doi:10.1016/j.apsusc.2015.09.029
Gao, H., Jiao, X. D., Zhou, C. F., and Li, G. Q. (2014). Study on Simulation of Underwater Friction Stud Welding Process Based on Abaqus. Trans. Chin. Weld. Inst. 12, 50–54.
Jia-Yuan, H., Cao, S. A., Shun-An, C., and Jian-Li, X. (2012). Effect of Rust Layer on the Corrosion Behavior of Carbon Steel in Reverse Osmosis Product Water. Acta Phys-chim. Sin. 28 (10), 1153–1162. doi:10.3866/PKU.WHXB201203022
Jie, Z. Y., Li, Y. D., and Wei, X. (2017). A Study of Fatigue Crack Growth from Artificial Corrosion Pits at Welded Joints under Complex Stress fields. Fatigue Fract Engng Mater. Struct. 40, 1364–1377. doi:10.1111/ffe.12577
Jing, H. W., Lv, M., Liang, G. X., and Liu, D. G. (2017). Effect of Duty Ratio and Pulse Frequency on the Quality of Ni Coating. Mech. Des. Manuf. 8, 110–112. doi:10.3969/j.issn.1001-3997.2017.08.031
Kamaraj, A. B., Shrestha, H., Speck, E., and Sundaram, M. (2017). Experimental Study on the Porosity of Electrochemical Nickel Deposits. Proced. Manufacturing 10, 478–485. doi:10.1016/j.promfg.2017.07.032
Li, H. B., Jiang, Z. H., Feng, H., Zhang, S. C., Li, L., Han, P. D., et al. (2015). Microstructure, Mechanical and Corrosion Properties of Friction Stir Welded High Nitrogen Nickel-free Austenitic Stainless Steel. Mater. Des. 84, 291–299. doi:10.1016/j.matdes.2015.06.103
Liu, Z. Y., Wan, H. X., Li, C., Du, C. W., Li, X. G., and Liu, X. (2014). Comparative Study on Corrosion of X65 Pipeline Steel Welded Joint in Simulated Shallow and Deep Sea Environment. J. Chin. Soc. Corrosion Prot. 34, 321–326. doi:10.11902/1005.4537.2013.156
Lu, S., Guo, Z., Qi, H. D., Liu, H. P., Wang, X. Y., Li, Y. G., et al. (2017). Effect of Duty Ratio on Pulse Electroplated Zn-Ni-Mn alloy Coating. Plat. Surf. Finish. 39, 1–4. doi:10.3969/j.issn.1001-3849.2017.11.001
Lv, R., Zhao, H., and Xin, L. (2018). “Quantitative Research on Signal of Pipeline Coating Defect Detection Based on HHT,” in IEEE. Computer Soc. 10th ICMTMA (Changsha, China: IEEE). doi:10.1109/ICMTMA.2018.00018
Ma, H., Gu, Y., Gao, H., Jiao, X., Che, J., and Zeng, Q. (2018). Microstructure, Chemical Composition and Local Corrosion Behavior of a Friction Stud Welding Joint. J. Materi Eng. Perform. 27, 666–676. doi:10.1007/s11665-018-3182-4
Mei, X. D., and Jiang, B. Q. (2015). Thick Nickel Coating on Surface of Quartz Optical Fiber by Electrochemical Deposition Method. Amm 727-728, 51–55. doi:10.4028/www.scientific.net/AMM.727-728.51
Meng, G. Z., Zhang, C., and Cheng, Y. F. (2008). Effects of Corrosion Product deposit on the Subsequent Cathodic and Anodic Reactions of X-70 Steel in Near-Neutral pH Solution. Corrosion Sci. 50, 3116–3122. doi:10.1016/j.corsci.2008.08.026
Moon, J., Ha, H.-Y., and Lee, T.-H. (2013). Corrosion Behavior in High Heat Input Welded Heat-Affected Zone of Ni-free High-Nitrogen Fe-18Cr-10Mn-N Austenitic Stainless Steel. Mater. Characterization 82, 113–119. doi:10.1016/j.matchar.2013.05.011
Nayak, P. K., Hsu, C.-J., Wang, S.-C., Sung, J. C., and Huang, J.-L. (2013). Graphene Coated Ni Films: A Protective Coating. Thin Solid Films 529, 312–316. doi:10.1016/j.tsf.2012.03.067
Nicholas, E. D. (1984). “Underwater Friction Welding for Electrical Coupling of Sacrificial Anodes,” in Offshore Technology Conference-Houston (Texas: OTC-4741-MS). doi:10.4043/4741-MS
Quan, B. L., Li, J. Q., and Chen, C. Y. (2016). Effect of Additional Sulfide and Thiosulfate on Corrosion of Q235 Carbon Steel in Alkaline Solutions. Int. J. Corrosion 2016, 1–8. doi:10.1155/2016/8549312
Rogowska, M., Gudme, J., Rubin, A., Pantleon, K., and Ambat, R. (2016). Effect of Fe Ion Concentration on Corrosion of Carbon Steel in CO2environment. Corrosion Eng. Sci. Tech. 51, 25–36. doi:10.1179/1743278215Y.0000000029
Sarlak, H., Atapour, M., and Esmailzadeh, M. (2015). Corrosion Behavior of Friction Stir Welded Lean Duplex Stainless Steel. Mater. Des. (1980-2015) 66, 209–216. doi:10.1016/j.matdes.2014.10.060
Shen, C., Li, Z., Ma, Y., and Sun, L. (2019). Research and Application of Underwater Wet Welding Technology. IOP Conf. Ser. Mater. Sci. Eng. 562, 012161. doi:10.1088/1757-899X/562/1/012161
Sidane, D., Bousquet, E., Devos, O., Puiggali, M., Touzet, M., Vivier, V., et al. (2015). Local Electrochemical Study of Friction Stir Welded Aluminum alloy Assembly. J. Electroanalytical Chem. 737, 206–211. doi:10.1016/j.jelechem.2014.06.025
Upadhyay, V., and Battocchi, D. (2016). Localized Electrochemical Characterization of Organic Coatings: A Brief Review. Prog. Org. Coat. 99, 365–377. doi:10.1016/j.porgcoat.2016.06.012
Wang, H., Xu, S., Wang, Y., and Li, A. (2018). Effect of Pitting Degradation on Ductile Fracture Initiation of Steel Butt-Welded Joints. J. Constructional Steel Res. 148, 436–449. doi:10.1016/j.jcsr.2018.06.001
Wang, L. W., Du, C. W., Liu, Z. Y., and Li, X. G. (2012). SVET Characterization of Localized Corrosion of Welded X70 Pipeline Steel in Acid Solution. Corrosion Prot. 33, 935–939.
Wang, Y., Li, D., Sun, L., Li, N., Liu, M., Shen, W., et al. (2017). Pitting Corrosion of Thermally Aged Cast Duplex Stainless Steel for Primary Coolant Pipes of Nuclear Power Plants. Corrosion Eng. Sci. Tech. 52, 447–452. doi:10.1080/1478422X.2017.1325989
Wu, L. P., Zhao, J. J., Xie, Y. P., and Yang, Z. D. (2010). Progress of Electroplating and Electroless Plating on Magnesium alloy. Trans. Nonferrous Met. Soc. China. 20, 630–637. doi:10.1016/S1003-6326(10)60552-3
Xiang, S., Zeng, H. T., Yang, Y., He, Y. G., and Liu, S. L. (2014). Corrosion Resistance of 904L Stainless Steel Welding Joints in Concentrated Sulfuric Acid. J. Univ. Sci. Tech. B. 36, 69–73. doi:10.13374/j.issn1001-053x.2014.01.011
Xie, G. M., Ma, Z. Y., Luo, Z. A., Xue, P., and Wang, G. D. (2011). Effect of Rotation Rate on Microstructures and Mechanical Properties of FSW Mg-Zn-Y-Zr Alloy Joints. J. Mater. Sci. Tech. 27, 1157–1164. doi:10.1016/S1005-0302(12)60012-7
Xu, Y. G., Jiao, X. D., Zhou, C. F., Gao, H., and Di, B. (2015). The Influence of the Rotating Speed on the Mechanical Performance of the Friction. Stud. Weldment. Elec. Weld. Mach. 45, 23–26. doi:10.7512/j.issn.1001-2303.2015.02.05
Yi, F. H. (2019). Investigation on Corrosion of Ground Pipeline Supports outside Field Station and Suggestions for Prevention and Control. Pet. Eng. Const. 45, 69–72. doi:10.3969/j.issn.1001-2206.2019.01.016
Yin, Y., Yang, X., Cui, L., Cao, J., and Xu, W. (2016). Microstructure and Mechanical Properties of Underwater Friction Taper Plug weld on X65 Steel with Carbon and Stainless Steel Plugs. Sci. Tech. Welding Joining 21, 259–266. doi:10.1179/1362171815Y.0000000089
Yli-Pentti, A. (2014). Electroplating and Electroless Plating. Compr. Mater. Process. 198, 277–306. doi:10.1016/b978-0-08-096532-1.00413-1
Zhang, J., Liu, J., Hu, Q., Huang, F., Cheng, Z., and Guo, J. (2015). The Influence of Tensile Stress on the Electrochemical Behavior of X80 Steel in a Simulated Acid Soil Solution. Anti-corr. Method Mater. 62, 103–108. doi:10.1108/ACMM-11-2013-1321
Zhang, R. Y., Chen, S. J., Shi, Z. M., and Zhang, L. F. (2014). Effect of Mg on Microstructures and Abrasive Resistance of In-Situ Synthesis TiC-Al2O3/Al Composites. J. Mater. Eng. 4, 65–70. doi:10.11868/j.issn.1001-4381.2014.10.012
Zhang, X., Deng, C., Wang, D., Wang, Z., Teng, J., Cao, J., et al. (2016). Improving Bonding Quality of Underwater Friction Stitch Welds by Selecting Appropriate Plug Material and Welding Parameters and Optimizing Joint Design. Mater. Des. 91, 398–410. doi:10.1016/j.matdes.2015.11.114
Keywords: X65 steel, FSW joint, micro-zone electrochemistry, pulse electrochemical deposition, duty ratio
Citation: Ma G, Gao H, Sun C, Gu Y, Zhao J and Fang Z (2022) Probing the Anti-Corrosion Behavior of X65 Steel Underwater FSW Joint in Simulated Seawater. Front. Mater. 8:723986. doi: 10.3389/fmats.2021.723986
Received: 11 June 2021; Accepted: 14 December 2021;
Published: 17 January 2022.
Edited by:
Tadeusz Hryniewicz, Koszalin University of Technology, PolandReviewed by:
Idalina Vieira Aoki, University of São Paulo, BrazilCopyright © 2022 Ma, Gao, Sun, Gu, Zhao and Fang. This is an open-access article distributed under the terms of the Creative Commons Attribution License (CC BY). The use, distribution or reproduction in other forums is permitted, provided the original author(s) and the copyright owner(s) are credited and that the original publication in this journal is cited, in accordance with accepted academic practice. No use, distribution or reproduction is permitted which does not comply with these terms.
*Correspondence: Hui Gao, Z2FvaHVpQGJpcHQuZWR1LmNu; Chong Sun, c3VuY2hvbmdAdXBjLmVkdS5jbg==
Disclaimer: All claims expressed in this article are solely those of the authors and do not necessarily represent those of their affiliated organizations, or those of the publisher, the editors and the reviewers. Any product that may be evaluated in this article or claim that may be made by its manufacturer is not guaranteed or endorsed by the publisher.
Research integrity at Frontiers
Learn more about the work of our research integrity team to safeguard the quality of each article we publish.