 Li Juncheng
 Chen Gang
 Lu Yonggang2
- 1State Key Laboratory of Explosion Science and Technology, Beijing Institute of Technology, Beijing, China
- 2Institute of Systems Engineering, China Academy of Engineering Physics, Mianyang, China
Taylor impact test is characterized by high impact energy, low cost, and good repeatability, giving it the technical foundation and development potential for application in high-g loading. In this paper, the feasibility of performing high-g load impact testing to a missile-borne recorder by conducting Taylor impact test was studied by combining simulation analyses with experimental verification. Acccording to the actual dimensions of the missile-borne recorder, an experimental piece was designed based on the Taylor impact principle. The impact loading characteristics of the missile-borne recorder were then simulated and analyzed at different impact velocities. In addition, the peak acceleration function and the pulse duration function of the load were fitted to guide the experimental design. A Taylor-Hopkinson impact experiment was also conducted to measure the impact load that was actually experienced by the missile-borne recorder and the results were compared with the results of strain measurements on the Hopkinson incident bar. The results showed that the peak value of impact load, the pulse duration and the waveform of the actual experimental results were in good agreement with the results predicted by the simulations. Additionally, the strain data measured on the incident bar could be used to verify or replace the acceleration testing of the specimen to simplify the experimental process required. Based on the impact velocity, high-g loading impact was achieved with peak values in the 7,000–30,000 g range and durations of 1.3–1 ms, and the waveform generated was a sawtooth wave. The research results provide a new approach for high amplitude and long pulse duration impact loading to large-mass components, and broaden the application field of Taylor impact test.
Introduction
Advanced penetrating weapons such as the ordnance penetrator can sense environmental information and control their burst point using the electronic equipment on the bomb (e.g., smart fuze, missile-borne recorder) when actually striking the target, thus maximizing the damage and effectiveness of the weapon. During this process, the onboard electronic equipment generally needs to experience an impact of tens of thousands of g (where 1 g = 9.8 m/s2) with a duration of several milliseconds. To improve the reliability of the missile-borne electronic equipment, it is necessary to perform anti-impact performance experiments to assess the survivability and the working performance of the equipment in such high impact environments during the development and production processes.
At present, under laboratory conditions, the main methods used for high impact environment simulations are the Machete hammer test, the drop tower test and the Hopkinson bar test. Among these methods, the Machete hammer test is commonly used in safety testing of energetic materials and in impact tests to verify the cushioning performances of potting materials (Li et al., 2016) The experimental operation required for this test is simple but the impact duration is short (generally tens of microseconds) and the load consistency is poor. The drop tower test is typically performed using indoor experimental equipment, meaning that its lifting height is generally limited to no more than 3 m, and the impact energy generated is low. The Hopkinson bar experiment has been used widely in the calibration of acceleration sensors and can also be used in dynamic impact experiments for small structures (Frew and Duong, 2009), (Foster et al., 2011). The maximum overload value of this method can exceed 100000 g, but the overload duration is short and the mass of the test piece is limited, generally to within several tens of grams. The means of high amplitude and long pulse duration impact loading in this case thus remain insufficient for use with larger components (≥ 0.5 kg). Large caliber cannon testing, rocket sled experiments and airdrop experiments enable realistic impact environments, but these test methods are expensive, with long cycle times and poor repeatability, which means that they are not suited to performing large numbers of research experiments.
In the Taylor impact test (Taylor, 1948) a flat cylindrical projectile is used to impact on a rigid target. The dynamic yield stress of the target material is then obtained by measuring the dimensions of the recovered deformed projectile. This experimental method is simple and convenient for impact analysis. In addition to being widely used to study the dynamic mechanical behavior of metallic materials at high strain rates (Panin et al., 2017), (Bloniarz et al., 2018), (Chausov et al., 2018), (Xu et al., 2020), (Li et al., 2021a), this method has also been used in research into polymer materials, foam metals, glass and other materials. Liu et al. (2018) proposed their own model that considers the impacted surface as a viscoelastic surface. Based on this model, they investigated the impact response of expoxy resin target to polyethylene (PE) projectiles with blunt head. Lee and Huh, (2021) designed a novel shear specimen and conducted shear tests with a Taylor impact testing machine to study the shear properties of AISI 4130 steel at various strain rates from the quasi-static state to ultra-high strain rates. Wang et al. (2013) adopted the Taylor impact method to investigate the dynamic constitutive relation of cellular materials. This method was also employed by Willmott and Radford (2005) to observe the deformation and fracture behavior of glass materials. Since the Taylor impact test was introduced, researchers have been constantly refining it, including introducing a symmetric Taylor impact test to eliminate the assumption of regarding the target as an ideally rigid material (Forde et al., 2013), applying stereo digital image correlation (DIC) technology to measure the strain field (Bigger et al., 2018), using the Taylor impact test to measure the stress–strain curves of the materials (Gao and Iwamoto, 2018), and so on. One of the most important characteristics of the Taylor impact test is that the specimen’s head must have a large plastic deformation range, while the tail must remain elastic. The specimen can be divided into two parts: the plastic deformation area and the elastic deformation area. The impact load that is borne in the elastic deformation area is generated and transmitted by the plastic deformation area located at the front end of specimen. The plastic deformation area at the front end of the specimen can thus be regarded as a load generator, while the elastic deformation area at the tail of the specimen can be considered as the impacted part (Li et al., 2021b). The Taylor impact test itself offers the advantages of high impact energy, low cost and good repeatability. Because the nose shape of the specimen was changed appropriately by each impact, this experimental method has the potential to produce impact loads with different pulse shapes and thus has good application prospects for use in impact load simulations and high-g loading experiments.
At present, the research on the Taylor impact test is mainly focused on the material properties and only a small amount of the research involves measurement and application of the impact load. Hu et al. (2010) tested the impact pressure in Taylor impact testing of a polycarbonate projectile using a polyvinylidene fluoride (PVDF) force measurement film, which was sandwiched between a thin steel sheet and a target pier. However, the experimental result obtained was the local pressure only because of the small area of the PVDF film, which could not fully reflect the impact load of the experiment. El Moumen et al. (2018) installed a force sensor on the back of the impact target plate to study the impact resistance and energy absorption characteristics of polymer composites by measuring and comparing their pressure variation curves during the impact process. Based on the characteristics of metal foams collapsing under approximately constant pressure, Radford et al. (2005) proposed an experimental method to simulate impact loads using a metal foam projectile. The impact force and impact duration were controlled by the velocity and density of the metal foam and by the length of the experimental piece. However, the pressure pulse always approximated to a rectangle shape and this limitation was relatively serious because of the small pulse shape differences that occurred. On the basis of Radford’s research, Li et al. (2019) proposed the introduction of a density gradient in the foam metal projectile to change the impact load shape, which resulted in the production of pulse loads with specific variations, and rectangular, triangular and exponentially decreasing pulses were obtained. The essence of this method was that the collapse pressure was controlled by the foam metal’s density and the waveform evolution was realized by superposing time sequences of different amplitude pressures. However, the foam metal projectile was comparatively light in mass and thus generated lower impact energies. In addition, when compared with the homogeneous metal projectile used in the classical Taylor impact test, the preparation of the gradient foam metal specimen required more sophisticated processing and technology and higher costs.
Li et al. (2021b) studied the impact load characteristics produced by different warheads in the Taylor impact test. As a result, it was proposed that the waveform and pulse duration of the impact load could be controlled through the design of the projectile head shape and the impact speed. Additionally, a provisional structural design for an experimental high-g load piece was presented. On the basis of the work above, a high-g load experimental piece is designed in this work according to the actual dimensions of a missile-borne recorder. By performing simulation analyses, the impact load characteristics of the missile-borne recorder are analyzed under various impact velocities. Furthermore, the peak acceleration function and the pulse duration function of the impact load are fitted and the impact velocities required to produce different impact environment conditions are then estimated. Finally, impact experiments are carried out and overall high-g loading with a peak value of approximately 30,000 g and a duration of approximately 1 ms is achieved. The results obtained show that the actual experimental results are in good agreement with the results predicted by the simulations in terms of the peak value of impact load, the pulse duration and the waveform. In addition, these results indicate that it is feasible to apply the Taylor impact test to high-g loading experiments.
Design of the High –G Load Experimental Piece
As shown in Figure 1, the missile-borne recorder has a cylindrical shape, with main body dimensions of Φ60 mm × 75 mm and a total mass of approximately 0.82 kg.The structural design of the experimental piece is mainly composed of a head cone, a shell and a tail cover. The missile-borne recorder is placed at the tail of the experimental piece and the axial compression of the recorder is performed by the tail cover. The tail cover and the head cone are both connected to the shell using threads. The impact acceleration waveform is controlled by the shape, the material and the impact velocity of the head cone. The 3A21 aluminum alloy is selected for use as the head cone material because it has high plasticity and it is insensitive to the strain rate under annealing conditions. The shell is designed to be a rigid bearing part and the shell material is the 7A04 high strength aluminum alloy, the chemical compositions of the material are presented in Table 1. During the impact process, the shell has sufficient strength and thus only produces deformation within the elastic range, which allows part reuse to be realized. After each test, it is thus only necessary to replace the head cone, and the follow-up experiment can then be conducted.
FIGURE 1. (A) The missile-borne recorder and (B) structural diagram of the experimental piece.
TABLE 1. Chemical compositions of the aluminum alloys (wt %).
A light gas gun with an inner diameter of 120 mm is used as the launch platform. The maximum diameter of the experimental piece is the same as that of the launch platform and a good fit between the piece and the gas gun was realized using the dimensional tolerances. To reduce the total weight and obtain a higher launch velocity, the material contained in the middle part of the shell is partially removed. After completion of the design, the total length of the experimental piece was 336 mm, the head cone angle was 20°, the top diameter was 12 mm and the total mass was approximately 4.57 kg (including the missile-borne recorder).
Simulation Analysis of Taylor Impact
Model and Initial Conditions
The impact process of the experimental piece on the rigid target is simulated and analyzed using transient dynamics finite element software. During the modeling process, one quarter of the model is constructed using the symmetry characteristics of the piece, the three-dimensional solid element is used to mesh the experimental object. The mesh is densified near the head impact area, and the minimum mesh size is 0.5 mm, while the mesh size outside the impact area is gradually enlarged, with a maximum mesh size of 2 mm. In addition, the arbitrary Lagrangian-Eulerian (ALE) algorithm is used in the element algorithm and can control the rotation, expansion and smoothness of the element nodes. Additionally, this algorithm can overcome the mesh distortion caused by the large-scale deformation of the structure. The missile-borne recorder is equivalent to a solid mass and its interaction with the other parts is simulated by dynamic contact.
The rigid target is defined by the keywords *RIGIDWALL_PLANAR. The no. 24 material model (*MAT_PIECEWISE_LINEAR_PLASTICITY) is used to describe the mechanical properties of the head cone material. A compression experiment under quasi-static conditions was performed using a material testing machine and the true stress-strain curve of the 3A21 aluminum alloy was obtained as shown in Figure 2. The shell and tail cover material (7A04 aluminum alloy) is described using the plastic hardening model (PLASTIC_KINEMATIC) and the main mechanical property parameters of this material are presented in Table 2. The initial impact velocity range is from 50 m/s to 200 m/s, with intervals of 25 m/s.
FIGURE 2. True stress-strain curve of 3A21 alloy.

TABLE 2. Main mechanical properties of shell and tail cover material.
Simulation Results and Analysis
Figure 3 shows the impact deformation process of the experimental piece at the velocity of 150 m/s. When the experimental piece strikes the rigid target surface (t = 0 ms), the head and the target surface are in close contact. In addition, the impact end surface is approximately flat and the head cone then gradually compresses. Because of the obstruction of the target surface in the velocity direction, the material flows along the radial direction. In addition, the cross-sectional area of the head expands and a mushroom shape is formed at the impact end. After t = 1 ms, the tail profile of the projectile no longer moves forward, the deformation of the target pier stops, and the plastic zone of the head stops expanding. After t = 1.25 ms, the experimental piece rebounds backward, the head separates from the rigid target, and the impact process then ends. The entire deformation area is concentrated within the head, and there is no plastic deformation in the shell or in the tail.
FIGURE 3. Simulation of the impact process (equivalent plastic strain nephogram).
The acceleration curve of the missile-borne recorder is then extracted as shown in Figure 4. During the complete impact process, the missile-borne recorder experiences an impact environment with a peak value of approximately 3.11 × 10⁴ g and a duration of approximately 1.013 ms. After the impact, it experiences an accompanying axial oscillation that attenuates gradually.
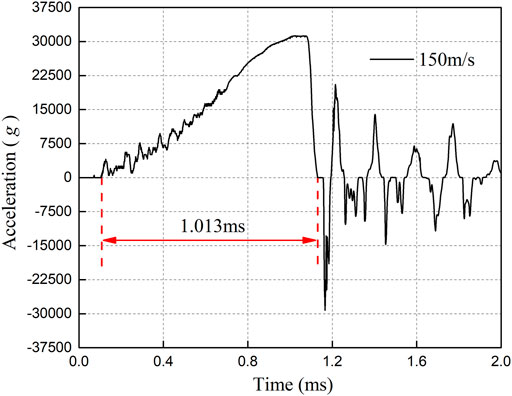
FIGURE 4. Acceleration curve for the missile-borne recorder.
The impact load stages are compared and analyzed under all simulation conditions. A comparison of the load waveforms obtained at different velocities is shown in Figure 5, and the detailed impact load data are presented in Table 3. The results show that the rising edge of the load becomes steeper and the peak value of impact load increases significantly with increasing impact velocity. When the impact velocity increases from 50 m/s to 200 m/s, the peak load value also increases by approximately 7.2 times from 6.89 × 10³g to 4.97 × 10⁴g. The pulse duration decreases with increasing impact velocity, but the floating range is small. When the initial velocity increases from 50 m/s to 200 m/s, the pulse duration decreases in tandem from 1.279 to 0.927 ms; this represents a reduction of approximately 25%. The load waveforms with the different velocities have similar shape characteristics that approximately represent sawtooth waveforms.

FIGURE 5. Comparison of impact load waveforms at different velocities.
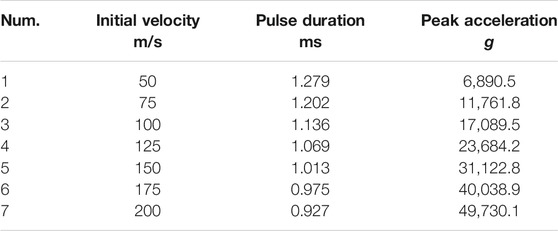
TABLE 3. Statistics of impact load information.
The variations in the peak acceleration and the pulse duration with the velocity are shown in Figure 6. In addition, each data point presents an exponential function variation trend. Using the nonlinear fitting method, the functions of the peak acceleration and the pulse duration with respect to the velocity are obtained as follows:
Where ap is the peak acceleration, v0 is the initial impact velocity and τ is the pulse duration.
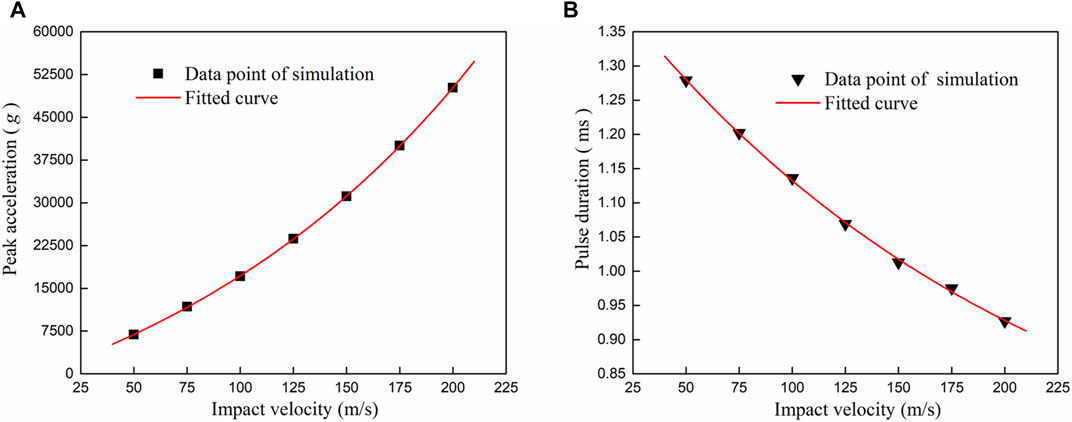
FIGURE 6. (A) Variations in the peak acceleration and (B) the pulse duration with the velocity.
In practical applications, the function above can be used to predict the impact velocity required for the experimental piece according to the requirements of the anti-impact assessment for the missile-borne recorder. For example, the peak impact value of the shock environment is required to reach 30,000g and the pulse duration must be no less than 1 ms, the load speed required is approximately 147 m/s.
Impact Test Verification
Experimental Layout
The impact test was performed to test and verify the impact load of the test piece. One of the actual processed and assembled experimental pieces is shown in Figure 7. A high-g acceleration sensor is installed inside the recording device located on the missile to test and record the axial acceleration signal during the impact process with a sampling frequency of 100 kHz.
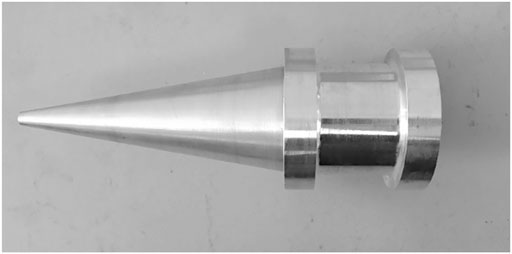
FIGURE 7. Photograph of an assembled experimental piece.
Li et al. (2019) and Liu et al. (2016) replaced the rigid impact target in the Taylor impact test with a Hopkinson incident bar and then tested the strain si gnal in this incident bar when studying the dynamic mechanical properties of metal foams. Using the strain output signal from the incident bar, the strain signal was then converted into the pressure at the impacted end. The test data can then be used to verify the results of the impact acceleration test on the test piece.
With reference to the experimental methods described above, the entire experimental system is composed of a gas gun, a laser velocimeter, a digital high-speed camera, a Hopkinson incident bar, a strain testing system. The experimental layout is shown schematically in Figure 8. The Hopkinson incident bar is 12 m long and 120 mm in diameter and is made from the 7A04 high-strength aluminum alloy.Two strain gauges were mounted on the incident bar at a distance of 3 m from the impact end, diametrically opposed to each other, to measure the strain during impact, where the sampling frequency of the strain measurement system was 500 kHz. Two parallel lasers are placed at the outlet of the transmission tube to measure the initial velocity of the test piece. The deformation processes of the test pieces during impact are recorded using a digital high-speed camera with an acquisition frame rate of 50,000 frames/s.
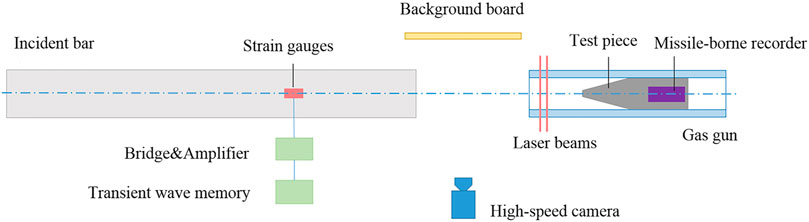
FIGURE 8. Schematic diagram of the experimental layout. Deformation and Comparison of Test Pieces.
Three experiments were performed with impact velocities of 58 m/s, 130 m/s and 151 m/s.
Figure 9 shows high-speed photographic images of the experimental object at the impact speed of 130 m/s, which is similar to the impact process in the numerical simulation. After the experimental object strikes the incident bar (t = 0 ms), the end face of the experimental object is then in close contact with the incident bar and the head is gradually compressed. The material then flows along the radial direction of the experimental object and the cross-sectional area of the head expands. After 1 ms of the impact process, the tail profile no longer moves forward; after 1.2 ms, the tail rebounds and moves obviously backward, the head and the target surface separate, and the impact process then ends.
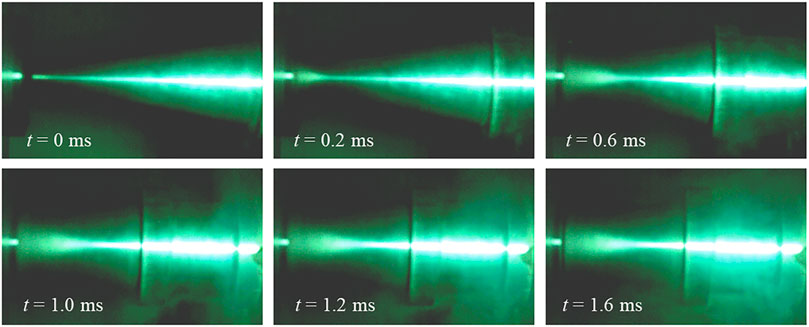
FIGURE 9. High speed photographic images of Taylor impact of the test piece (130 m/s).
Strain Test Data of the Incident bar
The typical strain-time signals measured on the Hopkinson incident bar during the tests, which are the incident pulse signals generated by the impact in each case, are shown in Figure 10. Using Eq. 3, the strain is converted into the impact force at the impact end and is then divided by the mass of the test piece to obtain the overall acceleration of the test piece.
Where
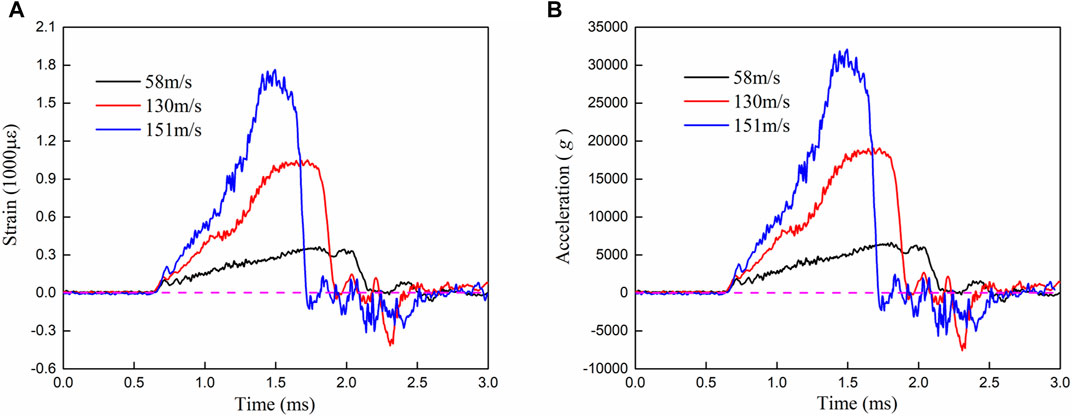
FIGURE 10. (A) Strain test curves and (B) the acceleration curves of the projectile at various impact speeds.
Integrating the acceleration curves obtains the velocity variation curve, as shown in Figure 11. During the complete impact process, the velocity loss of the test piece in each case is equal to the initial velocity and the integral result is slightly higher than that initial velocity because there is a small rebound velocity (−3 m/s to −10 m/s) after the impact; a higher impact velocity produces a greater rebound velocity, which is consistent with the experimental results and indicates that the strain test signal from the incident bar can reflect the deceleration process of the test piece accurately.
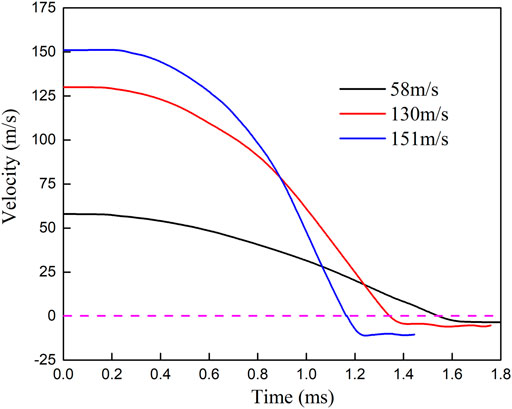
FIGURE 11. Velocity change curves of the projectile at various impact speeds.
A comparison of the shapes of the test pieces recovered after the experiments is shown in Figure 12. Each head shows typical upsetting deformation. A higher impact speed causes more obvious upsetting and greater compression in the length direction. At the different impact speeds, only the head cone shows upsetting deformation, and there is no evidence of tensile tearing, shear cracking, crushing or other damage phenomena, which reflects the good plastic ductility characteristics of the 3A21 aluminum alloy. Similar to the results obtained from the numerical simulations, the entire deformation area is concentrated within the head, and no plastic deformation is observed in the shell and tail structures.
FIGURE12. Comparison of test projectiles after impact.
Test Data and Comparison With Missile-Borne Recorder
After the test, the acceleration data read-back characteristics produced by the missile-borne recorder are as shown in Figure 13; these characteristics are similar to the strain data on the incident bar. During the impact loading stage, the load waveform shows similar shape characteristics at different speeds, with an approximately sawtooth wave shape. When the impact velocity increases, the peak load value also increases significantly but the pulse duration decreases gradually. When the impact velocity was 151 m/s, the peak load value exceeded 30,000 g and the impact duration was approximately 1 ms. When the velocity was higher (≥ 130 m/s), an obvious reverse impact signal could be observed after the impact that was mainly related to the installation mode of the recorder. The connection between the recorder and the shell is fixed and is compressed axially through the tail cover. During the impact process, both the shell and the recorder produce elastic deformation, which results in an axial clearance, and relative sliding and collisions will then occur between the internal structures.
FIGURE 13. Acceleration signal characteristics of the missile-borne recorder.
Under the same velocity condition (151 m/s), a comparison of the overall acceleration curve obtained by converting the incident bar strain data with the acceleration curve based on the test data from the missile-borne recorder is shown in Figure 14. The figure shows that, during the shock loading stage, the two curves show good consistency in terms of their waveforms, peak loads and pulse durations. A detailed data comparison is presented in Table 4, and the data deviation between the two curves is less than 10% under each of the different speeds, which indicates that strain testing of the incident bar can be used to verify or replace the acceleration testing of the test piece. When compared with acceleration testing of the test piece, the strain test on the incident bar does not experience the harsh environment of the transient strong impact, it is easier to obtain the test data and the overall test design process is simpler.
FIGURE 14. Comparison of acceleration curves (151 m/s).
TABLE 4. Comparison of impact load data.
Comparison of the test data from the missile-borne recorder with the theoretically calculated curve fitted during the simulation analysis (see Figure 15) shows that the variation trends of the two curves are consistent and that the relative deviations are small, which verifies that the theoretical curve can be used to guide the actual experimental design.
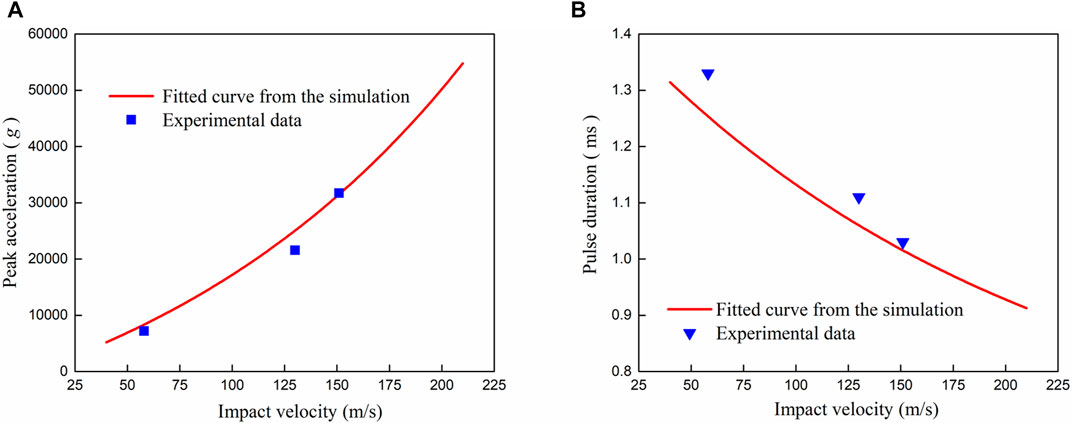
FIGURE 15. (A) Comparisons between the numerical fitting curves and (B) the experimental data.
Conclusion
In this paper, based on the actual dimensions of a missile-borne recorder, a high-g loading test piece based on the Taylor impact principle is designed. The load caused by the impact is analyzed using a combination of simulation analysis and experimental research, and the conclusions drawn are as follows:
1) For the truncated cone head-type experimental piece designed in this work, the waveform generated by the impact is approximately a sawtooth wave. When the impact velocity increases, the peak value of the impact load also increases significantly, but the pulse duration decreases gradually.
2) The overall acceleration obtained by converting the incident bar strain data shows good agreement with the acceleration test data from the actual test piece and can thus be used to verify or replace the acceleration testing of the test piece, which reduces the data acquisition difficulty and simplifies the experimental process;
3) During the impact process, the complete specimen experienced high-g loading with amplitudes in the 7,000–30000 g range and durations of 1.3–1 ms. The results obtained verify the feasibility of applying the Taylor impact test to high-g loading tests.
Data Availability Statement
The original contributions presented in the study are included in the article/supplementary material, further inquiries can be directed to the corresponding author.
Author Contributions
LY and HF annotate and maintain research data for initial use CG and LJ conduct investigation process and perform the experiments and data collection. LY is responsible for the research activity planning and execution. LJ performs the numerical simulations. LJ and CG write the initial draft.
Funding
This research was funded by the National Natural Science Foundation of China (grant number 11572299)
Conflict of Interest
The authors declare that the research was conducted in the absence of any commercial or financial relationships that could be construed as a potential conflict of interest.
Publisher’s Note
All claims expressed in this article are solely those of the authors and do not necessarily represent those of their affiliated organizations, or those of the publisher, the editors and the reviewers. Any product that may be evaluated in this article, or claim that may be made by its manufacturer, is not guaranteed or endorsed by the publisher.
Acknowledgments
The authors would like to thank the National Natural Science Foundation of China (NO. 11572299) for supporting the present work. We also thank David MacDonald, for editing the English text of a draft of this manuscript.
References
Bigger, R. P., Carpenter, A., Scott, N., Dannemann, K., Chocron, S., and Williams, C. (2018). Dynamic Response of Aluminum 5083 during Taylor Impact Using Digital Image Correlation. Exp. Mech. 58, 951–961. doi:10.1007/s11340-018-0392-5
Bloniarz, R., Majta, J., Trujillo, C., Cerreta, E., and Muszka, K. (2018). The mechanisms for strengthening under dynamic loading for low carbon and microalloyed steel. Int. J. Impact Eng. 114, 53–62. doi:10.1016/j.ijimpeng.2017.12.015
Chausov, M. G., Maruschak, P. O., Hutsaylyuk, V., Śnieżek, L., and Pylypenko, A. P. (2018). Effect of complex combined loading mode on the fracture toughness of titanium alloys. Vacuum 147, 51–57. doi:10.1016/j.vacuum.2017.10.010
El Moumen, A., Tarfaoui, M., Hassoon, O., Lafdi, K., Benyahia, H., and Nachtane, M. (2018). Experimental Study and Numerical Modelling of Low Velocity Impact on Laminated Composite Reinforced with Thin Film Made of Carbon Nanotubes. Appl. Compos. Mater. 25, 309–320. doi:10.1007/s10443-017-9622-8
Forde, L. C., Proud, W. G., and Walley, S. M. (2013). Symmetrical Taylor impact studies of copper. Proc. Math. Phys. Eng. Sci. 465, 769–790.
Foster, J. T., Frew, D. J., Forrestal, M. J., Nishida, E. E., and Chen, W. (2011). Shock testing accelerometers with a Hopkinson pressure bar. Int. J. Impact Eng. 46, 56–61. doi:10.1007/978-1-4614-0222-0_29
Frew, D. J., and Duong, H. (2009). A Modified Hopkinson Pressure Bar Experiment to Evaluate a Damped Piezoresistive MEMS Accelerometer. Proc. SEM Annu. Conf.
Gao, C., and Iwamoto, T. (2018). Finite Element Analysis on a Newly-Modified Method for the Taylor Impact Test to Measure the Stress-Strain Curve by the Only Single Test Using Pure Aluminum. Metals 8, 642. doi:10.3390/met8080642
Hu, W. J., Zhang, F. J., and Chen, Y. Z. (2010). Taylor impact test of polycarbonate and photoplastic analysis. Polym. Mater. Sci. Eng. 26, 115–121.
Lee, S., and Huh, H. (2021). Shear stress hardening curves of aisi 4130 steel at ultra-high strain rates with taylor impact tests. Int. J. Impact Eng. 149, 103789. doi:10.1016/j.ijimpeng.2020.103789
Li, H., Yu, Z., Rong, P., Wu, Y., Hui, X., Zhang, F., et al. (2021). High strain rate response of in-situ tib2/7055 composite by taylor impact. Materials 14 (2), 258. doi:10.3390/ma14020258
Li, J.-C., Chen, G., Huang, F.-L., and Lu, Y.-G. (2021). Load Characteristics in Taylor Impact Test on Projectiles with Various Nose Shapes. Metals 11, 713. doi:10.3390/met11050713
Li, L., Han, B., and He, S. Y. (2019). Shock loading simulation using density-graded metallic foam projectiles. Mater. Des. 164, 1–10. doi:10.1016/j.matdes.2018.107546
Li, X. F., Wang, Y. B., and Wu, B. (2016). Fuze of penetration ammunition. Beijing: National Defense Industry Press.
Liu, H., Yang, J., and Liu, H. (2018). Effect of a viscoelastic target on the impact response of a flat-nosed projectile. Acta Mech. Sin. 34 (1), 162–174. doi:10.1007/s10409-017-0717-0
Liu, H., Zhang, Z., Liu, H., and Yang, J. (2016). Effect of elastic target on Taylor-Hopkinson impact of low-density foam material. Int. J. Impact Eng. 94, 109–119. doi:10.1016/j.ijimpeng.2016.04.005
Panin, S. V., Moiseenko, D. D., Maksimov, P. V., Vlasov, I. V., Byakov, A. V., and Maruschak, P. O. (2017). Influence of energy dissipation at the interphase boundaries on impact fracture behaviour of a plain carbon steel. Theor. Appl. Fracture Mech. 97, 478–499.
Radford, D. D., Deshpande, V. S., and Fleck, N. A. (2005). The use of metal foam projectiles to simulate shock loading on a structure. Int. J. Impact Eng. 31, 1152–1171. doi:10.1016/j.ijimpeng.2004.07.012
Taylor, G. (1948). The use of flat-ended projectiles for determining dynamic yield stress I. Theoretical considerations. Proc. R. Soc. Lond. A. 194 (1038), 289–299. doi:10.1098/rspa.1948.0081
Wang, L.-L., Yang, L.-M., and Ding, Y.-Y. (2013). On the energy conservation and critical velocities for the propagation of a "steady-shock" wave in a bar made of cellular material. Acta Mech. Sin 29, 420–428. doi:10.1007/s10409-013-0024-3
Willmott, G. R., and Radford, D. D. (2005). Taylor impact of glass rods. J. Appl. Phys. 97, 093522. doi:10.1063/1.1889249
Keywords: taylor impact, missile-borne recorder, high-g load, impact load, sawtooth waveform, pulse duration
Citation: Juncheng L, Gang C, Yonggang L and Fenglei H (2021) Investigation on the Application of Taylor Impact Test to High-G Loading. Front. Mater. 8:717122. doi: 10.3389/fmats.2021.717122
Received: 30 May 2021; Accepted: 10 August 2021;
Published: 25 August 2021.
Edited by:
Yu-Fei Wu, RMIT University, AustraliaReviewed by:
Pavlo Maruschak, Ternopil Ivan Pului National Technical University, UkraineChing Tai Ng, University of Adelaide, Australia
Copyright © 2021 Juncheng, Gang, Yonggang and Fenglei. This is an open-access article distributed under the terms of the Creative Commons Attribution License (CC BY). The use, distribution or reproduction in other forums is permitted, provided the original author(s) and the copyright owner(s) are credited and that the original publication in this journal is cited, in accordance with accepted academic practice. No use, distribution or reproduction is permitted which does not comply with these terms.
*Correspondence: Chen Gang, Y2hlbmdhbmdAY2FlcC5jbg==