 Bingying Wang
 Tongle Zhang1
95% of researchers rate our articles as excellent or good
Learn more about the work of our research integrity team to safeguard the quality of each article we publish.
Find out more
ORIGINAL RESEARCH article
Front. Mater. , 09 August 2021
Sec. Environmental Degradation of Materials
Volume 8 - 2021 | https://doi.org/10.3389/fmats.2021.709101
This article is part of the Research Topic Corrosion and Protection of Materials in the Oil & Gas Industry View all 6 articles
For the long-term service of X65/Incoloy 825 bimetallic composite pipe girth welds in the H2S environment, the corrosion damage behavior was investigated. Characterizations of welded joints were conducted by OM, SEM, XRD, and EDS. The pitting corrosion’s 3D surface morphology of welded joints in NACE-B solution saturated with H2S was investigated. The results show that composition segregation occurs in the welding process, and the Laves phase appears between dendrites, which lead to the decrease in corrosion resistance. The maximum depth of the corrosion pit is 2.46 μm after 30 days, 4.54 μm after 60 days, and 10.94 μm after 180 days. The cell automata (CA) model of corrosion damage was established based on the MATLAB program, and the basic elements of the cell automata model were determined. Through the simulation of the electrochemical reaction and diffusion process, the influence of different parameters of the pitting corrosion morphology was determined. The simulation results were compared with experimental data, which are available for the prediction of the morphology and size of the corrosion pits on the sample surface after 300 days. The results will be beneficial for the long-term service of the bimetallic composite pipe.
With the increasingly severe service environment of oil and gas transmission pipelines, the content of H2S, CO2, and Cl− strong corrosive medium becomes high, which leads to serious pipeline corrosion problems (Bunaziv et al., 2019). The bimetallic composite pipe is widely used in acid oil and gas pipelines due to its excellent corrosion resistance and mechanical properties (Zhang and Zeng, 2019). The bimetallic composite pipe welded joint bears the thermal cycle and the diffusion of alloy elements during welding due to its special structure, which makes the corrosion performance of joints become a research hot spot.
In order to prevent the alloy from burning and improve the corrosion resistance of the welded joint, the Inconel 625 welding wire is generally used for welding the X65/Incoloy 825 bimetal composite pipe (Guo et al., 2017). Neville et al. (2000) found that the passivation film of Fe and Cr oxide formed on the corroded Inconel 625 can inhibit further corrosion of the material. However, Nb and Mo will be dispersed into liquid metal during the solidification of Inconel 625 weld metal and then enriched in the intergranular region to form intermetallic compounds named Laves phases (Silva et al., 2013), which tends to cause pitting corrosion (Xu et al., 2013). Due to the depletion of Ni and Cr, the protective effect of the passivation film is weakened, and the corrosion mainly occurs in the intergranular region (Bakare et al., 2010; Cuevas-Arteaga et al., 2010). Ahmed and Cooper thought that the local corrosion mechanism of the Inconel 625 weld was related to the galvanic corrosion between dendrites (Laves phase) (Cooper et al., 1996; Ahmed et al., 2010). Zahrani believed that the Laves phase was the suitable place for the initiation of the corrosion pit, which eventually led to the development of the corrosion pit (Zahrani and Alfantazi, 2014).
The long-term corrosion experiment can be avoided using numerical simulation, such as the PDE, MC algorithm, or CA model, to predict the corrosion damage process. PDE is a deterministic model, which cannot consider the randomness of the corrosion phenomenon fully (Frankel, 1998; Bataillon et al., 2012). The MC algorithm (Caleyo et al., 2009) can take into account the stochastic behavior of corrosion; however, it needs large numbers of calculations to describe the macro corrosion phenomenon. The CA model is a mathematical model based on the discrete time, space, and state, with a simple structure and convenient calculation (Cui et al., 2019), which is suitable for the simulation of the corrosion random process. Córdoba-Torres et al. (2001) established a CA model to simulate mesoscopic corrosion behavior, and the simple dissolution mechanism of the anode and the cathode, including adsorption and cation charge reception, was simulated. Di Caprio et al. (2011) established a CA corrosion model on the basis of predecessors and added passivation and depassivation phenomena, the pitting corrosion phenomenon of decompression water reactor steam generator (SG) tubes was studied in depth, and a CA model to simulate pitting corrosion was established.
In this work, the corrosion damage of the weld of the clad pipe was analyzed, which provides the theoretical and experimental basis for the long-term service of the X65/Incoloy 825 clad pipe welding structure.
In all explosive cladded samples, an Incoloy 825 plate was claded on an X65 steel plate. Before welding, the Y-groove is processed, and multilayer and multi-pass welding is carried out using an ER/E CrNiMo-3 welding wire/electrode. The cladding layer is welded by argon arc welding (GTAW), and the substrate is welded by shielded metal arc welding (SMAW). The bimetal pipe welded joint was machined into a size of Φ 610mm × (22 + 3) mm as the experimental material according to the API 5ld standard. The chemical composition of the Incoloy 825 cladding, X65 substrate, and filler metal is shown in Table 1.
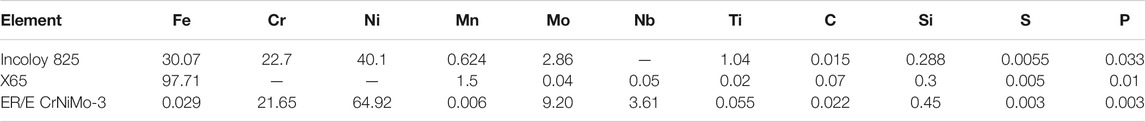
TABLE 1. Chemical composition of X65/Incoloy 825 and filler metal.
The sampling diagram of the bimetal pipe welded joint with a size of 10 mm × 10 mm × 3 mm for the immersion corrosion test is shown in Figure 1. The corrosion solution is NACE-B solution, and the composition is shown in Table 2. Before immersion, the sample is ground using sandpaper to 1,1500 mesh and cleaned with acetone and anhydrous alcohol. The morphologies and composition of corrosion products in the bimetal pipe welded joint were analyzed using a scanning electron microscope (SEM, JSM-7200F), a three-dimensional topography instrument (Contour X), an energy dispersive spectrometer (EDS, X-Mas50), and an X-ray diffractometer (XRD-6100).
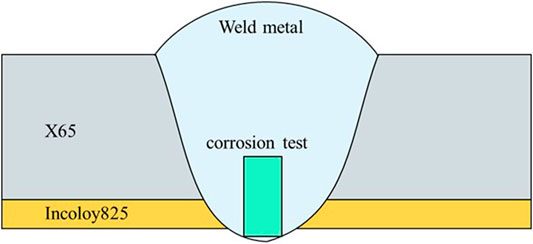
FIGURE 1. Sampling diagram of the corrosion sample.

TABLE 2. Corrosion solution composition.
The test time was 30, 60, and 180 days, respectively. The corrosion resistance of welded joint samples was analyzed by comparing the size and quality of samples before and after corrosion in each period.
The corroded weld sample was sanded to 2,500 mesh first and then polished with 0.5 μm polishing paste. Aqua regia (hydrochloric acid–to–nitric acid volume ratio of 3:1) was used to corrode the surface of the samples. The microstructure and composition of welded joint samples were analyzed using a metallographic microscope, SEM, and EDS.
Four fundamental elements are included in a complete CA process: cells, cell space, neighbors, and evolution rules. The cells, also known as the units, are the most basic component of a CA. The cell space is a set of grid points with different boundary conditions such as the periodic boundary, reflective boundary, and fixed value boundary. The evolution rules are the transfer relationships that determine the state of the cell at the next step based on the current state of this cell and its neighbors. According to the experiment, the main components of the welded joint sample are Ni, Cr, and Fe, which account for more than 99% of the total welded joint weight. The atomic diameters of Ni, Cr, and Fe are about 0.248, 0.254, and 0.250 nm, respectively. We define each cell of the CA model as a square of 0.25 μm, representing 1,000 atoms. The weld material with a thickness of 75 μm was simulated with a 300 × 300 cell space in the CA model. The cell type and state are shown in Table 3, and the cell position relationship is shown in Figure 2. The state of each cell depends on the state and configuration of neighbors in the cell. In the simulation, we choose the von Neumann neighborhood, that is, the cell will have four neighbor cells in the upper, lower, left, and right positions. If the cell is represented as (0,0), its neighborhood can be represented as (0,1), (1,0), (1,0), and (0, −1).
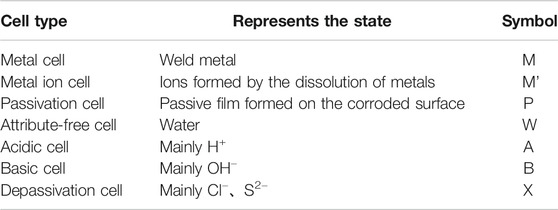
TABLE 3. Cell types and states.
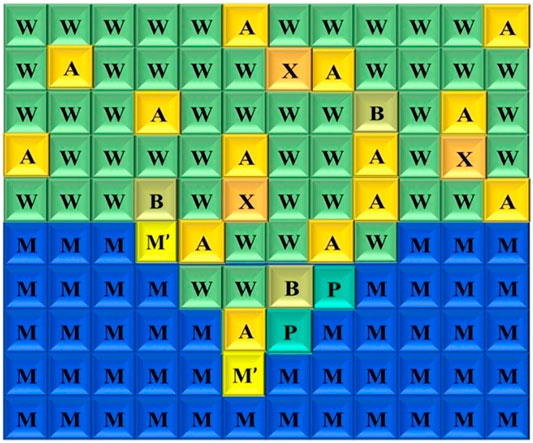
FIGURE 2. Cell distribution characteristics.
J. Saunier (Saunier et al., 2004) analyzed the initial stage of cellular automata simulating corrosion and put forward the relevant formulas of the cell size and timescale, such as Eq. 1, as follows:
where A is the scale coefficient,
The CA model algorithm is programmed using MATLAB software. Cellular reaction rules can be divided into five categories according to Eqs 2–6. A, B, X, M’, and W are solution cells that can move randomly. When cell A moves toward cell M, cell M’ will replace the position of cell M with p_corr probability (Equ. 2), cell W occupies the position of cell A, and corrosion occurs on the weld (Figure 3A). The occurrence and dissolution of the passivation film have a great influence on the development of pitting corrosion. It is assumed that the passivation layer P dissolves in the form of M’ in an acidic medium. In addition, Cl− and S2− have an autocatalytic effect on the corrosion pit after entering it. Rules related to the formulation of the passivating film are shown in Figures 3B–D. When cell B moves toward cell M’, cell P occupies the position of cell M’ with probability of p_pas (Eq. 3), cell W occupies the position of cell B, and passivation occurs on the weld surface (as shown in Figure 3B). When the number of cell A in the neighborhood of cell P is greater than the number of site B in the neighborhood, the location of cell P will be occupied by cell M’ with a probability of p1 (Eq. 4), and depassivation will occur (as shown in Figure 3C). Cell X moves toward cell P, and cell P is depassivated with a probability of p2 (Eq. 5) and becomes cell M’, while cell B occupies the position of cell X (as shown in Figure 3D). When cell A moves toward cell P, cell P will be replaced by cell M’ with probability p3 (Eq. 6), cell W occupies the initial position of cell X, and depassivation occurs (as shown in Figure 3E). If the weld metal site is not in contact with the corrosive electrolyte, the M cell does not change, in which case the weld retains its original properties and does not change.

FIGURE 3. Evolution rules of the cell in a certain step.
Cellular automata are simulated on a mesoscopic scale, and appropriate boundary conditions are selected to make the simulation results conform to the actual situation. Figure 4 shows the initial state of cellular automata. The simulation boundary condition of the CA model is that the left and right boundaries can be connected end to end, which is the closest to the infinite space. Thus, the simulation results are more consistent with the actual corrosion situation. The Brownian motion of the cell is prior to the chemical reaction, so there is no chemical reaction in the Brownian motion. The diffusion velocities of eight kinds of cells are set to be the same so as to simplify and reduce the number of parameters according to the reference of Caprio and Stafiej (2011). In order to simulate local pitting of weld metal, a passivation layer composed of three layers of passivation cell P is set above the metal cell M before simulation. The metal covered by the passivation film is exposed to the corrosive medium at the 14-cell width position in the central area of the passivation film. The corrosion rules of the passive film set in this experiment conform to the definition of passive cell corrosion rules in Evolution Rules.

FIGURE 4. Initial state of cellular automata.
According to the ion concentration and simulation requirements of the welding seam immersion experiment in Immersion Corrosion Test, the concentration, corrosion probability, passivation probability, and depassivation probability of each cell are set as shown in Table 4.

TABLE 4. Parameter table of cellular automata.
Figure 5 shows the weld microstructure, in which a, b, c, and d are the metallographic microstructure of the backing bead, the interface area of the bead, the filler bead, and the cover bead, respectively. It can be seen that the microstructure of the weld specimen is composed of fine primary dendrites of the austenitic γ phase (dark phase) and the interdendritic eutectic phase (light phase). The microstructure is shown in Figure 5A is dendritic due to the argon arc welding technology adopted in the backing welding, which has a small heat input and is not preheated by the front weld pass during welding. As a result, the grain size is fine, and obvious directional growth occurs in the grain size during cooling. As the welding process goes on, the latter bead has the effect of heat treatment on the previous bead, while the previous bead has the effect of preheating, and the dendrite will change into cellular crystal and cellular dendritic crystal, as shown in Figure 5B. In Figure 5B, zone 1 and zone 2 are the microstructures of the latter and the backing bead, respectively. Figure 5C shows the metallographic microstructure of the middle pass, which is similar to the metallographic microstructure in zone 2 of Figure 5B. After preheating by the previous pass, the microstructure changes into cellular crystal. Figure 5D shows the metallographic microstructure of the cover welding pass, which is cellular dendritic or cellular crystal, but the microstructure is thicker than that in Figure 5C. The main reason is that the cover welding, as the last weld in the welding process, will not be subjected to the heat treatment of the back weld, so it is unable to regulate the coarse and large dendritic structure.
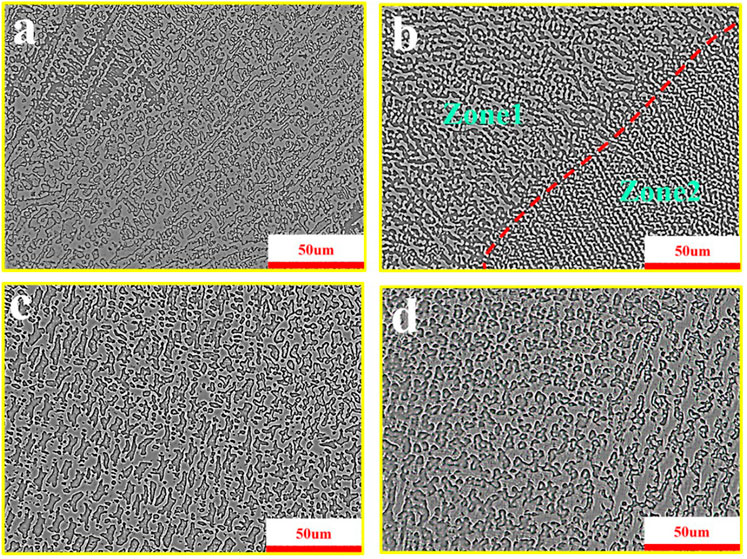
FIGURE 5. Metallographic microstructure of the weld. (A) Backing bead. (B) Interface area of the bead. (C) Filler bead. (D) Cover bead.
Figure 6 shows energy spectrum surface scanning in the weld zone. The results show that the second phase, which is randomly dispersed in the interdendritic region, is enriched in the plateau sublevel elements (such as Mo and Nb). Element segregation occurs in dendritic and interdendritic regions. According to the analysis of the relevant reference, the secondary phases generated during welding are Laves phases (Gill et al., 2013). Among them, the Laves phase is a common precipitate, which existed in the weld solidification microstructure (Cieslak et al., 1989).
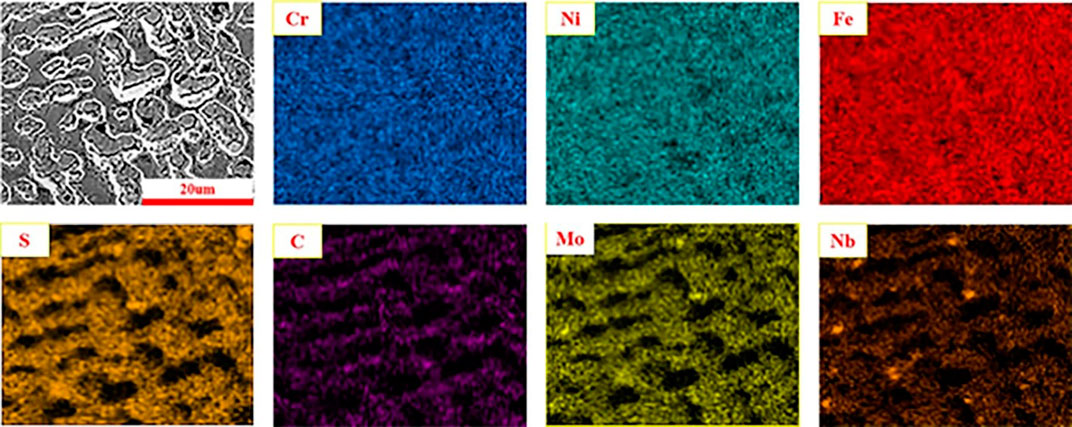
FIGURE 6. Energy spectrum scanning of the weld.
The Laves phase is an irregular band distributed in the center of the interdendritic region. Therefore, different positions in the figure were selected for EDS point analyses, and the average value of the element content in the Laves phase was calculated. According to the element distribution of element point analysis results as shown in Figure 7 and Table 5, the contents of Ni, Cr in the Laves phase are significantly lower than those of ER/E CrNiMo-3, while the contents of Nb and Mo are to the contrary. Ni and Cr are important corrosion-resistant alloy elements. Therefore, the content of Ni and Cr in the Laves phase is low, which indicates that the corrosion resistance of welded metal is lower than that of the base metal.
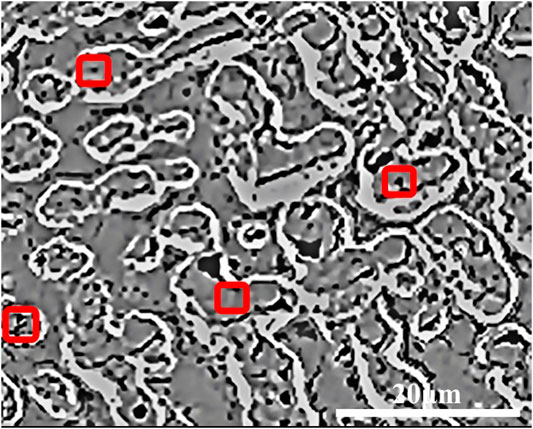
FIGURE 7. Energy spectrum points analyses of the weld.

TABLE 5. Energy spectrum points analysis results of the weld (wt%).
The typical area morphologies of weld samples after 30, 60, and 180 days of corrosion were observed using a 3D morphometric, respectively. Figure 8 shows the appropriate X and Y paths to scan the corrosion pit and obtain the contour morphology of the corrosion pit. It can be seen that the maximum depth of the corrosion pit is 2.46 μm after 30 days, 4.54 μm after 60 days, and 10.94 μm after 180 days.
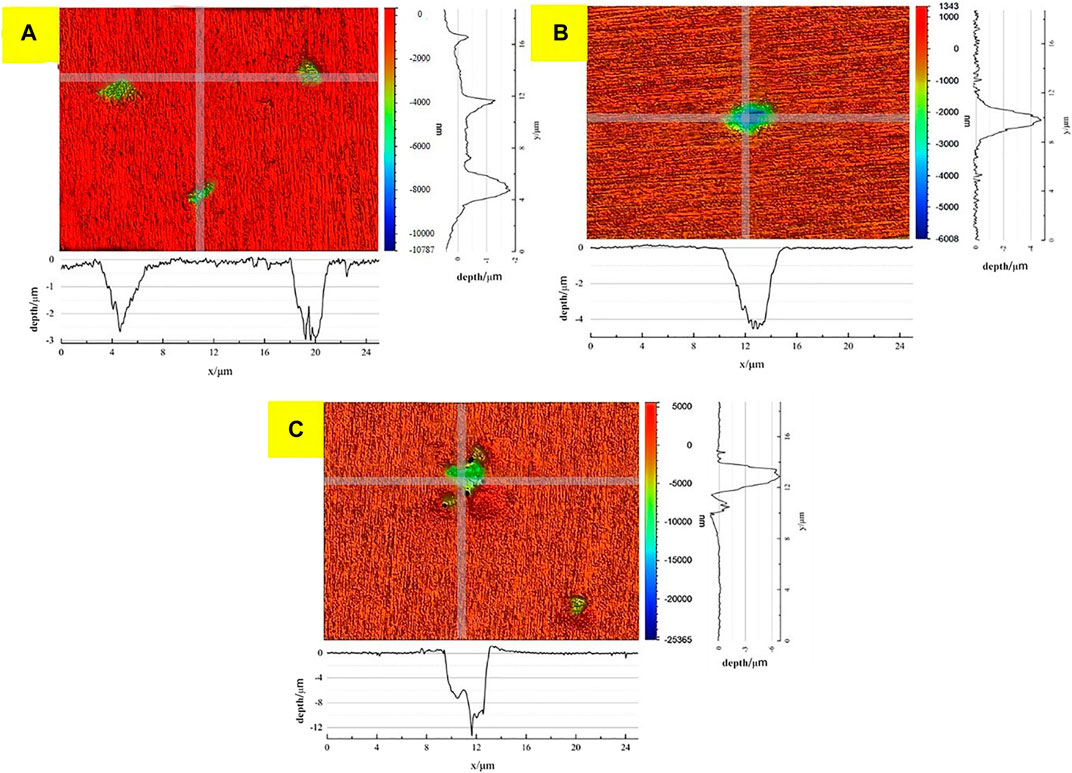
FIGURE 8. Outline of the corrosion pit after 30, 60, and 180 days of corrosion. (A) 30 days, (B) 60 days, and (C) 180 days.
Komp proposed (Ahn et al., 2019) a relationship between corrosion depth and corrosion time, which is in accordance with Eq. 7 as follows:
where C is the maximum corrosion depth, μm; t is the corrosion time, day; and A and β are the parameters determined by the regression analysis of experimental data. The experimental data of 30, 60, and 180 days were fitted to get
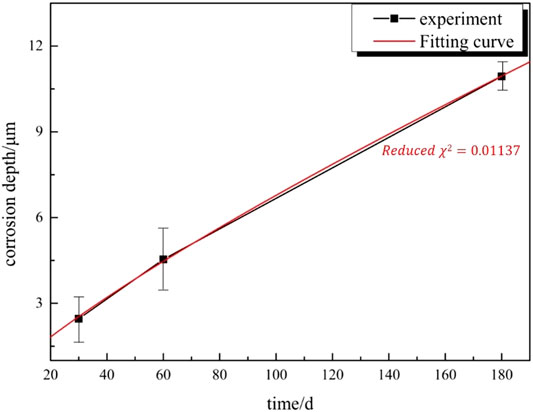
FIGURE 9. Experimental and fitting relationship between corrosion depth and time.
The SEM morphology image and XRD pattern of the weld sample after 180 days of corrosion are shown in Figures 10, 11, respectively. As can be seen from Figure 10, some pits and deep trenches appear on the surface when the weld is corroded. According to XRD analysis, the corroded weld sample is mainly composed of Ni–Cr–Fe, CrO3, and MoO3. Among them, the peak corresponding to Ni–Cr–Fe is the strongest, which corresponds to the austenite phases in the weld matrix. In addition, the weak peak related to the CrO3 and MoO3 phases is the generated corrosion product. Mo usually appears in the form of MoO42− in corrosion products, and Chou (Chou et al., 2010) believed that the formed MoO42− is thermodynamically unstable and tends to precipitate as MoO3.
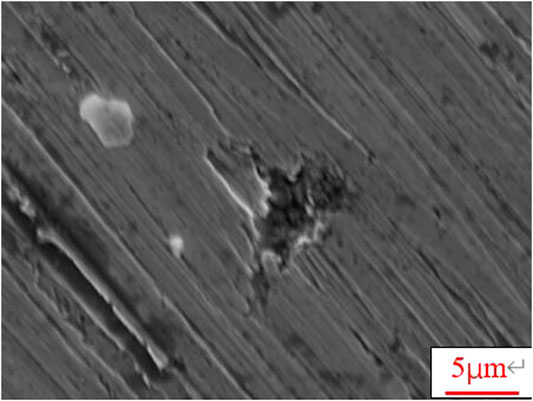
FIGURE 10. Corrosion pit morphology.
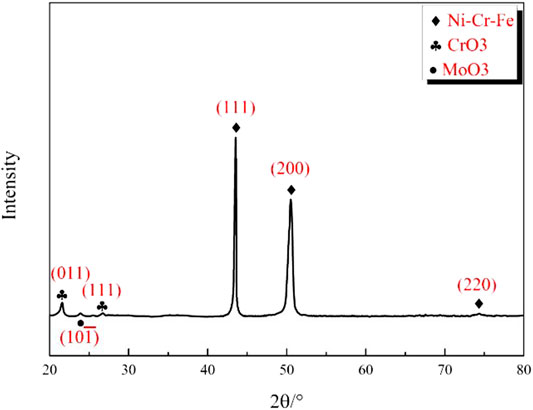
FIGURE 11. XRD analysis of corrosion products.
Figures 12, 13 show the surface and line scan of EDS of the weld sample after 180 days of the corrosion immersion test. The results show that the contents of Cr and Ni are lower in the corrosion pit area due to the segregation, while the contents of Mo and Nb between dendrites are less, so the interdendritic area is easy to be corroded. It can be inferred that the Mo and Ni elements in the filler metal possess a strong segregation trend during the welding process of the bimetal clad pipe, which leads to the precipitation of the Laves phase enriched in Nb in the interdendritic region. The precipitation and segregation of the second phase indirectly reduce the content of Cr, Ni, and other corrosion resistance elements in the interdendritic region; thus, the corrosion resistance of the weld metal is reduced.
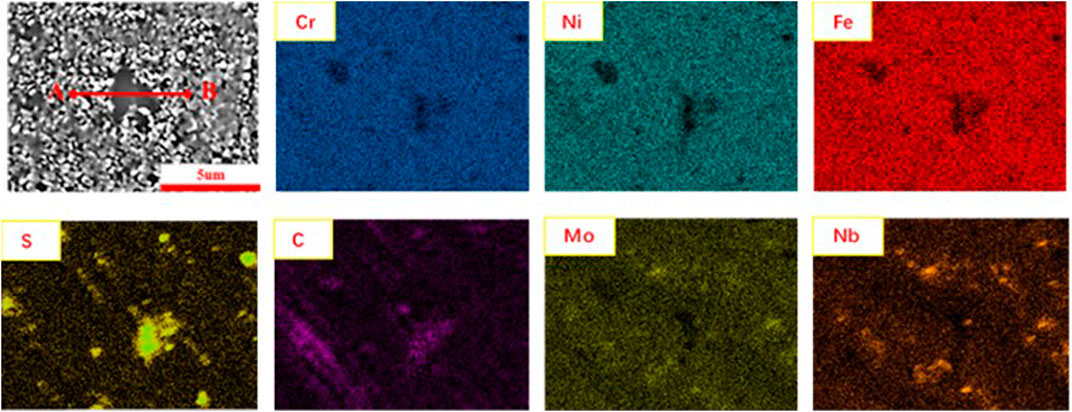
FIGURE 12. Element surface scanning of the weld sample after 180 days of corrosion.
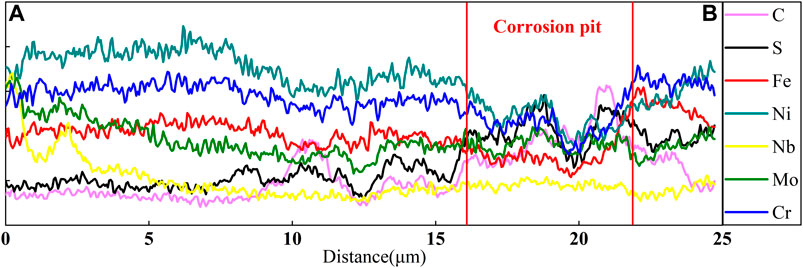
FIGURE 13. Element line scan of the weld sample after 180 days of corrosion.
The simulation results of cellular automata corrosion under different time steps are presented in Figure 14. According to the definition of the cell size and timescale in Cell Space and State, the results are the corrosion morphology of simulated actual corrosion for 60–300 days. It can be seen that the pit depth and the surface roughness increase gradually, with the extension of corrosion time. The pitting depth after CA simulation is shown in Figure 15. The pitting development rate in the middle area is much higher than that in the edge area.
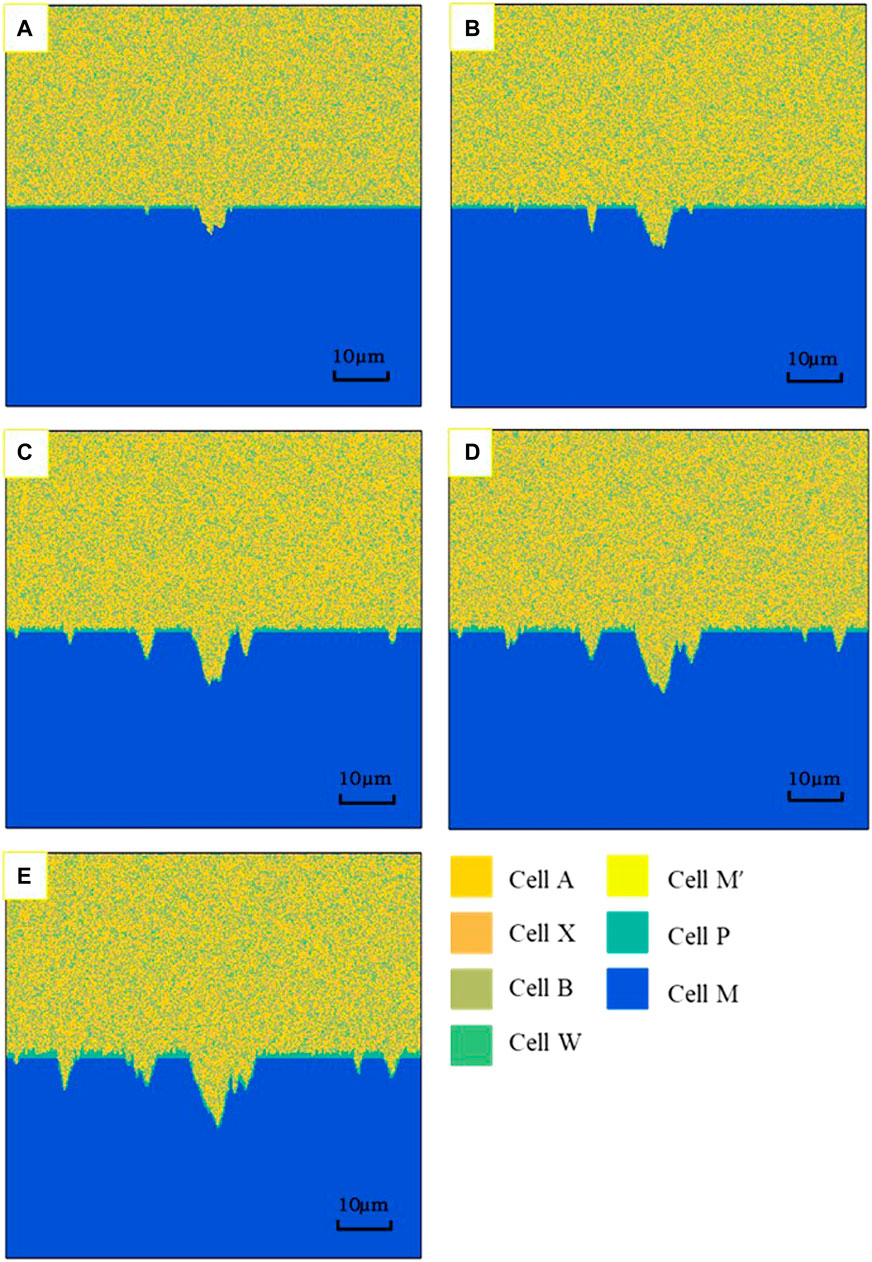
FIGURE 14. Morphology of different corrosion times simulated by CA. (A) 30 days, (B) 60 days, (C) 180 days, (D) 240 days, (E) 300 days.
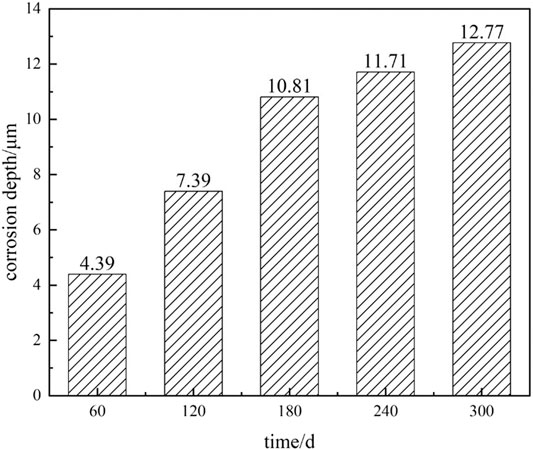
FIGURE 15. Relationship between the corrosion depth and time after CA simulation.
Figure 16 shows the comparison of experimental and simulated corrosion morphologies of 250 time steps and 30 days, 500 time steps and 60 days, and 1,500 time steps and 180 days, respectively. As can be observed, there is a high similarity between the simulation results and the experimental results.
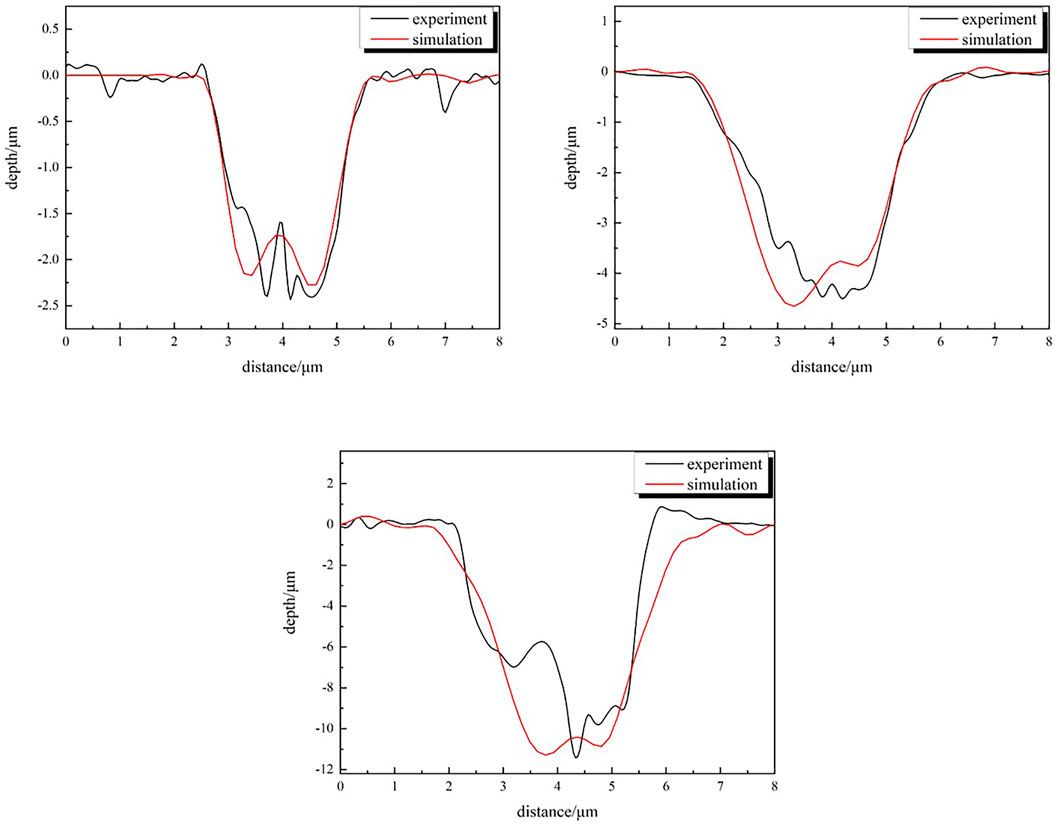
FIGURE 16. Comparison of CA simulation and actual corrosion morphology at different times. (A) 30 days, (B) 60 days, (C) 180 days.
The corrosion damage behavior of the X65/Incoloy 825 bimetal composite pipe in H2S medium was studied by microstructure analysis, corrosion immersion test, and corrosion cellular automata simulation; the primary conclusions are listed as follows:
1) The content of Cr, Ni, Mo, Nb, and other corrosion-resistant elements in the welding seam of the bimetallic composite pipe is high. The composition segregation occurs in the welding process, and the Laves phase appears between dendrites, which lead to the decrease in corrosion resistance.
2) The exponential relationship between the corrosion depth and the corrosion time of the bimetal pipe weld joint is
3) The CA model was established based on the corrosion test results, and the CA prediction was in good agreement with the corrosion pit depth results obtained from the corrosion immersion test. The corrosion pit depth after 300 days is predicted to be 12.77 μm.
The original contributions presented in the study are included in the article/Supplementary Material; further inquiries can be directed to the corresponding author/s.
BW proposed the research topic and designed the research scheme and the article framework. TZ was in charge of writing the article. YL was responsible for the research, literature, and experimental data processing. GC provided guidance and support.
The authors gratefully acknowledge the support from the Fundamental Research Funds for the Central Universities (18CX05002A) and the Natural Science Foundation of Shandong Province (ZR2019MEE108).
The authors declare that the research was conducted in the absence of any commercial or financial relationships that could be construed as a potential conflict of interest.
All claims expressed in this article are solely those of the authors and do not necessarily represent those of their affiliated organizations, or those of the publisher, the editors and the reviewers. Any product that may be evaluated in this article, or claim that may be made by its manufacturer, is not guaranteed or endorsed by the publisher.
Ahmed, N., Bakare, M. S., McCartney, D. G., and Voisey, K. T. (2010). The Effects of Microstructural Features on the Performance gap in Corrosion Resistance between Bulk and HVOF Sprayed Inconel 625. Surf. Coat. Tech. 204 (14), 2294–2301. doi:10.1016/j.surfcoat.2009.12.028
Ahn, J.-H., Jeong, Y.-S., Kim, I.-T., Jeon, S.-H., and Park, C.-H. (2019). A Method for Estimating Time-dependent Corrosion Depth of Carbon and Weathering Steel Using an Atmospheric Corrosion Monitor Sensor. Sensors 19 (6), 1416–1425. doi:10.3390/s19061416
Bakare, M. S., Voisey, K. T., Roe, M. J., and McCartney, D. G. (2010). X-ray Photoelectron Spectroscopy Study of the Passive Films Formed on Thermally Sprayed and Wrought Inconel 625. Appl. Surf. Sci. 257 (3), 786–794. doi:10.1016/j.apsusc.2010.07.066
Bataillon, C., Bouchon, F., Chainais-Hillairet, C., Fuhrmann, J., Hoarau, E., and Touzani, R. (2012). Numerical Methods for the Simulation of a Corrosion Model with Moving Oxide Layer. J. Comput. Phys. 231 (18), 6213–6231. doi:10.1016/j.jcp.2012.06.005
Bunaziv, I., Olden, V., and Akselsen, O. M. (2019). Metallurgical Aspects in the Welding of Clad Pipelines-A Global Outlook. Appl. Sci. 9 (15), 3118. doi:10.3390/app9153118
Caleyo, F., Velázquez, J. C., Valor, A., and Hallen, J. M. (2009). Probability Distribution of Pitting Corrosion Depth and Rate in Underground Pipelines: A Monte Carlo Study. Corrosion Sci. 51 (9), 1925–1934. doi:10.1016/j.corsci.2009.05.019
Caprio, D. D., and Stafiej, J. (2011). The Role of Adsorption in Passivation Phenomena Modelled by Discrete Lattice Gas Automata[J]. Electrochimica Acta 56 (11), 3963–3968. doi:10.1016/j.electacta.2011.02.018
Chou, Y. L., Yeh, J. W., and Shih, H. C. (2010). The Effect of Molybdenum on the Corrosion Behaviour of the High-Entropy Alloys Co1.5CrFeNi1.5Ti0.5Mox in Aqueous Environments. Corrosion Sci. 52 (8), 2571–2581. doi:10.1016/j.corsci.2010.04.004
Cieslak, M. J., Knorovsky, G. A., Headley, T. J., and Romig, A. D. (1989). The Solidification Metallurgy of alloy 718 and Other Nb-Containing Superalloys[J]. Superalloy 718, 59–68. doi:10.7449/1989/superalloys_1989_59_68
Cooper, K. P., Slebodnick, P., and Thomas, E. D. (1996). Seawater Corrosion Behavior of Laser Surface Modified Inconel 625 alloy. Mater. Sci. Eng. A 206 (1), 138–149. doi:10.1016/0921-5093(95)10013-x
Córdoba-Torres, P., Nogueira, R. P., De Miranda, L., Brenig, L., Wallenborn, J., and Fairén, V. (2001). Cellular Automaton Simulation of a Simple Corrosion Mechanism: Mesoscopic Heterogeneity versus Macroscopic Homogeneity. Electrochimica acta 46 (19), 2975–2989. doi:10.1016/s0013-4686(01)00524-2
Cuevas-Arteaga, C., Verhelst, D., and Alfantazi, A. (2010). Performance of alloy 625 under Combustion Gas Environments: a Review[J]. ECS Trans. 28 (24), 61–76. doi:10.1149/1.3496422
Cui, C., Ma, R., Chen, A., Pan, Z., and Tian, H. (2019). Experimental Study and 3D Cellular Automata Simulation of Corrosion Pits on Q345 Steel Surface under Salt-spray Environment. Corrosion Sci. 154, 80–89. doi:10.1016/j.corsci.2019.03.011
Di Caprio, D., Vautrin-Ul, C., Stafiej, J., Saunier, J., Chaussé, A., Féron, D., et al. (2011). Morphology of Corroded Surfaces: Contribution of Cellular Automaton Modelling. Corrosion Sci. 53 (1), 418–425. doi:10.1016/j.corsci.2010.09.052
Frankel, G. S. (1998). Pitting Corrosion of Metals: A Review of the Critical Factors. J. Electrochem. Soc. 145 (6), 2186–2198. doi:10.1149/1.1838615
Gill, A., Telang, A., Mannava, S. R., Qian, D., Pyoun, Y.-S., Soyama, H., et al. (2013). Comparison of Mechanisms of Advanced Mechanical Surface Treatments in Nickel-Based Superalloy. Mater. Sci. Eng. A 576, 346–355. doi:10.1016/j.msea.2013.04.021
Guo, Q., Li, Y., Qian, J., Yu, H.b., and Chen, C.f. (2017). Study of the Pitting Corrosion at Welding Joints of Inconel 625 alloy under High Temperature and High H2S/CO2 Partial Pressure. Int. J. Electrochem. Sci. 12, 8929–8943. doi:10.20964/2017.10.46
Neville, A., Reyes, M., Hodgkiess, T., and Gledhill, A. (2000). Mechanisms of Wear on a Co-base alloy in Liquid-Solid Slurries. Wear 238 (2), 138–150. doi:10.1016/s0043-1648(99)00357-9
Saunier, J., Chaussé, A., Stafiej, J., and Badiali, J. P. (2004). Simulations of Diffusion Limited Corrosion at the Metal|environment Interface. J. Electroanalytical Chem. 563 (2), 239–247. doi:10.1016/j.jelechem.2003.09.017
Silva, C. C., Miranda, H. C. D., Motta, M. F., Farias, J. P., Afonso, C. R. M., and Ramirez, A. J. (2013). New Insight on the Solidification Path of an alloy 625 weld Overlay. J. Mater. Res. Tech. 2 (3), 228–237. doi:10.1016/j.jmrt.2013.02.008
Xu, F. J., Lv, Y. H., Xu, B. S., Liu, Y. X., Shu, F. Y., and He, P. (2013). Effect of Deposition Strategy on the Microstructure and Mechanical Properties of Inconel 625 Superalloy Fabricated by Pulsed Plasma Arc Deposition. Mater. Des. 45, 446–455. doi:10.1016/j.matdes.2012.07.013
Zahrani, E. M., and Alfantazi, A. M. (2014). High Temperature Corrosion and Electrochemical Behavior of INCONEL 625 weld Overlay in PbSO4-Pb3O4-PbCl2-CdO-ZnO Molten Salt Medium[J]. Corrosion Sci. 85, 60–76. doi:10.1016/j.corsci.2014.03.034
Keywords: bimetallic composite pipe, welded joint, microstructure, corrosion damage, cell automata model
Citation: Wang B, Zhang T, Liu Y and Cui G (2021) Corrosion Damage Behavior of X65/Incoloy 825 Welded Bimetallic Composite Pipe in H2S Environment. Front. Mater. 8:709101. doi: 10.3389/fmats.2021.709101
Received: 13 May 2021; Accepted: 02 July 2021;
Published: 09 August 2021.
Edited by:
Yong Hua, University of Leeds, United KingdomReviewed by:
Baoming Gong, Tianjin University, ChinaCopyright © 2021 Wang, Zhang, Liu and Cui. This is an open-access article distributed under the terms of the Creative Commons Attribution License (CC BY). The use, distribution or reproduction in other forums is permitted, provided the original author(s) and the copyright owner(s) are credited and that the original publication in this journal is cited, in accordance with accepted academic practice. No use, distribution or reproduction is permitted which does not comply with these terms.
*Correspondence: Bingying Wang, dGR3YnkyMDA0QDEyNi5jb20=
Disclaimer: All claims expressed in this article are solely those of the authors and do not necessarily represent those of their affiliated organizations, or those of the publisher, the editors and the reviewers. Any product that may be evaluated in this article or claim that may be made by its manufacturer is not guaranteed or endorsed by the publisher.
Research integrity at Frontiers
Learn more about the work of our research integrity team to safeguard the quality of each article we publish.