 Yunbin Ke1
 Zhenliang Jiang
95% of researchers rate our articles as excellent or good
Learn more about the work of our research integrity team to safeguard the quality of each article we publish.
Find out more
ORIGINAL RESEARCH article
Front. Mater. , 10 June 2021
Sec. Mechanics of Materials
Volume 8 - 2021 | https://doi.org/10.3389/fmats.2021.705453
This article is part of the Research Topic Spotlight on China - Materials Science View all 14 articles
This study developed a discrete element simulation model based on the 2D particle flow code (PFC2D), of which the mesoscopic parameters were calibrated by the indoor experiments, to investigate the rainfall erosion damage of residual soil slope in the intermittently frozen area. It is to be noted that the runoff scouring action was simulated according to the equivalent rainfall method, the soil particles on the slope were given initial velocity, and the water absorption was considered by increasing the unit weight. The results indicated that the scouring action only caused superficial erosion with the main damage region at the foot, regardless of the FT effect. A splitting phenomenon was observed in the lower part of the steeper slope under the FT effect. Moreover, regardless of the FT effect, the gentler slope tended to incur spalling rather than a splitting phenomenon, where the soil particles slid along the structural plane with strong anti-scouring ability. Besides, the gentler slope maintained higher stability and shorter scouring time. Finally, the scouring velocity increased the erosion damage to a large extent.
The intermittently frozen area was defined as an area where the near-surface soil is frozen annually from one to fifteen days per year (Willmott and Matsuura, 2001; Zhang et al., 2003; Chen, et al., 2020). Intermittently frozen areas are widely distributed in the world, accounting for 6.6% of the exposed lands in the coldest month of the year in the Northern Hemisphere (Baranov, 1964; Zhang et al., 2003; Lu et al., 2017). Taking China, for example, it is mostly distributed in the south of the Yangtze River and the north of the Pearl River Basin, covering an area of about 1.9 million square kilometers and accounting for about 20% of the total national area (Que et al., 2017; Que et al., 2021).
Compared with the permafrost and seasonal frozen soils, the intermittently frozen soil experiences high-frequency freeze–thaw cycles, resulting from the frequently fluctuated ambient temperature around the freezing point (Woo and Winter, 1993; Chen and Li, 2008; Thomas et al., 2009). It should be noted that Que et al. (2017) observed 16 freeze–thaw times a day in December 2013 to mid-February 2014 in Wuyi Mountain, Fujian Province, China. Usually, it will experience superficial spalling occurring on the soil slope, especially under the influence of continuous rainfall or rainstorm. That might develop the instability of soil further, causing potential safety problems and economic loss to the vehicles and pedestrians along with the projects (Que et al., 2017; Li, 2013). Therefore, there is a great need to study further the strength reduction of soil slopes under the short-term freeze–thaw cycle and the mechanism of superficial spalling induced by rainfall erosion.
Recently, the discrete element technique, like particle flow code (PFC) (Zhang et al., 2013; Liang et al., 2017; Wang et al., 2020; Wang et al., 2021), has been found to be suitable for not only dealing with large deformation discontinuity problems but also illustrating the force and motion pattern from the mesoscopic scale (Li et al., 2013; Saman et al., 2014; Shi and Xu, 2015; Xu, 2017; Zhang, 2017; Wang et al., 2021). Hence, it has been currently used in geotechnical engineering, including the superficial freeze–thaw spalling of slope (Evans et al., 2009; Park and Song, 2009; Zhu et al., 2021).
Several studies have been carried out on the erosion of the slope surface caused by rainfall through PFC. Tsuji et al. (1993) introduced computational fluid dynamics to the discrete element method and verified the reliability of the fluid–solid coupling analysis method in simulating two-phase flows using discrete elements. Zeghal and Shamy (2005) implemented the fluid–solid coupling analysis method to analyze saturated sand, which simplified the N-S equation and by which the seepage problem of the soil slope was investigated. Based on this, Bai et al. (2012) determined the permeability coefficient for the PFC method. Xiong et al. (2013) performed a three-dimensional simulation of the rainfall slope collapse by fluid–solid coupling analysis, where the rainfall was simulated by applying pressure on the boundary. The results manifested that it was feasible to study the collapse formation mechanism via PFC using the fluid–solid coupling methods. Song (2013) and Wu et al. (2014) analyzed the evolution process of slope erosion and the distribution of slope erodibility by using the aforementioned method. Hu (2014) performed the rainfall equivalent via increasing the gravity and reducing shear strength, but the strength-reduced parameters were not calibrated. Ma (2012) and Wu et al. (2013) carried out an erosion failure simulation of steep slopes via a two-dimensional PFC (PFC2D) model, where the effect of runoff scouring was simulated by the particles’ movement on the slope surface.
Overall, it can be found that rainfall erosion can be simulated through the fluid–solid coupling analysis method via PFC. However, most studies were limited to the saturated soil. There is no research related to the rainfall equivalent method. Besides, the parameter effects are still unclear either, such as slope gradient, freeze–thaw, and scouring velocity.
To fulfill this gap, this paper carries out an in-depth study about the effects of rainfall erosion damage of residual soil slope in the intermittently frozen area. Specifically, this paper addresses three questions: How to build a slope scouring model? What are the basic effects of scouring on the slope? How the slope gradient, freeze–thaw action, and scouring velocity affect the erosion damage? The objective of the present study is threefold: 1) to build a PFC2D scouring model, where the mesoscopic parameters are calibrated by indoor experiments, 2) to investigate the basic characteristics of slope under the runoff erosion, and 3) to perform parameter effects on the rainfall erosion, including slope gradient, freeze–thaw action, and scouring velocity.
As shown in Figure 1, in order to investigate the effects of freeze–thaw on erosion damage of the residual soil slope induced by rainfall, the indoor test and PFC2D simulation are performed in depth. First, the freeze–thaw experiments are conducted to verify the feasibility of the PFC simulating models by comparing the stress–strain curves. At the same time, the details of the two aforementioned experiments will be fully presented, especially the numeric scouring model. Then, based on the PFC2D models of which the mesoscopic parameters were calibrated, both the basic behaviors and the parameter effects of scouring action on the slope are going to be thoroughly analyzed, including the slope morphology, contact, and denudation amount. Finally, a discussion will be made on the mechanism of freeze–thaw on erosion damage of the residual soil slope induced by rainfall.

FIGURE 1. Experimental design.
The soil samples were taken from the site where the spalling disease occurred. The basic physical properties of the soil samples are natural moisture content (w), density (ρ), dry density (ρd), specific gravity (Gs), void ratio (e), porosity (n), liquid limit (wL), plastic limit (wp), liquidity index (IL), and plasticity index (Ip), whose values are 19.6%, 1.78 g/cm3, 1.49 g/cm3, 2.655, 0.76, 43.22%, 33.4%, 19.6%, 0.01, and 13.79, respectively. The mass percentage of each soil grain size (gradation) >5 mm, 2–5 mm, 1–2 mm, 0.5–1 mm, 0.25–0.5 mm, 0.075–0.25 mm, 0.03–0.075 mm, 0.01–0.03 mm, and <0.01 mm is 3.94, 7.98, 3.92, 12.71, 11.14, 13.35, 20.51, 19.42, and 7.03, respectively.
The water content of samples is set at 21.5%, and the dry density is 1.49 g/cm3. The testing temperature range is −7–15°C. The FT cycles were set under 0, 2, 4, 6, and 8 times. The water supplement was conducted at the sealed condition. It is to be noted that the triaxial shear test was performed under the consolidated drainage condition. The temperature range was determined according to the field detection and the historical record.
The specimens were prepared according to JTG E40-2007 (Research Institute of Highway Science, 2010). It is noted that the soil was screened by a 2 mm sieve in order to maintain the homogeneity and the similarity of the initial soil structure. The mass percentage of each soil grain size (gradation) 1–2 mm, 0.5–1 mm, 0.25–0.5 mm, 0.075–0.25 mm, 0.03–0.075 mm, 0.075–0.03 mm, and <0.075 mm is 4.45, 14.43, 12.66, 15.17, and 53.29, respectively.
The equipment utilized in this research is TCK-1, which was produced by Nanjing Soil Instrument Co., Ltd. To avoid misoperation, five specimens were prepared for each group. Three of them were used for shear tests under different confining pressures (100, 150, 200 kPa), and the other two were set as a standby.
In PFC2D simulation, the porosity can be converted from the practical soil model by an empirical equation (He et al., 2014). Wang believed that the parabolic modes seemed to be more appropriate after performing the comparison between several methods (Wang et al., 2014). By using the same approach in this research, shown in the following equation, the converted porosity is 18.65%:
where p2D and p3D are the porosity in 2D and 3D, respectively.
The dimension of the specimen is 32 mm × 15.64 mm, the soil particle radius is set between 0.65 and 1.3 mm, and the density is 2,655 kg/m3. The model consists of two pairs of rigid walls: the vertical panel that is applying the load in the vertical direction and the servo panel that is controlling pressure on the lateral side of the specimen.
Contact models. Two models were utilized to consider the bonding and debonding conditions of the contacts between particles. For contacts that have not yet broken, it is widely accepted that the contact model is much more appropriate in simulating the clay material in this case. However, the opinions about which model is more appropriate are diverse, although the accuracy of the stress and strain curves from the default model is extensively acknowledged in the debonding case.
In most studies, the linear contact model is selected as the default model. However, it was found that increasing the inter-particle friction cannot change the peak strength of the specimen, which was similar to that in the studies performed by Skinner (1969) and Oda et al. (1982). However, Suiker and Fleck (2004) and Thornton (2000) believed that it could be explained by particle rolling, which is also supported in this paper. It has been acknowledged that the rotational velocity will be enormous while the material reaches its yield point. This shows a rolling effect on the surface, which undoubtedly reduces the friction coefficient. Thus, the established rotation resistance linear model (rrlinear) was selected as the default model (Iwashita and Oda, 1998; Iwashita and Oda, 2000; Jiang et al., 2005; Jiang et al., 2009; Liu et al., 2013).
Boundary. The flexible boundary condition was achieved by setting the lateral wall stiffness 1/10 of the particle stiffness, while the vertical wall stiffness was the same as that of the particles.
The stress–strain curves of the simulated and experimental results are shown in Figures 2A,B. It can be found that the correlation between these two curves is very high before the peak shear strength. Although both curves tend to decrease first and then remain unchanged after the peak value, the simulated curves seem to decrease rapidly at the initial stage after the peak strength (generally around 4% axial strain). And then, they remain basically unchanged, and the final residual strength is also lower than that in the testing curves. This is mainly due to the complicated nature of the size, shape, distribution, and stress characteristics of the practical soil particles, and the residual strength is provided by friction and structural occlusion force. Additionally, the particles are two-dimensional discs in the 2D simulation, where the point-type inter-particle contacts tended to slip under high force, which resulted in the attenuation of the residual strength.
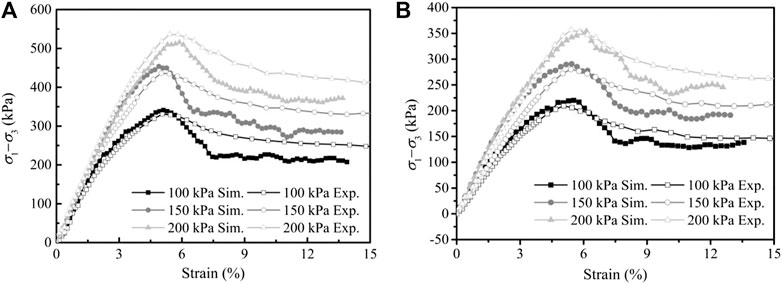
FIGURE 2. Stress–strain curves of the simulated and experimental results. (A) Before FT. (B) After FT. Note: “After FT” means the soil experienced eight times of freeze–thaw action, of which the damage was the most serious (Fu, 2017).
As shown in Figure 3, two slope models with a gradient of 45° and 60° were established. According to the study performed by Ni et al. (2000), changing the particle size appropriately has little effect on the simulation results. Besides, by integrating the operation ability of the computer and the running timing of the model, the radius of the soil particles was determined in a range from 0.1625 to 0.325 mm. Finally, 9,124 and 8,057 particle elements were generated in the 60° and 45° slopes, respectively.
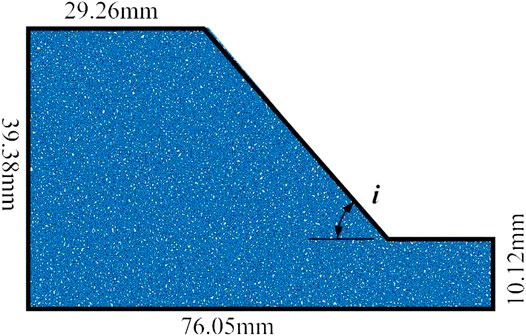
FIGURE 3. Slope model (i = 45°).
Generally, the simulation of equivalent rainfall is realized by changing the macroscopic and mesoscopic parameters of soil. For example, Hu et al. increased gravity and reduced the shear strength of soil to consider the effect of rainfall. Wu et al. carried out simulations by altering the mesoscopic soil parameters to simulate the moisture content change during the process of rainfall. Moreover, Ma et al. performed the slope erosion failure induced by rainfall by giving velocity to the particles on the slope surface via PFC2D.
Therefore, in order to simulate the equivalent rainfall scouring process more precisely, this study improves the method proposed by Ma (2012) in two aspects. On the one hand, the soil particles on the slope are given an initial velocity; on the other hand, the water absorption was considered by increasing the unit weight of soil particles. Specifically, the scouring process can be generally divided into the following four steps. Firstly, the generation and gravity balance of the soil particles are performed. Then, the allocation of the contact models is carried out based on the freeze–thaw zoning. Here, it was assumed that the width of the freeze–thaw zone (Zone B) accounts for 1/10 of the total width of the top of the slope. After that, the identification of the surface particles is made by the programmed codes. Finally, the walls are going to be removed, and the velocity and the extra gravity will be imposed on the surface particles.
Scouring velocity. When setting the scouring velocity, the particles will impact each other and bump away from the slope under high velocity; on the contrary, it does not work due to the cohesion between the particles. After repeated trials, a scouring velocity of 0.1 m/s was determined. In this study, the velocity is also variable to discuss the influence of flow velocity on the slope stability. Due to the change in direction of particle motion after collision, it is impossible to apply a constant flow velocity to the slope particles at present. Hence, only the influence of single scouring action on the slope stability will be discussed here.
Terminal condition. The original balance of superficial soil particles is broken under scouring, and the particles begin to move down the slope with water flow until a new balance is reached, where the movement of the particle is nearly stationary. After several trials, it is found that when the operation reaches 2.5 million cycles, the particles are stationary, and the maximum velocity is less than 1e-3 m/s. Therefore, the terminal condition was set when the total cycles reached 2.5 million times.
The simulation scheme and main parameters are set, as shown in Table 1.
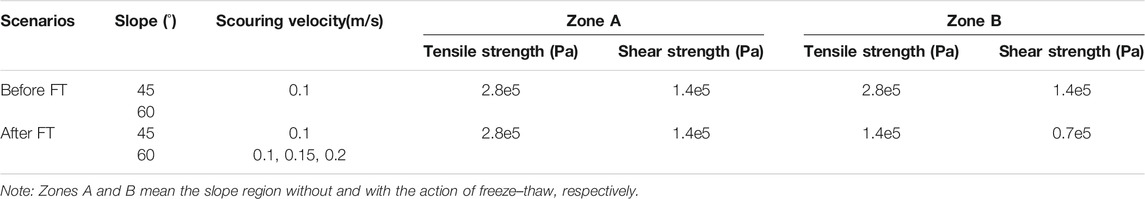
TABLE 1. Simulation scheme and main parameters.
As shown in Figure 4, in order to distinguish easily, the slope is evenly divided into six layers by colors from top to bottom according to height. It can be found that only the shallow layer of the slope was destroyed after being scoured, while the other parts of the slope were not deformed. It is to be noted that the gray background represents the initial slope area, which does not participate in the calculation.
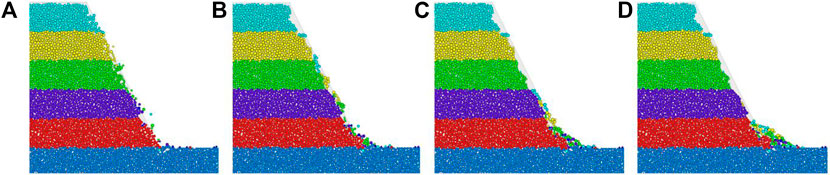
FIGURE 4. Superficial erosion process of the 60° slope (before FT). (A) 0.1, (B) 0.8, (C) 1.5, and (D) 2.5 (×million steps).
From Figures 4A–D, it can be found that the runoff only caused damage to the slope surface, leaving a little slide of soil particles, candle holes, and cavity prototypes at the top and foot of the slope. Besides, the particles at the slope foot are first washed and denuded and then accumulated on the slope feet, thereby making the soil in the upper layer in an unbalanced state to move downward. And then, under the continuous action of runoff shearing force, the shallow soil particles on the upper slope are gradually eroded, resulting in the particles in the deeper layer being disturbed and slid down along the structural surface with higher erosion resistance and accumulation at the foot of the slope, which finally can be called the spalling phenomenon.
The contacts between particles can be illustrated in Figures 5A–D. As noted, the contacts in blue and red represent the initial and the default anti-rotation contact model, respectively. It can be found that most of the particles slide and pile up at the foot of the slope, which is in good agreement with the aforementioned slope morphology. Besides, the rotation resistance model is the major contact model of spalling fragments, which indicates that the spalling objects are non-sticky and loose soil granules. This is in line with the practical field investigation. However, part of them still obey the contact-bonding model, which is mainly due to the scouring effect that destroyed the soil structure at the weakest point of anti-scouring ability, avoiding the contact model there, which can be classified as fragmentary spalling.
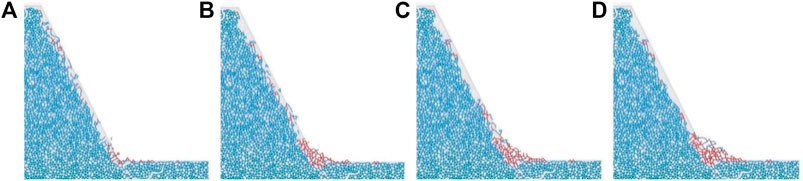
FIGURE 5. Contact distribution of soil particles under scouring. (A) 0.1, (B) 0.8, (C) 1.5, and (D) 2.5 (×million steps).
The rotation angle of the particles is near zero when the soil structure is stable, while it increases when being spalled. Here, it is assumed that the contacts of soil particles have been denuded when the finial absolute rotation angle is greater than 0.5°. Therefore, by monitoring the particle rotation angle, the damage degree of the superficial slope can be quantified. It can be seen from Table 2 that, under runoff scouring, the amount of each layer is sorted as the foot (fifth layer) > top layer (first layer) > fourth layer > third layer > second layer, indicating that the most of the spalling occurred at the lower part of the slope.
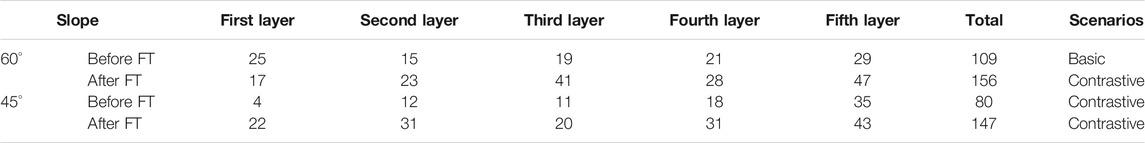
TABLE 2. Denudation amount.
The erosion failure process of the 45° slope before the FT effect is shown in Figures 6A–D. As noted, the scouring time of the 45° slope is shorter than that of the steeper one (60° slope). For example, the shape of the 45° slope changes slightly after 0.8 M steps, while the shape change of the 60° slope can still be observed at 2.5 M steps. This is mainly because the scouring force was counteracted by adhesion and friction between the particles, leaving the particles of the 45° slope to maintain a stable state more easily. This indicates that the slope gradient has a significant influence on stability under the action of runoff scouring, and the smaller slope has a stronger anti-scouring ability.
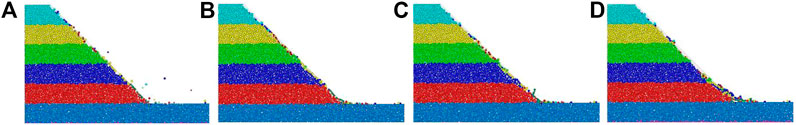
FIGURE 6. Surperfical erosion process of the 45° slope (before FT). (A) 0.1, (B) 0.8, (C) 1.5, and (D) 2.5 (×million steps).
The denudation amount of 45° and 60° slopes is shown in Table 2. As noted, it is evident that the amount of spalling particles was decreased significantly under the lower gradient slope, while the amount of each layer was the same as that of the steeper slope.
The erosion failure process of 45° and 60° slopes after the FT effect is shown in Figures 7A–H from a to d and e to h, respectively. Compared with Figures 4, 6, it can be found that, at the initial stage of erosion (within 0.8 M steps), the runoff only caused damage to the slope surface both with and without the FT effect. Moreover, in the middle and late stages (after 0.80 M steps), considering the FT effects, the particles cut into the lower layer of soil rather than rolling down under scouring action, resulting in a splitting effect on the shallow particles in the lower slope. The split blocks are dispersed into smaller blocks and particles under the scouring effect and then piling up at the foot of the slope. The underlying reason for splitting was the poor cohesion among soil particles in the freeze–thaw zone. When the runoff was wrapping up the soil particles and moving downward, the soil in that zone was likely to be punched, and the phenomenon tended to occur.
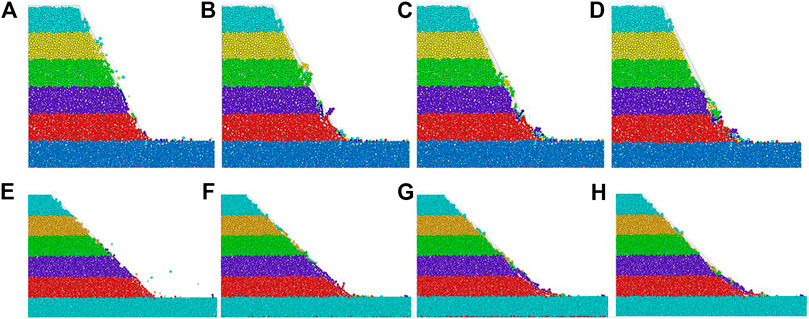
FIGURE 7. Spalling process of slopes (after FT). (A–D) are for 60° slope and (E–H) are 45° slope. (A–D) and (E–H) refer to numerical steps under 0.1, 0.8, 1.5, and 2.5, respectively (× million).
Besides, in the final stage (above 2.5 M steps), the slope foot was damaged more significantly with the action of FT, which can be ascribed to the stress concentration at the foot of the slope. So, the particles deformed more largely under frequent FT disturbances. Finally, compared to the 60° slope, the impacts of runoff scouring on the 45° slope are quite limited on the top, regardless of the FT effect. During this process, the splitting from the upper layer soil to the lower does not occur.
The denudation of 45° and 60° slopes is shown in Table 2. As noted, it is evident that the number of spalling particles was increased significantly after considering the FT effect, which can be seen from the increased total number of 45° and 60° slopes by 147 and 156, rising 83.75 and 43.1%, respectively. Besides, the FT effect has a larger impact on the lower parts of the slope. For example, the denudation amount in the fourth and fifth layers of the slope considering the FT effect is much larger than that without.
In order to detect the FT effect on the particle movement at different locations during the scouring process, three measurement spheres were selected on the 60° slope to record the position changes under different conditions, as shown in Figure 8, and the corresponding trajectories are presented in Figures 9A–C. It can be found that the soil particles on the lower layer of the slope surface reach the steady state first than those on the upper layer. This is mainly due to the shorter movement distance of the former particles, resulting in smaller potential energy, which is faster dissipated by the bonding and friction between the particles. Besides, when considering the FT effect, the spheres (5,247 and 649) located on the upper and middle layers reach a steady state faster than those without. The reason is that the adhesion between the particles of the shallow soil after the FT effect is reduced, leaving less kinetic energy needed to be consumed to destroy the contacts between the particles. Finally, the time of the sphere (5,529) located on a lower layer to reach the steady state is the same in both scenarios. However, when considering the FT effect, the particles move first downward and then upward, which indicates particles at the foot move more actively.
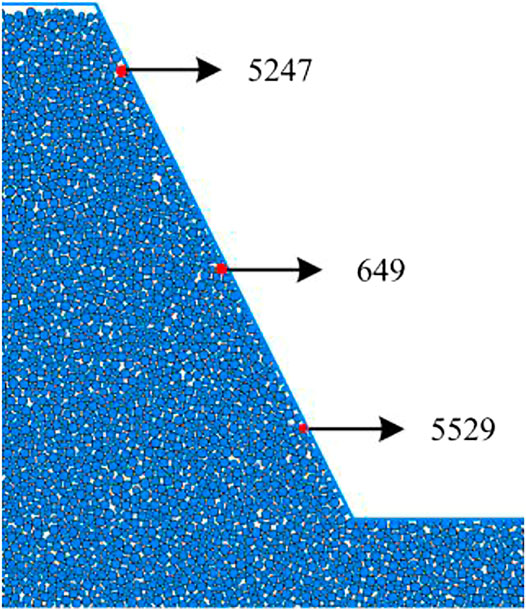
FIGURE 8. Monitoring spheres on the slope surface.
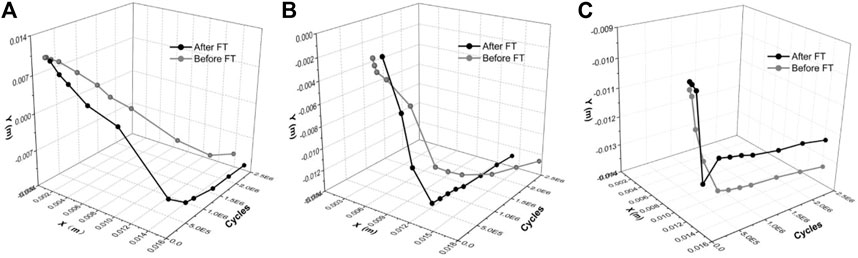
FIGURE 9. Trajectories of different monitoring points. (A), (B), and (C) are for 5,247, 649, and 5,529 measuring spheres, respectively.
The effects, including morphology and contact distribution, under different scouring velocities (0.1, 0.15, and 0.2 m/s) on a 60° slope, are shown in Figures 10A–C, 11A–C. As noted, the contact model distribution is clearer in demonstrating the spalling process of the slope. It can be found that although the velocity does not affect the type of slope failure, it impacts diversely on the foot of the slope, showing an increasing pit size at the foot under greater velocity.
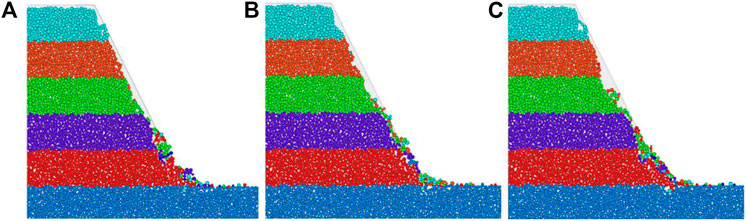
FIGURE 10. Morphology under different scouring velocities of the 60° slope. (A) 0.1, (B) 0.15, and (C) 0.2 m/s.
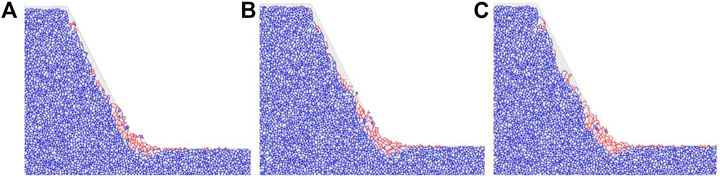
FIGURE 11. Contact distribution under different scouring velocities of the 60° slope. (A) 0.1, (B) 0.15, and (C) 0.2 m/s.
The denudation amount of each layer under the FT effect is shown in Table 3. It can be found that the denudation amount increases significantly as the velocity is increased. With the increase in velocity, the denudation amount of particles in the top layer (the first layer) of the slope is unchanged, while that in the lower layer increases gradually. The reason for that is the flow was only loaded once rather than continuously, leaving short disturbance time to the top layers and producing shallow superficial spalling in the lower layer. Increasing the velocity resulted in a larger erosion load on the lower surface. So, the erosion amount increases gradually.
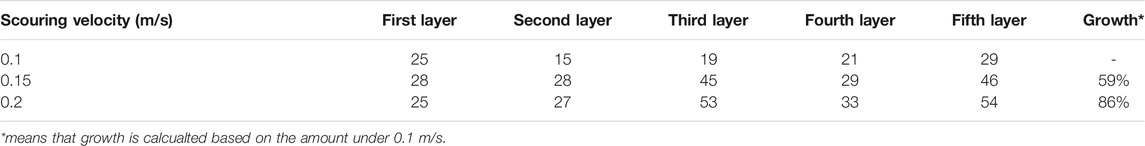
TABLE 3. Denudation amount of the 60° slope under the FT effect.
A PFC2D scouring model, of which the mesoscopic parameters were calibrated by the indoor experiments, was developed to investigate the rainfall erosion damage of residual soil slope in the intermittently frozen area. The main conclusions are addressed in the following three aspects:
• At the beginning of erosion, only the slope surface was damaged under both with and without the FT effect. And then, the splitting phenomenon was observed rather than rolling down in the middle and late stages. The most damaged part was at the foot, as was more evident under the action of FT in the final stage. Moreover, the FT effect caused less damage to the gentler slope.
• The denudation amount of spalling particles was increased significantly after considering the FT effect. Finally, regardless of the FT effect, the particles in the lower layer reached the stable state first, and the time was the same under these two conditions.
• The pit size at the foot and the denudation amount were both increased under higher scouring velocity.
The future study will focus on the development of more realistic contact models and computing effective methods, which facilitate revealing the freeze–thaw effect on the slope surface. Besides, the coupling effects of water flow and soil particle movement on slope stability will also be explored.
The original contributions presented in the study are included in the article/Supplementary Material, and further inquiries can be directed to the corresponding author.
ZJ and YK conceptualized the idea. YK performed the methodology. ZJ and YC ran the software. YK, YC, ZJ, and YQ wrote the original draft.
The author YQ was employed by Zijin Mining Group Co., Ltd.
The remaining authors declare that the research was conducted in the absence of any commercial or financial relationships that could be construed as a potential conflict of interest.
Bai, R. X., Chen, X. S., and Zheng, G. (2012). Study on Microcosmic Parameters of Soil Permeability Coefficient Particle Flow. Low Temp Archit Technol. 34 (1), 64–67. doi:10.3969/j.issn.1001-6864.2012.01.028
Baranov, I. Y. (1964). Geographical Distribution of Seasonally Frozen Ground and Permafrost. National research council of Canada. Division of Building Research. doi:10.4224/20359041
Chen, B., and Li, J. P. (2008). Characteristics of Spatial and Temporal Variation of Seasonal and Short- Term Frozen Soil in China in Recent 50 Years. Chin. J. Atmos. Sci. 32 (3), 432–443. doi:10.3724/SP.J.1148.2008.00288
Chen, J., Wu, Y., O'Connor, M., Cardenas, M. B., Schaefer, K., Michaelides, R., et al. (2020). Active Layer Freeze-Thaw and Water Storage Dynamics in Permafrost Environments Inferred from InSAR. Remote Sensing Environ. 248, 112007. doi:10.1016/j.rse.2020.112007
Evans, M. T., Chall, S. L., Zhao, X. L., and Rhyne, T. M. (2009). Visualization and Analysis of Microstructure in Three-Dimensional Discrete Numerical Models. J. Comput. Civil Eng. 23 (4), 277–287. doi:10.1061/(ASCE)0887-380110.1061/(asce)0887-3801(2009)23:5(277)
Fu, Y. S. (2017). Study on the Mechanism of Shallow Surface Spalling of Residual Soil Slope in Short Time Frozen Area. Fuzhou University.
He, Y. R., Zhu, S., and Wu, L. Q. (2014). Research on the Corresponding Relationship between Two-Dimensional Porosity and Three-Dimensional Porosity of Coarse Materials. Water Power 40 (5), 27–29. doi:10.3969/j.issn.0559-9342.2014.05.008
Hu, Z. R. (2014). The Granular Flow Analysis for Volume Change Characteristics of Gravel Soil Slope the under Equivalent Rainfall Infiltration. Xiangtan: Xiangtan University.
Iwashita, K., and Oda, M. (2000). Micro-deformation Mechanism of Shear Banding Process Based on Modified Distinct Element Method. Powder Tech. 109 (1-3), 192–205. doi:10.1016/S0032-5910(99)00236-3
Iwashita, K., and Oda, M. (1998). Rolling Resistance at Contacts in Simulation of Shear Band Development by DEM. J. Eng. Mech. 124 (3), 285–292. doi:10.1061/(ASCE)0733-939910.1061/(asce)0733-9399(1998)124:3(285)
Jiang, M. J., Li, X. M., Sun, Y. G., and Hu, H. J. (2009). Discrete Element Simulation of Biaxial Compression Test Considering Rolling Resistance. Rock Soil Mech. 30 (z2), 514–517. doi:10.16285/j.rsm.2009.s2.108
Jiang, M. J., Yu, H.-S., and Harris, D. (2005). A Novel Discrete Model for Granular Material Incorporating Rolling Resistance. Comput. Geotechnics 32 (5), 340–357. doi:10.1016/j.compgeo.2005.05.001
Li, S. B., Wang, C. M., Wang, N. Q., Wang, G. C., and Yao, K. (2013). Numerical Simulation of Loess Triaxial Shear Test by PFC3D. China J. Highw. Transport 26 (06), 22–29. doi:10.19721/j.cnki.1001-7372.2013.06.004
Li, Z. Y. (2013). Instable Mechanism of Granite Residual Soil Slope in Intermittently Frozen Soil Area. Fuzhou: Fuzhou University.
Liang, J. X., Hu, X. W., and Xu, X. J. (2017). Particle Flow Simulation of Earthquake Induced Deformation Failure of Soil Slopes with Different Geological Factors under Earthquake. J. Eng. Geology. 25 (06), 1537–1546. doi:10.13544/j.cnki.jeg.2017.06.017
Liu, Y. M., Yang, C. H., Huo, Y. S., Li, L., Xu, Y. L., and Du, C. (2013). Discrete Element Modeling of Behaviors of Coarse Grained Soils Considering Rolling Resistance. Rock Soil Mech. 34 (S1), 486–493. doi:10.16285/j.rsm.2013.s1.023
Lu, Q., Zhao, D., and Wu, S. (2017). Simulated Responses of Permafrost Distribution to Climate Change on the Qinghai-Tibet Plateau. J. Scientific Rep. 7 (1), 3845. doi:10.1038/s41598-017-04140-7
Ma, D. H. (2012). A Study of Water-Soil Mechanics Coupling Mechanism and Model for Loess Slope Surface Erosion on Highway. Jilin: Jilin University.
Ni, Q., Powrie, W., Zhang, X., and Harkness, R. (2000). Effect of Particle Properties on Soil Behavior: 3-D Numerical Modeling of Shearbox Tests. Numer. Methods Geotechnical Eng. GSP 96. doi:10.1061/40502(284)5
Oda, M., Nemat-Nasser, S., and Mehrabadi, M. M. (1982). A Statistical Study of Fabric in a Random Assembly of Spherical Granules. Int. J. Numer. Anal. Methods Geomech. 6 (1), 77–94. doi:10.1002/nag.1610060106
Park, J.-W., and Song, J.-J. (2009). Numerical Simulation of a Direct Shear Test on a Rock Joint Using a Bonded-Particle Model. Int. J. Rock Mech. Mining Sci. 46 (8), 1315–1328. doi:10.1016/j.ijrmms.2009.03.007
Que, Y., Deng, X. Y., and Chen, J. (2017). Mechanism Analysis of Non-equilibrium Seepage and Stability Mechanism of Residual Soil Slopes by Ice and Snow Ablation in Intermittently Frozen Area. Eng. Sci. Tech. 49 (6), 73–83. doi:10.15961/j.jsuese.201600767
Que, Y., Chen, X., Chen, Y., Jiang, Z., Qiu, Y., and Easa, S. M. (2021). Stability Analysis of Double V-Shaped Gully Embankment: A Dimension-Reduced Calculation Method. Can. J. Civ. Eng. In press. doi:10.1139/cjce-2019-0783
Research Institute of Highway Science, Ministry of Communications (2010). Highway Geotechnical Test Code, JTG E40-2007. Beijing: China communication press.
Saman, A., Zhao, C. G., and Kang, K. (2014). Study on Sample Size and Grain Size Influence on Shear Strength of Coarse-Grained Soil in Triaxial Test. J. Beijing Jiaotong Univ. 38 (4), 133–136. doi:10.11860/j.issn.1673-0291-2014.04.023
Shi, C., and Xu, Y. W. (2015). Numerical Simulation Technique and Practice of Granular Flow. China Architecture Building Press. doi:10.2991/asei-15.2015.314
Skinner, A. E. (1969). A Note on the Influence of Interparticle Friction on the Shearing Strength of a Random Assembly of Spherical Particles. Géotechnique 19 (19), 150–157. doi:10.1680/geot.1969.19.1.150
Song, P. R. (2013). The Erosion Damage Characteristics and Numerical Simulation of Loess Slope. Jilin: Jilin University.
Suiker, A. S. J., and Fleck, N. A. (2004). Frictional Collapse of Granular Assemblies. J. Appl. Mech. 71 (3), 350–358. doi:10.1115/1.1753266
Thomas, H. R., Cleall, P., Li, Y.-C., Harris, C., and Kern-Luetschg, M. (2009). Modelling of Cryogenic Processes in Permafrost and Seasonally Frozen Soils. Géotechnique 59 (3), 173–184. doi:10.1680/geot.2009.59.3.173
Thornton, C. (2000). Numerical Simulations of Deviatoric Shear Deformation of Granular media. Géotechnique 50 (1), 43–53. doi:10.1680/geot.2000.50.1.43
Tsuji, Y., Kawaguchi, T., and Tanaka, T. (1993). Discrete Particle Simulation of Two-Dimensional Fluidized Bed. Powder Tech. 77 (1), 79–87. doi:10.1016/0032-5910(93)85010-7
Wang, X., Nie, Z., Gong, J., and Liang, Z. (2021). Random Generation of Convex Aggregates for DEM Study of Particle Shape Effect. Construction Building Mater. 268, 121468. doi:10.1016/j.conbuildmat.2020.121468
Wang, X., Yin, Z. Y., Wu, X. X., Su, D., and Zhao, J. D. (2021). A Novel Approach of Random Packing Generation of Complex-Shaped 3D Particles with Controllable Sizes and Shapes. Acta Geotechnica. doi:10.1007/s11440-021-01155-3
Wang, Z., Ruiken, A., Jacobs, F., and Ziegler, M. (2014). A New Suggestion for Determining 2D Porosities in DEM Studies. Geomech. Eng. 7 (6), 665–678. doi:10.12989/gae.2014.7.6.665
Willmott, C. J., and Matsuura, K. (2001). Terrestrial Air Temperature and Precipitation: Monthly and Annual Time Series (1950 - 1999). Available at: http://climate.geog.udel.edu/ ∼climate/html_pages (Accessed May 04, 2021). doi:10.1029/2017eo074939
Woo, M., and Winter, T. C. (1993). The Role of Permafrost and Seasonal Frost in the Hydrology of Northern. J. Hydrol. 141 (1-4), 5–31. doi:10.1016/0022-1694(93)90043-9
Wu, Q., Wang, C. M., Ma, D. H., and Song, P. R. (2013). Mechanism of Steep Loess Slop Rainfall Erosion in Western Liaoning. J. Jilin Univ. 43 (5), 1563–1571. doi:10.13278/j.cnki.jjuese.2013.05.026
Wu, Q., Wang, C. M., Song, P. R., Zhu, H. B., and Ma, D. H. (2014). Rainfall Erosion experiment for Steep Loess Slope and Fluid-Soil Coupling Simulation with PFC3D. Rock Soil Mech. 2014 (4), 977–985. doi:10.16285/j.rsm.2014.04.031
Xiong, C. X., Wang, T., and Lu, X. B. (2013). Meso-mechanical Simulation of Slope Disintegration Erosion under Rainfall. J. Mountain Sci. 31 (6), 710–715. doi:10.16089/j.cnki.1008-2786.2013.06.015
Xu, Z. L. (2017). Numerical Analysis of Unsaturated Soil Strength with PFC3D. Beijing Jiaotong University.
Zeghal, M., and Shamy, U. E. (2005). Coupled Continuum-Discrete Model for Saturated Granular Soils. J. Eng. Mech., 2005, 131(4): 413–426. doi:10.1061/(ASCE)0733-9399
Zhang, D., Huang, X., and Zhao, Y. (2013). Algorithms for Generating Three-Dimensional Aggregates and Asphalt Mixture Samples by the Discrete-Element Method. J. Comput. Civ. Eng. 27 (2), 111–117. doi:10.1061/(asce)cp.1943-5487.0000210
Zhang, T., Barry, R. G., Knowles, K., Ling, F., and Armstrong, R. L. (2003). “Distribution of Seasonally and Perennially Frozen Ground in the Northern Hemisphere,” in Proceedings of the 8th International Conference on Permafrost, Zürich, Switzerland. Editors M. Phillips, S. M. Springman, and L. U. Arenson(AA Balkema Publishers) 2, 1289–1294.
Zhang, Y. (2017). Microscopic Numerical Simulation of Deformation and Failure Process of Rock under True Triaxial Stress. China University of Mining and Technology.
Keywords: residual soil slope, erosion, rainfall scouring, PFC 2D, freeze–thaw, intermittently frozen
Citation: Ke Y, Chen Y, Jiang Z and Qiu Y (2021) Rainfall Erosion Damage of Residual Soil Slope in Intermittently Frozen Area Based on Discrete Element Method. Front. Mater. 8:705453. doi: 10.3389/fmats.2021.705453
Received: 05 May 2021; Accepted: 17 May 2021;
Published: 10 June 2021.
Edited by:
Yunchao Tang, Zhongkai University of Agriculture and Engineering, ChinaCopyright © 2021 Ke, Chen, Jiang and Qiu. This is an open-access article distributed under the terms of the Creative Commons Attribution License (CC BY). The use, distribution or reproduction in other forums is permitted, provided the original author(s) and the copyright owner(s) are credited and that the original publication in this journal is cited, in accordance with accepted academic practice. No use, distribution or reproduction is permitted which does not comply with these terms.
*Correspondence: Zhenliang Jiang, emhlbmxpYW5nLmppYW5nQHJ5ZXJzb24uY2E=
Disclaimer: All claims expressed in this article are solely those of the authors and do not necessarily represent those of their affiliated organizations, or those of the publisher, the editors and the reviewers. Any product that may be evaluated in this article or claim that may be made by its manufacturer is not guaranteed or endorsed by the publisher.
Research integrity at Frontiers
Learn more about the work of our research integrity team to safeguard the quality of each article we publish.