 Guan Wang
 Bo Wang1
94% of researchers rate our articles as excellent or good
Learn more about the work of our research integrity team to safeguard the quality of each article we publish.
Find out more
ORIGINAL RESEARCH article
Front. Mater., 02 August 2021
Sec. Smart Materials
Volume 8 - 2021 | https://doi.org/10.3389/fmats.2021.699433
This article is part of the Research TopicNew Piezoelectric Materials and Devices: Fabrication, Structures, and ApplicationsView all 11 articles
Photoacoustic imaging (PAI) is a fast evolving imaging technology enabling in vivo imaging with high specificity and spatial resolution. However, due to strong background signals from various intrinsic chromospheres such as melanin, photoacoustic imaging of targeting objects labeled by contrast agents remain a challenge. The transient triplet differential (TTD) method has shown a significant potential for background-free photoacoustic imaging. Here, we develop a photoacoustic system using an ultrasonic semicircular ring array for transient triplet differential imaging. Pt(II) Octaethylporphine (PtOEP) and black ink are used as the contrast agent and the phantom of melanoma, respectively. Using the TTD method, we could remove the strong background signal from black ink. The ratio between contrast agent signal and background signal is increased to about 10 times the previous one. Our finding demonstrates the potential of the TTD method on molecular imaging for strong background removal.
Photoacoustic (PA) imaging is an imaging method that images light-absorbing tissues based on the photoacoustic effect. This leads to thermoelastic expansion and propagation of ultrasound (US) waves that are then detected using a US transducer (Xu and Wang, 2006; Paul, 2011). According to the light absorption coefficient of different tissues, different ultrasonic signals are obtained, and the received signals are used for image reconstruction to get information about different organizations (Xu and Wang, 2005). Photoacoustic imaging can image endogenous tissue contrast agents or exogenous contrast agents in deep biological samples with high spatial resolution (Tsang et al., 2020). Therefore, it can track many molecular level objects, such as T cells (Zheng et al., 2018), enzymes (Zha et al., 2013), and metal ions (Liu et al., 2017), which has shown great potential in many preclinical and clinical applications.
However, due to strong background signals from various intrinsic chromospheres such as hemoglobin (Yao et al., 2015), melanin (Zhang et al., 2010), and lipids (Matthews et al., 2014), PA imaging of targeting objects labeled by contrast agents has remained a challenge. Several methods have been developed to overcome the challenge (Oh et al., 2006; Allen et al., 2012). Among these, the transient triplet differential (TTD) method has shown a significant potential for background-free molecular imaging (Tan et al., 2018).
The exogenous contrast agents for transient triplet differential (TTD) PA imaging are phosphorescent materials such as Pt(II) octaethylporphine (PtOEP) (Mills and Lepre, 1997). When the phosphorescent material is excited by a laser with specific wavelength (λ1), the electrons in the ground state (S0) will be pumped to the singlet state (S1) and then transferred into the triplet state (T1) through intersystem crossing (ISC). Then, the electrons later decay at a much slower rate through phosphorescence, from microseconds to milliseconds. Ordinarily, the triplet state has an absorption peak (λ2) that is well shifted from the ground state absorption peak (λ1). By using a probe beam with the absorption peak (λ2) of the triplet state, the electrons in the triplet state (T1) will be pumped to the second triplet state. Because the electron relaxation from T2 to T1 is a nonradioactive process, a triplet state photoacoustic signal will be generated at that time, and the principle is shown in Figure 1 (Ashkenazi et al., 2008; Berera et al., 2009). Since only phosphorescent with electrons in the triplet state can generate the triplet state PA signal, the differential signal will exclusively come from the phosphorescent contrast agent. The difference between PA signals and triplet state PA signals allows the removal of background signals from endogenous chromospheres without phosphorescent.

FIGURE 1. Principle of the triplet state photoacoustic signal from phosphorescent materials.
Melanoma is the most dangerous type of skin cancer with high lethal rate. It develops from the cells (melanocytes) that produce melanin. Melanin has a strong absorption coefficient for light of different wavelengths in the spectrum, which enables PA imaging for boundary detection (Park et al., 2021). On the other side, due to the existence of this strong background signal from melanin, there has been a lack of PA molecular imaging studies on the proteins, biomarkers, and cells of melanoma tissue. Besides, in previous studies, melanoma phantom with black ink has been widely used to imitate the strong light absorption ability of melanin.
Ultrasonic ring array can collect the acoustic signal around the target at one time and optimize the image quality by calculating the distribution of sound velocity (Xia et al., 2013; Zhang and Wang, 2020). This study develops a transient triplet differential (TTD) PA system with a semicircular ring array. With the background of melanin phantom, we use photoacoustic imaging and transient triple difference method to image phosphorescent contrast agent separately. The results indicate that TTD can successfully remove the strong background PA signal from melanoma phantom, which can be potentially used for in vivo molecular imaging and molecular typing of melanoma.
In this study, octaethylporphine platinum (Pt(II) octaethylporphine, PtOEP), a transition metal complex, is used as the phosphorescent material, and the molecular structure is shown in Figure 2. It is in powder form at room temperature and is insoluble in water. It is easily soluble in organic solvents such as toluene (Ashkenazi et al., 2008). Research has found that PtOEP is an oxygen-sensitive material, and its luminescence will be quenched by oxygen. The peak absorption wavelengths of the singlet and triplet states of PtOEP are 532 and 740 nm, respectively. We use 10 ml of toluene solution to dissolve 7.38 mg of the PtOEP powder to obtain a mixed solution with a final concentration of 1 mM.
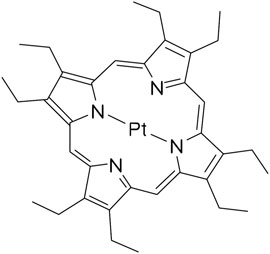
FIGURE 2. The molecular structure formula of PtOEP.
As mentioned before, black ink was used to imitate the melanin in-body model to test the ability of TTD to remove strong background signals.
The semicircular ring array has 128 elements, the center frequency is 3 MHz, and the average relative bandwidth is 60%, but 32 elements of the top are hollowed out for wiring. 128 elements are equally spaced and evenly distributed on a semicircular arc with a radius of 60 mm and an angle of 180°, while ensuring the focus in the z-axis (shown in Figure 3). The advantage of such an array design is that for each target object, a piezoelectric element is perpendicular to its edge direction, and all the information of the target object can be obtained at one time, and the image quality can be optimized by calculating the sound velocity. The 64-channel signal passes through the port and is input to the amplifier with a multiple of 40 dB. Each amplifier contains eight input channels and four output channels. The selection of input and output channels is controlled by a 2 1-channel selection multiplexer. 128 channels can output 64 channels at a time and can input 8 8-channel capture cards. The sampling rate of each capture card is 50 MS/s with a 24-bit resolution.

FIGURE 3. (A) Structure diagram of circular array; (B) physical picture of the circular array.
A DG645 digital delay/pulse generator (Stanford Research Systems, CA, United States) is used to control the synchronization between the two lasers. It can provide a precisely defined pulse repetition rate up to 10 MHz. The input is the synchronization trigger signal of the Nd:YAG laser. After a time delay controlled by the DG645, the OPO laser is triggered. We set different time delays ranging from −2 to 8 μs between the two lasers with ±3.5 V input signal amplitude.
The schematic of the system is shown in Figure 4. A Q-switched Nd:YAG laser (Beamtech Optronics Co., Ltd., Beijing, China) is used to generate excitation pulse with a wavelength of 532 nm, a repetition frequency of 10 Hz, a pulse width of 10 ns, an energy of 10 mJ, and a beam width of 6 mm. The SpitLight 600 OPO laser (Innolas Laser GmbH, Munich, Germany) is used to generate probe pulse with 740 nm wavelength, 20 Hz repetition frequency, 5 ns pulse width, 13 mJ energy, and 2 mm beam width. The beam is focused by the lens and coupled into a quartz fiber. After the YAG laser externally triggers the DG645, DG645 generates a set of delay signals (−2, 0, 0.5, 1, 2, 4, and 8 µs) to delay the synchronous output trigger signal that controls the OPO laser to emit probe pulse. The two laser beams are directed to overlap on the target area. The ultrasonic transducer converts the acoustic signal into an electrical signal, and a digital oscilloscope is used to simultaneously observe the delays of various trigger signals amplified by the signal amplifier and the triplet state photoacoustic signals that vary with different delay times. The data are collected by a data acquisition card and analyzed by a computer.
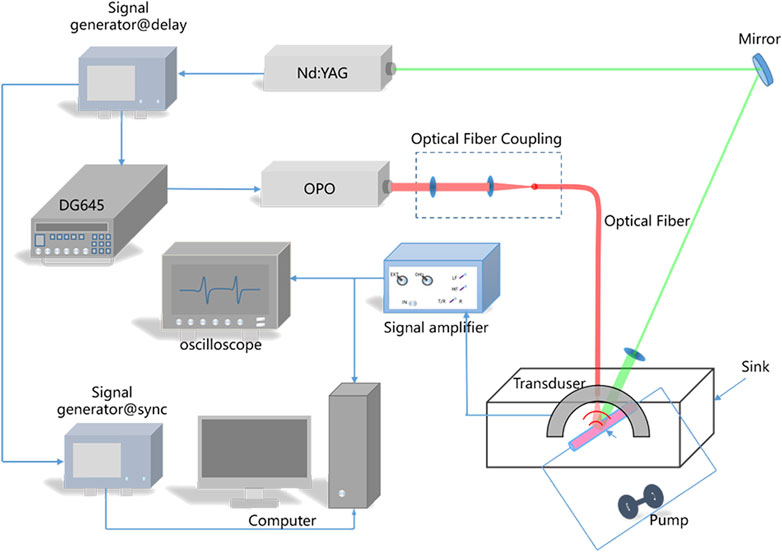
FIGURE 4. Schematic diagram of a transient triplet differential photoacoustic imaging system.
Figure 5A shows the PA signals of PtOEP excited by different wavelengths. The red line is the PA signal of the glass tube with PtOEP stimulated by 740 nm beam (PA740). The green line is the PA signal of the glass tube with PtOEP stimulated by 532 nm beam (PA532). The black line is the PA signal of the glass tube with PtOEP stimulated by 532 and 740 nm combined beam. The blue line is the PA signal using 532 and740 nm combined beam subtracts the PA signal stimulated by 740 nm beam and then subtracts the PA signal using 532 nm beam. This last differential PA signal is called the TTD signal (PAtransient), described as follows:
where τ is the pump-probe delay time:
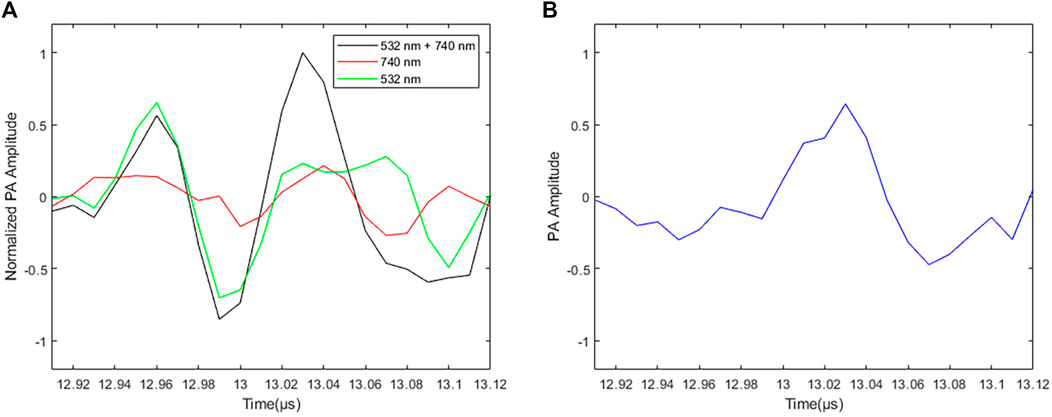
FIGURE 5. Photoacoustic signal with 0.5 µs time delay. (A) Black line is the PA signal of the glass tube with PtOEP stimulated by 532 and 740 nm combined beam. Red line is the PA signal of the glass tube with PtOEP stimulated by 740 nm beam. Green line is the PA signal of the glass tube with PtOEP stimulated by 532 nm beam. (B) The PA signal stimulated 532 and 740 nm combined beam subtracts the PA signal stimulated by 740 nm beam and then subtracts the PA signal using 532 nm beam, which is the TTD signal.
Because the triplet state photoacoustic signal only can be generated by the phosphorescent material, after the TTD process, the area with the phosphorescent material keeps the obvious signal (Figure 5B). Therefore, the obtained triplet state photoacoustic signal can be used for image reconstruction to remove the background signal.
When the excitation light is removed, the time required for the phosphorescence intensity to drop to 1/e of the maximum phosphorescence intensity during excitation is called phosphorescence lifetime; we fit the photoacoustic signals after multiple acquisitions and differentials and obtain the phosphorescence lifetime photoacoustic signal as shown in Figure 6. As the delay time increases, the TTD signal gradually decreases. By calculating the phosphorescence lifetime according to the reference by Shaoqi (Shao et al., 2013), we collect a series of transient power amplifier signals under different pump-probe delays (τ) and fit them to an exponential decay function, as described in Eq. 2, and we get that the phosphorescence lifetime of PtOEP is 2.204 µs:
where T is the lifetime, PAtransient is the transient photoacoustic signal, and PAtransient, 0 is the maximum photoacoustic signal.
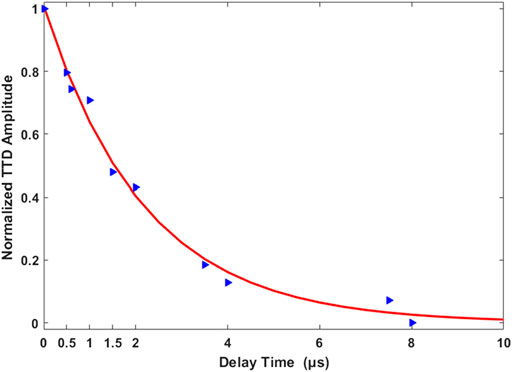
FIGURE 6. Normalized TTD signals with varying delay times.
Figure 7 shows the TTD imaging of PtOEP. The time delay is the period between the excitation pulse (532 nm) and probe pulse (740 nm). Minus time means the probe pulse stimulated before excitation pulse. When the time delay is −2 µs, no TTD signal can be obtained. When the time delay is 0 µs, the glass tube with PtOEP can be imaged using the semicircular ring array. As the time delay increases, the amplitude of the TTD signal decreases. The results indicate that the system and method in this study are effective for TTD imaging.
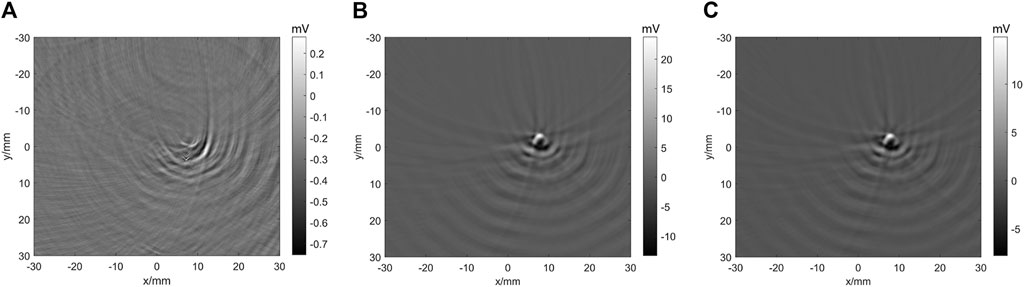
FIGURE 7. Imaging of the TDD signal of PtOEP. (A)–(C) TDD signal imaging at −2, 0, and 2 µs time delay, respectively.
In order to test the background removal ability of TTD imaging, we set a glass tube with black ink close to a tube with PtOEP (shown in Figure 8), the black ink with strong light absorption is widely used as the phantom of melanoma, and its absorbance at 532 nm wavelength is 3.052 and at 740 nm wavelength is 2.489. Figure 9A shows the PA images stimulated by 532 and 740 nm combined beam. In Figure 9B, we can observe the image of PtOEP because the absorption peak of PtOEP is 532 nm. In Figure 9C, the PA images stimulated by 740 nm are shown. Compared with the signal from black ink, the signal of PtOEP is too weak to observe. Table 1 shows the signal amplitude of Figure 9A. Although the amplitude of PtOEP is 30.7718 mV, it is weak compared with the amplitude of black ink. These results imply that, even using the exogenous contrast such as PtOEP, we cannot obtain the specific molecular images with strong background like melanin. Figure 9D shows the image after the TTD process according to Eq. 1, the background signal is removed successfully, and the signal of PtOEP survived. As Table 1 shows, although the amplitude of the PtOEP signal is reduced from 30.7718 to 10.1934 mV (a reduction of about 67%), the amplitude of the strong black ink signal is reduced from 98.9145 to 3.2878 mV (a reduction of about 96%), and the ratio between PtOEP signal and black ink signal is increased from 0.3111 to 3.1003, which increases to about 10 times the previous one. Therefore, TTD imaging can successfully remove the strong background signal like black ink.
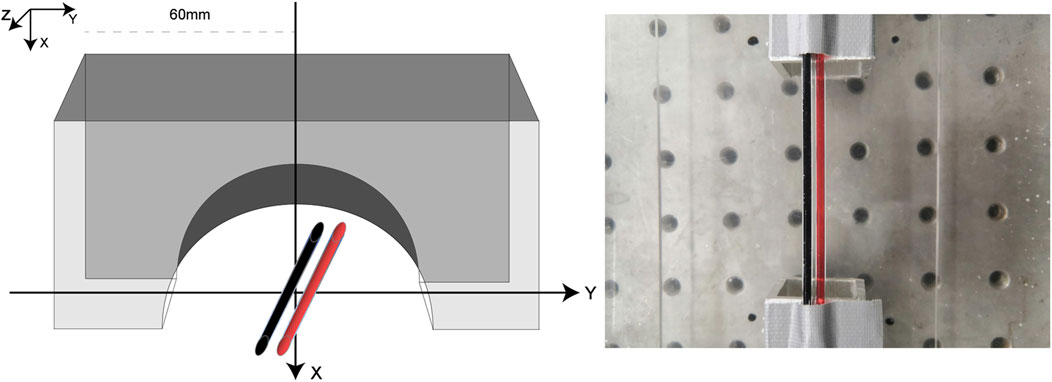
FIGURE 8. Schematic diagram of the position of the circular array, black ink tube, and PtOEP tube.
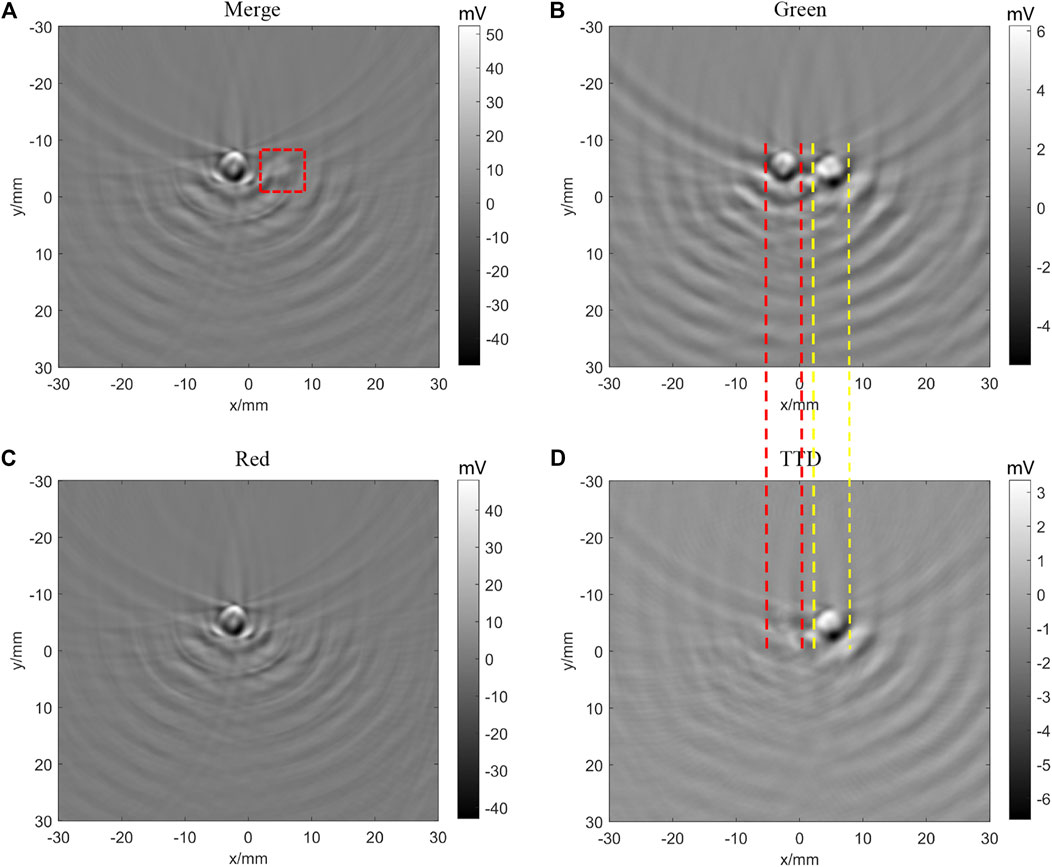
FIGURE 9. TTD images of black ink (left) and PtOEP (right) with 0 µs time delay and 50 signal averages. (A) Photoacoustic image stimulated by 532 and 740 nm combined beam; the red line frame is the imaging area of PtOEP. (B) Photoacoustic image stimulated by 532 nm beam. (C) Photoacoustic image stimulated by 740 nm beam. (D) TTD images.
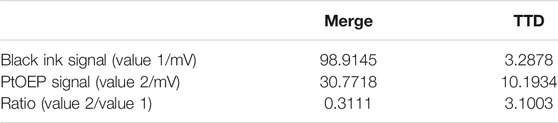
TABLE 1. Merge image and TDD image signal value contrast.
We then study the effect from signal averages. Figure 10 shows that as the average number increases, the image intensity becomes weaker and the image quality becomes better. Table 2 lists the signal amplitude and ratio between black ink and PtOEP. The results indicate that as the number of averages increases, the signal amplitude continues to decrease, but the ratio to the background signal continues to increase, indicating that the image signal continues to stabilize, the jitter decreases, and the signal and image are more realistic.
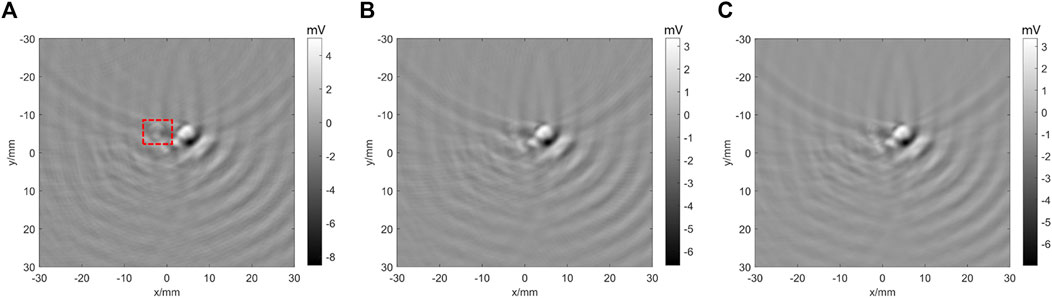
FIGURE 10. TTD images (0 µs time delay) with different signal averages. (A) TTD image with 10 times signal averages; the red line frame is the imaging area of black ink. (B) TTD image with 50 times signal averages. (C) TTD image with 200 times signal averages.
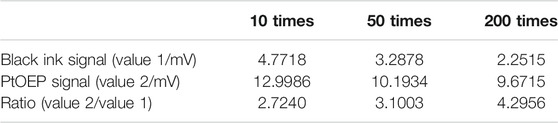
TABLE 2. TTD image signal value (0 µs time delay) with different signal averages.
However, if the number of averages increases, the acquisition time will also increase. This means that more time is needed for signal acquisition, which will increase the uncertainty of the system, and due to the extension of time, the laser crystal energy will continue to decrease, which will affect the accuracy of the experiment.
Based on the obtained results, we can draw the following conclusion: as the number of averaging increases, although the signal ratio continues to increase, the PtOEP signal continues to decrease, which will affect the observation of the image. In summary, choosing 50 times the average signal can not only meet the request of the imaging but also provide high contrast.
In this study, we develop a photoacoustic system with a semicircular ring array for transient triplet differential (TTD) imaging. PtOEP is used as the exogenous contrast agent and black ink was used to mimic the strong light absorption of melanin. We first obtain the TTD signal with different delay times. Then the background signal is successfully removed by TTD imaging. The ratio between PtOEP signal and black ink signal is increased to about 10 times the previous one. Besides, the effect from the signal average is studied. In summary, this study proves that the TTD method can image phosphorescent materials with strong background such as black ink which has great potential in in vivo molecular imaging of specific biomarkers such as protein and immune cells in melanoma.
The raw data supporting the conclusion of this article will be made available by the authors, without undue reservation.
ZC, JX, and GW contributed to the conception and design of the study. BW processed the data. TY participated in the experiment. GW wrote the first draft of the manuscript. CW, LG, and TY wrote sections of the manuscript. All authors contributed to manuscript revision and read and approved the submitted version.
Funding was provided by the Department of Science and Technology of Hunan Province, High-tech Industry Science and Technology Innovation Leading Program (2020SK 2003), Management Science and Technology Project of Hunan Province (2020YJ004), Central South University, Innovation Driven Program team project (2020CX004), Emergency and Fundamental Research Funds for Central Universities of the Central South University (2020zzts784).
The authors declare that the research was conducted in the absence of any commercial or financial relationships that could be construed as a potential conflict of interest.
All claims expressed in this article are solely those of the authors and do not necessarily represent those of their affiliated organizations, or those of the publisher, the editors and the reviewers. Any product that may be evaluated in this article, or claim that may be made by its manufacturer, is not guaranteed or endorsed by the publisher.
We gratefully appreciate the assistance of Lin Huang, who provided valuable discussion.
Allen, T. J., Hall, A., Dhillon, A. P., Owen, J. S., and Beard, P. C. (2012). Spectroscopic Photoacoustic Imaging of Lipid-Rich Plaques in the Human Aorta in the 740 to 1400 Nm Wavelength Range. J. Biomed. Opt. 17, 061209. doi:10.1117/1.JBO.17.6.061209
Ashkenazi, S., Huang, S.-W., Horvath, T., Koo, Y.-E. L., and Kopelman, R. (2008). Photoacoustic Probing of Fluorophore Excited State Lifetime with Application to Oxygen Sensing. J. Biomed. Opt. 13, 034023. doi:10.1117/1.2927466
Berera, R., van Grondelle, R., and Kennis, J. T. M. (2009). Ultrafast Transient Absorption Spectroscopy: Principles and Application to Photosynthetic Systems. Photosynth Res. 101, 105–118. doi:10.1007/s11120-009-9454-y
Liu, Y., Wang, S., Ma, Y., Lin, J., Wang, H.-Y., Gu, Y., et al. (2017). Ratiometric Photoacoustic Molecular Imaging for Methylmercury Detection in Living Subjects. Adv. Mater. 29, 1606129. doi:10.1002/adma.201606129
Matthews, T. P., Zhang, C., Yao, D.-K., Maslov, K. I., and Wang, L. V. (2014). Label-free Photoacoustic Microscopy of Peripheral Nerves. J. Biomed. Opt. 19, 1016004. doi:10.1117/1.JBO.19.1.016004
Mills, A., and Lepre, A. (1997). Controlling the Response Characteristics of Luminescent Porphyrin Plastic Film Sensors for Oxygen. Anal. Chem. 69, 4653–4659. doi:10.1021/ac970430g
Oh, J.-T., Li, M.-L., Zhang, H. F., Maslov, K., Stoica, G., and Wang, L. V. (2006). Three-dimensional Imaging of Skin Melanoma In Vivo by Dual-Wavelength Photoacoustic Microscopy. J. Biomed. Opt. 11, 034032. doi:10.1117/1.2210907
Park, B., Bang, C. H., Lee, C., Han, J. H., Choi, W., Kim, J., et al. (2021). 3D Wide‐field Multispectral Photoacoustic Imaging of Human Melanomas In Vivo: a Pilot Study. J. Eur. Acad. Dermatol. Venereol. 35, 669–676. doi:10.1111/jdv.16985
Paul, B. (2011). Biomedical Photoacoustic Imaging. Interf. Focus. 1, 602–631. doi:10.1098/rsfs.2011.0028
Shao, Q., Morgounova, E., Jiang, C., Choi, J., Bischof, J., and Ashkenazi, S. (2013). In Vivophotoacoustic Lifetime Imaging of Tumor Hypoxia in Small Animals. J. Biomed. Opt. 18, 076019. doi:10.1117/1.JBO.18.7.076019
Tan, J. W. Y., Lee, C. H., Kopelman, R., and Wang, X. D. (2018). Transient Triplet Differential (TTD) Method for Background Free Photoacoustic Imaging. Sci. Rep. 8, 9290. doi:10.1038/s41598-018-27578-9
Tsang, V. T. C., Li, X., and Wong, T. T. W. (2020). A Review of Endogenous and Exogenous Contrast Agents Used in Photoacoustic Tomography with Different Sensing Configurations. Sensors 20, 5595. doi:10.3390/s20195595
Xia, J., Huang, C., Maslov, K., Anastasio, M. A., and Wang, L. V. (2013). Enhancement of Photoacoustic Tomography by Ultrasonic Computed Tomography Based on Optical Excitation of Elements of a Full-Ring Transducer Array. Opt. Lett. 38, 3140–3143. doi:10.1364/OL.38.003140
Xu, M., and Wang, L. V. (2006). Photoacoustic Imaging in Biomedicine. Rev. Scientific Instr. 77, 041101–041598. doi:10.1063/1.2195024
Xu, M., and Wang, L. V. (2005). Universal Back-Projection Algorithm for Photoacoustic Computed Tomography. Phys. Rev. E 71, 016706. doi:10.1103/PhysRevE.71.016706
Yao, J., Wang, L., Yang, J.-M., Maslov, K. I., Wong, T. T. W., Li, L., et al. (2015). High-speed Label-free Functional Photoacoustic Microscopy of Mouse Brain in Action. Nat. Methods 12, 407–410. doi:10.1038/nmeth.3336
Zha, Z., Zhang, S., Deng, Z., Li, Y., Li, C., and Dai, Z. (2013). Enzyme-responsive Copper Sulphide Nanoparticles for Combined Photoacoustic Imaging, Tumor-Selective Chemotherapy and Photothermal Therapy. Chem. Commun. 49, 3455–3457. doi:10.1039/c3cc40608c
Zhang, Y., Cai, X., Choi, S.-W., Kim, C., Wang, L. V., and Xia, Y. (2010). Chronic Label-free Volumetric Photoacoustic Microscopy of Melanoma Cells in Three-Dimensional Porous Scaffolds. Biomaterials 31, 8651–8658. doi:10.1016/j.biomaterials.2010.07.089
Zhang, Y., and Wang, L. (2020). Video-rate Ring-Array Ultrasound and Photoacoustic Tomography. IEEE Trans. Med. Imaging 39, 4369–4375. doi:10.1109/TMI.2020.3017815
Keywords: PtOEP, photoacoustic imaging, melanoma, transient triplet differential, strong background
Citation: Wang G, Wang B, Ye T, Wang C, Guo L, Xiao J and Chen Z (2021) Ultrasonic Ring Array-Based Transient Triplet Differential Photoacoustic Imaging for Strong Background Removal. Front. Mater. 8:699433. doi: 10.3389/fmats.2021.699433
Received: 23 April 2021; Accepted: 28 June 2021;
Published: 02 August 2021.
Edited by:
Xun Yu, New York Institute of Technology, United StatesCopyright © 2021 Wang, Wang, Ye, Wang, Guo, Xiao and Chen. This is an open-access article distributed under the terms of the Creative Commons Attribution License (CC BY). The use, distribution or reproduction in other forums is permitted, provided the original author(s) and the copyright owner(s) are credited and that the original publication in this journal is cited, in accordance with accepted academic practice. No use, distribution or reproduction is permitted which does not comply with these terms.
*Correspondence: Jiaying Xiao, amlheWluZ3hpYW9AY3N1LmVkdS5jbg==; Zeyu Chen, emV5dWNoZW5AY3N1LmVkdS5jbg==
Disclaimer: All claims expressed in this article are solely those of the authors and do not necessarily represent those of their affiliated organizations, or those of the publisher, the editors and the reviewers. Any product that may be evaluated in this article or claim that may be made by its manufacturer is not guaranteed or endorsed by the publisher.
Research integrity at Frontiers
Learn more about the work of our research integrity team to safeguard the quality of each article we publish.