 Dekun Liu1
 Jian Yang
94% of researchers rate our articles as excellent or good
Learn more about the work of our research integrity team to safeguard the quality of each article we publish.
Find out more
ORIGINAL RESEARCH article
Front. Mater., 01 July 2021
Sec. Structural Materials
Volume 8 - 2021 | https://doi.org/10.3389/fmats.2021.694586
This article is part of the Research TopicInclusion/Precipitate Engineering and Thermo-Physical Properties in Liquid Steels and AlloysView all 8 articles
In the present work, the effect of the welding heat input on the microstructure, martensite–austenite (M–A) constituents, and impact toughness of the coarse-grained heat-affected zone (CGHAZ) in offshore engineering steel with Ca deoxidation is studied. With the heat input increased from 50 to 100 kJ/cm, the HAZ toughness decreased rapidly, while the measured microhardness decreases steadily. The grain sizes are increased from 52 to 132 μm, and the width of bainite lath increased from 0.4 to 2 μm. The area fraction of lath bainite (LB) decreased, while the area fraction of granular bainite (GB) increased. The average width of M–A constituents grows from 0.3 to 0.6 μm, and the average length grows from from 0.5 to 0.9 μm. Its area fraction is increased from 5.3 to 8.6% and then decreased to 6.1%, and its number density decreased from 0.7 to 0.2 μm−2. The morphologies of M–A constituents change from dot-like to slender and blocky, which are deleterious to impact toughness. The fracture mechanism changes from ductile to quasicleavage and cleavage as the heat input is increased. As the M–A constituents are always found as the cleavage initiation, they should be responsible for the decrease in HAZ toughness when the heat input is above 100 kJ/cm.
Offshore engineering steel is widely used in the manufacture of marine engineering equipment, such as marine platforms, marine energy equipment, submarine oil, and gas pipelines. It demands high strength, excellent toughness, fatigue, and corrosion resistance for use in cold environments (Suzuki et al., 2005). In the manufacturing process, it is desired to increase the welding heat input to improve the welding efficiency and shorten the processing time. However, the larger heat input also results in a coarse microstructure near the fusion line, which forms the CGHAZ and deteriorates the impact toughness at a low temperature (Davis and King, 1994).
Oxide metallurgy technology is an efficient way to improve CGHAZ toughness, which is often used in manufacturing steel plates with a thickness larger than 50 mm (Kojima et al., 2004; Suzuki et al., 2005). The addition of strong deoxidizers, Ti, Zr, Mg, etc., can produce the nonmetallic inclusions during steelmaking and promote the formation of intragranular acicular ferrite (IAF) and prevent the prior austenite grain growth (Gladman et al., 1999; Park et al., 2000). Zhu and Yang (2011) found that Mg deoxidation can generate many pinning particles to inhibit the austenite grain growth. Yamashita et al. (Yamashita et al., 2015) developed a high-heat-input welding steel plate by using REM deoxidation. Zou et al. (2018) reported that EH36-grade steel can form Zr-containing inclusions to promote the nucleation of acicular ferrite with Zr addition.
However, offshore engineering has strength usually larger than 420 MPa, which is higher than that of the shipbuilding steel plate. To improve the strength of offshore engineering steel, it is necessary to increase the carbon equivalent value [Ceq = C + Mn/6 + (Cu + Ni)/15 + (Cr + Mo + V)/5] by adding microalloying elements such as Cr, Mo, and V (Nagai et al., 2004), leading to the change in the HAZ microstructure. The CGHAZ toughness of the shipbuilding steel plate prepared by oxide metallurgy is not only mainly improved by the IAF but also degraded by the ferrite side plate (FSP) and the grain boundary ferrite (GBF) (Xu et al., 2016). In contrast, the CGHAZ toughness of offshore engineering steel is generally enhanced by the fine LB and deteriorated by the M–A constituent (Lee et al., 2017) which is much different from those in the shipbuilding steel plate.
It is widely accepted that the M–A constituent is deleterious to the impact toughness. Okada et al. (1994) found that the C content in the M–A constituent is increased with a decrease in the cooling rate from 1073 to 773 K, resulting in an increase in the hardness of M–A constituents. Mohseni et al. (2013) indicated that the hardness of M–A constituents is between 600 and 1,000 HV and identified that the crack-initiation sites of cleavage fracture are usually from M–A constituents. Huda et al. (2016) investigated that the fast-cooling rate can promote the formation of the M–A constituent and change its morphology in X80 line pipe steels. Li et al.(2015) (Li and Baker, 2013) proposed that the dihedral angle 2θ can determine the fracture susceptibility of the M–A constituents with the different morphologies. Therefore, it is worthwhile to investigate the morphologies and quantities of the M–A constituents in the HAZ of the offshore engineering steels to evaluate the low-temperature toughness in CGHAZ.
It is well known that the Ca treatment can change the elongated MnS inclusions to the spherical CaS inclusions to improve the transverse toughness of the steel plate and change the Al2O3 inclusions into the CaO–Al2O3 complex inclusions with low melting point to inhibit the clogging of the submerging entry nozzle during continuous casting. In recent years, the oxide metallurgy with Ca deoxidation was utilized to improve the CGHAZ toughness in the steel plate (Terazawa et al., 2018). Kato et al. (2011) found that Ca addition can increase the number density of fine TiN particles, inhibit the coarsening of TiN particles, and finally, achieve a fine-grained HAZ to improve its toughness. Zhang et al. (2019) investigated the inclusion evolution with different Ca contents and found that the CGHAZ toughness of the shipbuilding steel plate is obviously improved due to the formation of IAFs in a large number. However, the research on the oxide metallurgy with Ca deoxidation is quite limited, and the study on the HAZ microstructure and toughness for 420 MPa offshore engineering steel with Ca deoxidation is rarely reported.
The present work aims to investigate the effect of the welding heat input on the microstructure, M–A constituents, and hardness and impact toughness in the HAZ of offshore engineering steel with Ca deoxidation. The changes in the grain size, the content of LB and GB, and the size, number density, and area fraction of M–A constituents in the CGHAZ with the heat input are clarified. The influence of the morphologies and quantities of the M–A constituents on the toughness of the CGHAZ is made clear. The electron probe microanalyzer (EPMA) and X-ray diffraction (XRD) characterization are used to identify the carbides and M–A constituents in the CGHAZ. The low-temperature fracture mechanism is studied for the HAZ at different heat inputs.
The experimental steel was melted in a vacuum induction furnace with a capacity of 50 kg and then cast into ingots with the dimension of 120 mm × 180 mm × 240 mm. The deoxidants of Si, Ti, Al, and Ca were added to reduce oxygen content, and the target compositions were obtained. The ingots were hot rolled into thick steel plates with the thermomechanical control process (TMCP). The roughing rolling was conducted at 930°C with a reduction ratio greater than 30%, and the finishing rolling was conducted at 800°C with a reduction ratio of over 30%. The steel plates with the final thickness of 40 mm were cooled from 750 to 400°C at the rate of 10°Cs−1. The chemical compositions of the experimental steel are 0.067% C, 0.14% Si, 1.04% Mn, 0.008% P, 0.003% S, Cr, 0.008% Mo, 0.005% V, 0.002% Nb, 0.004% Ti, 0.0023% Ca, 0.012% Al, 0.0025% N, and 0.0031% O. The tested yield strength and tensile strength are 428 and 535 MPa, and the Charpy impact test at −40°C is 336 J. The newly designed offshore engineering steels have the strength level similar to that of the EH420 steel plate.
The specimens with the dimension of 11 mm × 11 mm × 71 mm were cut from the steel plate with the thickness of 40 mm and were simulated by using the welding thermal simulator (Gleeble-3800, Dynamic Systems Inc.). Figure 1 shows the heating and cooling curves of the welding simulation at the heat inputs of 50, 100, 150, and 200 kJ/cm. The specimens were held at the peak welding temperature of 1,350°C for 1 s, and the corresponding cooling time t8/5 from 800 to 500°C was 6, 24, 54, and 96 s, respectively.
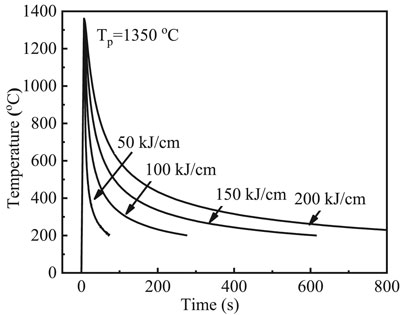
FIGURE 1. Heating and cooling curves of welding simulation of the CGHAZ at the heat inputs of 50, 100, 150, and 200 kJ/cm.
The Charpy impact tests were carried out at −40°C in accordance with the ASTM E23 standard and were conducted twice on each condition. The CGHAZ specimens were ground and polished and then etched by 4% nital (4 ml HNO3 + 96 ml C2H5OH) for optical microscopy (OM, DM 2700M, Leica Microsystems) and a scanning electron microscope (SEM, EVO 18, Carl Zeiss) observation. The microcarbon content distribution was measured by the wavelength dispersive spectroscopy (WDS) of the EPMA (JXA-8530F, JEOL). The XRD (D8 Advance, Bruker AXS) was further used to identify the phases in the CGHAZ (Huda et al., 2016). The samples were polished and etched and then tested by the XRD. The anode target was Cu, with the scanning angle ranged from 30 to 110° and the scanning speed of 1 min−1. The microhardness was measured by using a 0.5 kgf (kilogram-force) load for 5 s in a Vickers hardness tester (HX-1000, Shanghai Optical instrument), and each specimen was measured for 10 points.
The prior austenite grain boundary and microstructure were observed by optical microscopy. To quantitatively measure the area fraction of LB and GB, a counting point method was adopted with a 10 × 10 grid and more than 4 mm2 analysis area with a magnification of 200 times. The acicular ferrite (AF) was classified into GB to decrease the complexity of identification. The quantitative characterization was carried out by the image process software ImageJ (Bonnevie et al., 2004; Huang et al., 2016). More than ten SEM images with a magnification of 2,000 times were selected for statistical analysis.
Figure 2A shows the Charpy impact energy at −40°C of the CGHAZ after simulated welding in the case of different heat inputs. The maximum impact energy is 137 J at the heat input of 50 kJ/cm. With the increasing heat input, the average impact energy is measured to be 15, 16, and 20 J, respectively. Figure 2B shows the microhardness on the surface of the CGHAZ specimens, which was measured by the Vickers microhardness method with a 0.5 kgf load for 5 s. The measured microhardness decreases steadily as the heat inputs are increased from 50 to 200 kJ/cm. Especially, the measured hardness is about 328 HV0.5 at the heat input of 50 kJ/cm, which is much larger than that of the ferrite matrix of about 200 HV0.5.
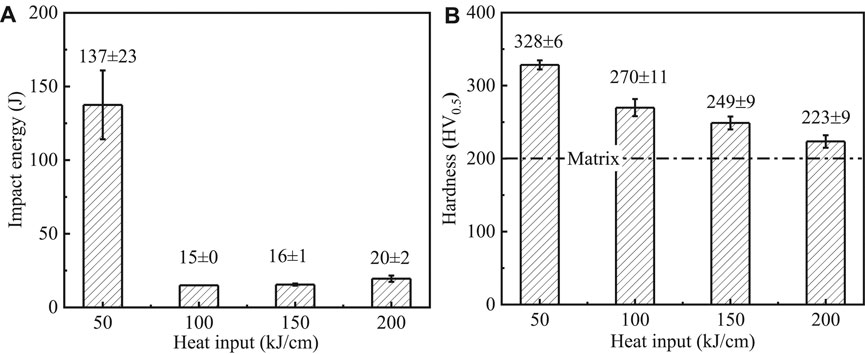
FIGURE 2. (A) Charpy impact energy at −40°C and (B) microhardness of the CGHAZ at different heat inputs.
Figure 3 shows the typical optical microstructures in the CGHAZ of the offshore engineering steel at the heat inputs of 50, 100, 150, and 200 kJ/cm. Figure 3A shows that the microstructure is composed of lath martensite (LM) and LB at the heat input of 50 kJ/cm and the extremely fine martensite lath or bainite ferrites in the grains growing in the same direction. When the heat input is increased to 100 kJ/cm, the microstructure consists of LB and a small amount of GB with a small size and an irregular sphere shape at the grain boundaries, as shown in Figure 3B. As the heat input is increased to 150 kJ/cm, the LB coarsens with the increased content of GB and a few AF in the grains, as illustrated in Figure 3C. When the heat input is 200 kJ/cm, the cooling rate is slow enough to obtain the predominant phase of GB with the further coarsened LB and AF, as shown in Figure 3D.
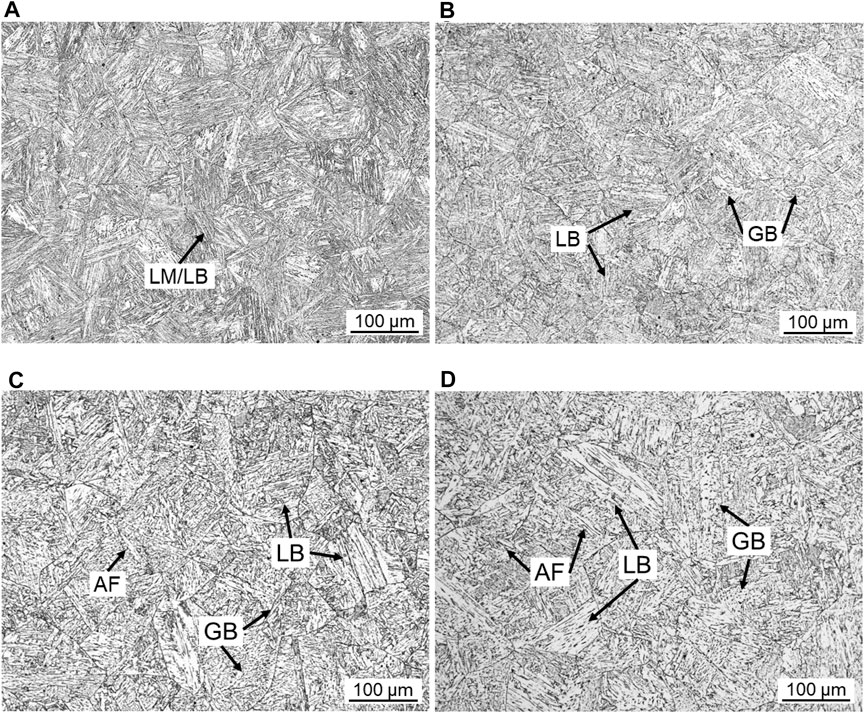
FIGURE 3. Optical micrographs of the microstructures in the CGHAZ at the heat inputs of (A) 50, (B) 100, (C) 150, and (D) 200 kJ/cm.
Figure 4 shows a typical morphology of AF and inclusion and the corresponding EDS mapping result in the CGHAZ at the heat input of 150 kJ/cm. The AFs with the width of 1.6–2.4 μm and the length of 4.8–22 μm nucleate from the inclusion. The EDS mapping result shows that the inclusion is a CaO–CaS–Al2O3–TiN complex compound.
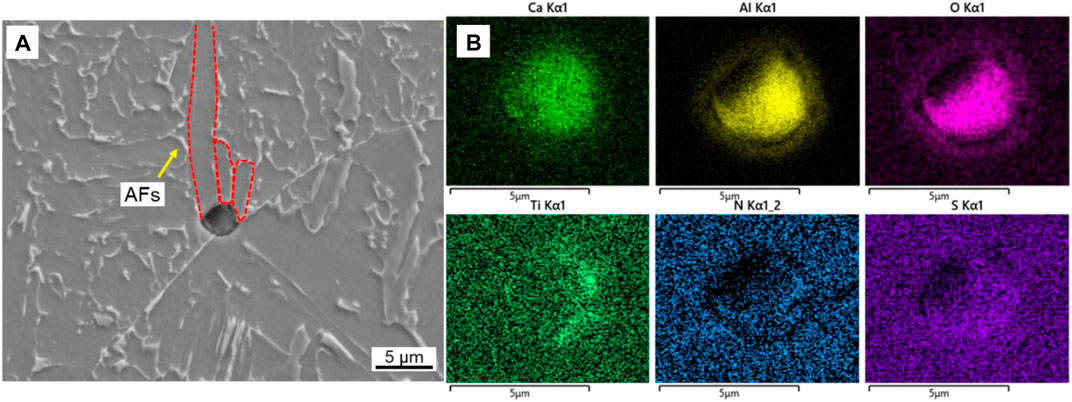
FIGURE 4. (A) Typical morphology of AF and inclusion and (B) the corresponding EDS mapping result in the CGHAZ at the heat input of 150 kJ/cm.
Figure 5 shows the typical SEM micrographs in the CGHAZ at the heat inputs of 50, 100, 150, and 200 kJ/cm. When the heat input is 50 kJ/cm, the fast-cooling rate leads to very fine microstructures which may consist of fine LM/LB. The white particles with small sizes in the bainite laths are identified to be fine M–A constituents or carbides (M–A/carbides). Figures 5C,D show the microstructures consisting of LB at the heat input of 100 kJ/cm, and the M–A constituents or carbides are uniformly distributed at the LB and GB boundaries. As the heat input is increased to 150 kJ/cm, the width of LB and size of M–A/carbides obviously are enlarged. Especially, the M–A/carbides become enlarged with a slender and blocky shape located at the LB boundaries. When the heat input is 200 kJ/cm, the microstructure consists of LB and GB. The M–A/carbides are similar to those at the heat input of 150 kJ/cm, but the size increases. The M–A constituents with blocky shapes are widely found at the GB boundaries. Besides, the decomposed pearlite (DP) consists of ferrite and carbide which are found in LB and GB boundaries, as shown in Figures 5G,H.
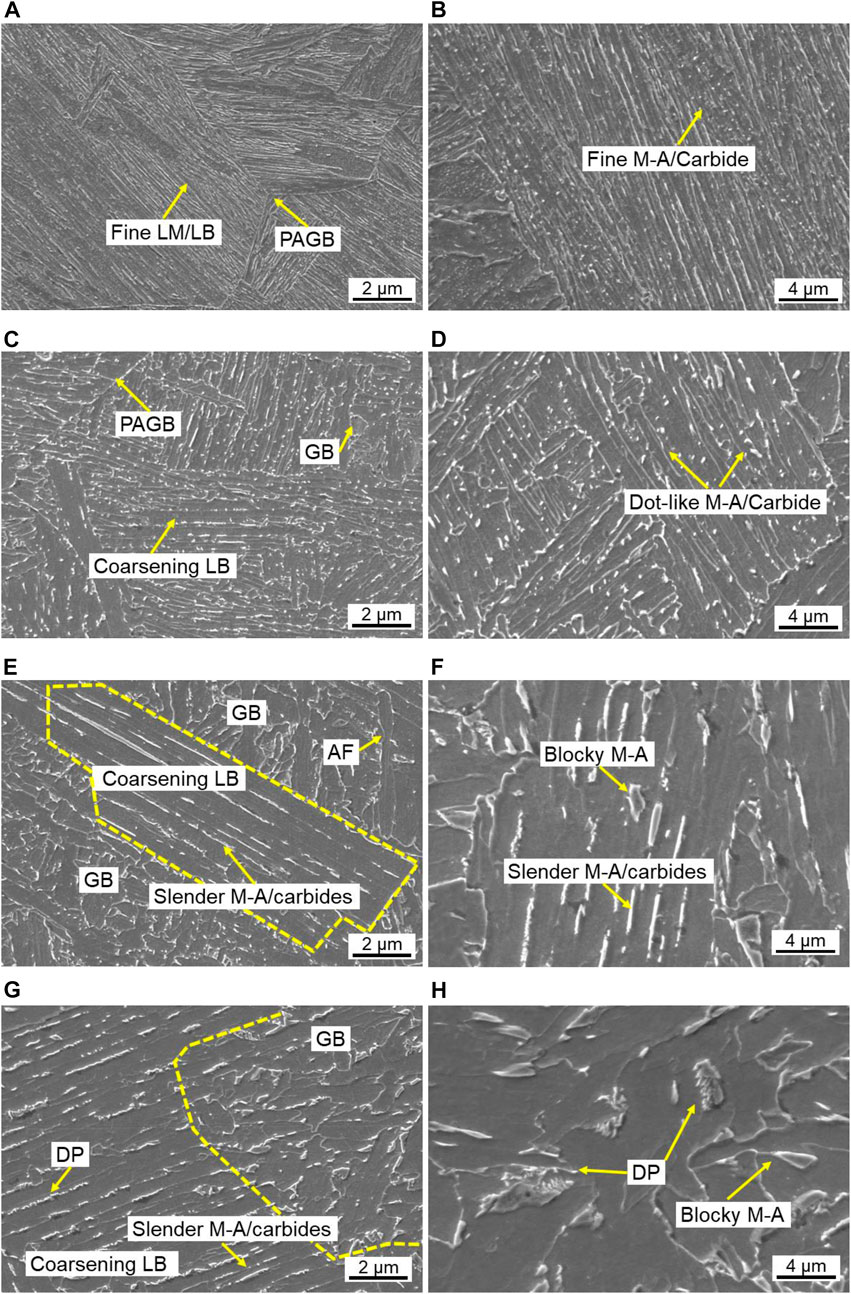
FIGURE 5. SEM micrographs of microstructures in the CGHAZ at the heat inputs of (A, B) 50, (C, D) 100, (E, F) 150, and (G, H) 200 kJ/cm.
Figure 6 shows the effect of heat input on (A) the prior austenite grains and the width of bainite lath and (B) the area fractions of LB and GB. As the heat input is increased from 50 to 200 kJ/cm, the prior austenite grains increase from 48 to 132 μm and the width of the bainite lath increases from 0.4 to 2 μm. The area fraction of LB in the CGHAZ is decreased from 97 to 47%, while the area fraction of GB is increased.
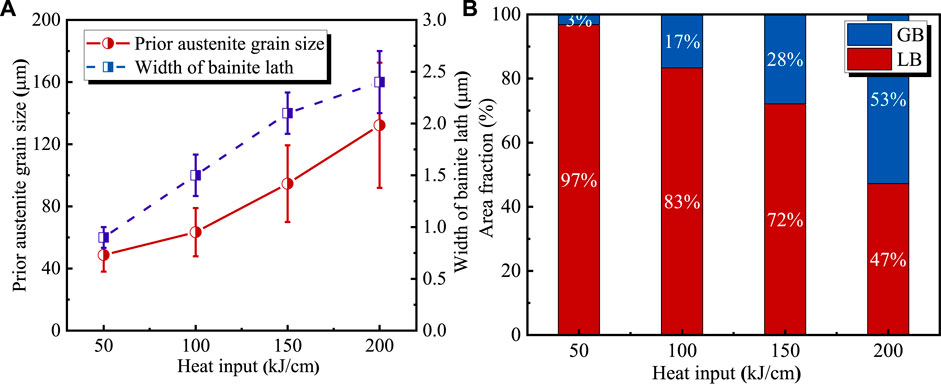
FIGURE 6. (A) Prior austenite grain size and width of the bainite lath and (B) the area fractions of LB and GB in the CGHAZ at different heat inputs.
Figure 7 shows SEM morphologies and carbon profiles of M–A constituents or carbides at the heat inputs of (A, B) 100, (C, D) 150, and (E, F) 200 kJ/cm. The carbon content is obviously larger than that in the matrix, while the Mo and Mn content nearly keeps constant. In addition, the carbon content is much higher in Figure 7B than that in Figures 7D,F, indicating that the dot-like particles in Figure 7B are carbides while the blocky phases located at the GB boundaries in Figures 7C,E are blocky M–A constituents.
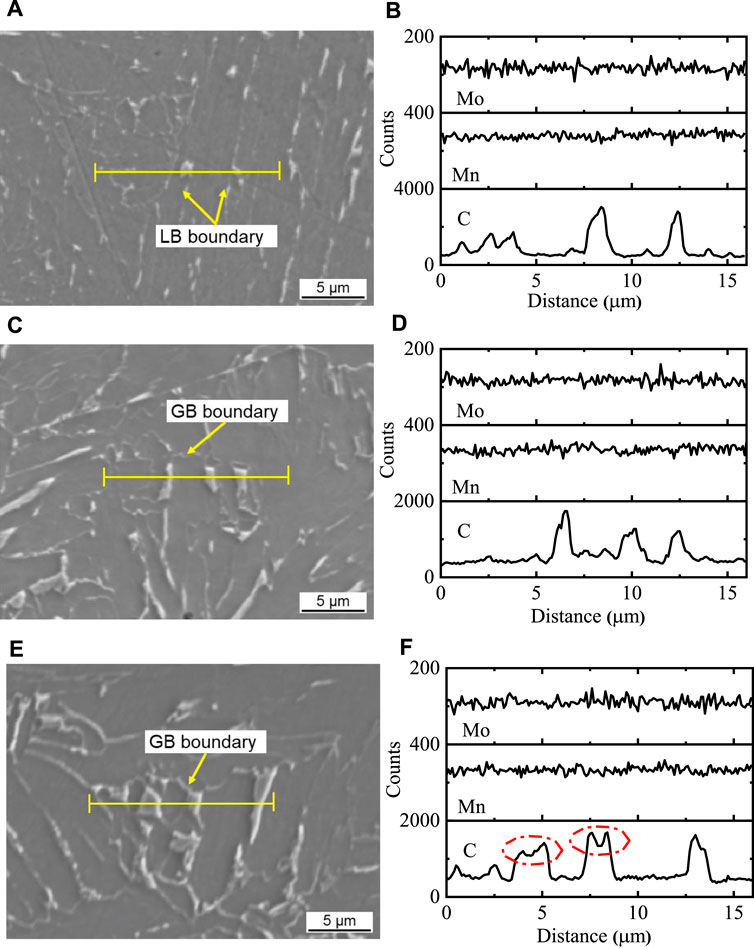
FIGURE 7. SEM morphologies and carbon profiles of M–A constituents or carbides at the heat input of 100 kJ/cm (A, B), 150 kJ/cm (C, D), and 200 kJ/cm (E, F).
Figure 8 shows the XRD patterns and the magnified images for a part of Figure 8A in the CGHAZ with different heat inputs. The phases on the fracture surface are identified to be ferrite, Fe3C, (Fe,Cr)7C3, (Fe,Cr)23C6, and austenite. The peak at 42.7o is corresponding to the austenite phase, and the peak at about 42.6o is from the (Fe,Cr)7C3 phase, as labeled in Figure 8B. In addition, the intensity of carbides is increased as the heat input is increased from 50 to 100 kJ/cm, indicating that the contents of carbides increased as well.
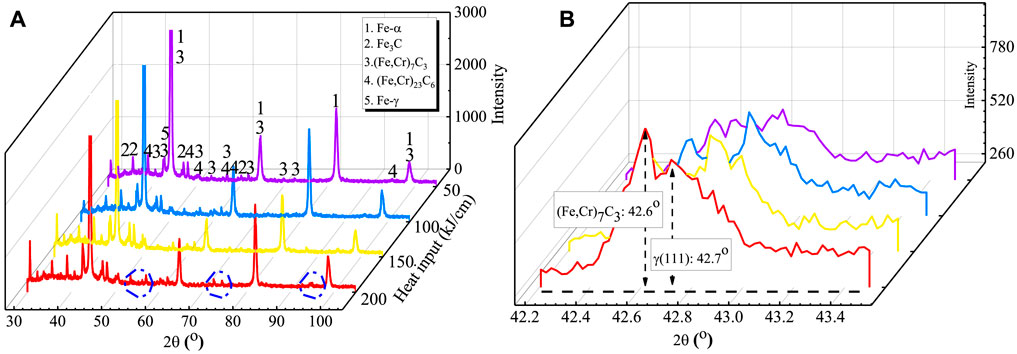
FIGURE 8. (A) XRD spectrums and (B) magnified images for a part of Figure 7A in the CGHAZ at different heat inputs.
To estimate the effect of the secondary phases which consist of the M–A constituent and carbides on the toughness, the quantities of the secondary phases were obtained by image process software. It should be noted that the carbide is difficult to be distinguished from the M–A constituent at the heat inputs of 50 and 100 kJ/cm, especially for those carbides at the LB boundaries. The phases with larger sizes and polygonal rectangular shapes are considered to be M–A constituents according to their carbon content, as shown in Figures 7D,F, while the elongated phases at the bainite ferrite lath are hard to be identified at the heat inputs of 150 and 200 kJ/cm, as shown in Figures 5E,G. Therefore, it is necessary to regard the carbides as the M–A constituent to decrease the complexity. The method can be seen in the work of Bonnevie et al., 2004, and Huang et al., 2016, and the main steps are illustrated as follows: 1) The SEM images were converted into 8-bit gray images. 2) The M–A constituents were distinguished from the matrix image by adjusting the gray-level threshold. 3) The non-M–A constituent area was excluded, and the area containing the M–A constituent not recognized by the software was added manually. 4) The data of the length, width, and area were exported and processed. In order to avoid the accidental results caused by a smaller field, more than five SEM images (× 2000 magnification) in random fields were selected for statistical analysis with a total area of 0.01 mm2.
Figure 9A shows the typical morphology of the M–A constituent in the CGHAZ at the heat input of 100 kJ/cm, and Figure 9B shows that the binary picture consists of the black phase of the bainite and the white phases of the M–A constituent and the M–A constituent is changed into the black contrast after the ImageJ process. Figure 9C shows the effect of the heat input on width and length, and Figure 9D shows the area fraction and number density of M–A constituents in the CGHAZ. With an increase in the heat input, the width grows from 0.3 to 0.6 μm and the length grows from 0.5 to 0.9 μm. The area fractions are measured to be 5.3, 8.9, 6.9, and 6.1%, and the number density is 0.7, 0.5, 0.3, and 0.2 μm−2, respectively. The area of the M–A constituent increases, reaching its maximum value at the heat input of 100 kJ/cm, and decreases slightly with further increase in the heat input, which corresponds to the increase in HAZ toughness for the heat input increasing from 100 to 200 kJ/cm.
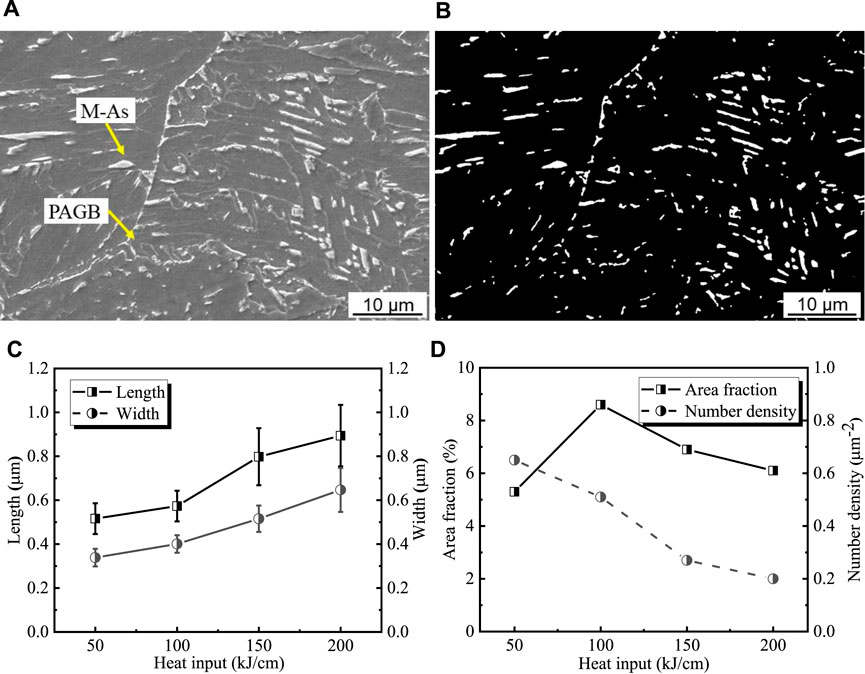
FIGURE 9. (A) Typical morphologies of M–A constituents, (B) M–A constituents changed into white color using ImageJ, and measured (C) length and width and (D) area fraction and number density of M–A constituents in the CGHAZ at different heat inputs.
Figure 10 shows the measured length and aspect ratio of M–A constituents in the CGHAZ with the heat inputs of 50, 100, 150, and 200 kJ/cm. The morphologies of the M–A constituents are defined as a dot-like shape with a length less than 1 μm, a slender shape with the length larger than 1 μm and the aspect ratio larger than 4, and a blocky shape with the length greater than 1 μm and the aspect ratio less than 4 (Yan et al., 2014; Huang et al., 2016). The M–A constituents are mainly the dot-like shape at the heat input of 50 kJ/cm, dot-like and slender shape at the heat input of 100 kJ/cm, and dot-like shape and slender and block shape at the heat inputs of 150 and 200 kJ/cm, respectively. With an increase in heat input, the aspect ratio of the M–A constituents increased, and the proportion of the slender and blocky M–A constituents also increased from 2.5 to 28%.
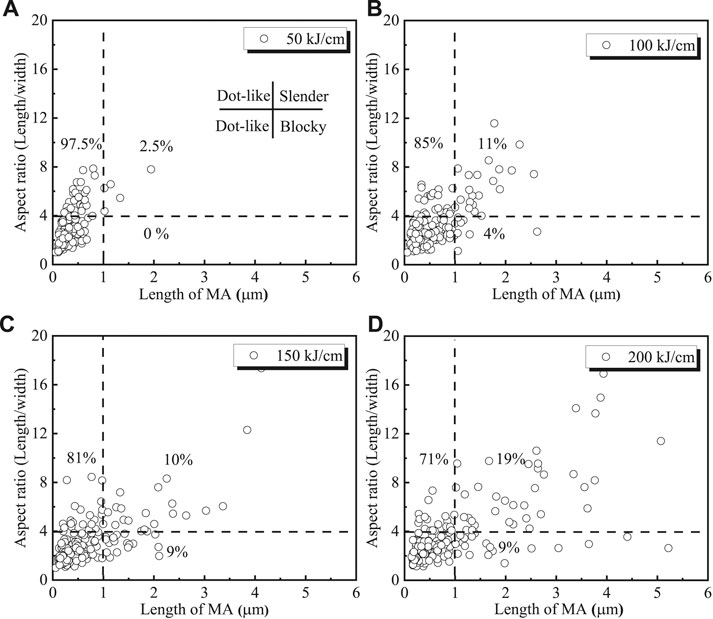
FIGURE 10. Effect of heat input on the length and aspect ratio of M–A constituents in the CGHAZ with the heat inputs of (A) 50, (B) 100, (C) 150, and (D) 200 kJ/cm.
Figure 11 shows SEM fracture morphologies of the fracture surfaces with the heat inputs of (A) 50, (B) 100, (C) 150, and (D) 200 kJ/cm, the inclusions in the tear ridges (E, F), and the fracture initiation site (G, H) at the heat input of 100 kJ/cm. Figure 11A shows that the ductile fracture zone consists of deep dimples with a larger size and shallow dimples with a small size at the heat input of 50 kJ/cm. Figure 11B shows the brittle zone at the heat input of 100 kJ/cm, which consists of quasicleavage facets and fatigue crack at the border of different facets. Figures 11C,D show the cleavage facets and river lines of the cleavage fracture at the heat inputs of 150 and 200 kJ/cm, respectively. The tear ridges with small dimples are found at the border of cleavage facets, which can absorb partial energy being beneficial to the toughness. Plenty of spherical inclusions with the size of 1–5 μm are found at the bottom of the dimples, and the EDS results show that these inclusions are CaO–Al2O3 compounds, as shown in Figures 11E,F, whereas the cleavage facets become large with a long river line at the heat input of 200 kJ/cm, indicating the worse impact toughness. It should be noted that the white particles are found at the cleavage initiation, as marked in Figures 11B,D, and the EDS line result shows the carbon content is larger than the matrix indicating these particles are M–A constituents in Figures 11G,H.
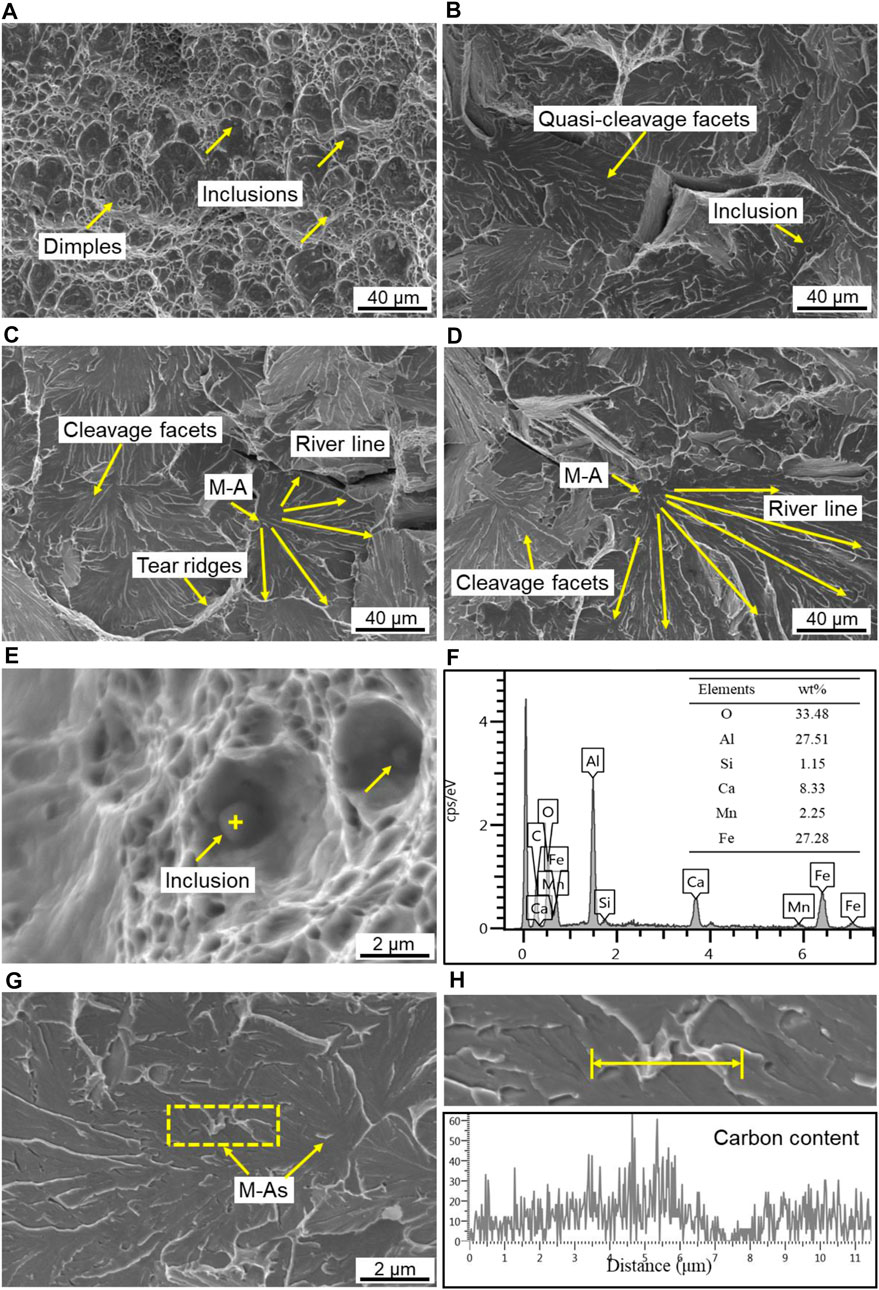
FIGURE 11. SEM fracture morphologies of the fracture surfaces at the heat inputs of (A) 50, (B) 100, (C) 150, and (D) 200 kJ/cm; the inclusions in the tear ridges (E, F); and the fracture initiation site (G, H) at the heat input of 100 kJ/cm.
Figure 12 shows SEM images of the secondary crack through the M–A cluster at the heat inputs of 100, 150, and 200 kJ/cm and the corresponding EDS mapping. The EDS mapping results in Figure 12B show these slender phases have higher C contents than the matrix, while Mo and Cr are uniformly distributed, indicating these phases are slender M–A constituents. The slender M–A constituents in the LB zone at the heat inputs of 100 and 150 kJ/cm are shown in Figures 12A,C, and these slender M–A constituents are cracked directly when the secondary crack passes through. As can be seen from Figure 12D, the blocky M–A constituents locate at the GB boundaries at the heat input of 200 kJ/cm. The secondary crack crosses the matrix rather than the blocky M–A constituents, and the microcracks are formed at the M–A/matrix interface through interface decohesion. It is demonstrated that the fracture initiation by slender and blocky M–A constituents is different.
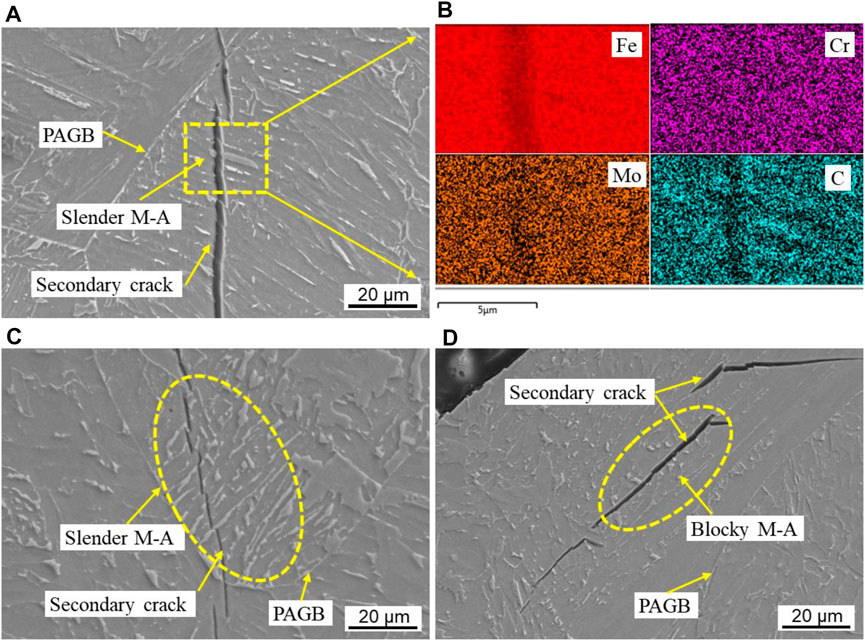
FIGURE 12. SEM images of the secondary crack through the M–A cluster at the heat inputs of (A) 100, (C) 150, and (D) 200 kJ/cm and the corresponding EDS mapping (B) for (A).
The CGHAZ microstructure consists of the matrix phases of LB, GB, and AF and the secondary phases of M–A constituents and carbides. The experimental steel has a low carbon content indicating the carbides are rare by comparison with the ferrite matrix, and XRD patterns show that the carbides have little difference at the heat inputs of 50, 100, 150, and 200 kJ/cm, as shown in Figure 8. Therefore, the matrix microstructure in CGHAZ is divided into LB and GB based on its morphology according to the SEM observation, rather than upper bainite and lower bainite as reported in the work of Bramfitt and Speer, 1990. To calculate the Ac3 (Huda et al., 2016), Ac1 (Huda et al., 2016), Bs (Lee et al., 2017), and Ms (Lee et al., 2017) temperatures of the experimental steel, the following empirical formulas are described:
The Ac3, Ac1, Bs, and Ms temperatures are calculated to be 834.4, 709.7, 564.0, and 476.7°C, respectively. Since the cooling rate in the welding process is relatively slow due to larger heat input in the present work, the microstructures tend to transform from austenite to bainite ferrite rather than martensite.
Figure 13 shows the continuous cooling transition (CCT) curves at different cooling rates calculated by the thermal-dynamic software Jmatpro. It illustrates the transition paths of the ferrite starts curve (1 wt%), the pearlite starts curve (1 wt%), and the bainite start and end curves (1–99 wt%) at different cooling rates. The bainite transition starting temperatures increase with an increase in the heat input due to the decrease in the cooling rate. Especially, when the heat input is 50 kJ/cm, the bainite starting temperature is quite near the Ms temperature. The measured Vickers hardness is much higher than the matrix and the other specimens at the heat input above 100 kJ/cm, as shown in Figure 2B. Then, it can be deduced that the microstructure consists of LM/LB at the heat input of 50 kJ/cm.
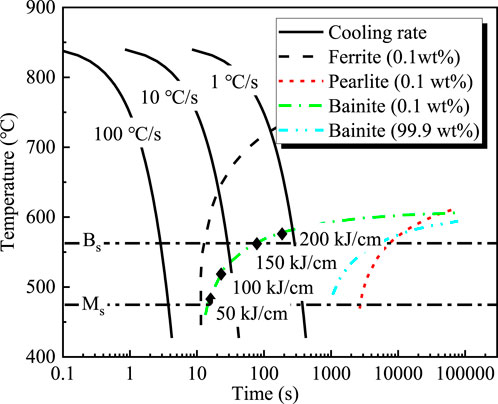
FIGURE 13. Continuous cooling transition curves at different cooling rates calculated by the thermal-dynamic software Jmatpro.
The sizes of the prior austenite grains increase with an increase in heat input, leading to the decrease in the prior grain boundaries. These prior austenite grain boundaries are always large-angle boundaries (LABs), which can beneficially hinder the crack propagation (Li et al., 2015) and can also reduce the nucleation energy of ferrite (Koseki and Thewlis, 2013). The distribution of LB in the grains reveals that the LB nucleates and grows preferentially at the grain boundaries. It is widely accepted that the IAFs can improve the HAZ toughness by their interlock form, which can be promoted byfine particles such as calcium oxides. From the observation, it is hard to find a large number of IAFs in the HAZ in the present work due to the relatively higher tensile strength of the offshore engineering steel plate.
From the observation of the microstructures, it can be considered that the small austenite grain size, the fine LB/LM, and less M–A constituent and carbides are the main factors for the excellent toughness at the heat input of 50 kJ/cm. However, the impact toughness keeps constant, as shown in Figure 2A, as the heat input is increased. Figures 2, 3, and 5 show the obvious changes in microstructure and grain size and the evident difference in M–A constituents by comparison among the heat input of 50 kJ/cm and above.
Table 1 shows the schematic diagram of the transition in the microstructure and M–A constituents at the different heat inputs based on Figure 5. As the heat input is increased, the width of the bainite lath and the length and the width of the M–A constituents increase. The dot-like and slender M–A constituents occur at the LB boundaries, while the blocky M–A constituent occurs at the GB boundaries. When the heat input is 200 kJ/cm, the DP phase occurs at the locations of the M–A constituents.
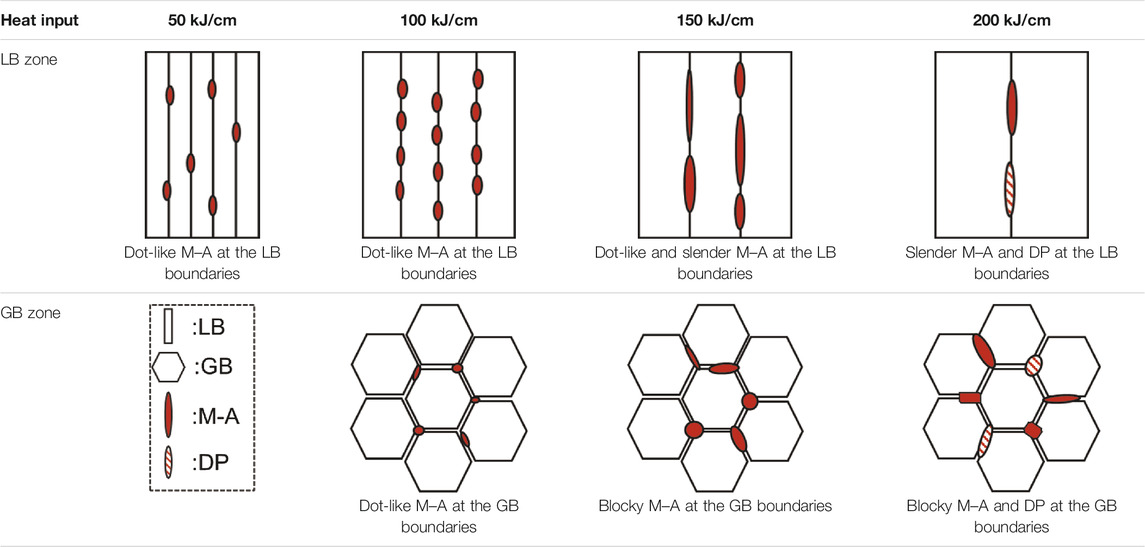
TABLE 1. The transition in the microstructure and M–A constituents in the CGHAZ at the heat input of 50, 100, 150, and 200 kJ/cm.
The carbon content of the M–A constituents is much higher than that in the matrix, as shown in Figure 7, and it is reported to be ranging from 0.6 to 1.1 wt% (Mohseni et al., 2013). Especially, the peak carbon contents are located at the edges of the blocky M–A constituent, as shown in Figure 7F. It indicates that the formation of the M–A constituent is related to the C diffusion during the phase transformation from austenite to ferrite. Biss and Cryderman (1971) also pointed out that the formation of the M–A constituents is mainly influenced by the cooling rate and diffusion of the carbon. During the γ to α transformation, the C in the ferrite is continuously expelled to the subgrain boundary, causing the increase in the C content at the γ/α interface, which also enhances the stability of the prior austenite. As the temperature further decreases, because the residual austenite with high C content partially transforms to martensite, the M–A constituent islands are generated. Takayama et al. (2018) found that the M–As are elongated along the growth direction or habit plane of the surrounding bainitic ferrite. In contrast, M–A surrounded by bainitic ferrites with different habit planes or elongation directions become blocky. It seems that the formation of the M–A constituent is both influenced by the cooling rate and the adjacent microstructures. The fast-cooling rate can produce the small dot-like and slender M–A constituent at the LB boundaries, while the slow-cooling rate can lead to the elongated and blocky M–A constituent at the GB boundaries.
The M–A constituents have an important effect on the impact toughness, and it is necessary to figure out the effect of M–A constituents on the fracture mechanism at −40 °C. Figure 11 shows that the fracture changes from ductile to quasicleavage and cleavage as the heat input is increased from 50 to 200 kJ/cm. It is evident that the M–A constituents are found to be the fracture initiation resulting in the cleavage fracture. In the current work, the M–A constituents at the grain boundaries are much lesser than those in grains. Figure 12 shows that the secondary crack crosses through the M–A cluster which consists of plenty of M–A constituents, and the crack type is different among the specimens at the heat inputs of 100, 150, and 200 kJ/cm. It demonstrates that slender M–A constituents crack more easily than the blocky M–A constituents, and the stress concentration caused by the M–A constituents is the main reason for the cleavage fracture. This is in accordance with the results reported by Davis and King (1994).
The effect of different shapes of M–A constituent on the toughness can be estimated by the Griffith fracture theory which can give a convincing explanation (Chen et al., 1984). The critical Griffith microcrack size c can be evaluated by the following equation:
Here, σc is the critical crack stress. E is Young’s modulus with a value of 210 GPa (Lan et al., 2011). γp is the effective surface energy with a value of 14 J∙m−2 (Chen et al., 1984). c is the microcrack size. In Eq. 5, the two most important parameters that affected critical fracture stress are γp and c. When the M–A constituents are regarded to be the fracturing source, the value of c is two times their width.
Figure 14 illustrates the effect of heat input on the width and critical crack stress of the M–A constituents with different morphologies which are calculated with Eq. 5. The critical fracture stress decreases due to the increase in the width so that the slender and blocky M–A constituents have smaller critical fracture stress. Minami et al. (1992) calculated the stress distributions around the slender and blocky M–A constituents by finite element analysis and found that the slender M–A constituents are cracked at a lower load level than the blocky M–A constituents. Thus, both the slender M–A constituents and blocky M–A constituents are more deleterious to impact toughness than the dot-like M–A constituents.

FIGURE 14. Effect of heat inputs on (A) widths and (B) critical crack stresses of the M–A constituents in different shapes.
The present work aims to investigate the effect of welding heat inputs on the microstructure, M–A constituents, and the impact toughness of the CGHAZ in offshore engineering steel with Ca deoxidation. The main conclusions are as follows:
(1) With the heat input increased from 50 to 100 kJ/cm, the HAZ toughness decreased rapidly, while the measured microhardness decreases steadily.
(2) The microstructure in the CGHAZ consists of LB/LM, GB, AF, M–A constituent, and carbides. With an increase in the heat input from 50 to 200 kJ/cm, the grain sizes increased from 52 to 132 μm and the width of the bainite lath increased from 0.4 to 2 μm. The area fraction of LB is decreased, while the area fraction of GB is increased.
(3) With an increase in the heat input from 50 to 100, 150, and 200 kJ/cm, the quantitative characterization shows that the average width of M–A constituents grows from 0.3 to 0.6 μm and the average length grows from 0.5 to 0.9 μm. The area fractions are measured to be 5.3, 8.6, 6.9, and 6.1%, and the number density is 0.7, 0.5, 0.3, and 0.2 μm−2, respectively. The morphologies of M–A constituents change from dot-like to slender and blocky, which are deleterious to the impact toughness of HAZ.
(4) The fracture mechanism changes from ductile to quasicleavage and cleavage as the heat input is increased. As the M–A constituents are always found as the cleavage initiation, they should be responsible for the decrease in HAZ toughness when the heat input is above 100 kJ/cm.
The raw data supporting the conclusions of this article will be made available by the authors, without undue reservation.
DL: concept, writing, and experiment; JY: supervision and modification; YZ: modification; and YQ, GC, MY, and JD: funding acquisition.
This work was financially supported by the National Natural Science Foundation of China (Grant No. U1960202) and the Science and Technology Commission of Shanghai Municipality (No. 19DZ2270200).
Author YQ was employed by the company Zhongxing Energy Equipment Co., LTD.
The remaining authors declare that the research was conducted in the absence of any commercial or financial relationships that could be construed as a potential conflict of interest.
Biss, V., and Cryderman, R. L. (1971). Martensite and Retained Austenite in Hot-Rolled, Low-Carbon Bainitic Steels. Mmtb 2 (8), 2267–2276. doi:10.1007/bf02917559
Bonnevie, E., Ferrière, G., Ikhlef, A., Kaplan, D., and Orain, J. M. (2004). Morphological Aspects of Martensite–Austenite Constituents in Intercritical and Coarse Grain Heat Affected Zones of Structural Steels. Mater. Sci. Eng. A. 385 (1-2), 352–358. doi:10.1016/s0921-5093(04)00859-7
Bramfitt, B. L., and Speer, J. G. (1990). A Perspective on the Morphology of Bainite. Mta 21, 817–829. doi:10.1007/BF02656565
Chen, J. H., Kikuta, Y., Araki, T., Yoneda, M., and Matsuda, Y. (1984). Micro-fracture Behaviour Induced by M-A Constituent (Island Martensite) in Simulated Welding Heat Affected Zone of HT80 High Strength Low Alloyed Steel. Acta Metallurgica 32 (10), 1779–1788. doi:10.1016/0001-6160(84)90234-7
Davis, C. L., and King, J. E. (1994). Cleavage Initiation in the Intercritically Reheated Coarse-Grained Heat-Affected Zone: Part I. Fractographic Evidence. Mmta 25 (3), 563–573. doi:10.1007/bf02651598
Gladman, T., Fourlaris, G., and Talafi-Noghani, M. (1999). Grain Refinement of Steel by Oxidic Second Phase Particles. Mater. Sci. Technol. 15, 1414–1424. doi:10.1179/026708399101505400
Huang, G., Wan, X. L., and Wu, K. M. (2016). Effect of Cr Content on Microstructure and Impact Toughness in the Simulated Coarse-Grained Heat-Affected Zone of High-Strength Low-Alloy Steels. Steel Research Int. 87 (11), 1426–1434. doi:10.1002/srin.201500424
Huda, N., Midawi, A. R. H., Gianetto, J., Lazor, R., and Gerlich, A. P. (2016). Influence of Martensite-Austenite (MA) on Impact Toughness of X80 Line Pipe Steels. Mater. Sci. Eng. A 662, 481–491. doi:10.1016/j.msea.2016.03.095
Kato, T., Sato, S., Ohta, H., and Shiwaku, T. (2011). Effects of Ca Addition on Formation Behavior of TiN Particles and HAZ Toughness in Large Heat Input Welding. Kobelco Technology Review 61 (30), 32–35.
Kojima, A., Kiyose, A., Uemori, R., Minagawa, M., Hoshino, M., Nakashima, T., et al. (2004). Super High HAZ Toughness Technology with Fine Microstructure Imparted by Fine Particles. Nippon Steel Tech. Rep. 90, 2–6.
Koseki, T., and Thewlis, G. (2013). OverviewInclusion Assisted Microstructure Control in C-Mn and Low alloy Steel Welds. Mater. Sci. Technol. 21 (8), 867–879. doi:10.1179/174328405x51703
Lan, L., Qiu, C., Zhao, D., Gao, X., and Du, L. (2011). Microstructural Characteristics and Toughness of the Simulated Coarse Grained Heat Affected Zone of High Strength Low Carbon Bainitic Steel. Mater. Sci. Eng. A 529, 192–200. doi:10.1016/j.msea.2011.09.017
Lee, S. G., Lee, D. H., Sohn, S. S., Kim, W. G., Um, K.-K., Kim, K.-S., et al. (2017). Effects of Ni and Mn Addition on Critical Crack Tip Opening Displacement (CTOD) of weld-simulated Heat-Affected Zones of Three High-Strength Low-alloy (HSLA) Steels. Mater. Sci. Eng. A 697, 55–65. doi:10.1016/j.msea.2017.04.115
Li, X., Ma, X., Subramanian, S. V., and Shang, C. (2015). EBSD Characterization of Secondary Microcracks in the Heat Affected Zone of a X100 Pipeline Steel weld Joint. Int. J. Fract. 193 (2), 131–139. doi:10.1007/s10704-015-0024-3
Li, Y., and Baker, T. N. (2013). Effect of Morphology of Martensite-Austenite Phase on Fracture of weld Heat Affected Zone in Vanadium and Niobium Microalloyed Steels. Mater. Sci. Technol. 26 (9), 1029–1040. doi:10.1179/026708309x12512744154360
Minami, F., Jing, H., Toyoda, M., Kawabata, F., and Amano, K. (1992). Role of Stress and Strain Fields in the Vicinity of Local Hard Zones in Fracture Toughness of Weld HAZ. J. Snaj, Nihon Zousen Gakkai Ronbunshu 1992 (171), 427–435. doi:10.2534/jjasnaoe1968.1992.427
Mohseni, P., Solberg, J. K., Karlsen, M., Akselsen, O. M., and Østby, E. (2013). Cleavage Fracture Initiation at M-A Constituents in Intercritically Coarse-Grained Heat-Affected Zone of a HSLA Steel. Metall. Mat Trans. A. 45 (1), 384–394. doi:10.1007/s11661-013-2110-3
Nagai, Y., Fukami, H., Inoue, H., Date, A., Nakashima, T., Kojima, A., et al. (2004). YS500N/mm2 High Strength Steel for Offshore Structures with Good CTOD Properties at Welded Joints. Nippon Steel Tech. Rep. 90, 14–19.
Okada, H., Ikeuchi, K., Matsuda, F., Hrivnak, I., and Li, Z. (1994). Metallographic Investigation of M-A Constituent : Toughness Deterioration and its Improvement of Weld HAZ with High Heat Inputs in 780 and 980 MPa Class HSLA Steels (Report 2). Q. J. Jpn. Weld. Soc. 12, 236–242. doi:10.2207/qjjws.12.236
Park, J.-Y., Park, J. K., and Choo, W. Y. (2000). Effect of Ti Addition on the Potency of MnS for Ferrite Nucleation in C-Mn-V Steels. ISIJ Int. 40 (12), 1253–1259. doi:10.2355/isijinternational.40.1253
Suzuki, S., Ichimiya, K., and Akita, T. (2005). High Tensile Strength Steel Plates with Excellent HAZ Toughness for Shipbuilding - JFE EWEL Technology for Excellent Quality in HAZ of High Heat Input Welded Joints. JFE Tech. Rep. 5, 24–29.
Takayama, N., Miyamoto, G., and Furuhara, T. (2018). Chemistry and Three-Dimensional Morphology of Martensite-Austenite Constituent in the Bainite Structure of Low-Carbon Low-alloy Steels. Acta Materialia 145, 154–164. doi:10.1016/j.actamat.2017.11.036
Terazawa, Y., Ichimiya, K., and Hase, K. (2018). Nucleation Effect of Ca-Oxysulfide Inclusions of Low Carbon Steel in Heat Affected Zone by Welding. Msf 941, 130–134. doi:10.4028/www.scientific.net/msf.941.130
Xu, L.-Y., Yang, J., Wang, R.-Z., Wang, Y.-N., and Wang, W.-L. (2016). Effect of Mg Content on the Microstructure and Toughness of Heat-Affected Zone of Steel Plate after High Heat Input Welding. Metall. Mat Trans. A. 47 (7), 3354–3364. doi:10.1007/s11661-016-3535-2
Yamashita, T., Shimamura, J., Oi, K., Nagoshi, M., Oikawa, K., and Ishida, K. (2015). Grain Refinement of Heat Affected Zone in High Heat Input Welding by Liquid Phase Pinning of Oxy-Sulfide. ISIJ Int. 55 (9), 2018–2026. doi:10.2355/isijinternational.ISIJINT-2015-033
Yan, H. Q., Wu, K. M., Wang, H. H., Li, L., Yin, Y. Q., and Wu, N. C. (2014). Effect of Fast Cooling on Microstructure and Toughness of Heat Affected Zone in High Strength Offshore Steel. Sci. Technol. Welding Joining 19 (4), 355–360. doi:10.1179/1362171814y.0000000201
Zhang, Y., Yang, J., Xu, L., Qiu, Y., Cheng, G., Yao, M., et al. (2019). The Effect of Ca Content on the Formation Behavior of Inclusions in the Heat Affected Zone of Thick High-Strength Low-Alloy Steel Plates after Large Heat Input Weldings. Metals 9 (12), 1328. doi:10.3390/met9121328
Zhu, K., and Yang, Z. (2011). Effect of Magnesium on the Austenite Grain Growth of the Heat-Affected Zone in Low-Carbon High-Strength Steels. Metall. Mat Trans. A. 42 (8), 2207–2213. doi:10.1007/s11661-011-0647-6
Keywords: offshore engineering steel, coarse-grained heat-affected zone, bainite, M–A constituents, impact toughness, Ca deoxidation
Citation: Liu D, Yang J, Zhang Y, Qiu Y, Cheng G, Yao M and Dong J (2021) Effect of Welding Heat Input on the Microstructure and Impact Toughness of HAZ in 420 MPa-Grade Offshore Engineering Steel. Front. Mater. 8:694586. doi: 10.3389/fmats.2021.694586
Received: 13 April 2021; Accepted: 11 June 2021;
Published: 01 July 2021.
Edited by:
Wangzhong Mu, Royal Institute of Technology, SwedenReviewed by:
Chao Wang, Northeastern University, ChinaCopyright © 2021 Liu, Yang, Zhang, Qiu, Cheng, Yao and Dong. This is an open-access article distributed under the terms of the Creative Commons Attribution License (CC BY). The use, distribution or reproduction in other forums is permitted, provided the original author(s) and the copyright owner(s) are credited and that the original publication in this journal is cited, in accordance with accepted academic practice. No use, distribution or reproduction is permitted which does not comply with these terms.
*Correspondence: Jian Yang, eWFuZ19qaWFuQHQuc2h1LmVkdS5jbg==
Disclaimer: All claims expressed in this article are solely those of the authors and do not necessarily represent those of their affiliated organizations, or those of the publisher, the editors and the reviewers. Any product that may be evaluated in this article or claim that may be made by its manufacturer is not guaranteed or endorsed by the publisher.
Research integrity at Frontiers
Learn more about the work of our research integrity team to safeguard the quality of each article we publish.