 John H Perepezko
 Meng Gao
 Jun-Qiang Wang
95% of researchers rate our articles as excellent or good
Learn more about the work of our research integrity team to safeguard the quality of each article we publish.
Find out more
REVIEW article
Front. Mater. , 30 June 2021
Sec. Ceramics and Glass
Volume 8 - 2021 | https://doi.org/10.3389/fmats.2021.663862
This article is part of the Research Topic Nanostructured Glass: Properties and Applications View all 4 articles
Strategies to change the properties of metallic glass by controlling the crystallization and the glass transition behavior are essential in promoting the application of these materials. Aside from changing the composition approaches to stabilize the glass and frustrate the nucleation and growth of crystals, new strategies at a fixed glass composition are of special interest. In this review, some recent work is summarized on new strategies to tune the properties of metallic glasses without changing composition. First, the nanocrystallization strategy is introduced that is based on the nanocrystallized microstructures such as those that develop in marginal Al-based metallic glasses. The heterogeneous and transient nucleation effects in the nanocrystallization reactions in Al-based metallic glasses are systematically investigated and can be assessed by the determination of delay time based on Flash DSC measurements. These results provide a basis to understand the strong effect of minor alloying additions on the onset of primary Al nanocrystallization and to design the novel Al-based composites with improved properties. Secondly, by an optimal annealing treatment, a liquid-cooled Au-based metallic glass can achieve very high kinetic stability to yield a large increase in glass transition temperature of 28 K and this is 3-5 times larger than the increase usually reported. The measured enthalpy decrease is about 50% of the difference between the as-cooled glass and the equilibrium crystalline state and reaches the extrapolated enthalpy of the supercooled liquid. Finally, the nano-glass strategy makes an Au-based nanoglass show ultrastable kinetic characters at low heating rate (e.g., 300 K/s) compared to a melt-spun ribbon, which is attributed to the kinetic constraint effect of nanoglobular interfaces. These results indicate that the nanoglass microstructure can act to increase metallic glass stability and provide another mechanism for the synthesis of ultrastable glass. These developments open new opportunities to improve the stability and properties and largely increase the application potentials of metallic glasses.
Since the first Au-based metallic glass (MG) (Sheng et al., 2006) was reported in 1960 by Duwez et al. (Klement et al., 1960), there has been a huge development in the area of MGs. In particular, bulk metallic glasses (BMGs) (the typical size is usually larger than 1 mm) have attracted a growing interest considering their superior mechanical properties, good corrosion resistance, excellent soft magnetic property, and potential thermoplastic formation ability (Schuh et al., 2007; Kumar et al., 2009b; Chen, 2011; Inoue and Takeuchi, 2011). Different from the traditional metallic glasses that are produced with a very high cooling rate (103–106 Ks−1), BMGs usually form at very low critical cooling rate, for example, the critical cooling rate for Pd-Ni-P system is only about 10 Ks−1 and the bulk size can reach to 10 mm in thickness (Drehman et al., 1982). While many kinds of metallic alloy compositions can be prepared as BMGs, one of the most difficult glass-forming systems is Al-based systems (Johnson, 1999; Suryanarayana and Inoue, 2011). As a typical metallic glass system, Al-based MGs display some special potentials in various demanding fields, such as good corrosion and wear resistance, high specific strength and lower density (Inoue et al., 1988; He et al., 1993; Wang et al., 2002). However, although a few studies have focused on Al-base BMGs, so far there are only a limited number of systems reported with sizes of 1 mm (Yang B. J. et al., 2010). Moreover, for most of Al-based MGs, the fcc-Al nanocrystals nucleate and precipitate during primary crystallization. Thus, how to effectively impede the nanocrystallization reaction is a key factor for improving the glass formation ability for Al-based MGs. On the other hand, by selectively introducing a great deal of nanoscale crystal particles into the glass matrix, the mechanical properties of Al-based MGs could be enhanced significantly (Wang et al., 2002; Mansouri et al., 2014; Singh et al., 2016). Compared to amorphous Al-based counterpart with limited sizes, the bulk nanocrystalline Al-based composites with nanocrystals dispersed in an amorphous phase matrix have become potential candidates for excellent structural materials. Therefore, the deep understanding of the nanocrystallization reaction kinetics during primary crystallization and the correlation with the intrinsic structural information for the glass state are of great importance for developing new Al-based BMGs and advanced nanocrystallized materials.
At present, there have been several strategies to realize the nanocrystallization reaction in Al-based MGs, such as the isothermal treatment, plastic deformation, corrosion treatment and the ion irradiation (Wang et al., 2002; Jiang and Atzmon, 2003; Huang et al., 2014; Mansouri et al., 2014; Wang et al., 2014b; Singh et al., 2016). Among these strategies, the devitrification from the glass state by isothermal treatment has been established as the most effective and controllable approach to study the nanocrystallization reactions (Wang et al., 2002; Jiang and Atzmon, 2003; Huang et al., 2014; Mansouri et al., 2014; Wang et al., 2014b; Singh et al., 2016). Although there has been a great deal of research focusing on the nanocrystallization reactions induced by isothermal treatment, the lack of knowledge on the thermal stability and the intrinsic microscopic structure in Al-based MGs largely impedes the deep understanding of the nanocrystallization reactions (Wilde et al., 1999; Ye and Lu, 2000; Perepezko, 2004; Révész et al., 2011). In addition, different from the stable glass formers with an obvious glass transition and supercooled liquid region by the tradition differential scanning calorimetry (DSC) with the heating rate of only several K/s, the measured DSC traces for most of the marginal Al-based MGs do not exhibit the thermal signal for glass transition and the critical information for the thermal stability of amorphous precursor state is still unknown (Wilde et al., 1999; Ye and Lu, 2000; Perepezko, 2004; Révész et al., 2011). Recently, one commercial chip-based fast differential scanning calorimeter, Flash DSC instrument was successfully developed and the heating rate and cooling rate can reach to 104 and 103 K/s, respectfully, which provides a good opportunity to characterize the stability for the amorphous precursor state (Zhuravlev and Schick, 2010). Flash DSC has been widely applied to study the melting, crystallization, phase transition and relaxations in various glassy materials, such as the polymers, amorphous alloys and other organic materials (Gao and Perepezko, 2019; Zhuravlev and Schick, 2010). In particular, it has been reported that the observation of an exothermic peak after an observed incubation time during isothermal tests clearly indicates that the nanocrystallization reaction in Al-based MGs is a heterogeneous nucleation and growth mechanism (Perepezko and Imhoff, 2010). What is more, several nanocrystal size distribution analysis studies also showed that there exists an incubation time before the observation of a high number density of nanocrystals, which is consistent with a transient heterogeneous nucleation mechanism (Perepezko, 2004; Shen and Perepezko, 2015; Zhao et al., 2018). This incubation time is an important parameter in the heterogeneous nucleation processes, and it is also called nucleation delay time. The delay time represents the time to establish a steady state cluster size distribution, which contains the key information about the glass formation, the thermal stability and nanocrystallization mechanism (Lu and Liu, 2002; Fokin et al., 2006). Meanwhile, many researchers found that the micro-alloying elements have a large effect on the nanocrystallization reactions and the glass formation in Al-based MGs (Bondi et al., 2007; Shen and Perepezko, 2017; Zhang et al., 2017). However, the complete atomic structure of MGs is still unresolved and it appears that there is no common atomic structure model for all kinds of MGs. Thus, the physical mechanism for the minor-alloying effect is uncertain. Meanwhile, it is known that the nucleation delay time corresponds to the time for the atomic diffusion motion during cluster formation (Perepezko, 2004; Shen and Perepezko, 2015; Zhao et al., 2018), so that it is critical to precisely determine the delay time experimentally. The usual method to determine the delay time at one temperature includes a determination of the nanocrystal number density by TEM and then the crystal number density with annealing time is plotted and finally the delay time can be obtained by extrapolating the slope line corresponding to the steady state nucleation stage to the time axis. The experimental scheme for this method is shown in Figure 1. Unfortunately, the above TEM method is time-consuming and inefficient (for one point at one temperature, it usually takes one week or even longer) (Perepezko, 2004). Thus, it is valuable to develop a new strategy to determine the delay time for nanocrystallization reaction, which is critical for investigating the relationship between nucleation, crystallization and glass formation and the physical mechanism of the minor-alloying effect for marginal Al-based MGs.
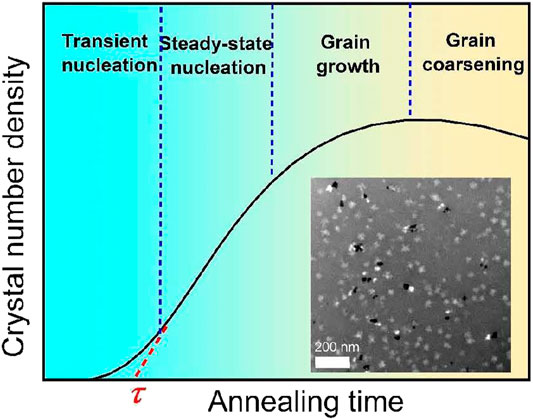
FIGURE 1. Experimental measurement method by TEM for the transient nucleation delay time τ in MGs. First, based on the TEM results corresponding to different annealing times, the plot of crystal number density and annealing time can be obtained. Then, extrapolating the steady state nucleation line as marked by red dashed line and the intersection point between the steady state nucleation line and the time axis is the delay time. The inserted picture gives one typical TEM image of the nanocrystal distribution in Al88Y7Fe5 MG.
Meanwhile, for MGs, there are many well-known advantages in various functional properties (Wang et al., 2012a; Wang et al., 2012b; Yu H. J. et al., 2013; Ju et al., 2020). However, due to their far-from-equilibrium nature, the properties of MGs change with time as they relax towards low energy states (Song et al., 2018), which denotes a low kinetic stability of MGs and hinders the potential applications at higher temperatures. The kinetic stability represents the ability to decrease the changing rate. Thus, it is a critical issue to increase the kinetic stability for the applications in MGs. Currently, it has been found that the kinetic stability of glasses can be increased by using vapor deposition fabrication methods (Swallen et al., 2007; Kearns et al., 2008; Ramos et al., 2011; Sepulveda et al., 2011; Daisman P.B.; Aji et al., 2013; Yu et al., 2013a; Wang J. Q. et al., 2014). Fast molecular/atomic mobility on the surface allows access to stable low energy states during deposition, which suggests a higher thermodynamic stability (Swallen et al., 2007; Sepulveda et al., 2011). Both high thermodynamic stability and high kinetic stability can develop in vapor-deposited glasses as signaled by an increase in glass transition onset temperature (Swallen et al., 2007; Kearns et al., 2008; Dawson et al., 2011; Ramos et al., 2011; Sepulveda et al., 2011; Daisman P.B.; Aji et al., 2013; Lyubimov et al., 2013; Wang J. Q. et al., 2014). However, vapor deposition methods are not suitable for preparing bulk materials. It is vital to develop efficient approaches towards bulk MGs with high kinetic stability and low enthalpy. Such approaches are valuable not only for supplying important new materials, but also for providing a critical set of comparisons with vapor-deposited ultrastable glasses and can enable the exploration of fundamental issues in amorphous materials.
Annealing below the glass transition temperature allows glasses to relax towards the equilibrium supercooled liquid (Song et al., 2018; Song L. et al., 2020; Song L. J. et al., 2020). During the relaxation process, the atomic packing structures will rearrange which is usually termed as structural relaxation. The kinetic stability usually increases along with the enthalpy decrease. For instance, Zhu et al. reported that annealing at 0.89Tg,h can increase Tg,h by about 8 K and decrease the enthalpy by about 23 J/g for Zr52.5Cu17.9Ni14.6Al10Ti5 (Zhu et al., 2013). Kohda et al. reported that annealing at 0.97Tg,h can increase Tg,h by about 7 K and decrease the enthalpy by about 3 J/g for Pt60Ni15P25 (Kohda et al., 2010). Haruyama et al. reported that annealing at 0.94Tg,h can increase Tg,h by about 13 K and decrease the enthalpy by about 5.5 J/g for Pd42.5Cu30Ni7.5P20 (Haruyama et al., 2014). However, sometimes, the enthalpy decreases during annealing without an increase in kinetic stability. For a Pd42.5Cu30Ni7.5P20 MG, it was found that annealing for short times (<200 s) could decrease both the enthalpy and the kinetic stability (Haruyama et al., 2014). An Au49Cu26.9Ag5.5Pd2.3Si16.3 MG exhibited a decrease of enthalpy by about 3.7 J/g but no obvious change in Tg,h after being annealed at 0.77Tg,h for one year (Evenson et al., 2014). A 20-million-year-old amber glass exhibited a decrease of enthalpy by about 26 J/g but no obvious change in Tg,h (Zhao et al., 2013); in contrast, 110-million-year-old amber exhibited a decrease of enthalpy by about 8 J/g and an increase of Tg,h about 15 K (Perez-Castaneda et al., 2014). Currently the understanding of the annealing effect on kinetic stability is incomplete and requires further study. At the same time it is likely that the kinetic stability of bulk MGs can be enhanced with optimized annealing.
On the other hand, as distinct from the bulk behavior of glasses, the free surface of glasses shows faster diffusion rate and stronger liquid character (Priestley et al., 2005; Fakhraai and Forrest, 2008; Yang et al., 2010b). Following deposition at appropriate temperatures, i.e. in the range of 0.7–0.95Tg vapor deposited glasses can exhibit ultrastable characters with a high Tgh (Swallen et al., 2007; Leon-Gutierrez et al., 2010; Ramos et al., 2011; Lyubimov et al., 2013). Moreover, it has been reported that the interfaces between the glass and other materials can also cause higher stability (Keddie et al., 1994; Alcoutlabi and McKenna, 2005; Priestley et al., 2005). In this case the behavior of polymer glasses can be controlled by contact with different interfaces. In addition, the recently developed Fe-based nanoglass with nanoglobular structure exhibits enhanced ferromagnetic behavior (Ghafari et al., 2012; Witte et al., 2013), but the thermal behavior of the nanoglobular structure is also intriguing. For example, by controlling the contribution of interfaces (Keddie et al., 1994; Alcoutlabi and McKenna, 2005; Priestley et al., 2005; Guo et al., 2012), it has been possible to obtain ultrastable nanoglobular MGs similar to that observed in organic glasses.
In this review, recent work on the nanocrystallization reaction in marginal Al-based MGs is discussed along with the improvement of kinetic stability in Au-based MG and nanoglass. First, based on the advanced Flash DSC platform with ultrafast heating rates, the key factors are examined for the thermal stability characterization for a typical Al-based MG-Al-Y-Fe system, the experimental investigation of the nucleation delay time and the minor-alloying effect on the thermal stability and nanocrystallization reactions. Secondly, the kinetic stability of a Au-based MG was largely enhanced by designing the optimal combination of annealing temperature and annealing time, which can be applied to various MG materials. Finally, for a new nanoglass material, which combines an ultrastable character and the nanoglobular microstructure, the kinetic behavior was systematically investigated.
For most of the known BMGs with excellent glass formation ability and good thermal stability, during continuous heating from the glass state, the thermal signal corresponding to the calorimetric glass transition is strong enough to be detected by conventional thermal instruments (such as DSC with a heating rate of several K/s) and then the supercooled liquid region can be determined, which enables the characterization of the nucleation and crystallization kinetics (Masuhr et al., 1999; Hays et al., 2001; Chen, 2011; Inoue and Takeuchi, 2011). In contrast, for various marginal MGs, such as the Fe-based and Al-based MGs, the strong primary crystallization signal is apt to overlap the weak thermal signal for glass transition and conventional DSC cannot observe the obvious glass transition (Zaluska and Matyja, 1983; Perepezko and Imhoff, 2010; Shen and Perepezko, 2017; Zhang et al., 2017). At the same time, different dynamic processes for the glass transition and the primary crystallization during continuous heating should follow different evolution paths with the change of the heating rates, and the evolution paths are roughly fitted by the Kissinger equation or the Arrhenius equation (Kissinger, 1956; Ruitenberg, 2003). At the lower heating rates, the thermal signals for these two dynamic processes are very close and the glass transition signal is easily overlapped by strong primary crystallization. In contrast, under higher heating rate, these two different dynamic processes with different evolution behaviors should be separated, which is out of the range of conventional DSC instruments. Recently, based on the advanced Flash DSC instrument with the maximum heating rate and cooling rate of 4 × 10⁴ and 1 × 10⁴ K/s, a new strategy was developed to detect the glass transition signal for the marginal Al-based MGs (Shen and Perepezko, 2018; Gao and Perepezko, 2019). By taking the typical Al88Y7Fe5 system as an example (Bondi et al., 2007; Perepezko and Imhoff, 2010; Shen and Perepezko, 2017), it was possible to observe the glass transition signal and evaluate the thermal stability for this MG system (Shen and Perepezko, 2018; Gao and Perepezko, 2019).
For the Al88Y7Fe5 MG system, the conventional DSC instrument (the used heating rate is 20 K/min, 0.33 K/s) was applied to measure the corresponding heat flow curve and the detailed heat flow curve with temperature can be seen in the inserted plot of Figure 2A. It is apparent that the heat flow curve measured by normal DSC exhibits the thermal signals corresponding to the primary and secondary crystallizations but no clearly defined glass transition signal before the primary crystallization is observed. Meanwhile, four representative continuous Flash DSC heating traces for the same Al88Y7Fe5 sample at different heating rates with 500, 1,000, 5,000 and 10,000 K/s are displayed in Figure 2A. Different from the conventional DSC heat flow curve, all of the Flash DSC heat flow curves for four heating rates exhibit both the obvious glass transition and primary crystallization signals. When the heating rate increases, both of the glass transition and the primary crystallization shift to the higher temperature range, which are consistent with the previous thermal behaviors for MGs (Masuhr et al., 1999; Hays et al., 2001; Ruitenberg, 2003). In addition, before the glass transition, there appears one wide exothermic reaction of relaxation. Considering that the ribbon-like MG samples were produced by the high-rate quenching melt-spinning method, there are attendant strains left in the surface of the samples. During heating, the strain energy stored in the ribbon-like samples is released and the relaxation results in the appearance of exothermic relaxation signal, which is the origin of the observed relaxation signal in Figure 2A. It is interesting to find that the heat flow curve measured by conventional DSC with the low heating rates does not show this kind of relaxation signal. This result indicates that the Flash DSC with high heating rates is a powerful tool to investigate some hidden physical processes, which are not detected during at low heating rates. Based on this idea, the Flash DSC was applied to uncover the hidden secondary Johari-Goldstein relaxations in various fragile MG systems (Gao M. and Perepezko J. H., 2020). Thus, the above results clearly show that the glass transition signals in marginal Al-based MGs can be separated from the primary crystallization under high heating rates.
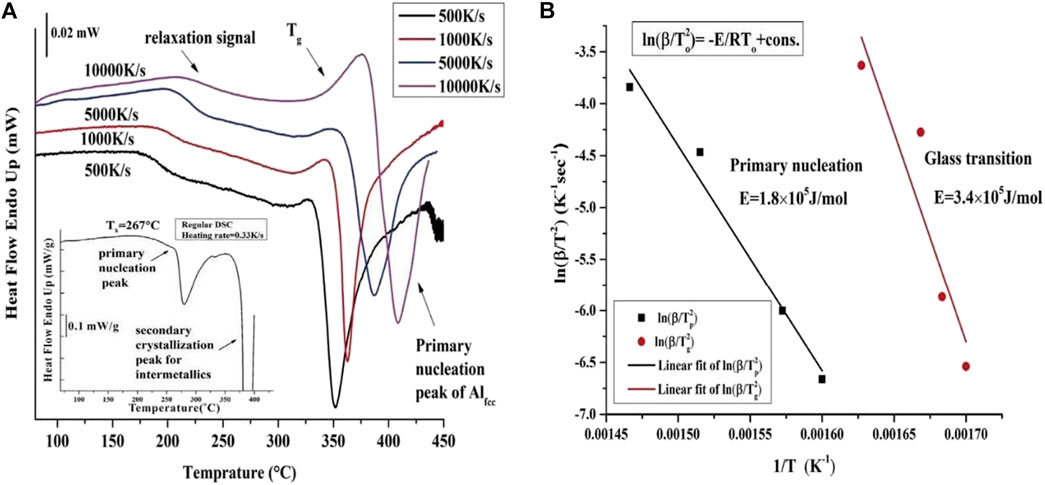
FIGURE 2. (A) Experimentally measured Flash DSC heat flow curves for Al88Y7Fe5 MG with four different heating rates of 500, 1,000, 5,000 and 10,000 K/s. The inserted plot gives the conventional DSC heat flow curve and the heating rate is 0.33 K/s. (B) The Kissinger plots for glass transition temperature Tg and the primary crystallization temperature Tp with different heating rates (from Shen et al. (2019)).
To more systematically investigate the evolution behaviors of glass transition and primary crystallization with different heating rates in marginal Al88Y7Fe5 system, according to the above measured heat flow curves with different heating rates by ultrafast Flash DSC in Figure 2A, we can determine the onset values for the glass transition and primary crystallization. Generally, the onset temperatures for the thermodynamic process (such as glass transition and the primary crystallization) for MGs can be roughly fitted by the traditional Kissinger equation of
The delay time for transient nucleation is usually considered as the onset time from the transient nucleation stage to the steady nucleation stage during the whole crystallization process as shown in Figure 1, at which the steady-state nucleation rate can be established. From the microscopic perspective, the delay time describes the required time to achieve the steady-state cluster size distribution as the nucleation rate evolves towards to a steady state value with increasing annealing time. Previous determination method of delay time at one temperature is based on many TEM measurements and is time consuming considering the preparation of TEM samples and the following TEM measurements (Perepezko, 2004). For amorphous materials, when the crystals appear in the amorphous matrix during primary crystallization, the composition of the matrix actually changes considering that the composition of the crystals is usually not same with the amorphous matrix. From this perspective, with the increase of annealing time at one temperature, the glass transition of the amorphous matrix evolves with annealing time before and after crystal appearance. The evolution before the crystals appear should be controlled by the structural relaxation effect in amorphous materials. For MGs, the sample is usually located in metastable states, which correspond to the local minima (basins) in the potential energy landscape (Debenedetti, 2001). Under external annealing treatment, there is a metastable state transition from a high energy state to a lower energy state and this energy state transition corresponds to the structural relaxation. During the structural relaxation, the chemical composition does not change and the physical properties do change, such as the elastic modulus, the hardness and the density (Wang, 2019). In contrast, the evolution after the crystals appear is obviously affected by the combined effect of the structural relaxation and the composition change. Therefore, the transient nucleation delay time of primary crystallization is the breaking point of glass transition temperature with annealing time from the evolution path by structural relaxation to another path by the combined effect of the structural relaxation and composition change. However, since conventional DSC methods cannot observe the obvious glass transition, this approach is not possible.
For an Al88Y7Fe5 MG as an example, at the temperature of 240°C, the Flash DSC heat flow curves with the same heating rate of 5000 K/s after different annealing times ranging from 30 to 3600 s were measured. The detailed measurement temperature program and the Flash DSC heat flow curves corresponding to different annelaed conditions at 240°C are shown in Figures 3A,B. It is obvious that all of Flash DSC heat flow curves display the obvious endothermic reaction signals corresponding to glass transition and the glass transition temperature Tg shifts to the higher temperature with the increase of annelaing time tanneal. These results are very close to the previous reseach on the structural relaxation effect on MGs (Slipenyuk and Eckert, 2004; Mei et al., 2011). To study the evolution of the glass transition temperature Tg with annealing time tanneal, Tg is plotted against tanneal at 240°C, as is shown in the middle part of Figure 3C. From the middle plot of Figure 3C, it is evident that with the increase of tanneal, there appears one turning time at 525 s. Before and after 525 s, the evolution paths of Tg with tanneal can be roughly fitted by two lines with different slopes, which represent two different effects-the structural relaxaton effect and composition change effect. Based on the above discussions, these two different evolution paths correspond to the structural relaxation effect and the compostion effect and the samples before and after the break points should be amorphous and contain nanocrystals, resepectively. What is more, to test if the delay time for primary crystallization corresponds to the experimental breaking time of glass transition temperature with annealing time, four state points were selected including the as-cast state (0 s) before and after the breaking time. Then, for these four annealed samples, TEM samples were prepared by FIB methods in order to observe the corresponding crystallization mophology. The corresponding TEM images were shown in Figure 3C. From the left and rights parts in Figure 3C, it is apparent that at 240°C, the samples with the annealing time of 0 s (as-cast state), 300 and 450 s before the breaking time are still amorphous without any crystals as displayed in the left picture of Figure 3C; in contrast, for the samples with the annealing itme of 600 s after the breaking time, a great deal of nanoscale crystals are observed, as shown in the down-right picture of Figure 3C. Thus, the above results and analyses verify that the breaking time of 525 s is actually the delay time at 240°C for the Al88Y7Fe5 MG.
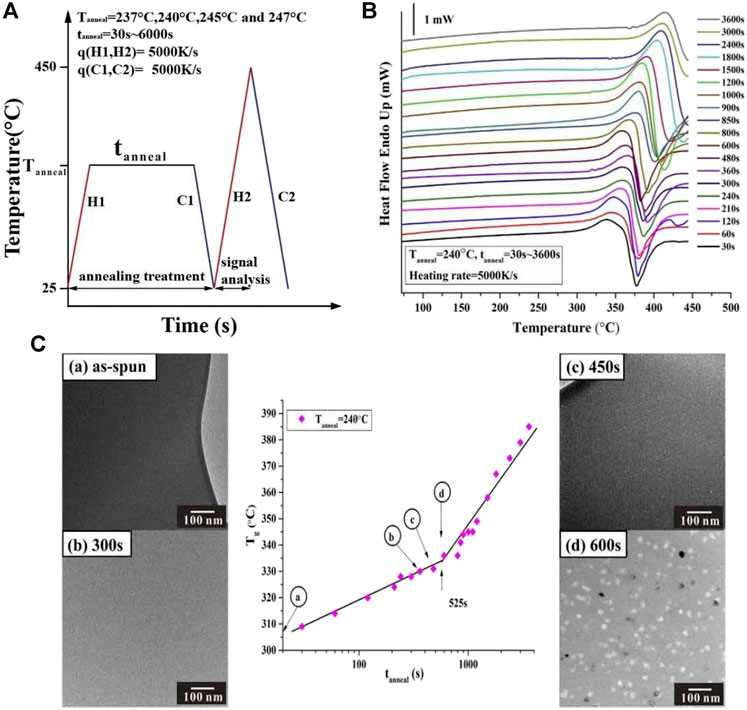
FIGURE 3. (A) Flash DSC temperature-time profile for determining the nucleation delay time for Al88Y7Fe5 MG. (B) Flash DSC heat flow curves at 240°C for a series of annealing times from 30 to 3,600 s under same heating rate of 5000 K/s. (C) Tg vs. log (tanneal) plot for Al88Y7Fe5 at Tanneal = 240°C. At 525 s, the evolution path of Tg with tanneal appears a transition from the structural relaxation and composition change and this transition point is the delay time at 240°C. Fgures (A)–(D) display the TEM results corresponding to different annealing states with the annealing time shorter (A,B,C) and longer (D) than the deal time, respectively, (from Shen et al. (2019)).
To exclude the applied heatng rate effect on the determination of the delay time, additional thermal experiments by Flash DSC with a different hetaing rate of 1000 K/s were selected to test the same Al88Y7Fe5 MG sample. The annealing temperature is also 240°C and the anneling times are ranging from 30 to 3,600 s, which are same with the previous values shown in Figure 3B. The relationship between the glass transition temperature Tg and the corresponding annealing time tanneal at 240°C can be poltted and exihibited in Figure 4. As an reference, the data for the heating rate of 5,000 K/s are also included in Figure 4. From Figure 4, the values of the delay times corresponding to two different heating rates are very close, which directly indicates that the detersmined delay time by this method does not depend on the applied heating rate.
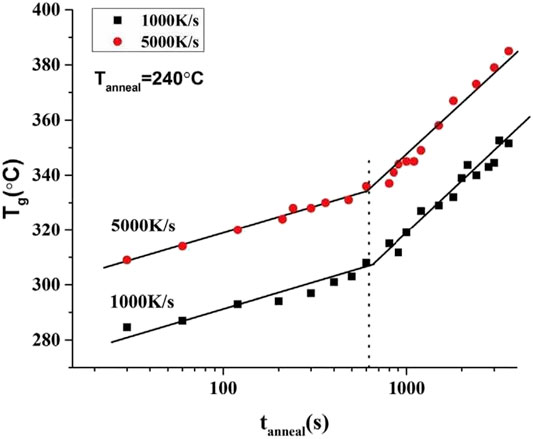
FIGURE 4. Plots of glass transition temperature Tg and annealing time tanneal with annealing temperature of 240°C for Al88Y7Fe5 under two different heating rates of 1,000 and 5,000 K/s. For two heating rates, both of the plots of Tg and tanneal show the breaking points and the values of the breaking points are very close, which implies that the determined delay time does not depend on the used heating rates. (from Shen et al. (2019)).
For the Al88Y7Fe5 MG, the delay times for three other temperatures (237, 245 and 247°C) can be obtained by the same startegy based on the Flash DSC platform. The relationship between the glass transition temperature Tg and the corresponding annealing time tanneal under these three tempertaures are displayed in Figures 5A–C. The values of the deay time at 237°C, 245 and 247°C are 966, 275, and 225 s, repectively. With the increase of the annealing time, the delay time decreases and the correlation between the annealing temperature and the delay time seems to be consistent with the Arrhenius process (Ruitenberg, 2003). From the microscopic atomic transportation perspecitve, the delay time is related with the random walk zone and it is dominated by the time for cluster growth by diffusion through the random walk zone during nucleation. Thus, it is reasonable that the relationship between delay time, t and temperature follows an Arrhenius ion equation:
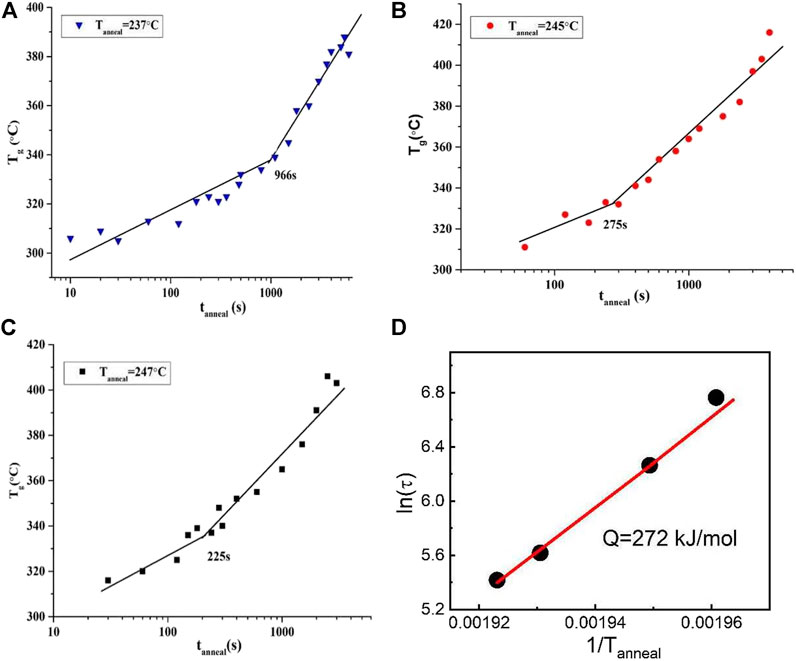
FIGURE 5. Tg vs. log (tanneal) plot for Al88Y7Fe5 at Tanneal (A) 237°C (B) 245°C (C) 247°C (from Shen et al. (2019)) (D) Delay time activation energy Q by fitting the Equation
For marginal Al-based MGs, different minor element substitution usually induces a significant change in the kinetic behavior (Bondi et al., 2007; Perepezko and Imhoff, 2010; Wang et al., 2012c; Shen and Perepezko, 2015, Shen and Perepezko, 2017; Zhang et al., 2017). For example, for Al-Y-Fe MG system, it has been reported that the minor-alloying of Pb element largely accelerates the primary crystallization, which plays a catalysing effect and induces an enhanced number of smaller fcc-Al nanocrystals (Shen and Perepezko, 2015). In contrast, the substitutions of Al, Y, and Fe by Cu in Al-Y-Fe system play different roles: the substitution of Y, Fe by Cu accelerates the primary crystallization by decreasing the crystallization temperature and increasing nanocrystal number density; the substitution of Al by Cu suppresses the primary crystallization by increasing the crystallization temperature and decreasing the nanocrystal number density (Perepezko and Imhoff, 2010). Although the same of 1% Cu was introduced into Al-Y-Fe system, the primary crystallization behaviors display significantly different evolution, which is of great importance for effectively tuning the nanocrystallization by selecting the proper minor-alloying elements. However, till now, there are only few researches being related to the minor alloying effect on the primary crystallization in marginal Al-based MGs (Deubener et al., 1993). On the other hand, due to the sensitivity of transient nucleation to the minor-alloying element, it is essential to study the minor-alloying effect on the nanocrystallization and the correlated nucleation delay time. However, the precise determination of delay time experimentally is relatedly difficult based on the current experimental instrument and methods and it usually takes a long time to confirm one delay time. Here, based on the Flash DSC instrument and the above strategy to measure the delay time, by taking the Cu element as an example, the minor alloying effect was systematically studied on the nanocrystallization and delay time of the marginal Al88Y7Fe5 MG. For other minor-alloying elements, the similar experiments and analyses can be conducted in the same way.
For the typical Al-based MG composition of Al88Y7Fe5, when a 1% Cu substitutes separately for the Al, Y and Fe, three different compostions can be obtained: Al87Y7Fe5Cu1, Al88Y6Fe5Cu1 and Al88Y7Fe4Cu1. For primary crystalization, the conventional DSC can detect the change of the primary crystallization. In Figure 6A, the heat flow curves measured by the conventional DSC with the heating rate of 0.33 K/s for the above three compositions by Cu minor-alloying were displayed. From Figure 6A, one can clearly see: when the Cu, respectively, replaces 1% Al, Y, and Fe in Al88Y7Fe5, the primary crystallization temperature for different displacements has different changes. First, when the Cu replaces 1% of Y and Fe, the primary crystallization temperature increases 46°C (from 266 to 220 K) and 45°C (from 266 to 221 K) decrease of primary crystallization temperatureTx1 respectfully. In contrast, a Cu substitution for 1% of Al induces an increase of Tx1 about 11°C (from 266 to 277 K). These results clearly show that different minro-alloyings play different roles in the primary crystallization for Al-based MGs. Obviously, the 1% Cu doping by decreasing 1% Al in the Al88Y7Fe5 MG suppresses the primary crystallization and the primary crystallization temperature is increased by 11°C. By comparison, the 1% Cu doping by decreasing 1% Y and Fe in the Al88Y7Fe5 MG significantly accelerates the primary crystallization and the primary crystallization temperature was largely decreased. From a thermodynamics perspective, the 1% Cu minor-alloying should have a weak effect on the nucleation driving free energy and barely change in the interfacial energy between the nuclei and the glass matrix. From this view, the minor alloying effect by Cu doping should play the similar roles for different substituted elements. Thus, the traditional thermodynamic parameters cannot give the good explanations for the obvious primary crystallization changes experimentally. Meanwhile, for the nucleation delay time at one temperature, it should be closely related to the atomic diffusion motion during heating within the experimental delay time. Then, the minor-alloying of 1% Cu substitution should induce the huge change for the atomic diffusion during nucleation. Thus, to deeply understand the physical mechanism of 1% Cu doping effect on nanocrystallization reactions in marginal Al-based MG, it is critical to obtain the information of the transient delay time being related to the basic atomic diffusion motion.
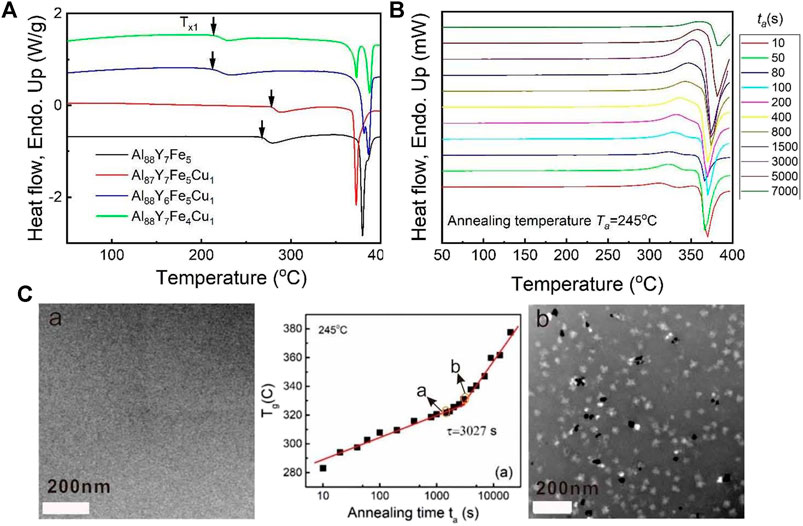
FIGURE 6. (A) Conventional DSC heat flow curves for 1% Cu-doped Al-Y-Fe MG systems under the heating rate of 0.33 K/s. (B) Flash DSC heat flow curves with a series of annealing times ta from 10 to 7,000 s at 245°C for the comosition of Al87Y7Fe5Cu1 under the heating rate of 1000 K/s. (C) (Middle plot) The plot of Tg and logta for Al87Y7Fe5Cu1 at 245°C. TEM images were taken from a series of annealed Al87Y7Fe5Cu1 samples when the annelaing time is smaller (2,000 s corresponding to picture of (A) and larger (4,000 s corresponding to picture of (B)) than the experimental delay time of 3,027 s. (from Gao et al. (2019)).
Similar to the delay time confirmation of Al88Y7Fe5 MG, for three Cu-doped Al-Y-Fe MG systems, a series of Flash DSC tests at one temperature with different annealing times were conducted. In Figure 6B, the Flash DSC heating curves are shown for the Al87Y7Fe5Cu1 MG with a series of annealing times from 10 to 7,000 s under the same temperature of 245°C. All heat flow curves display the obvious endothermic signals of glass transition and the exothermic signals of primary crystallization, which further verifies the validity for the method of observing the glass transition signal by Flash DSC in various marginal Al-based MGs. When the annealing time increases, both the glass transition and primary crystallization signals shift to the high temperature range, which is consistent with the previous research (Slipenyuk and Eckert, 2004; Mei et al., 2011). According to the heat flow curves in Figure 6B, the corresponding plot of Tg with ta at 245°C for Al87Y7Fe5Cu1 MG can be obtained as displayed in Figure 6C. One breaking time in the plot of Tg with ta at 245°C is evident and two different evolution paths should correspond to the structural relaxation effect and composition change effect. To confirm if the breaking point corresponds to the delay time of the primary crystallization, two annealing time points (points a and b) before and after the break point (as shown in the middle part of Figure 6C) were selected and the corresponding TEM images are displayed in the left and right part of Figure 6C. At point a, the sample is amorphous and there is no indication of crystallization; at point b, there appear many nanocrystals. Thus, the break point of 3,027 s is the delay time of Al87Y7Fe5Cu1 MG at 245°C. In the same way, based on this Flash DSC measurement strategy, the delay times for Al87Y7Fe5Cu1, Al88Y6Fe5Cu1 and Al88Y7Fe4Cu1 corresponding to four different annealing temperatures are measured and the detailed results are shown in Figures 7A–C. For all compositions, when the annealing temperature is increased, the corresponding delay time decreases which is consistent with the previous results of Al88Y7Fe5 in Figure 5. Based on the delay time data for all compositions, the delay time activation energies are determined by applying the Arrhenius equation
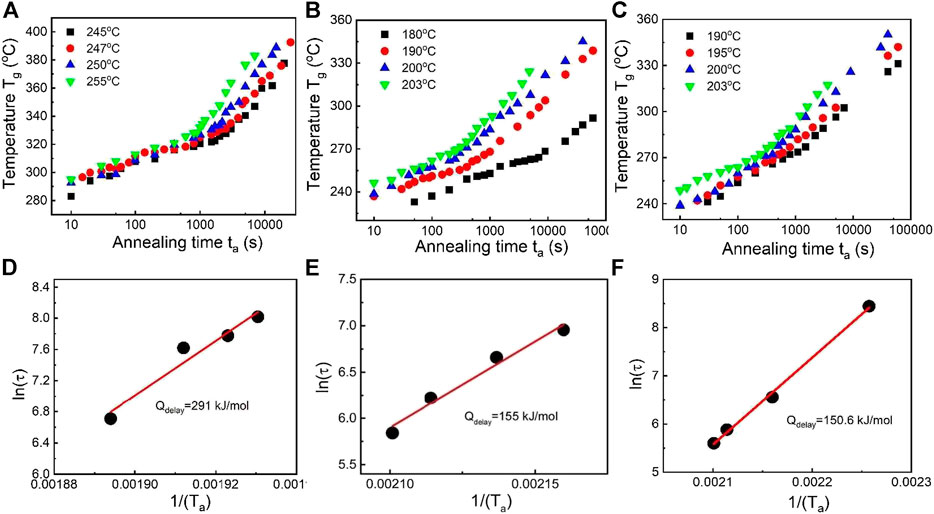
FIGURE 7. Tg vs. logta plot for Cu-doping Al88Y7Fe5 systems at different Ta: (A) Al87Y7Fe5Cu1, (B) Al88Y6Fe5Cu1, (C) Al88Y7Fe4Cu1. Delay time activation energy Qdelay by fitting the Equation of
To quantitatively investigate the 1% Cu doping on the primary crystallization and the corresponding delay time in Al88Y7Fe5 MG, we can obtain the delay time at 250 °C for all compositions from the fitted curves by Equation
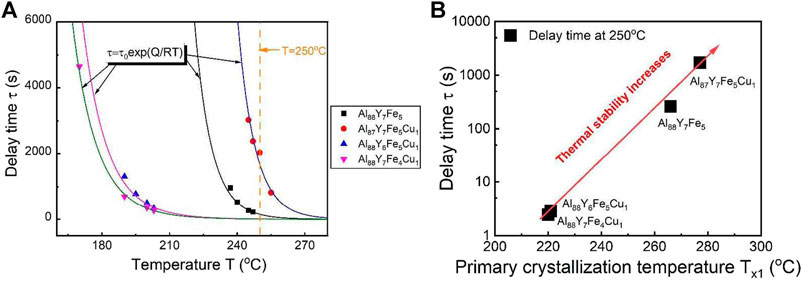
FIGURE 8. (A) Plot of delay time and temperature for Al88Y7Fe5, Al87Y7Fe5Cu1, Al88Y6Fe5Cu1, and Al88Y7Fe4Cu1. To determine the values of the delay time at 250°C for four compositions, one orange dashed line was plotted and the intersections between the orange line and the curves of the delay time and temperature were the delay times. (B) Correlation between the values of delay time at 250°C and the primary crystallization temperature for Al88Y7Fe5, Al87Y7Fe5Cu1, Al88Y6Fe5Cu1, and Al88Y7Fe4Cu1. From the red arrowed trend curve, the larger of the delay time, the larger of primary crystallization temperature and the better of the thermal stability (from Gao et al. (2019)).
For MGs, there have been several criteria to roughly estimate the glass formation ability. For example, the common criteria are the critical cooling rate, the critical size for glass formation, the reduced glass transition temperature (Tg/TL), the supercooled liquid region (Tx1-Tg), and the γ parameter (Tx1/(Tg + Tl)) (Lu and Liu, 2002). However, these criteria are not effective for all MG systems. In contrast, the direct criteria, such as the critical cooling rate or critical size for glass formation, should be always effective for deciding the glass formation ability but these criteria are not easy to precisely confirm by experiments. Thus, a more direct and effective criteria for glass formation is needed, especially for the marginal Al-based MGs. It has been known that the delay time is the time when the crystalline phases can be detected in one amorphous material. Usually, the longer of delay time, the higher of crystallization resistance ability for this amorphous system. At the same time, considering the relationship between the delay time activation energy and atomic diffusion activation energy, the larger of delay time activation energy, the slower the atomic diffusion. Thus, from this view, the longer of the delay time and the larger of the delay time activation energy, the better of the glass formation ability. Thereforethe delay time at one temperature may be considered as another criterion for glass formation. To test if the above deduction is reasonable, the critical wheel speed range was obtained for glass formation for the above Cu-doping compositions based on melt spinning methods. For the melt-spinning methods, the critical cooling rate is roughly proportional to the critical wheel speed range and the critical wheel speed range is inversely proportional to the critical size of glass-formers (Lin and Johnson, 1995). To characterize the glass formation ability for these marginal Al-based glass-formers, for each Al-based composition, a series of ribbons corresponding to a series of wheel speeds was produced and then XRD was used to determine the wheel speed range for forming a fully amorphous sample. To exclude the composition effect, all ribbons are from the same ingot. As shown in Figure 9A, for Al88Y7Fe5, the critical wheel speed range for glass formation is between 10 and 15 m/s. By the same method, for the other three Cu-doped Al-Y-Fe systems, the critical wheel speed ranges can also be obtained. Then, the critical wheel speed range and the corresponding delay time activation energy for all compositions are plotted in the Figure 9B. It is clear to see that the delay time activation energy displays a negative correlation with the critical wheel speed range for glass formation, that is, it is positive to the glass formation ability, which verifies the deduction about the relationship between delay time and the glass formation ability. Thus, from the perspective of the nucleation and crystallization, the delay time activation energy may be another criterion to decide if an alloy has a good or poor glass formation ability.
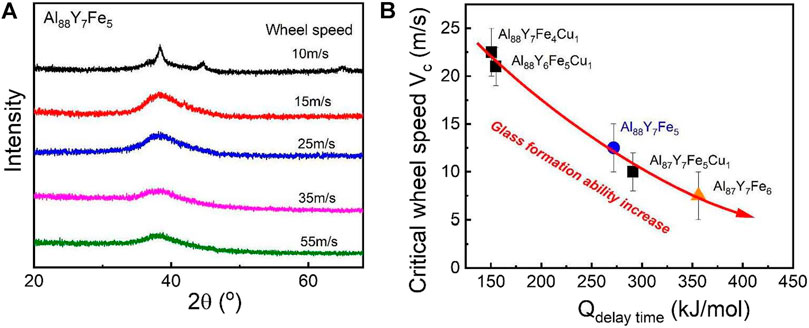
FIGURE 9. (A) The determination method of the critical wheel speed range for glass formation of Al88Y7Fe5 based on XRD. (B) Correation between the delay time activation energy and critical wheel speed for glass formation for Al-Y-Fe MG systems (from Gao et al. (2019)).
It should be noted that the research strategy on the nanocrystallization reactions based on the Flash DSC instrument is universal and can be applied to study the nanocrystallization behaviors in other MGs and amorphous materials. Actually, the similar research strategy has been applied to study the nanocrystallization behaviors of another typical Fe-based MGs including the delay time confirmation and the minor-alloying effect, which have been included in our unpublished works. Here, the research on Al-based MG has been used as an example to show the detailed research process and the feasibility based on the Flash DSC to study the nanocrystallization behaviors of amorphous materials, which is a powerful tool to investigate various metastable phase transition behaviors.
To reveal the annealing effect on the kinetic stability of metallic glass, Figure 10A shows representative DSC curves of the heat capacity (Cp) for Au49Cu26.9Ag5.5Pd2.3Si16.3 amorphous alloys annealed at 373 K for various times. Both the Cp overshoot at the glass transition and the glass transition onset temperature (Tg,h) increase along with the increase of annealing time. A maximum increase of 28 K is obtained for Tg,h. For the supercooled liquid, the Cp and crystallization temperature (Tx) do not change, which indicates that the annealed glasses remain fully amorphous. The enthalpy of the glass (HG), the liquid (HL) and the crystal (HC) are obtained by integrating Cp, as shown in Figure 10B. The orange solid curve in Figure 10B shows the fitting results for HL using a polynomial equation,
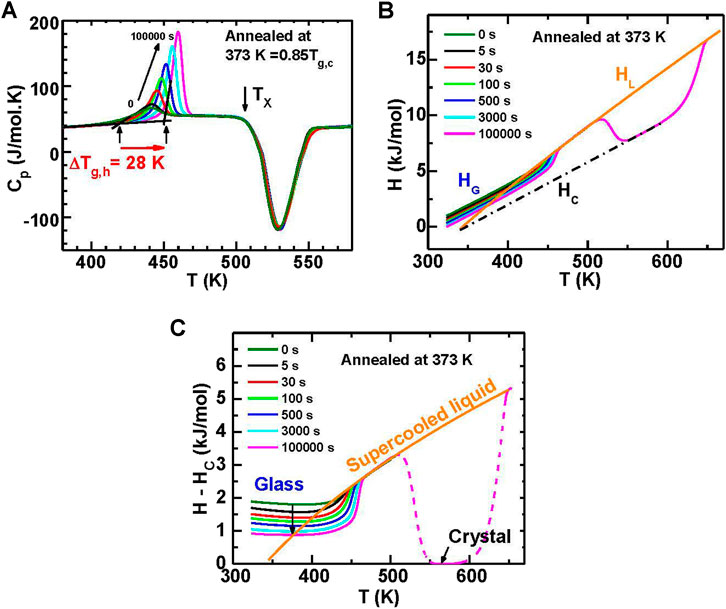
FIGURE 10. (A) Heat capacity (Cp) for the samples annealed at 373 K (= 0.85 Tg,c) for various times (0–105 s). The onset glass transition temperature (Tg,h) increases by 28 K from 424 to 452 K after being annealed for 105 s. (B) The enthalpy of annealed samples. (C) The relative enthalpy of annealed samples obtained by subtracting HC. (from (Wang et al., 2016)).
The enthalpy change (ΔH) of the MG during isothermal annealing is shown vs. the annealing temperature and the annealing time in Figure 11. First, to measure the T-dependent ΔH, the sample was annealed at various temperatures for a constant time, as shown in Figure 11A. For a given annealing time, ΔH reaches a minimum at a temperature (Tmin) below Tg,c. The Tmin decreases as the annealing time increases. On the low temperature side, the ΔH decreases systematically. On the high temperature side, it does not keep decreasing but merges into a single curve when the annealing time is long enough. In addition, Figure 11B shows the dependence of ΔH on annealing time at a given temperature. For example, at 403 K, ΔH initially decreases with increasing annealing time till reaches a constant.
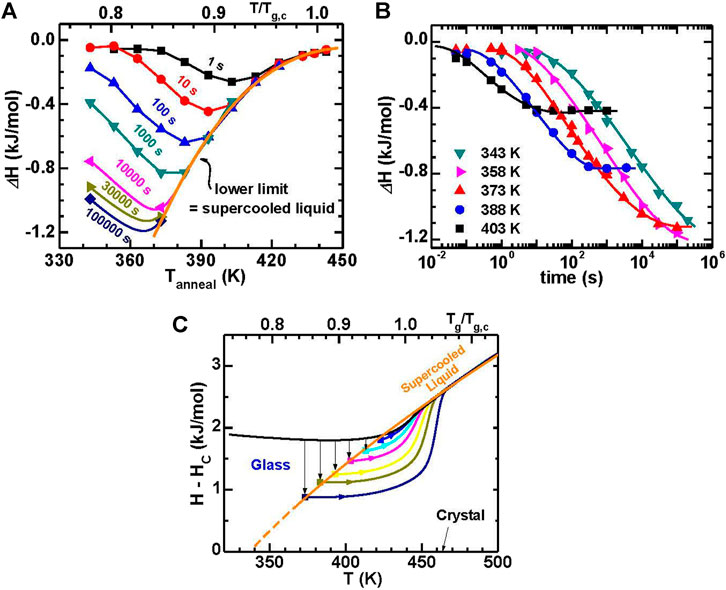
FIGURE 11. (A) The enthalpy decrease (ΔH) for a Au49Cu26.9Ag5.5Pd2.3Si16.3 glass with different annealing temperatures at constant annealing times. (B) The ΔH along with annealing time for the glasses annealed at five representative temperatures. (C) Enthalpy evolution with temperature for fully-relaxed glasses marked by solid symbols. The evolution paths falls onto the extrapolation curve of the supercooled liquid enthalpy. For comparison, the enthalpies with temperature during heating for the fully-relaxed glasses are shown as solid curves. The enthalpy for the as-cast glass marked by black curves is also displayed (from (Wang et al., 2016)).
As a further illustration of the annealing response, it is evident that the ΔH trends converge at high temperature in Figure 11A and reach a constant level at long annealing time in Figure 11B. The filled symbols in Figure 11C represent the enthalpies of fully-relaxed glasses, which fall onto the extrapolation of the supercooled liquid. This denotes that both the long-time plateaus in Figure 11B and the lower limit in Figure 11A represent the equilibrium supercooled liquid (ESL). In order to obtain the lowest enthalpy glass the annealing temperature and time are controlled by the combination of relaxation kinetics and the equilibrium supercooled liquid state. This is similar to the synthesis of ultrastable vapor-deposited glasses, where substrate temperature represents the annealing temperature and deposition rate relates to the annealing time (Kearns et al., 2008; Dawson et al., 2011). The maximum enthalpy loss for a given annealing time occurs at the temperature where the sample is not in equilibrium, as shown in Figure 11A.
Figure 12 shows the conceptual pictures of the evolution of enthalpy during annealing, as 2D and 3D contour plots the temperature and time dependence of ΔH. The enthalpy of the glass decreases monotonously along with time due to physical aging. For a sufficiently long time, the enthalpy reaches a constant value which corresponds to the ESL state. The time to reach the ESL increases with decreasing temperature. In the ESL state the sample is metastable and prone to crystallization. In previous investigations, the glass forming ability has been judged based upon the isothermal crystallization temperature-time-transformation (TTT) diagram. While this is useful there has been little attention to the isothermal annealing process before crystallization. Figure 12B proposes that the sample experiences two stages during isothermal annealing before crystallization: the first is a nonequilibrium stage (relaxing glassy state) and the second is an equilibrium stage (metastable supercooled liquid).
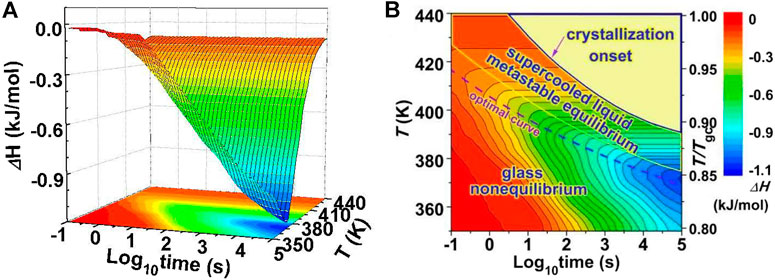
FIGURE 12. (A) Three-dimensional plot and (B) Two-dimensional contours of enthalpy decrease (ΔH) for a Au49Cu26.9Ag5.5Pd2.3Si16.3 glass vs. isothermal annealing time (logarithmic) and annealing temperatures. From Figure 12B, the enthalpy diagram is divided into two regions before the crystallization appears: the nonequilibrium glass state and the metastable equilibrium supercooled liquid state. The optimal annealing temperatures to achieve the lowest enthalpy are exhibited by the dashed curve (from (Wang et al., 2016)).
The alpha relaxation time (τα = 0.0032 s) is determined using AC measurement, as shown in Figures 13A,B. Figures 13C,D show the isothermal glass-to-liquid transition time (ttrans) at 428 K for the highly stable glass that equilibrated at 373 K. Figure 13E shows the τα and the ttrans for the glasses equilibrated at 373 and 388 K. For a given temperature, if the ttrans is much larger than τα, it denotes a high kinetic stability. The isothermal evolution of the fictive temperature (Tf, the cross temperature of the glass enthalpy and liquid enthalpy) or glass enthalpy (H) follows a single temperature step from equilibrium (T0) at time t1 that can be described using Tool-Narayanaswamy-Moynihan (TNM) model (Moynihan et al., 1976)
where t is the relaxation time at temperature T0 + ΔT, T0 is the initial equilibrium temperature, ϕ(t-t1, t) is both a non-exponential and a nonlinear function which is expressed as
where 0 < β ≤ 1 denotes a non-exponential character; a smaller β denotes a broader distribution of the spectrum of relaxation times. The relaxation time τ0 is given as
where R is the gas constant. A is the extrapolated time according to the Arrhenius equation representing the characteristic time at infinite high temperature. The x (0 ≤ x ≤ 1) partitions the material dependence between temperature and structure (Tf). The Δh is the activation enthalpy for the relaxation process and expresses the temperature dependence of the relaxation time for the linear regime close to equilibrium:
where τ0e is the τα in the equilibrium state, as shown in Figure 13F. The value of A and Δh is determined to be A = 10–51±1 s and Δh = 395 ± 8 kJ/mol. The kinetic fragility m of the glass-forming liquid is determined to be about 49 ± 1 according to the Angell plot of τα, as is shown in Figure 13F (Angell, 1995).
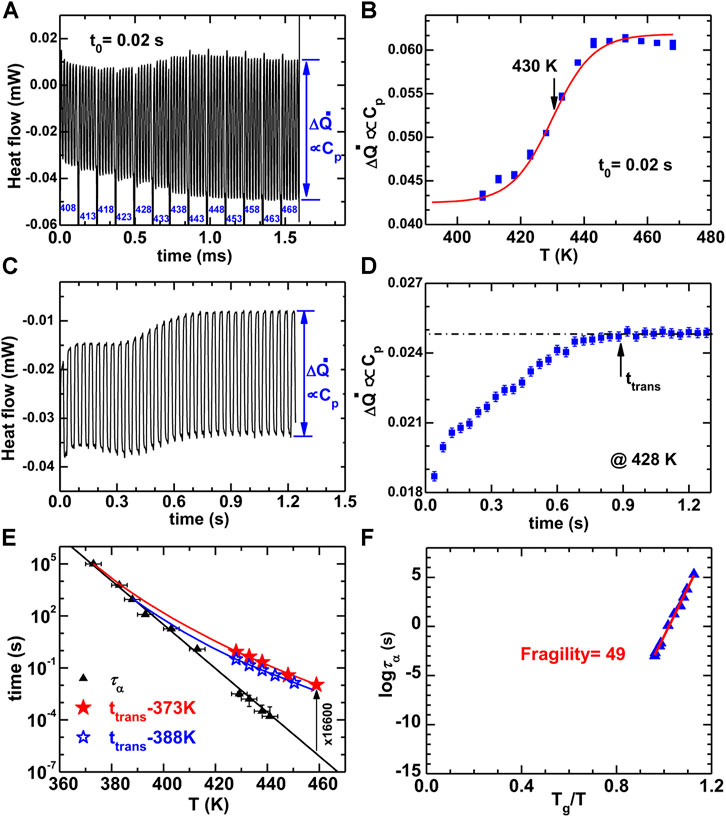
FIGURE 13. (A) The heat flow curves with time for ac measurement of the α-relaxation time (τα = t0/2π = 0.0032 s). (B) The ΔQ evolution with the temperature. (C) The heat flow with time for the measurements of glass-to-liquid de-aging transition time at 428 K based on the above ac method. (D) According to the evolution of ΔQ, the ttrans can be about 0.88 s. (E) The evolution of τα and ttrans with temperature for the highly stable glasses equilibrated at 373 and 388 K, respectively. (F) The Angell plot of τα ad Tg/T. The fragility of the Au49Cu26.9Ag5.5Pd2.3Si16.3 can be calculated as about 49. (from (Wang et al., 2016)).
As a result of the nonequilibrium nature, the glass always relaxes towards the equilibrium supercooled liquid state during isothermal annealing. There are two relaxation types: the aging when HG > HL and the de-aging or rejuvenation when HG < HL (Tsao and Spaepen, 1985; Zhao et al., 2013). The isothermal transition time (ttrans) from glass to liquid is related to the alpha-relaxation time (τα, the rearrangement time of atoms or molecules in the equilibrium state). That is, ttrans ≤ τα for aging, and ttrans > τα for de-aging (Zhao et al., 2013). The ordinary glass that was quenched directly from a liquid will transform quickly into liquid when its enthalpy is heated to that of the supercooled liquid, which denotes that the ttrans is comparable to τα. A typical character of ultrastable glasses is that the ttrans is much longer than the τα in the de-aging state (Dawson et al., 2012), see Figure 13E. The glass equilibrated at 373 K at lower enthalpy state has a much larger ttrans compared to the glass equilibrated at 388 K, which denotes a higher kinetic stability. The ttrans of the Au-MG equilibrated at 373 K is about 102–104.2 higher than τα, which is close to that reported for vapor-deposited ultrastable glasses, although for the most stable vapor-deposited glasses these results were obtained for larger values of τα (Dawson et al., 2012). These results suggest that the optimally-annealed liquid-quenched glass shares the similar nature with the vapor-deposited glasses. The ttrans values can be well fitted using the TNM model (Moynihan et al., 1976), as shown by the solid curves in Figure 13E. The fitting parameters are determined to be β = 0.45, x = 0.5 for the glass equilibrated at 373 K, and β = 0.7, x = 0.6 for the glass equilibrated at 388 K. This denotes that the glass in equilibrium at 373 K has a higher stability.
The increase of kinetic stability (e.g., higher Tg,h) combined with the increase of thermodynamic stability (e.g., decrease in enthalpy) has been widely observed in vapor-deposited ultrastable glasses (Swallen et al., 2007; Kearns et al., 2008; Dawson et al., 2011; Ramos et al., 2011; Sepulveda et al., 2011; Daisman P.B. Aji et al., 2013; Lyubimov et al., 2013). However, the quantitative relationship between kinetic stability and thermodynamic stability has not been systematically investigated. It is valuable to examine the relation between Tg,h and the glass enthalpy change (ΔH) for the present annealed MG. Figure 14 shows the data annealed at various T and for various times. When the annealing temperature is well below Tg,c, e.g., 358 K, the Tg,h will first decrease along with the decrease of enthalpy upon annealing which can be found in Figure 14A and other works (Evenson et al., 2014; Evenson et al., 2015). For further annealing, the Tg,h increases along with the decrease of enthalpy, which can be found in Figure 14B. When the annealing time is long enough, the dependence of Tg,h on ΔH tends to merge with the data that annealed slightly below Tg,c where the Tg,h increases along with the decrease of enthalpy upon annealing. The Tg,h reaches a maximum value when the enthalpy reaches the equilibrium supercooled liquid state, as is marked by the arrows in Figure 14C. Generally, the Tg,h has a linear relation with ΔH with a slope of about dTg,h/dH = −29.7 (±0.5) mol.K/kJ.
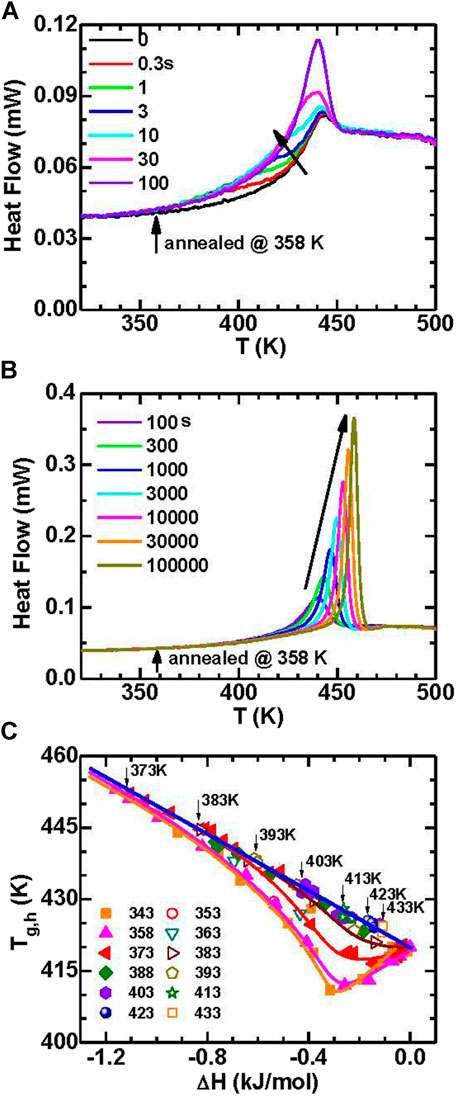
FIGURE 14. (A) The heat flow traces annealed at 358 K for short times (≤100 s) in Au49Cu26.9Ag5.5Pd2.3Si16.3 MG. (B) The heat flow traces for the annealed sample at 358 K for long times (≥100 s). (C) Correlation of Tg,h and the enthalpy change for samples annealed at various temperatures (from (Wang et al., 2016)).
It is interesting to note that for short-time annealing at low temperatures the kinetic stability decreases (Tg,h decreases) although the thermodynamic stability increases (enthalpy decreases). Such behavior has also been observed in another Pd-based MG and has been associated with volume dilatation during short-time annealing at low temperatures (Haruyama et al., 2014), which is related to the two-components model that includes both positive and negative fluctuations in local density (Haruyama et al., 2014). Such a decrease in enthalpy may be also related to the slow-β relaxation (Evenson et al., 2014; Evenson et al., 2015; Song et al., 2018; Song L. J. et al., 2020), which derives from local rearrangements of atoms. However, when the glass gets close to equilibrium after a long-time annealing at low temperatures or being annealed close to glass transition temperature, the α-relaxation (universal rearrangement of nearest-neighbor structure) takes over. Thus, the α-relaxation process is proposed to increase both kinetic stability and thermodynamic stability, while the slow-β relaxation can only induce a thermodynamic stability.
Annealing below the glass transition temperature has been widely studied and has been applied to release the residual stress in glasses (Kumar et al., 2009a; Boucher et al., 2011; Evenson and Busch, 2011; Cangialosi et al., 2013; Zhu et al., 2013; Haruyama et al., 2014). Polymer glasses exhibit a large increase in Tg,h by about 13 K (Boucher et al., 2011; Cangialosi et al., 2013). However, the change of Tg,h for MGs is usually less than 10 K (Tsao and Spaepen, 1985; Kumar et al., 2009a; Kohda et al., 2010; Evenson and Busch, 2011; Zhu et al., 2013), which was attributed to the low fragility of the glass forming liquid (Yu et al., 2013a). The large increase in Tg,h by 28 K obtained in the Au49Cu26.9Ag5.5Pd2.3Si16.3 metallic glass is about 3–5 times larger than previously reported values. As is shown in Figure 11A if the annealing temperature (Ta) is too high, given the linear relationship between the Tg,h and the enthalpy change, the small enthalpy difference between the as-cooled glass and the supercooled liquid limits the increase of kinetic stability. To obtain the largest increase in stability at a given annealing time (ta), the optimal annealing temperature for this Au-MG is 6–10 K lower than the temperature where τα = ta. The optimal annealing curve can be expressed by the Vogel-Fulcher-Tammann equation as Ta = 274 + 132/log (ta), as is shown by the dashed curve in Figure 12B. By optimally annealing the as-spun ribbon, high kinetic stability is obtained, as shown in Figure 15. Thus, the high stability is attributed to the optimal combination of annealing temperature and annealing time, regardless of the sample fabrication method.
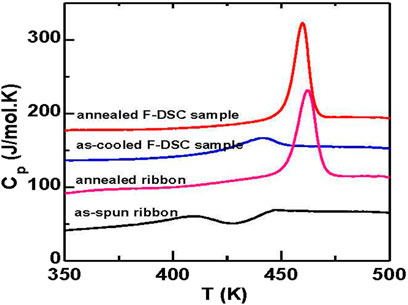
FIGURE 15. DSC traces of the glass transition behavior of the as-spun ribbon, the ribbon annealed at 373 K for 105 s (annealed ribbon), the sample cooled in-situ at 6000 K/s using Flash DSC (as-cooled F-DSC sample), and the sample annealed in-situ at 373 K for 105 s (annealed F-DSC sample). The curves have been shifted vertically for comparison (from (Wang et al., 2016)).
Elevated atomic mobility within the surface layer (several nanometers) plays a key role in promoting the rearrangement of atoms to approach their equilibrium configurations that is vital for fabricating ultrastable glassy films (Leon-Gutierrez et al., 2009; Yang et al., 2010b; Sepulveda et al., 2011; Brian et al., 2014). Yet, vapor deposition is very inefficient for fabricating thick samples or bulk glasses. In contrast, the melt-spun Au-MG samples studied here have a thickness of about 25 μm. The optimal annealing method is not limited to ribbons but is also applicable for liquid-cooled bulk MGs (Wang et al., 2016).
It should be noted that the above kinetic stability improvement by optimal annealing treatment is intrinsically related to the nanoscale heterogeneity change (Luo et al., 2018; Gao M. and Perepezko J. H., 2020). The glasses with better kinetic stability are usually characterized by a more homogenous structure, with less order at larger distances, more stability and different phase formations during crystallization. Gao et al. (Gao M. and Perepezko J. H., 2020) found that there exist the solid-like and liquid-like nanoscale heterogeneity and these nanoscale heterogeneities will evolve with the annealing treatment and rejuvenation treatments. The optimal annealing treatment will decrease of the liquid-like heterogeneity and make the glass sample be more homogeneous. When the glass sample reaches the limit of the “homogeneous” structure, the ideal glass may be obtained. In addition, based on the effective tuning of the nanoscale heterogeneity, other thermal properties including the kinetic stability in this work can be adjusted, such as the relaxation behavior and the crystallization behaviors, which will be of great importance for the applications of MGs.
To study the combined effect of ultrastable character and a nanoglobular microstructure on the kinetic behavior, an Au52Ag5Pd2Cu25Si10Al6 nanoglass was prepared (Wang J. Q. et al., 2014). The thermal properties of the nanoglass were studied by using Flash DSC, with a comparison to its melt-spun ribbon counterpart. Figure 16 shows the nanoglobular microstructure for the as-deposited MG with globule sizes of about 30 ± 3 nm (Chen et al., 2011; Chen et al., 2013). The HRTEM and selected area electron diffraction images in Figure 17 confirm the amorphous structure of the as-deposited nanoglass and melt-spun ribbon.
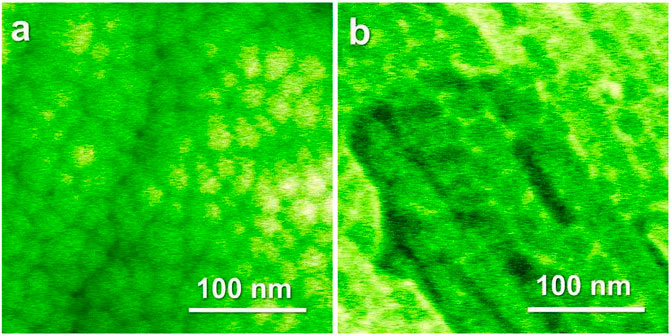
FIGURE 16. (A) SEM image of the Au52Ag5Pd2Cu25Si10Al6 nanoglass surface from plan view. (B) SEM image of the Au52Ag5Pd2Cu25Si10Al6 nanoglass from cross section view. From Figure 16B, the average size of the nanoglobules is about 30 nm (from (Wang J. Q. et al., 2014)).
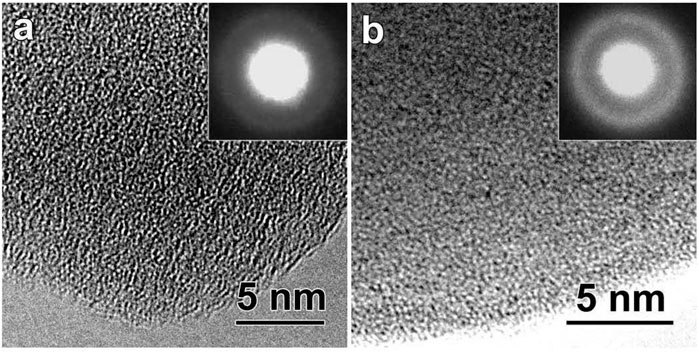
FIGURE 17. (A) HRTEM image of the atomic structure for the as-deposited Au52Ag5Pd2Cu25Si10Al6 nanoglass. (B) HRTEM image of the atomic structure for melt-spun ribbon. For both the nanoglass and ribbon sample, the amorphous atomic structure can be confirmed by the inserted diffraction patterns (from (Wang J. Q. et al., 2014)).
The Flash DSC traces shown in Figures 18A,B, reveal an obvious glass transition and crystallization signals that confirm the glassy nature of the materials. The heating rates ranges from 10 K/s to 40,000 K/s. The Tg and Tp1 (the peak temperature of the first cryustallization event) are plotted vs. heating rate, as shown in Figure 19A. Both Tg and Tp1 increase along with increasing the heating rate for the two samples, which are typical characteristics for glasses. By comparison the nanoglass exhibits much higher characteristic temperatures than the ribbon sample at low heating rates. For example, compared to the melt-spun ribbon, the nanoglass has a 20 K higher Tg or 32 K higher Tp1 at 100 K/s or lower. As a result the as-deposited nanoglass is kinetically more stable than the ribbon sample. The trend of characteristic temperatures for the two samples appear to converge with increasing heating rate and finally coincide at 30,000 K/s, as shown in Figure 19A.
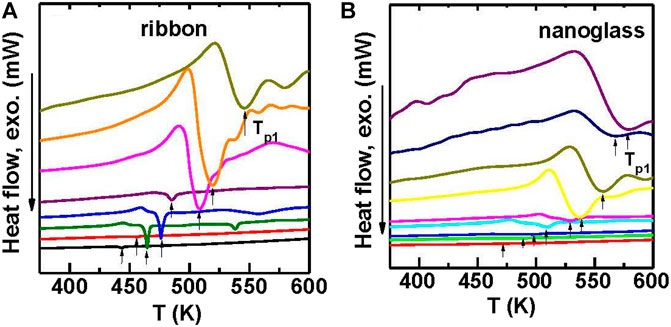
FIGURE 18. (A) Flash DSC heat flow curves with different heating rates of 30, 100, 300, 1,000, 3,000, 6,000, 10,000, 20,000 K/s (from down to top) in the melt-spun Au52Ag5Pd2Cu25Si10Al6 MG ribbon. (B) Flash DSC heat flow curves with different heating rates of 30, 100, 300, 1,000, 3,000, 6,000, 10,000, 20,000 K/s (from down to top) in the nanoglass (from (Wang J. Q. et al., 2014)).
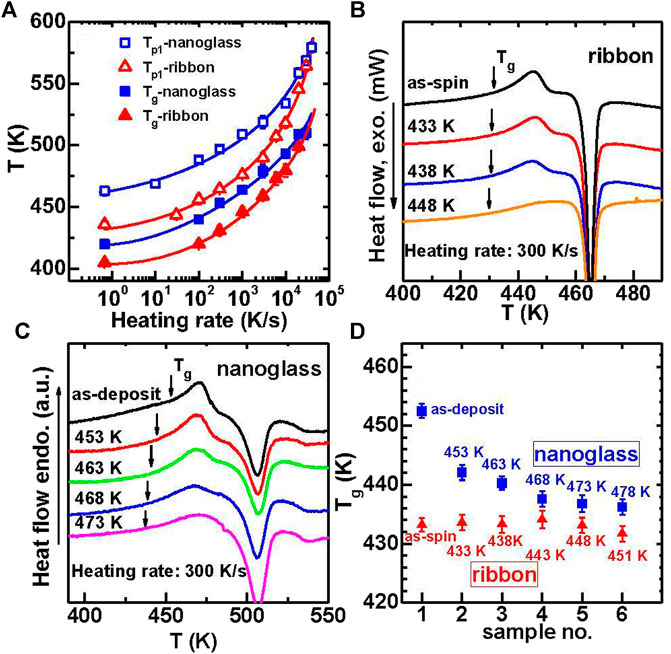
FIGURE 19. (A) The evolution of Tg (solid symbols) and Tp1 (open symbols) with different heating rate for both Au52Ag5Pd2Cu25Si10Al6 nanoglass (squares) and ribbon (triangles). DSC heat flow curves after pre-annealing to different temperatures for (B) ribbon and (C) nanoglass. (D)Tg evolution with temperatures for ultrastable nanoglass (squares) and ribbon (triangles) after pre-annealing (from (Wang J. Q. et al., 2014)).
The difference in thermal behavior between the nanoglass and melt-spun ribbon is affected by prior annealing. The two types of MGs were pre-heated up to various temperatures above Tg at 300 K/s and cooled down immediately at −6000 K/s. Following the pre-heating the samples were then heated up again at 300 K/s. Figure 19 shows the DSC traces in the second heating runs. The characteristic overshoot behavior (Swallen et al., 2007) near Tg disappears in a gradual manner for the pre-annealed samples. For a higher pre-annealing temperature, the Tg of the nanoglass decreased towards the Tg of the ribbon samplebut the Tg of the ribbon sample does not change after pre-annealing. When the pre-annealing temperature reaches 478 K, the Tg of the relaxed nanoglass sample does not increase any more and is about 5 K higher than that for the ribbon sample. This behavior demonstrates that the ultrastable character of the nanoglass can be partially removed by pre-heating to higher temperatures.
The Kissinger plot (Kissinger, 1957) of ln (ϕ/Tp12) vs. 1,000/Tp1 reveals an activation energy (
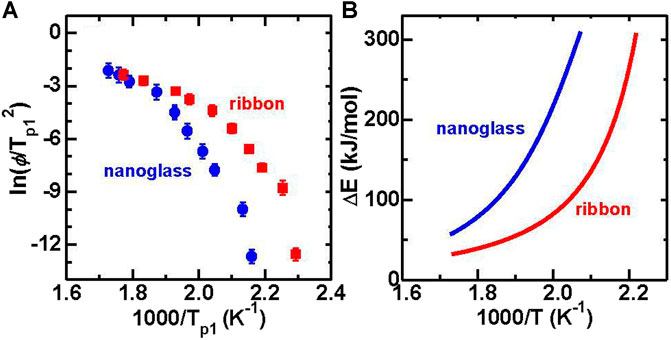
FIGURE 20. (A) Kissinger plot of Tp1 for both Au52Ag5Pd2Cu25Si10Al6 ribbon and nanoglass samples. (B) Crystallization activation energy with temperature by fitting the Kissinger plot in Figure 20A (from (Wang J. Q. et al., 2014)).
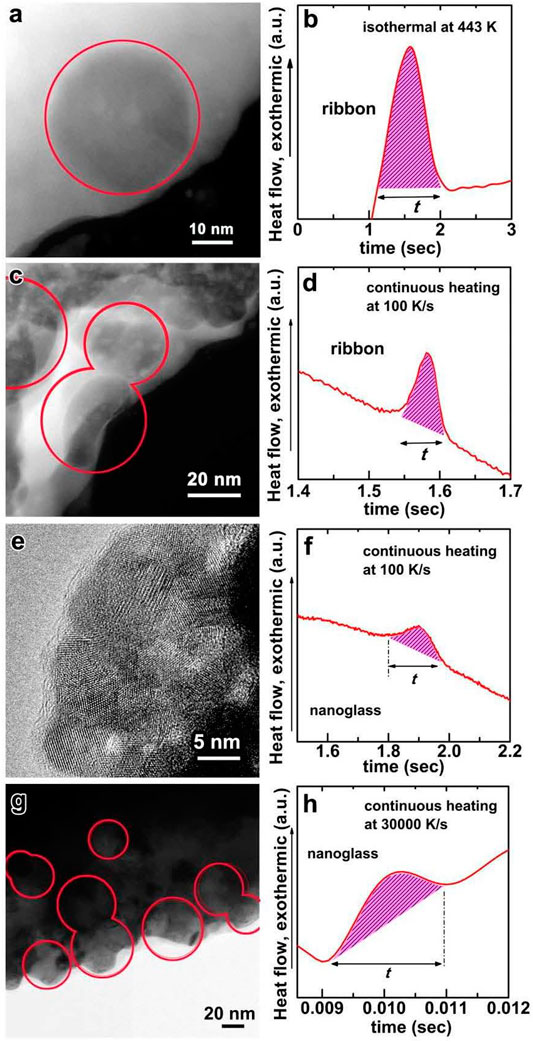
FIGURE 21. (A) TEM image of Au52Ag5Pd2Cu25Si10Al6 crystallized ribbon sample (the annealing temperature is 443 K). (B) Crystallization time last is about 0.9 s based on the corresponding DSC heat flow curve. (C) TEM image of Au52Ag5Pd2Cu25Si10Al6 crystallized ribbon sample by continuous heating with 100 K/s (D) Crystallization time is about 0.06 s based on the corresponding DSC heat flow curve and the peak temperature is about 456 K. (E) TEM image of the crystallized nanoglass samples by continuous heating with 100 K/s (F) Crystallization time is about 0.18 s based on the corresponding DSC heat flow curve and the peak temperature is about 488 K. (G) TEM image of the crystallized nanoglass by continuous heating with 30,000 K/s (H) Crystallization time is about 1.8 ms based on the corresponding DSC heat flow curve and the peak temperature is about 564 K (from (Wang J. Q. et al., 2014)).
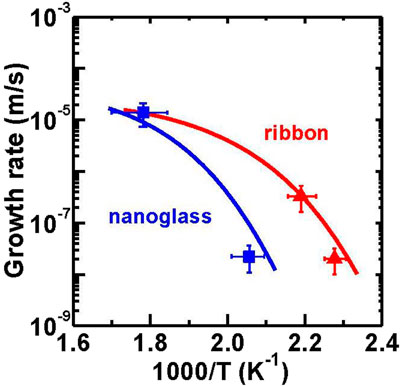
FIGURE 22. Comparison of measured and simulated growth rate of crystals with temperature for Au52Ag5Pd2Cu25Si10Al6 nanoglass and ribbon (from (Wang J. Q. et al., 2014)).
It has been proposed that the nanoglobular interfaces exhibit a lower density and enhanced diffusive transport than the interior, see TEM images in Figure 23 and literatures (Chen et al., 2011; Chen et al., 2013; Gleiter et al., 2014; Danilov et al., 2016). It is interesting that nanocrystallization does not initiate at the interfaces but within the interior. The nanoglobular interfaces remain amorphous even the interior has transformed to several nanocrystals. This indicates that the nanoglobular interfaces appear to act as kinetic barriers to nanocrystal growth. In addition simulation results suggest that the interface has different composition and density from the interior that enhance the thermal stability (Danilov et al., 2016). Other interfaces involving the nanoglass can also act to enhance glass stability (Keddie et al., 1994; Alcoutlabi and McKenna, 2005), and some nanoglobular polymer glasses can show ultrastable characters (Guo et al., 2012). This behavior implies that the interfaces in the as-deposited nanoglass contribute to the ultrastable nature. However, for samples subjected to a high heating rate (30,000 K/s) to above the crystallization temperature, crystal growth can occur across the nanoglobular interfaces, see the inset FFT image in Figure 23B.
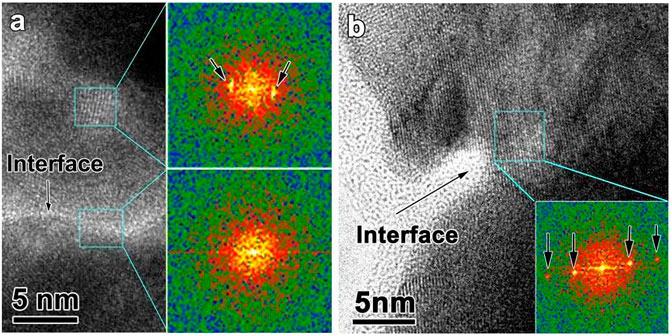
FIGURE 23. (A) HRTEM picture near the nanoglobular interface. The results confirms that the interface structure remains amorphous by heating to the crystallization with 300 K/s (B) HRTEM picture near the interface. The results confirms that the interface crystal can grow across the interface by heating to crystallization with 30,000 K/s (from (Wang J. Q. et al., 2014)).
It is evident that a pre-heating treatment at low heating rate (300 K/s) to slightly above Tg can partially remove the ultrastable characters due to the removal of the thermal history within the nanoglass, but the interface constraint could not be removed completely. On the other hand, heating at ultra-fast heating rate can release both the relaxation effect and the nanoglobular interfaces and thus can completely remove the ultrastable characters.
A reduced enthalpy and/or smaller volume compared to ordinary glasses are important signatures of ultrastable glasses (Swallen et al., 2007; Leon-Gutierrez et al., 2010; Ramos et al., 2011; Lyubimov et al., 2013). These characteristic features result in a reduced diffusivity that yields an increase in the transient period before the onset of steady state nucleation (Kelton and Greer, 2010). Consequently, ultrastable glass exhibits a higher crystallization temperature than an ordinary glass. At the same time, the diffusivity is temperature dependent, so that the transient period will shorten at higher temperature and merge with that for an ordinary glass, which is consistent with the trend in Figure 19A.
The stable kinetic character like a higher Tgh for ultrastable glasses are usually related to the stable thermodynamic character such as low energy states or low enthalpy (Swallen et al., 2007; Ramos et al., 2011). However, recent researches have shown that the ultrastable kinetic behaviors were also found in MGs (Yu H. B. et al., 2013; Xue et al., 2016; Luo et al., 2018) and a polymer nanoglass (Guo et al., 2012) with a higher enthalpy than ordinary glass. It is valuable to confirm the nanoglass relationship between the kinetic stability and the thermodynamic stability. The mass of the Flash DSC sample was estimated according to the crystallization enthalpy and allows for determination of the enthalpy of the as-deposited nanoglass which is about 1.5 J/g lower than that for the as-spun ribbon (see Figure 24). After pre-annealing at 468 K, the enthalpy increases by about 1.0 J/g by eliminating the thermal history. The fictive temperature (Tf) for the as-deposited nanoglass is about 384 K that is 41 K lower than that of the as-spun ribbon, Tf = 425 K. After pre-annealing, Tf increases by 23–407 K. Thus, the kinetically stable nanoglass is also thermodynamically stable.
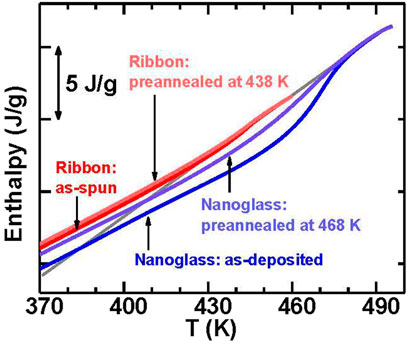
FIGURE 24. The comparison for the enthalpy of the as-deposited nanoglass, the nanoglass pre-annealed at 468 K, the as-spun ribbon, and the ribbon pre-annealed at 438 K. The extrapolation of the enthalpy for the supercooled liquid is marked by the solid grey line (from (Wang J. Q. et al., 2014)).
In this review, recent work is summarized on the three strategies to improve the properties of metallic glass by controlling the nanocrystallization, tuning the metastable energy state by optimal annealing and nano-glass without changing the compositions. The main results are highlighted as:
1) Based on the advanced ultrafast Flash DSC with ultrafast heating rate, a new and fast method to experimentally determine the nucleation delay time of primary nanocrystallization is demonstrated in marginal Al-based MGs. This method is also appropriate to investigate the glass transition and nanocrystallization for other amorphous materials. Based on this method, the primary crystallization and the nucleation delay time for three minro-alloying compositions by 1% Cu doping Al88Y7Fe5 system were investigated. Different 1% Cu dopings largely affect the primary crystallization, the nucleation delay time and the glass formation ability for Al-Y-Fe MG. When the delay time is increased by 1% Cu doping, the corresponding glass formation ability is enhanced, which exhibits a positve correlation with the nucleation delay time. These results and analyses give some enlightenments for improving the glass formation ability in marginal Al-based MG. Selective minor alloying elements, which can increase the nucleation delay time, may be useful to enhance glass formation ability and develop the bulk Al-based MGs.
2) High kinetic stability (e.g., high Tg,h) can be achieved for liquid-cooled MGs using optimal annealing. A linear relationship is observed between the increase in kinetic stability and the increase in thermodynamic stability.
3) The nanoglass shows both kinetically and thermodynamically ultrastable characters, e.g., 20 K higher Tg, a 32 K higher Tp1, larger crystallization activation energy, slower crystal growth rate, and lower enthalpy compared to the ribbon sample. These results denote that a glass can be made more stable both by relaxation and by introducing nanoglobular microstructures.
All authors listed have made a substantial, direct, and intellectual contribution to the work and approved it for publication.
JHP and MG gratefully acknowledge the financial supports from the Office of Naval Research (N00014-16-1-2401, N00014-20-1-2704). JQW acknowledges the financial supports from the National Key R and D Program of China (2018YFA0703604) and National Natural Science Foundation of China (NSFC 51922102, 51771216).
The authors declare that the research was conducted in the absence of any commercial or financial relationships that could be construed as a potential conflict of interest.
Aji, D. P. B., Hirata, Akihiko., Fan, Zhu., Pan, Liu., Madhav Reddy, K., Song, Shuangxi., et al. (2013). Ultrastrong and Ultrastable Metallic Glass. arXiv, 24.
Alcoutlabi, M., and Mckenna, G. B. (2005). Effects of Confinement on Material Behaviour at the Nanometre Size Scale. J. Phys. Condens. Matter 17, R461–R524. doi:10.1088/0953-8984/17/15/r01
Angell, C. A. (1995). Formation of Glasses from Liquids and Biopolymers. Science 267, 1924–1935. doi:10.1126/science.267.5206.1924
Bondi, K. S., Gangopadhyay, A. K., Marine, Z., Kim, T. H., Mukhopadhyay, A., Goldman, A. I., et al. (2007). Effects of Microalloying with 3d Transition Metals on Glass Formation in AlYFe Alloys. J. Non-Crystalline Sol. 353, 4723–4731. doi:10.1016/j.jnoncrysol.2007.06.063
Boucher, V. M., Cangialosi, D., Alegría, A., and Colmenero, J. (2011). Enthalpy Recovery of Glassy Polymers: Dramatic Deviations from the Extrapolated Liquidlike Behavior. Macromolecules 44, 8333–8342. doi:10.1021/ma2018233
Brian, C. W., Zhu, L., and Yu, L. (2014). Effect of Bulk Aging on Surface Diffusion of Glasses. J. Chem. Phys. 140, 054509. doi:10.1063/1.4863556
Cangialosi, D., Boucher, V. M., Alegria, A., and Colmenero, J. (2013). Direct Evidence of Two Equilibration Mechanisms in Glassy Polymers. Phys. Rev. Lett. 111, 095701. doi:10.1103/physrevlett.111.095701
Chen, M. (2011). A Brief Overview of Bulk Metallic Glasses. NPG Asia Mater. 3, 82–90. doi:10.1038/asiamat.2011.30
Chen, N., Frank, R., Asao, N., Louzguine-Luzgin, D. V., Sharma, P., Wang, J. Q., et al. (2011). Formation and Properties of Au-Based Nanograined Metallic Glasses. Acta Materialia 59, 6433–6440. doi:10.1016/j.actamat.2011.07.007
Chen, N., Louzguine-Luzgin, D. V., Xie, G. Q., Sharma, P., Perepezko, J. H., Esashi, M., et al. (2013). Structural Investigation and Mechanical Properties of a Representative of a New Class of Materials: Nanograined Metallic Glasses. Nanotechnology 24, 045610. doi:10.1088/0957-4484/24/4/045610
Danilov, D., Hahn, H., Gleiter, H., and Wenzel, W. (2016). Mechanisms of Nanoglass Ultrastability. ACS Nano 10, 3241–3247. doi:10.1021/acsnano.5b05897
Dawson, K., Kopff, L. A., Zhu, L., Mcmahon, R. J., Yu, L., Richert, R., et al. (2012). Molecular Packing in Highly Stable Glasses of Vapor-Deposited Tris-Naphthylbenzene Isomers. J. Chem. Phys. 136, 094505. doi:10.1063/1.3686801
Dawson, K., Zhu, L., Kopff, L. A., Mcmahon, R. J., Yu, L., and Ediger, M. D. (2011). Highly Stable Vapor-Deposited Glasses of Four Tris-Naphthylbenzene Isomers. J. Phys. Chem. Lett. 2, 2683–2687. doi:10.1021/jz201174m
Deubener, J., Brückner, R., and Sternitzke, M. (1993). Induction Time Analysis of Nucleation and crystal Growth in Di- and Metasilicate Glasses. J. Non-Crystalline Sol. 163, 1–12. doi:10.1016/0022-3093(93)90638-e
Drehman, A. J., Greer, A. L., and Turnbull, D. (1982). Bulk Formation of a Metallic Glass: Pd40Ni40P20. Appl. Phys. Lett. 41, 716–717. doi:10.1063/1.93645
Evenson, Z., and Busch, R. (2011). Equilibrium Viscosity, Enthalpy Recovery and Free Volume Relaxation in a Zr44Ti11Ni10Cu10Be25 Bulk Metallic Glass. Acta Materialia 59, 4404–4415. doi:10.1016/j.actamat.2011.03.064
Evenson, Z., Koschine, T., Wei, S., Gross, O., Bednarcik, J., Gallino, I., et al. (2015). The Effect of Low-Temperature Structural Relaxation on Free Volume and Chemical Short-Range Ordering in a Au49Cu26.9Si16.3Ag5.5Pd2.3 Bulk Metallic Glass. Scripta Materialia 103, 14–17. doi:10.1016/j.scriptamat.2015.02.026
Evenson, Z., Naleway, S. E., Wei, S., Gross, O., Kruzic, J. J., Gallino, I., et al. (2014). Βrelaxation and Low-Temperature Aging in a Au-Based Bulk Metallic Glass: From Elastic Properties to Atomic-Scale Structure. Phys. Rev. B 89, 174204. doi:10.1103/physrevb.89.174204
Fakhraai, Z., and Forrest, J. A. (2008). Measuring the Surface Dynamics of Glassy Polymers. Science 319, 600–604. doi:10.1126/science.1151205
Faupel, F., Frank, W., Macht, M.-P., Mehrer, H., Naundorf, V., Rätzke, K., et al. (2003). Diffusion in Metallic Glasses and Supercooled Melts. Rev. Mod. Phys. 75, 237–280. doi:10.1103/revmodphys.75.237
Fokin, V. M., Zanotto, E. D., Yuritsyn, N. S., and Schmelzer, J. W. P. (2006). Homogeneous crystal Nucleation in Silicate Glasses: A 40 Years Perspective. J. Non-Crystalline Sol. 352, 2681–2714. doi:10.1016/j.jnoncrysol.2006.02.074
Gao, M., and Perepezko, J. H. (2019). Flash DSC Determination of the Delay Time for Primary Crystallization and Minor Alloying Effect in Marginal Al-Based Metallic Glasses. Thermochim. Acta 677, 91–98. doi:10.1016/j.tca.2018.12.019
Gao, M., and Perepezko, J. H. (2020b). Mapping the Viscoelastic Heterogeneity at the Nanoscale in Metallic Glasses by Static Force Spectroscopy. Nano Lett. 20, 7558–7565. doi:10.1021/acs.nanolett.0c03026
Gao, M., and Perepezko, J. H. (2020a). Separating β Relaxation from α Relaxation in Fragile Metallic Glasses Based on Ultrafast Flash Differential Scanning Calorimetry. Phys. Rev. Mater. 4, 025602. doi:10.1103/physrevmaterials.4.025602
Ghafari, M., Hahn, H., Gleiter, H., Sakurai, Y., Itou, M., and Kamali, S. (2012). Evidence of Itinerant Magnetism in a Metallic Nanoglass. Appl. Phys. Lett. 101, 243104. doi:10.1063/1.4769816
Gleiter, H., Schimmel, T., and Hahn, H. (2014). Nanostructured Solids - from Nano-Glasses to Quantum Transistors. Nano Today 9, 17–68. doi:10.1016/j.nantod.2014.02.008
Guo, Y., Morozov, A., Schneider, D., Chung, J. W., Zhang, C., Waldmann, M., et al. (2012). Ultrastable Nanostructured Polymer Glasses. Nat. Mater 11, 337–343. doi:10.1038/nmat3234
Haruyama, O., Mottate, T., Morita, K., Yamamoto, N., Kato, H., and Egami, T. (2014). Volume and Enthalpy Relaxation in Pd42.5Cu30Ni7.5P20 Bulk Metallic Glass. Mater. Trans. 55, 466–472. doi:10.2320/matertrans.MBW201320
Hays, C. C., Schroers, J., Johnson, W. L., Rathz, T. J., Hyers, R. W., Rogers, J. R., et al. (2001). Vitrification and Determination of the Crystallization Time Scales of the Bulk-Metallic-Glass-Forming Liquid Zr58.5Nb2.8Cu15.6Ni12.8Al10.3. Appl. Phys. Lett. 79, 1605–1607.
He, Y., Dougherty, G. M., Shiflet, G. J., and Poon, S. J. (1993). Unique Metallic Glass Formability and Ultra-high Tensile Strength in Al·Ni·Fe·Gd Alloys. Acta Metallurgica et Materialia 41, 337–343.
Huang, Y., Zhou, B., Fan, H., Wang, Y., Wang, D., Sun, J., et al. (20141980-2015). Effect of Ion Irradiation in an Al90Fe2Ce8 Metallic Glass. Mater. Des. 62, 133–136.
Inoue, A., Matsumoto, N., and Masumoto, T. (1990). Al–Ni–Y–Co Amorphous Alloys with High Mechanical Strengths, Wide Supercooled Liquid Region and Large Glass-Forming Capacity. Mater. Trans. JIM 31, 493–500. doi:10.2320/matertrans1989.31.493
Inoue, A., Ohtera, K., Tsai, A. P., Kimura, H., and Masumoto, T. (1988). Glass-Transition Behavior of Al-Y-Ni and Al-Ce-Ni Amorphous-Alloys. Jpn. J. Appl. Phys. Part 2-Letters Express Lett. 27, L1579–L1582.
Inoue, A., and Takeuchi, A. (2011). Recent Development and Application Products of Bulk Glassy Alloys☆. Acta Materialia 59, 2243–2267.
Jiang, W. H., and Atzmon, M. (2003). The Effect of Compression and Tension on Shear-Band Structure and Nanocrystallization in Amorphous Al90Fe5Gd5: a High-Resolution Transmission Electron Microscopy Study. Acta Materialia 51, 4095–4105.
Johnson, W. L. (1999). Bulk Glass-Forming Metallic Alloys: Science and Technology. MRS Bull. 24, 42–56.
Ju, S., Feng, J. Q., Zou, P., Xu, W., Wang, S. J., Gao, W. B., et al. (2020). A Robust Self-Stabilized Electrode Based on Al-Based Metallic Glasses for a Highly Efficient Hydrogen Evolution Reaction. J. Mater. Chem. A. 8, 3246–3251.
Kearns, K. L., Swallen, S. F., Ediger, M. D., Wu, T., Sun, Y., and Yu, L. (2008). Hiking Down the Energy Landscape: Progress toward the Kauzmann Temperature via Vapor Deposition. J. Phys. Chem. B 112, 4934–4942. doi:10.1021/jp7113384
Keddie, J. L., Jones, R. a. L., and Cory, R. A. (1994). Interface and Surface Effects on the Glass-Transition Temperature in Thin Polymer Films. Faraday Discuss. 98, 219–230. doi:10.1039/FD9949800219
Kelton, K. F., and Greer, A. L. (2010). Nucleation in Condensed Matter: Applications in Materials and Biology. Pergamon Materials Series, 1–743.
Kissinger, H. E. (1957). Reaction Kinetics in Differential Thermal Analysis. Anal. Chem. 29, 1702–1706.
Kissinger, H. E. (1956). Variation of Peak Temperature with Heating Rate in Differential thermal Analysis. J. Res. Natl. Bur. Stand. 57, 217–221.
Klement, W., Willens, R. H., and Duwez, P. O. L. (1960). Non-crystalline Structure in Solidified Gold–Silicon Alloys. Nature 187, 869–870.
Kohda, M., Haruyama, O., Ohkubo, T., and Egami, T. (2010). Kinetics of Volume and Enthalpy Relaxation inPt60Ni15P25bulk Metallic Glass. Phys. Rev. B 81, 092203. doi:10.1103/PhysRevB.81.092203
Kumar, G., Tang, H. X., and Schroers, J. (2009). Nanomoulding with Amorphous Metals. Nature 457, 868–872. doi:10.1038/nature07718
Kumar, G., Rector, D., Conner, R. D., and Schroers, J. (2009a). Embrittlement of Zr-Based Bulk Metallic Glasses. Acta Materialia 57, 3572–3583.
Leon-Gutierrez, E., Sepúlveda, A., Garcia, G., Clavaguera-Mora, M. T., and Rodríguez-Viejo, J. (2010). Stability of Thin Film Glasses of Toluene and Ethylbenzene Formed by Vapor Deposition: an In Situ Nanocalorimetric Study. Phys. Chem. Chem. Phys. 12, 14693–14698. doi:10.1039/c0cp00208a
Leon-Gutierrez, E., Garcia, G., Lopeandia, A. F., Clavaguera-Mora, M. T., and Rodríguez-Viejo, J. (2009). Size Effects and Extraordinary Stability of Ultrathin Vapor Deposited Glassy Films of Toluene. J. Phys. Chem. Lett. 1, 341–345.
Lin, X. H., and Johnson, W. L. (1995). Formation of Ti–Zr–Cu–Ni Bulk Metallic Glasses. J. Appl. Phys. 78, 6514–6519.
Lu, Z. P., and Liu, C. T. (2002). A New Glass-Forming Ability Criterion for Bulk Metallic Glasses. Acta Materialia 50, 3501–3512.
Luo, P., Cao, C. R., Zhu, F., Lv, Y. M., Liu, Y. H., Wen, P., et al. (2018). Ultrastable Metallic Glasses Formed on Cold Substrates. Nat. Commun. 9, 1389.
Lyubimov, I., Ediger, M. D., and de Pablo, J. J. (2013). Model Vapor-Deposited Glasses: Growth Front and Composition Effects. J. Chem. Phys. 139, 144505. doi:10.1063/1.4823769
Mansouri, M., Simchi, A., Varahram, N., and Park, E. S. (2014). Development of Fcc-Al Nanoparticles during Crystallization of Amorphous Al–Ni Alloys Containing Mischmetal: Microstructure and Hardness Evaluation. Mater. Sci. Eng. A 604, 92–97.
Masuhr, A., Waniuk, T. A., Busch, R., and Johnson, W. L. (1999). Time Scales for Viscous Flow, Atomic Transport, and Crystallization in the Liquid and Supercooled Liquid States of Zr41.2Ti13.8Cu12.5Ni10.0Be22.5. Phys. Rev. Lett. 82, 2290–2293.
Mei, J. N., Soubeyroux, J. L., Blandin, J. J., Li, J. S., Kou, H. C., Fu, H. Z., et al. (2011). Structural Relaxation of Ti40Zr25Ni8Cu9Be18 Bulk Metallic Glass. J. Non-Crystalline Sol. 357, 110–115.
Moynihan, C. T., Macedo, P. B., Montrose, C. J., Montrose, C. J., Gupta, P. K., Debolt, M. A., et al. (1976). Structural Relaxation in Vitreous Materials. Ann. N Y Acad. Sci. 279, 15–35.
Orava, J., Greer, A. L., Gholipour, B., Hewak, D. W., and Smith, C. E. (2012). Characterization of Supercooled Liquid Ge2Sb2Te5 and its Crystallization by Ultrafast-Heating Calorimetry. Nat. Mater. 11, 279–283. doi:10.1038/nmat3275
Perepezko, J. H., and Imhoff, S. D. (2010). Primary Crystallization Reactions in Al-Based Metallic Glass Alloys. J. Alloys Comp. 504, S222–S225.
Perepezko, J. H. (2004). Nucleation-controlled Reactions and Metastable Structures. Prog. Mater. Sci. 49, 263–284.
Pérez-Castañeda, T., Jiménez-Riobóo, R. J., and Ramos, M. A. (2014). Two-level Systems and Boson Peak Remain Stable in 110-Million-Year-Old Amber Glass. Phys. Rev. Lett. 112, 165901. doi:10.1103/PhysRevLett.112.165901
Priestley, R. D., Ellison, C. J., Broadbelt, L. J., and Torkelson, J. M. (2005). Structural Relaxation of Polymer Glasses at Surfaces, Interfaces, and in between. Science 309, 456–459. doi:10.1126/science.1112217
Révész, Á., Varga, L. K., Suriñach, S., and Baró, M. D. (2011). Thermal Stability, Crystallization Kinetics, and Grain Growth in an Amorphous Al85Ce5Ni8Co2 alloy. J. Mater. Res. 17, 2140–2146.
Ramos, S. L., Oguni, M., Ishii, K., and Nakayama, H. (2011). Character of Devitrification, Viewed from Enthalpic Paths, of the Vapor-Deposited Ethylbenzene Glasses. J. Phys. Chem. B 115, 14327–14332. doi:10.1021/jp203612s
Ruitenberg, G. (2003). Applying Kissinger Analysis to the Glass Transition Peak in Amorphous Metals. Thermochim. Acta 404, 207–211.
Schuh, C., Hufnagel, T., and Ramamurty, U. (2007). Mechanical Behavior of Amorphous Alloys. Acta Materialia 55, 4067–4109.
Sepúlveda, A., Leon-Gutierrez, E., Gonzalez-Silveira, M., Rodríguez-Tinoco, C., Clavaguera-Mora, M. T., and Rodríguez-Viejo, J. (2011). Accelerated Aging in Ultrathin Films of a Molecular Glass Former. Phys. Rev. Lett. 107, 025901. doi:10.1103/PhysRevLett.107.025901
Shen, Y., and Perepezko, J. H. (2017). Al-based Amorphous Alloys: Glass-Forming Ability, Crystallization Behavior and Effects of Minor Alloying Additions. J. Alloys Comp. 707, 3–11.
Shen, Y., and Perepezko, J. H. (2018). Investigation of the Nucleation Delay Time in Al-Based Metallic Glasses by High Rate Calorimetry. J. Non-Crystalline Sol. 502, 9–14.
Shen, Y., and Perepezko, J. H. (2015). The Effect of Minor Addition of Insoluble Elements on Transformation Kinetics in Amorphous Al Alloys. J. Alloys Comp. 643, S260–S264.
Sheng, H. W., Luo, W. K., Alamgir, F. M., Bai, J. M., and Ma, E. (2006). Atomic Packing and Short-To-Medium-Range Order in Metallic Glasses. Nature 439, 419–425. doi:10.1038/nature04421
Singh, D., Singh, D., Mandal, R. K., Srivastava, O. N., and Tiwari, R. S. (2016). Crystallization Behavior and Mechanical Properties of (Al90Fe5Ce5)100−xTix Amorphous Alloys. J. Alloys Comp. 687, 990–998.
Slipenyuk, A., and Eckert, J. (2004). Correlation between Enthalpy Change and Free Volume Reduction during Structural Relaxation of Zr55Cu30Al10Ni5 Metallic Glass. Scripta Materialia 50, 39–44.
Song, L. J., Gao, M., Xu, W., Huo, J. T., Wang, J. Q., Li, R. W., et al. (2020b). Inheritance from Glass to Liquid: β Relaxation Depresses the Nucleation of Crystals. Acta Materialia 185, 38–44.
Song, L. J., Xu, W., Huo, J. T., Wang, J. Q., Wang, X. M., and Li, R. W. (2018). Two-step Relaxations in Metallic Glasses during Isothermal Annealing. Intermetallics 93, 101–105.
Song, L., Xu, W., Huo, J., Li, F., Wang, L. M., Ediger, M. D., et al. (2020a). Activation Entropy as a Key Factor Controlling the Memory Effect in Glasses. Phys. Rev. Lett. 125, 135501.
Swallen, S. F., Kearns, K. L., Mapes, M. K., Kim, Y. S., McMahon, R. J., Ediger, M. D., et al. (2007). Organic Glasses with Exceptional Thermodynamic and Kinetic Stability. Science 315, 353–356. doi:10.1126/science.1135795
Tsao, S. S., and Spaepen, F. (1985). Structural Relaxation of a Metallic Glass Near Equilibrium. Acta Metallurgica 33, 881–889.
Wang, J. Q., Liu, Y. H., Chen, M. W., Louzguine-Luzgin, D. V., Inoue, A., and Perepezko, J. H. (2012). Excellent Capability in Degrading Azo Dyes by MgZn-Based Metallic Glass Powders. Sci. Rep. 2, 418. doi:10.1038/srep00418
Wang, J. Q., Chen, N., Liu, P., Wang, Z., Louzguine-Luzgin, D. V., Chen, M. W., et al. (2014a). The Ultrastable Kinetic Behavior of an Au-Based Nanoglass. Acta Materialia 79, 30–36.
Wang, J. Q., Liu, Y. H., Chen, M. W., Xie, G. Q., Louzguine-Luzgin, D. V., Inoue, A., et al. (2012b). Rapid Degradation of Azo Dye by Fe-Based Metallic Glass Powder. Adv. Funct. Mater. 22, 2567–2570.
Wang, J. Q., Liu, Y. H., Imhoff, S., Chen, N., Louzguine-Luzgin, D. V., Takeuchi, A., et al. (2012c). Enhance the thermal Stability and Glass Forming Ability of Al-Based Metallic Glass by Ca Minor-Alloying. Intermetallics 29, 35–40.
Wang, J. Q., Shen, Y., Perepezko, J. H., and Ediger, M. D. (2016). Increasing the Kinetic Stability of Bulk Metallic Glasses. Acta Materialia 104, 25–32.
Wang, L., Ma, L., Kimura, H., and Inoue, A. (2002). Amorphous Forming Ability and Mechanical Properties of Rapidly Solidified Al–Zr–LTM (LTM=Fe, Co, Ni and Cu) Alloys. Mater. Lett. 52, 47–52.
Wang, Y., Liu, Y., Li, Y., An, B., Cao, G., Jin, S., et al. (2014b). Crystallization of Al-Based Amorphous Alloys in Good Conductivity Solution. J. Mater. Sci. Tech. 30, 1262–1270.
Wilde, G., Sieber, H., and Perepezko, J. H. (1999). Glass Formation versus Nanocrystallization in an Al92Sm8 alloy. Scripta Materialia 40, 779–783.
Witte, R., Feng, T., Fang, J. X., Fischer, A., Ghafari, M., Kruk, R., et al. (2013). Evidence for Enhanced Ferromagnetism in an Iron-Based Nanoglass. Appl. Phys. Lett. 103, 073106. doi:10.1063/1.4818493
Xue, R. J., Zhao, L. Z., Shi, C. L., Ma, T., Xi, X. K., Gao, M., et al. (2016). Enhanced Kinetic Stability of a Bulk Metallic Glass by High Pressure. Appl. Phys. Lett. 109, 221904.
Yang, B. J., Yao, J. H., Chao, Y. S., Wang, J. Q., and Ma, E. (2010a). Developing Aluminum-Based Bulk Metallic Glasses. Phil. Mag. 90, 3215–3231.
Yang, Z., Fujii, Y., Lee, F. K., Lam, C. H., and Tsui, O. K. (2010). Glass Transition Dynamics and Surface Layer Mobility in Unentangled Polystyrene Films. Science 328, 1676–1679. doi:10.1126/science.1184394
Ye, F., and Lu, K. (2000). Crystallization Kinetics of Al–La–Ni Amorphous alloy. J. Non-Crystalline Sol. 262, 228–235.
Yu, H. B., Luo, Y., and Samwer, K. (2013). Ultrastable Metallic Glass. Adv. Mater. Weinheim 25, 5904–5908. doi:10.1002/adma.201302700
Yu, H. B., Luo, Y. S., and Samwer, K. (2013b). Ultrastable Metallic Glass. Adv. Mater. 25, 5904–5908.
Yu, H. J., Wang, J. Q., Shi, X. T., Louzguine-Luzgin, D. V., Wu, H. K., and Perepezko, J. H. (2013c). Ductile Biodegradable Mg-Based Metallic Glasses with Excellent Biocompatibility. Adv. Funct. Mater. 23, 4793–4800.
Zaluska, A., and Matyja, H. (1983). Crystallization Characteristics of Amorphous Fe-Si-B Alloys. J. Mater. Sci. 18, 2163–2172.
Zhang, W., Chen, S., Zhu, Z., Wang, H., Li, Y., Kato, H., et al. (2017). Effect of Substituting Elements on thermal Stability and Glass-Forming Ability of an Al-Based Al Ni Er Metallic Glass. J. Alloys Comp. 707, 97–101.
Zhao, J., Simon, S. L., and McKenna, G. B. (2013). Using 20-Million-Year-Old Amber to Test the Super-arrhenius Behaviour of Glass-Forming Systems. Nat. Commun. 4, 1783. doi:10.1038/ncomms2809
Zhao, L., Bokas, G. B., Perepezko, J. H., and Szlufarska, I. (2018). Nucleation Kinetics in Al-Sm Metallic Glasses. Acta Materialia 142, 1–7.
Zhu, Z. G., Wen, P., Wang, D. P., Xue, R. J., Zhao, D. Q., and Wang, W. H. (2013). Characterization of Flow Units in Metallic Glass through Structural Relaxations. J. Appl. Phys. 114. doi:10.1063/1.4819484
Keywords: nanoglass, kinetic stability, nanocrystallization, delay time, metallic glass, flash DSC
Citation: Perepezko JH, Gao M and Wang J-Q (2021) Nanoglass and Nanocrystallization Reactions in Metallic Glasses. Front. Mater. 8:663862. doi: 10.3389/fmats.2021.663862
Received: 03 February 2021; Accepted: 18 June 2021;
Published: 30 June 2021.
Edited by:
Shiv Prakash Singh, International Advanced Research Center for Powder Metallurgy and New Materials, IndiaReviewed by:
Martin Charles Wilding, Sheffield Hallam University, United KingdomCopyright © 2021 Perepezko, Gao and Wang. This is an open-access article distributed under the terms of the Creative Commons Attribution License (CC BY). The use, distribution or reproduction in other forums is permitted, provided the original author(s) and the copyright owner(s) are credited and that the original publication in this journal is cited, in accordance with accepted academic practice. No use, distribution or reproduction is permitted which does not comply with these terms.
*Correspondence: John H Perepezko, cGVyZXBlemtAZW5nci53aXNjLmVkdQ==
Disclaimer: All claims expressed in this article are solely those of the authors and do not necessarily represent those of their affiliated organizations, or those of the publisher, the editors and the reviewers. Any product that may be evaluated in this article or claim that may be made by its manufacturer is not guaranteed or endorsed by the publisher.
Research integrity at Frontiers
Learn more about the work of our research integrity team to safeguard the quality of each article we publish.