 Chuanlin Sun1
 Xiaoling Zhou
 Xinglong Gong
 Shouhu Xuan
94% of researchers rate our articles as excellent or good
Learn more about the work of our research integrity team to safeguard the quality of each article we publish.
Find out more
ORIGINAL RESEARCH article
Front. Mater. , 30 October 2020
Sec. Smart Materials
Volume 7 - 2020 | https://doi.org/10.3389/fmats.2020.598973
This article is part of the Research Topic Frontiers in Materials: Rising Stars 2020 View all 13 articles
A novel membrane sound absorber based on the magnetorheological membrane (MRM) is developed for active sound absorption. Due to its good flexibility and stretch-ability, the MRM consisting of carbonyl iron particles (CIPs) and polydimethylsiloxane elastomer matrix can be easily deformed. The deformation of MRM is investigated by the digital image correlation method. The off-plane displacement is positively related to both of the CIPs mass fractions and magnetic field strength. The sound absorption performance of MRM sound absorber is investigated and it is found that the thickness of the membrane, CIPs mass fractions, and air cavity length behind the membrane significantly influence the sound absorption performance. The magnetic field can adjust the sound absorption frequency without affecting the high acoustical absorption coefficients. The double-layer membrane structure has two sound absorption peaks within the testing frequency range and further improves the frequency adjustability of the sound absorber. Therefore, it is expected to be a particularly promising alternative for active sound absorption. Finally, the numerical solutions calculated by the equivalent circuit method also support the experimental results.
The membrane sound absorber is a widely used sound absorption structure, which is of thin thickness, high sound absorption coefficients and wide tunable frequency range (Zhao et al., 2017; Gai et al., 2018; Liu et al., 2019a), and has attracted great interest to researchers who want to reduce sound emissions in the last decades. A typical membrane absorber is composed of a single membrane and an air cavity behind it. The sound absorption properties of membrane absorbers are mainly influenced by the surface density, membrane tension and air cavity length (Jimenez et al., 2016; Ahmed et al., 2019). In recent years, most of the researches were focused on the traditional membrane sound absorbers. Maa firstly proposed the basic theory and design principles of the micro-perforated panel absorbers (Maa, 1975). His theoretical work laid the foundation for other similar sound absorption structures (Reto and Kurt, 2015; Takeshi and Kimihiro, 2015; Arenas and Ugarte, 2016). Kang and Fuchs concluded the equivalent circuit method for different kinds of membrane sound absorbers (Kang and Fuchs, 1999). Kimihiro et al. investigated the resonance effect of micro-perforated membrane absorbers and discussed the absorption mechanisms of membrane-type absorbers (Kimihiro et al., 2009). Very recently, Zhu et al. installed a lightweight membrane-type resonator in the back cavity of perforated membrane absorbers to combine into a compound sound absorber and further improved the adjusting ability for sound absorption (Zhu et al., 2018b).
The membrane sound absorber with tunable acoustic properties is very important for their practical application. However, the acoustic properties of the existing membranes are usually un-tunable once the materials are prepared. Magnetorheological (MR) materials are a kind of smart materials (Ju et al., 2016; Xu et al., 2018) whose mechanical properties can be controlled by applying an external magnetic field. The mechanical properties and magnetic controlled deformation of MR materials have been systematically investigated. Due to the tunable mechanical characteristics, MR materials have been widely used in vibration control (Fu et al., 2016; Liu et al., 2019b; Zhang et al., 2019), magnetic sensing (Ding et al., 2018; Ren et al., 2018; Hu et al., 2020), magnetic controlled movement (Lum et al., 2016; Chen et al., 2018; Ubaidillah et al., 2019) and robot manufacturing (Eric et al., 2014; Feng et al., 2017; Vien et al., 2019). In consideration of their easy deformation, tunable mechanical properties and contactless magnetic actuation, the MR materials are expected to have wonderful performance in sound absorption. However, few works have been reported on employing MR materials in sound absorption and investigating their acoustic mechanism.
In this work, the MR membrane (MRM) is used to replace the normal membrane in traditional membrane absorbers to develop a novel magnetorheological sound absorber. The magnetic field dependent mechanical properties, deformation and sound absorption capacity were investigated. A finite element simulation was carried out to confirm the experimental results of the deformation. The sound absorption performance of the MRM sound absorber was measured and the MRM sound absorber had excellent sound absorption properties and frequency adjustable performance. The equivalent circuit method was employed to calculate the sound absorption coefficient and the numerical results agreed with the experimental discussion. Therefore, the magnetorheological membrane sound absorbers are expected to be a particularly promising alternative for active sound absorption.
Carbonyl iron particles (CIPs) were brought from BASF in Germany and the average size of CIPs is 7μm.
The fabrication processes of the magnetorheological membranes were schematically illustrated in Figure 1. The PDMS matrix, curing agent and iron particles were mixed up in different proportions and the mixture was vacuumed to remove trapped bubbles for 30 min. The ratio of the matrix to the curing agent was 10:1 and the CIPs mass fractions were set as 10, 20, 30, and 50 wt% respectively. After that, the mixture was poured on the rotor of a spin coater. The rotor rotated at 1,000–1,500 rpm for 1 min and the mixture was homogenized to be a membrane. Then, the membrane was cured at 100°C for 10 min to be vulcanized. Finally, the prepared magnetorheological membranes were fixed by the rigid ring with a radius of 15 mm and thickness of 2 mm for sound absorption test.
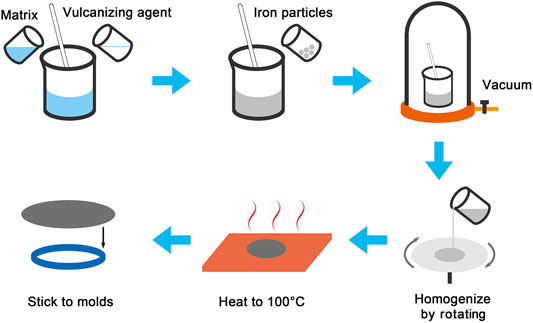
FIGURE 1. Schematic diagram of the material preparation process.
The digital image correlation (DIC) method was employed to investigate the magnetic induced deformation of MRMs and the scheme of the commercial DIC analyzer (PMLAB DIC-3D, Nanjing PMLAB Sensor Tech. Co., Ltd.) was shown in Figure 4A. DIC is a far-field and full field measurement with strong anti-interference ability and high measurement accuracy (Gao et al., 2015; Enrico et al., 2017). It has been widely applied in measuring the deformation of materials or structures (Zhang et al., 2005; Jiang et al., 2007). The MRM was fixed by a rigid ring and sprayed with white paint spots evenly as marks. Two pictures of the painted membrane were taken from different directions and the location information of the marked points were recorded. Then, the membrane deformed under the magnetic field and another two pictures were taken to record the deformation. Finally, the deformation of the MRM was calculated. In this experiment, the deformation of MRMs with different components was measured to investigate the influence factors of displacement. The prepared MRMs were placed 2 mm above the central axis of an electromagnet coil. The outer and inner diameters of the electromagnet coil were 95 and 50 mm respectively. The size of the electromagnet coil was large enough to ensure that the magnetic field around the sample was relatively uniform. The magnetic fields at the center of the MRM surface were adjusted from 60 and 180 mT by controlling the current in the electromagnet coil.
The sound absorption tests were carried out by an acoustic test system. The system consists a signal generator, a power amplifier, a sound transmission tube, a sound reflection tube, two acoustic sensors and a computer used for calculation (Figure 2). The MRM was fixed by a rigid ring with a radius of 15 mm and thickness of 2 mm and placed on the front end of the sound reflection tube. The sound waves used in experimental tests were pink noise, which was one of the most commonly used acoustic waves in acoustic tests.
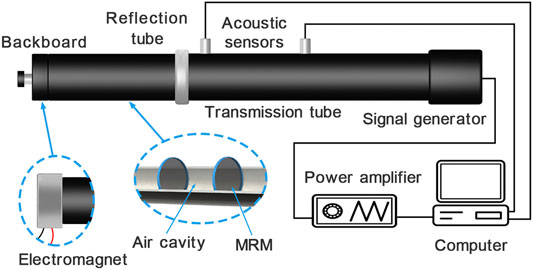
FIGURE 2. Schematic diagram of the acoustic tube.
When the samples were tested, the acoustical signal was generated from the signal generator controlled by the computer, amplified by the power amplifier, and spread into the sound transmission tube. Then, the acoustical signal was reflected at the sample and returned to the sound transmission tube. In the whole process, two acoustic sensors located at the sound transmission tube recorded the amplitude and phase information of the acoustic signal. In order to guarantee the accuracy of test results, the power amplifier was supposed to make sure that the incident acoustic signals were controlled between 90 and 110 dB. Finally, the acoustic signals were processed with the transfer function method in the computer to calculate the sound absorption curve. When the magnetic field was applied, the backboard was replaced by an electromagnet coil (Figure 2), which could play the same role as the backboard.
The physical pictures and SEM images of the MRMs were shown in Figures 3A–D. The surface of MRMs was smooth and the colors of the surface darkened gradually as the increasing of CIPs mass fractions (Figure 3A). Subtle ripples on the membrane surface observed in the SEM were due to the rotation during the preparation process (Figure 3B). CIPs were evenly distributed in the PDMS matrix (Figure 3C). MRMs were 40–180 μm in thickness and they tended to be stuck together because of their extra thin thickness, thus they were usually fixed on the framework during the experiment. When the rheological properties were investigated, MR elastomers with different mass fractions were prepared as disks with 0.5 mm in thickness and 10 mm in radius. Magnetic field scanning tests were carried out by the commercial rheometer (Physica MCR 301, Anton Paar) and Figure 3F shows their rheological properties. The initial storage moduli of MR elastomers were only 0.29 MPa, which meant that they were relatively easy to deform. The storage modulus increased with increasing of the magnetic field and tended to be stable when the magnetic field exceeded 400 mT. At the same time, the samples with higher mass fraction were strengthened more obviously by the magnetic field. Therefore, the mechanical properties of MR materials can be controlled by the external magnetic field. The hysteresis loops were also measured to characterize the magnetization of MRMs (Figure 3E). The magnetization had an important influence on the mechanical behavior in a magnetic field. With increasing of CIPs from 10 to 50 wt%, the saturation magnetizations were proportional to CIPs mass fractions and could reach to 96.26 emu/g. These high magnetizations must be responded for large magnetic deformation.
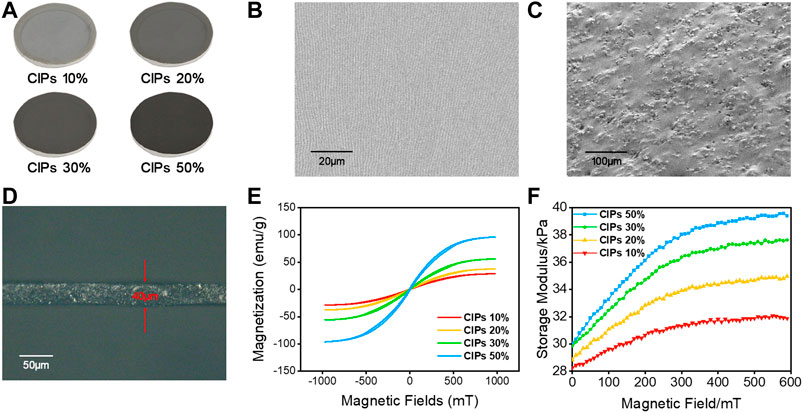
FIGURE 3. Diagram of the samples with different mass fractions (A), SEM images of the surface (B) and the longitudinal section (C), thickness of the sample under the optical microscope (D), storage modulus (E) and hysteresis loops (F) of the samples with different mass fractions.
When MRMs were exposed to a magnetic field, the ferromagnetic particles in MRMs were magnetized under the magnetic field and magnetic dipoles were induced within adjacent ferromagnetic particles. The magnetic dipoles were subject to magnetic forces in the magnetic field and drove the matrix to deform. The magnetic dipole moment
where
The deformations of MRMs were measured by the DIC method. The MRM was fixed flat on a frame and set on the central axis of an electromagnet coil. At the initial state, its off-plane displacement was zero. Then the MRM sagged inward slowly with increasing of the magnetic field. Figure 4B showed the image of the membrane deformation and the membrane was significantly deformed by applying the magnetic field. The results of the deformation test were displayed in Figure 4E, where the solid data points represented the experimental off-plane displacement of the membrane. The max off-plane displacement obtained by applying a 180 mT magnetic field to the 50 wt% CIP-MRM could reach as large as 1.69 mm. The deformation was significantly related to the magnetic field strength. A larger deformation was obtained under a larger magnetic field, because the stronger magnetic dipoles were induced in the CIPs were magnetized into stronger magnetic dipoles under large magnetic fields. At the same time, the mass fraction of CIPs also had a distinct influence on the deformation. The schematic diagram of the deformation of membranes with different mass fractions were showed in Figure 4D. The mass fractions of CIPs directly determined the number of magnetic dipoles. The MRMs with higher mass fractions can be magnetized to form more magnetic dipoles which further led to stronger magnetic force.
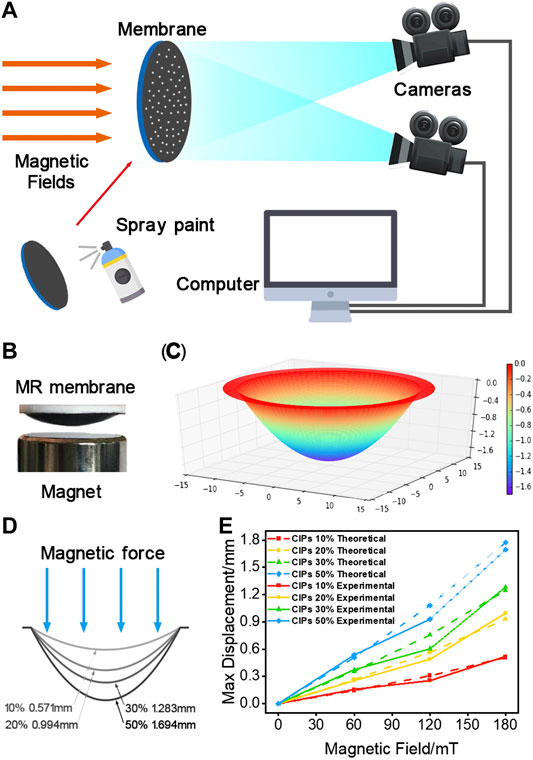
FIGURE 4. Schematic diagram of the DIC (A). Deformation of the MRMs under a magnetic field (B). Simulation result (C) and deformation diagram (D) of MRMs. Comparison of experimental and theoretical results for the max off-plane displacements (E).
The finite element simulation of the deformation was carried out to calculate the numerical value of the deformation under different magnetic field. The simulation was carried out by the COMSOL Multiphysics. The solids included the MRM, electromagnet coil, iron core, and air region. The current in the electromagnet coil was adjusted to turn the magnetic field to be similar to the magnetic field intensity in the forenamed experiment. Each solid was endowed with the corresponding material properties including the mechanical and magnetic parameters. The inside selection was chosen as the mesh operation and then the deformation could be obtained. The deformed shape of the membrane was displayed in Figure 4C. The dotted curves represented the numerical off-plane displacement of the membrane (Figure 4E). The max numerical off-plane displacement was 1.78 mm, which was closely similar to the experimental result. The numerical and experimental curves had the same tend and the experimental results were consistent with the numerical consequences.
When a sound wave encountered a wall or other obstacle, part of the sound energy was reflected, and part of the sound energy was absorbed by the wall or obstacle and converted into heat energy. The other part of the sound energy was transmitted to the other side. The sound absorption capacity of a certain material or structure was called the sound absorption coefficient. The definition of the sound absorption coefficient can be expressed as follows (Soltani and Zerrebini, 2012):
where
The sound absorption tests were carried out by the acoustic tube under different conditions. The thickness of MRMs, mass fractions of CIPs, air cavity length behind the membrane, and magnetic field strength were main factors that affected the sound absorption performance. The thickness and CIPs mass fraction of the control group were 40 μm and 50 wt% respectively. As shown in Figures 5A-D, the sound adsorption curves were unimodal in the measured frequency range. The MRM and air cavity behind the membrane formed a sound-absorbing structure together and this structure had its own natural frequency. When the sound wave was incident on the sound absorption structure, the acoustic energy would be transformed into the thermal energy and kinetic energy due to the damping and vibration. If the frequency of the incident sound wave was close to the natural frequency of the sound absorption structure, the resonance phenomenon occurred. The vibration of the sound absorption structure and the sound energy dissipation increased significantly, thus the sound absorption coefficient reached the maximum value. Although the natural frequency of a composite structure is difficult to estimate in a simple way, it is usually positively related to modulus and inversely related to mass or surface density. Obviously, most MRM sound absorbers have excellent sound absorption properties at their natural frequencies where the sound absorption coefficient is close to 1. This is because the MRM is thin and easy to deform, and it can vibrate intensely at the resonant frequency.
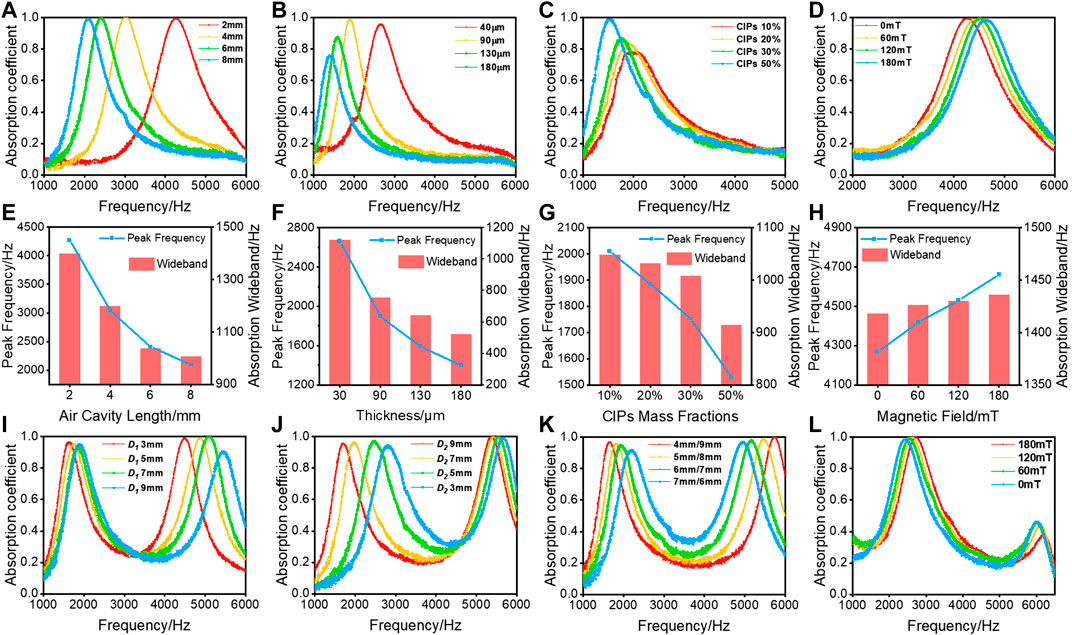
FIGURE 5. The influences of the air cavity length behind the membrane (A), the thickness of the membrane (B), mass fractions of CIPs (C), the magnetic field (D) on the sound absorption curves. The peak frequency and the sound absorption wideband corresponding to the above image (E–H). The sound absorption curves of the double-layer membrane structure with the varied length of the air cavity (I–K). Influences of the magnetic field on the double-layer membrane structure (L).
Here, the sound absorption wideband is defined as the frequency range where the sound absorption coefficient is larger than half of the max sound absorption coefficient. The sound absorption wideband is usually positively related to the max sound absorption coefficient and the peak frequency (Lee and Lee, 2007; Zhu et al., 2018b). The peak value of the sound adsorption and sound absorption wideband were displayed in Figures 5E-H. The air cavity length behind the membrane has the most significant influence on the sound absorption frequency. The peak sound absorption frequency changed from 4,260 to 2,088 Hz when the air cavity length behind the membrane increased from 2 to 8 mm (Figures 5A,E). The peak sound absorption coefficients were all close to 1 in Figure 5A. Therefore, the air cavity length behind the membrane can adjust the natural frequency in a wide frequency range without changing the good deformability of MRMs. Specially, the sound absorption frequency can be adjusted drastically while ensuring a high sound absorption coefficient.
On the contrary, with increasing of MRMs thickness, the peak sound absorption shifted to the lower frequency and the sound absorption coefficient decreased (Figure 5B). Though the natural frequency was adjusted by increasing the membrane thickness, the MRMs became harder and more difficult to be vibrated. In this case, less sound energy was consumed by vibration, thus the sound absorption coefficient decreased. Moreover, the membrane with lower CIPs mass fraction exhibited lower sound absorption coefficient, because it was too soft for effective vibration (Figure 5C). The magnetic field can attract MRMs to deform in the direction of the magnetic field and its influence on the sound absorption properties was similar to the air cavity length behind the membrane (Figure 5D). They both adjusted the sound absorption properties by changing the air cavity length. Here, the magnetic field can tune the whole structure without touching or modifying structure, and this characteristic is of great significance in practical application.
Furthermore, a double-layer membrane structure was investigated to improve the control of the sound absorption frequency. The double-layer membrane structure was developed by putting another membrane in the air cavity of the initial structure and formed two air cavities (Figure 2 sectional view). The sound absorption tests of the double-layer membrane structure were investigated. Different from the single-layer membrane, there were two sound absorption peaks on the sound absorption curve of the double-layer membrane structure (Figures 5I–L), thus it has two closer natural frequencies. The air cavities length behind two membranes was the most effective parameter to control the sound absorption properties. It can adjust the sound absorption frequency easily and maintain a high sound absorption coefficient simultaneously. The distance between two membranes was recorded as
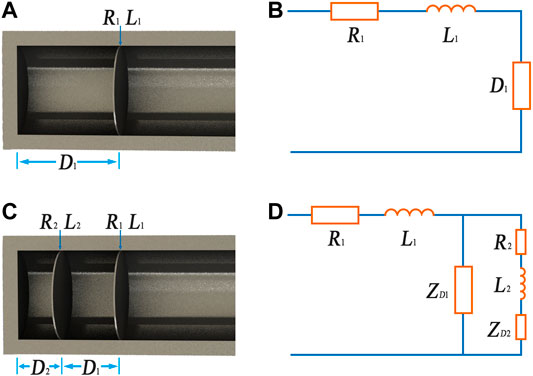
FIGURE 6. Schematic diagram (A) and equivalent circuit (B) of the single-layer membrane structure, schematic diagram (C) and equivalent circuit (D) of the double-layer membrane structure.
In order to further understand the sound absorption performance of the sound absorption structure, an equivalent circuit method was employed to predict the sound absorption curves (Kang and Fuchs, 1999). The equivalent circuit was displayed in Figure 6, in which R and L were the acoustic resistance and reactance of the membrane, D was the air cavity length and
Then, the sound absorption coefficient can be calculated by a classic formula:
where z is the normalized specific acoustic impedance of the entire equivalent circuit and it consists of two parts, the acoustic impedance of the membrane
where
Then, the final expression of the sound absorption coefficient can be expressed as:
The sound absorption coefficient reaches the maximum value when
For the case of double membranes, there are two air cavities between the membranes and the container wall. The expression of equivalent impedance can be derived with the equivalent circuit diagram in Figure 6D as follows:
Then the sound absorption coefficient of double membranes can be calculated by bringing the Eq. 11 into the Eq. 5, as shown in Figure 7. The solid curves and the dash dot curves represented the experiment results and the numerical results respectively. Figures 7A,B showed the influences of the air cavity length and magnetic field strength on the sound absorption curves. The curves of numerical solutions basically coincided with the experimental results. The simulation of the double-layer membrane structure was displayed in Figures 7C,D. The sound absorption frequencies of the numerical curves and the experimental curves were slightly different, but the sound absorption curves of them were similar overall.
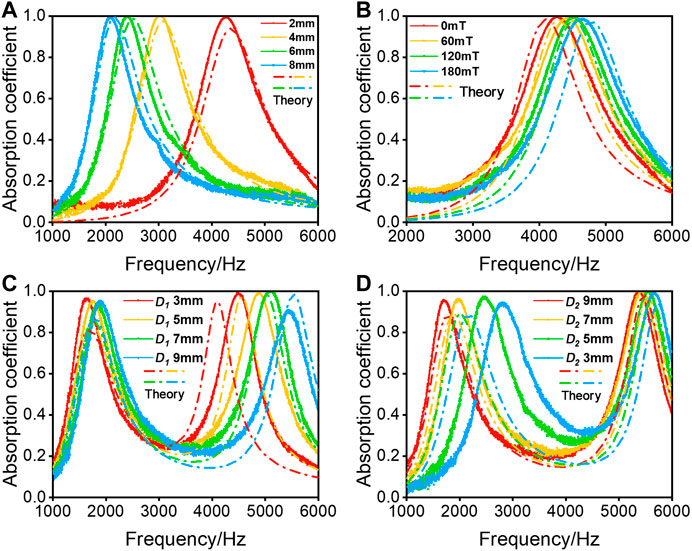
FIGURE 7. Comparison of experimental and numerical results: the air cavities length (A), the magnetic field (B), the length of the front cavity of double-layer membrane structure (C), the length of the back cavity of double-layer membrane structure (D).
The parameters studied in this work all indirectly adjusted the sound absorption coefficient by changing the acoustic impedance of the structure. The membrane thickness and CIPs mass fractions changed the acoustic impedance of the membrane. The air cavity length behind the membrane and the magnetic field strength determined the acoustic impedance of the air cavity. More importantly, the increased thickness and mass fractions of CIPs also affected the deformability of the membrane. Therefore, with increasing of the MRM thickness and CIPs mass fractions, the max sound absorption coefficient decreased. Contrastively, the air cavity length behind the membrane and the strength of magnetic fields only changed the acoustic impedance of the air cavity to adjust the sound absorption coefficient but not the properties of MRMs, so they had little negative influence on the max sound absorption coefficient. As a result, the tunable range of the frequency for this kind of sound absorption structure is wide and the adjustment can be achieved by the remote magnetic field without touching the structure.
Finally, the MR membranes with
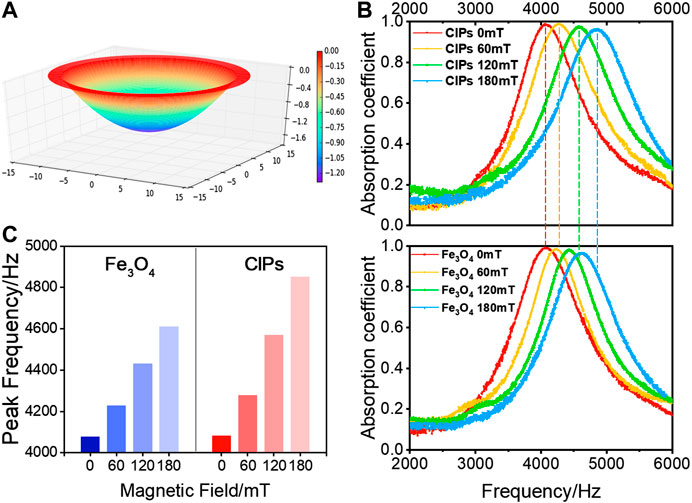
FIGURE 8. Deformation and sound absorption properties of the
This work reported a novel sound absorber based on MRMs and the sound absorber exhibited a magnetic field tunable absorption frequency with a wide range absorption efficiency. The thin MRMs were easy to be deformed under an external magnetic field. The max off-plane displacement reaches as large as 1.69 mm when a 180 mT magnetic field is applied on the 50 wt% CIP-MRM. The numerical analysis carried out by the finite element method confirmed that the off-plane displacement was positively related to the CIPs mass fractions and the magnetic field strength. Then, the influence of the membrane thickness, CIPs mass fractions, air cavity length behind the membrane, and the strength of the magnetic field on the sound absorption properties were investigated. The air cavity length and the strength of the magnetic field not only adjusted the sound absorption frequency but also maintained the high sound absorption coefficient. As a result, the strength of the magnetic field can tune the sound absorption structure without touching or modifying the structure, thus it is of high potential for active sound absorption and remote control.
The original contributions presented in the study are included in the article, further inquiries can be directed to the corresponding author/s.
CS performed all the experiments and wrote the draft of the manuscript. XC, XZ, SX and XG revised and discussed the manuscript.
The financial supports from the National Natural Science Foundation of China (Grant No. 11822209, 12072338, 11702174), Joint Fund of USTC-National Synchrotron Radiation Laboratory (KY2090000055) and the Strategic Priority Research Program of the Chinese Academy of Sciences (Grant No. XDB22040502) are gratefully acknowledged.
The authors declare that the research was conducted in the absence of any commercial or financial relationships that could be construed as a potential conflict of interest.
Ahmed, A., Noureddine, A., Morvan, O., and Olivier, D. (2019). Numerical and experimental investigations on the acoustic performances of membraned Helmholtz resonators embedded in a porous matrix. J. Sound Vib. 459, 114873. doi:10.1016/j.jsv.2019.114873
Arenas, J. P., and Ugarte, F. (2016). A note on a circular panel sound absorber with an elastic boundary condition. Appl. Acoust. 114, 10–17. doi:10.1016/j.apacoust.2016.07.002 CrossRef Full Text
Boyer, T. H., and Timothy, H. (1998). The force on a magnetic dipole. Am. J. Phys. 56, 688–692. doi:10.1119/1.15501 CrossRef Full Text
Chen, S. W., Li, R., Li, X., and Wang, X. J. (2018). Magnetic field induced surface micro-deformation of magnetorheological elastomers for roughness control. Front. Mater. 5, 76. doi:10.3389/fmats.2018.00076 CrossRef Full Text
Ding, L., Xuan, S., Pei, L., Wang, S., Hu, T., Zhang, S., and Gong, X. (2018). Stress and magnetic field bimode detection sensors based on flexible Cl/CNTs-PDMS sponges. ACS Appl. Mater. Interfaces 10, 30774–30784. doi:10.1021/acsami.8b11333 CrossRef Full Text
Enrico, D., Marta, P., Marco, P., Mario, G., Luca, C., and Gianluca, T. (2017). Precision of digital volume correlation approaches for strain analysis in bone imaged with micro-computed tomography at different dimensional levels. Front. Mater. 4, 31. doi:10.3389/fmats.2017.00031
Eric, D., Jiang, Z., Guo, Z. L., Edwards, M. R., and Metin, S. (2014). Continuously distributed magnetization profile for millimeter-scale elastomeric undulatory swimming. Appl. Phys. Lett. 104, 1121–1122. doi:10.1063/1.4874306
Feng, J. B., Xuan, S. H., Ding, L., and Gong, X. L. (2017). Magnetoactive elastomer/PVDF composite film based magnetically controllable actuator with real-time deformation feedback property. Compos. Part A: Appl. Sci. Manuf. 103, 25–34. doi:10.1016/j.compositesa.2017.09.004 CrossRef Full Text
Fu, J., Li, P. D., Wang, Y., Liao, G. Y., and Yu, M. (2016). Model-free fuzzy control of a magnetorheological elastomer vibration isolation system: analysis and experimental evaluation. Smart Mater. Struct. 25, 035030. doi:10.1088/0964-1726/25/3/035030
Gai, X. L., Xing, T., Li, X. H., Zhang, B., Cai, Z. N., and Wang, F. (2018). Sound absorption properties of microperforated panel with membrane cell and mass blocks composite structure. Appl. Acoust. 137, 98–107. doi:10.1016/j.apacoust.2018.03.013 CrossRef Full Text
Gao, Y., Cheng, T., Su, Y., Xu, X. H., Zhang, Y., and Zhang, Q. C. (2015). High-efficiency and high-accuracy digital image correlation for three-dimensional measurement. Opt. Lasers Eng. 65, 73–80. doi:10.1016/j.optlaseng.2014.05.013 CrossRef Full Text
Hu, T., Xuan, S. H., Ding, L., and Gong, X. L. (2020). Liquid metal circuit based magnetoresistive strain sensor with discriminating magnetic and mechanical sensitivity. Sens. Actuators B Chem. 314, 128095. doi:10.1016/j.snb.2020.128095 CrossRef Full Text
Jiang, H. F., Zhang, Q. C., Chen, X. D., Chen, Z. J., Jiang, Z. Y., Wu, X. P., et al. (2007). Three types of Portevin–Le Chatelier effects: experiment and modelling. Acta Mater. 55, 2219–2228. doi:10.1016/j.actamat.2006.10.029 CrossRef Full Text
Jiménez, N., Huang, W., Romero-Garcia, V., Pagneux, V., and Groby, J.-R. (2016). Ultra-thin metamaterial for perfect and quasi-omnidirectional sound absorption. Appl. Phys. Lett. 109, 121902.1–121902.4. doi:10.1063/1.4962328 CrossRef Full Text
Ju, B. X., Tang, R., Zhang, D. Y., Yang, B. L., Yu, M., Liao, C. R., et al. (2016). Dynamic mechanical properties of magnetorheological elastomers based on polyurethane matrix. Polym. Compos. 37, 1587–1595. doi:10.1002/pc.23330
Kang, J., and Fuchs, H. V. (1999). Predicting the absorption of open weave textiles and micro-perforated membranes backed by an air space. J. Sound Vib. 220, 905–920. doi:10.1006/jsvi.1998.1977
Kimihiro, S., Masayuki, M., and Motoki, Y. (2009). A note on the relationship between the sound absorption by microperforated panels and panel/membrane-type absorbers. Appl. Acoust. 70, 1131–1136. doi:10.1016/j.apacoust.2009.03.003
Lee, Y. Y., and Lee, E. W. M. (2007). Widening the sound absorption bandwidths of flexible micro-perforated curved absorbers using structural and acoustic resonances. Int. J. Mech. Sci. 49, 925–934. doi:10.1016/j.ijmecsci.2007.01.008
Liu, C. R., Wu, J. H., Lu, K., Zhao, Z. T., and Huang, Z. (2019a). Acoustical siphon effect for reducing the thickness in membrane-type metamaterials with low-frequency broadband absorption. Appl. Acoust. 148, 1–8. doi:10.1016/j.apacoust.2018.12.008 CrossRef Full Text
Liu, X. H., Wang, N. N., Wang, K., Huang, H., Li, W. H., Sarkodie-Gyan, T., and Li, W. (2019b). Optimizing vibration attenuation performance of a magnetorheological damper-based semi-active seat suspension using artificial intelligence. Front. Mater. 6, 269. doi:10.3389/fmats.2019.00269 CrossRef Full Text
Lum, G. Z., Ye, Z., Dong, X. G., Marvi, H., Erin, O., Hu, W. Q., et al. (2016). Shape-programmable magnetic soft matter. Proc. Natl. Acad. Sci. U.S.A. 113, E6007–E6015. doi:10.1073/pnas.1608193113 CrossRef Full Text
Maa, D. Y. (1975). Theory and design of microperforated panel sound-absorbing constructions. Sci. China Ser. A xviii, 55–71. doi:10.1126/science.187.4182.1213
Ren, L., Sun, S. S., Casillasgarcia, G., Nancarrow, M. J. B., Peleckis, G., Turdy, M., et al. (2018). A liquid-metal-based magnetoactive slurry for stimuli-responsive mechanically adaptive electrodes. Adv. Mater. 30, 1802595. doi:10.1002/adma.201802595 CrossRef Full Text
Reto, P., and Kurt, H. (2015). Predicting sound absorption coefficients of lightweight multilayer curtains using the equivalent circuit method. Appl. Acoust. 92, 27–41. doi:10.1016/j.apacoust.2015.01.003
Soltani, P., and Zerrebini, M. (2012). The analysis of acoustical characteristics and sound absorption coefficient of woven fabrics. Text. Res. J. 82, 875–882. doi:10.1177/0040517511402121 CrossRef Full Text
Takeshi, O., and Kimihiro, S. (2015). A finite-element formulation for room acoustics simulation with microperforated panel sound absorbing structures: verification with electro-acoustical equivalent circuit theory and wave theory. Appl. Acoust. 95, 20–26. doi:10.1016/j.apacoust.2015.02.012
Ubaidillah, S., Purnomo, E. D., Ismail, H., Choi, S.-B., Aziz, A. A., and Mazlan, S. A. (2019). Swelling, thermal, and shear properties of a waste tire rubber based magnetorheological elastomer. Front. Mater. 6, 47. doi:10.3389/fmats.2019.00047 CrossRef Full Text
Vien, Q. N., Duy, T. L., Dai, H. L., Nguyen, Q. H., and Choi, S. B. (2019). Material characterization of MR fluid on performance of MRF based braker. Front. Mater. 6, 125. doi:10.3389/fmats.2019.00125
Xu, J. Q., Wang, P. F., Pang, H. M., Wang, Y. P., Wu, J., Xuan, S. H., et al. (2018). The dynamic mechanical properties of magnetorheological plastomers under high strain rate. Compos. Sci. Technol. 159, 50–58. doi:10.1016/j.compscitech.2018.02.030 CrossRef Full Text
Zhang, Q. C., Jiang, Z. Y., Jiang, H. F., Chen, Z. J., and Wu, X. P. (2005). On the propagation and pulsation of Portevin-Le Chatelier deformation bands: an experimental study with digital speckle pattern metrology. Int. J. Plast. 21, 2150–2173. doi:10.1016/j.ijplas.2005.03.017 CrossRef Full Text
Zhang, Y. F., Fang, F. Z., Huang, W., Chen, Y. C., and Yu, M. (2019). Dynamic mechanical hysteresis of magnetorheological elastomers subjected to the cyclic loading and periodic magnetic field. Front. Mater. 6, 292. doi:10.3389/fmats.2019.00292 CrossRef Full Text
Zhao, J. J., Li, X. H., Wang, Y. Y., Wang, W. J., Zhang, B., and Gai, X. L. (2017). Membrane acoustic metamaterial absorbers with magnetic negative stiffness. J. Acous. Soc. Am. 141, 840–846. doi:10.1121/1.4976042 CrossRef Full Text
Zhu, X. Z., Chen, Z. B., Jiao, Y. H., and Wang, Y. P. (2018b). Broadening of the sound absorption bandwidth of the perforated panel using a membrane-type resonator. J. Vib. Acoust. 140, 031014. doi:10.1016/j.ijmecsci.2007.01.00810.1115/1.4038942 CrossRef Full Text
Keywords: magnetorheological elastomer, magnetostriction, membrane, deformation, sound absorber
Citation: Sun C, Cao X, Zhou X, Gong X and Xuan S (2020) Deformation Dependent Sound Absorption Property of a Novel Magnetorheological Membrane Sound Absorber. Front. Mater. 7:598973. doi: 10.3389/fmats.2020.598973
Received: 26 August 2020; Accepted: 06 October 2020;
Published: 30 October 2020.
Edited by:
Jong-Seok Oh, Kongju National University, South KoreaReviewed by:
Xufeng Dong, Dalian University of Technology, ChinaCopyright © 2020 Sun, Cao, Zhou, Gong and Xuan. This is an open-access article distributed under the terms of the Creative Commons Attribution License (CC BY). The use, distribution or reproduction in other forums is permitted, provided the original author(s) and the copyright owner(s) are credited and that the original publication in this journal is cited, in accordance with accepted academic practice. No use, distribution or reproduction is permitted which does not comply with these terms.
*Correspondence: Xinglong Gong, Z29uZ3hsQHVzdGMuZWR1LmNu, Shouhu Xuan, eHVhbnNoQHVzdGMuZWR1LmNu
Disclaimer: All claims expressed in this article are solely those of the authors and do not necessarily represent those of their affiliated organizations, or those of the publisher, the editors and the reviewers. Any product that may be evaluated in this article or claim that may be made by its manufacturer is not guaranteed or endorsed by the publisher.
Research integrity at Frontiers
Learn more about the work of our research integrity team to safeguard the quality of each article we publish.