 YeJin Jeong1
 Yuan Yao
 Evelyn K. F. Yim
95% of researchers rate our articles as excellent or good
Learn more about the work of our research integrity team to safeguard the quality of each article we publish.
Find out more
ORIGINAL RESEARCH article
Front. Mater. , 14 January 2021
Sec. Mechanics of Materials
Volume 7 - 2020 | https://doi.org/10.3389/fmats.2020.595295
This article is part of the Research Topic Women in Science: Materials View all 34 articles
Poly(vinyl alcohol) (PVA) is a water-soluble polymer and forms a hydrogel that has been studied as a potential small-diameter (<6 mm) vascular graft implant. The PVA hydrogel crosslinked using sodium trimetaphosphate (STMP) has been shown to have many beneficial properties such as bioinert, low-thrombogenicity, and easy surface modification. Compared to conventional synthetic vascular graft materials, PVA has also shown to possess better mechanical properties; however, the compliance and other mechanical properties of PVA grafts are yet to be optimized to be comparable with native blood vessels. Mechanical compliance has been an important parameter to be studied for small-diameter vascular grafts, as compliance has been proposed to play an important role in intimal hyperplasia formation. PVA grafts are made using dip-casting a cylindrical mold into crosslinking solution. The number of dipping can be used to control the wall thickness of the resulting PVA grafts. In this study, we hypothesized that the number of dip layers, chemical and physical crosslinking, and interlayer adhesion strength could be important parameters in the fabrication process that would affect compliance. This work provides the relationship between the wall thickness, burst pressure, and compliance of PVA. Furthermore, our data showed that interlayer adhesion as well as chemical and physical crosslinking density can increase the compliance of PVA grafts.
Small diameter synthetic vascular grafts, which are grafts with diameter <6 mm, are not commercially available due to having low patency. The low patency has been attributed to many mechanical and biological factors (Abbott et al., 1987). Among the different factors, mechanical compliance has been shown as one of the potential parameters that can influence the performance of small diameter vascular grafts (Jeong et al., 2020; Szafron, 2019). Compliance is defined in vascular graft engineering as the elasticity of the conduit when exposed to internal pressure (Szafron, 2019). The commercially available synthetic grafts, such as expanded polytetrafluoroethylene (ePTFE) and Dacron, have significantly lower compliance than native blood vessels (Tai et al., 2000). However, the exact role compliance plays in the failure of small diameter vascular graft still remains elusive (Jeong et al., 2020). This is partially due to the difficulty in fabricating grafts using one material with variable, controllable, and predictable compliance.
One of the materials that is being studied as a potential off-the-shelf small-diameter vascular graft is poly(vinyl alcohol) (PVA) (Pohan et al., 2019; Cutiongco et al., 2015; Yao, 2020; Elshazly, 2004; Cutiongco et al., 2016b). PVA is a bioinert and low thrombogenic polymer that allows for easy chemical and topographical surface modification (Yao, 2020). In addition to having beneficial biomaterial properties, PVA has tunable mechanical properties (Cutiongco et al., 2016b). As a result, PVA is used in various applications. PVA vascular grafts are fabricated via dip-casting using cylindrical molds. PVA grafts have been shown to have dimensions and suture retention strength close to the native artery while withstanding burst pressure higher than that of the maximum systolic blood pressure (Chaouat, 2008). Although PVA grafts have higher compliance than ePTFE grafts, PVA grafts are still not as compliant as the native blood vessels (Pohan et al., 2020). Therefore, there is a need to investigate the different fabrication conditions of PVA grafts to further increase the compliance of PVA grafts. One limiting parameter to increasing compliance is the mechanical integrity of the grafts. As the grafts need to withstand the physiological pressure, increase in compliance cannot sacrifice the mechanical integrity of the grafts to ensure the safety of the patients. One of the parameters used to test the mechanical integrity of the vascular grafts is burst pressure. Burst pressure is the internal pressure at which the graft bursts, and is known to be closely correlated to the wall thickness of a tube (Menon, 2011). The motivation of this study is to make grafts with varying compliance using PVA, and identifying the burst pressure at respective compliance.
To further identify the parameters that can contribute to the mechanical properties of the PVA grafts, the interlayer adhesion and crosslinking density were explored. Interlayer adhesion and crosslinking density have been shown to contributed to dip-casting polymer and hydrogel mechanical properties. An increase in interlayer adhesion is known to increase the mechanical integrity of hydrogels (Kim et al., 2020). Interlayer adhesion is a critical factor since PVA grafts are fabricated through dip-casting multiple layers to reach the desired wall thickness. Additionally, the crosslinking density of the hydrogels can affect the mechanical properties of the polymer (Kim et al., 2020; Leone, 2010; Peppas et al., 2006). Increasing crosslinking density can result in stiffer hydrogels. PVA is a material with multiple mechanisms of chemical crosslinking with different chemical crosslinkers (Puy et al., 2019) and physical crosslinking with physical entanglement or via hydrogen-bonding (XIONG, 2008; Chen et al., 2016). In an effort to increase compliance while maintaining high burst pressure, interlayer adhesion and crosslinking densities were altered by altering fabrication process. We hypothesize that the increase in interfacial energy will allow for higher compliance and higher burst pressure when the grafts have the same wall thickness. Also, we hypothesize that a decrease in crosslinking density will result in higher compliance and lower burst pressure when the grafts have the same wall thickness. Lastly, we hypothesize that post-fabrication processing can cause physical crosslinking, and impact the compliance and burst pressure.
Standard PVA crosslinking method was used for graft fabrication as described previously (Cutiongco et al., 2015). Briefly, cylindrical molds are dip-cast in the crosslinking solution, then dried in controlled environment as shown in Figure 1A. The complete list of the parameters that were varied during the fabrication of the grafts is shown in Supplementary Table S1. All of the grafts made using different fabrication parameters had 9 layers. The images of the grafts that were successfully fabricated using different fabrication parameters are shown in Figure 1B. The abbreviations and the fabrication conditions that was altered from the standard fabrication conditions is explained in Figure 1C.
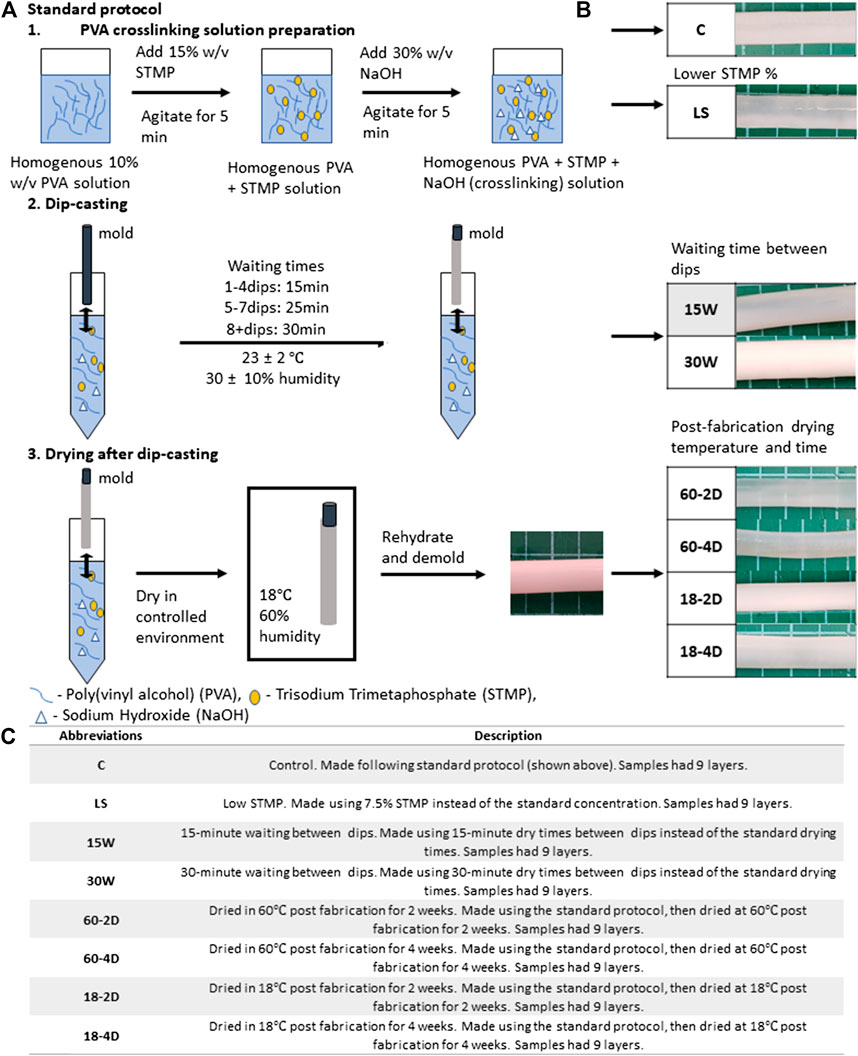
FIGURE 1. Standard graft fabrication protocol and description of the varied parameter for each experimental groups. (A) Standard protocol, (B) representative images of the fabricated grafts for each experimental group, and (C) abbreviations and descriptions of the varied parameter for each experimental group. Samples for all groups were fabricated following the standard protocol except for the described parameter.
For standard crosslinking density grafts, a 10% aqueous solution of PVA (Sigma-Aldrich, 85–124 kDa, 87–89% hydrolyzed) was mixed with 15% w/v sodium trimetaphosphate (STMP, Sigma-Aldrich) and 30% w/v NaOH at the volumetric ratio of 12:1:0.4, respectively, to create crosslinking solution. PVA grafts were fabricated using base-catalyzed STMP crosslinking. The PVA crosslinking solution was immediately dip-cast on a cylinder mold to form tubular PVA grafts.
To fabricate PVA grafts with different crosslinking density, 10% w/v PVA solutions of different molecular weights were used. Instead of the standard molecular weight of PVA (Sigma-Aldrich, 85–124 kDa, 87–89% hydrolyzed) low molecular weight PVA (Sigma-Aldrich, 13–23 kDa, 87–89% hydrolyzed) (LMW), or medium molecular weight PVA (Sigma-Aldrich, 31–50 kDa, 87–89% hydrolyzed) (MMW) were used while all other parameters were kept the same as the standard method. A low STMP (LS) concentration of 7.5% w/v was used to crosslink PVA with the standard PVA concentration and NaOH concentration. Lastly, low NaOH (LN) concentration of 15% w/v was used to fabricate grafts with decreased crosslinking density.
PVA vascular grafts were cast as previously described (Figure 1A) (Pohan et al., 2019). In short, the molds for the tubular grafts were plasma cleaned, then dipped in PVA crosslinking solution. The coated molds were dried at 20–21°C and 30% humidity for varying waiting time, before dipping in the crosslinking solution again for the next layer. For the first four dips, the drying time between dips was 15 min, the drying time between dips in the fifth to seventh dip was 25 min, and drying time between dips for the eighth dip and higher was 30 min. The molds were inverted every-other dips to ensure even crosslinking throughout the mold. After the dipping completed, the PVA grafts were dried at 18°C and 70–80% humidity for 3 days.
Upon completion of the final drying step, the PVA grafts were rehydrated in 10x phosphate buffered saline (PBS) for 2 h, 1x phosphate buffered saline (PBS) for 2 h, then in deionized (DI) water for 2 h. For the samples used in phosphate quantification assay, samples were rehydrated in 9% w/v sodium chloride (NaCl) for 2 h, 0.9% w/v NaCl for another 2 h, and then in DI water for 2 more hours. The grafts were removed from the molds once they were fully rehydrated. The completed grafts were then kept in DI water until experiments. This procedure was kept the same as the standard method for the different groups unless otherwise specified. Grafts with different drying times were also fabricated as a method to test how the dry time could vary the interfacial energy. The drying times were either consistent 15 min (15 W) or 30 min (30 W) between dips for these samples. In sample group to test the role of drying rate on interfacial energy, PVA grafts were fabricated at higher humidity (HH) of 60 ± 5% during fabrication.
After the rehydration step, some vascular grafts fabricated using the standard protocol were dried again to facilitate further crosslinking. Upon removal from the mold, the grafts were washed by submerging the grafts in DI water for 5 days. The grafts were dried again afterward at different conditions. The post-fabrication drying conditions were: 2 weeks at 60°C (60-2D), 4 weeks at 60°C (60-4D), 2 weeks at 18°C (18-2D), and 4 weeks at 18°C (18-4D). Before testing, the grafts were rehydrated in DI water.
The samples were kept at room temperature at all times. All samples were stored in DI water in a 50 mL conical tube upon completion of the fabrication. DI water was poured out and replenished with fresh DI water every 7 days during storage.
4 g ± 0.2 g of 10% w/v PVA solution was poured into petri dishes with diameter of 35 mm. The petri dish was covered and stored at 18°C chamber with a relative humidity of 70–80% for 3 days. The petri dish was then uncovered and stored at 18 C and 70–80% humidity for another 4 days. The dried PVA film (Film) was removed from the petri dish. Films were stored in petri dish until use.
2 mm segment rings were cut from the tubular PVA grafts at the ends and at the center of the samples. Images of the 2 mm segments were taken, and the inner diameter and wall thickness of the segments were measured for each segment from the images using MatLab. For each individual sample, the measurements of the inner diameter and the wall thickness from segments at different regions were averaged to yield the average inner diameter and the wall thickness of the sample.
3 cm segments of PVA grafts were exposed to 120 and 80 mmHg of hydrostatic pressure. Images of the grafts were taken at the defined pressures. The outer diameters of the grafts were measured, then the compliances of the grafts were calculated using the following equation (Chaouat, 2008):
ePTFE vascular graft (Gore-Tex®, catalog number V04070L) with the inner diameter of 4 mm was used to measure the compliance of the ePTFE graft with comparable size using the stated setup.
4 cm segments of PVA grafts were exposed to internal pressure induced by nitrogen gas at room temperature. The pressure was increased gradually until the graft burst. The burst pressure was recorded at the pressure at which the graft burst. A normalized burst pressure was calculated as burst pressure normalized per unit thickness by dividing the burst pressure of the samples by their wall thickness.
Lap shear test was performed following protocols described in published literature with modifications (Court et al., 2001). 1 cm segments were cut from tubular PVA grafts. The segments were cut open longitudinally, then they were held in a flat position and dried at 60°C for 7 days. Segments prepared as such were partially rehydrated for 15 min and trimmed into 5 mm × 10 mm rectangular specimens. The surface of the specimens was patted dry using a paper towel. Then, the segment was glued onto two polylactic acid (PLA) holders so that the trimmed PVA segment was sandwiched between the two PLA holders. The PVA hydrogel segment was further rehydrated in DI water for 30 min. After rehydration, any residual water on the surface was removed. The non-overlapping parts of the holders were loaded onto a tensile testing equipment (AGSX Shimadzu, Japan), which was equipped with 1 kN load cell, and stretched at a rate of 25 mm/min until failure. Images of the samples after the test were taken using the laser confocal microscope (Olympus LEXT OLS5000-SAF, Japan) to measure the thickness variation within the destroyed samples. The heights of the samples were measured using Olympus data analysis software.
Phosphate quantification was performed according to the manufacturer protocol outlined in the phosphate quantification assay (Phosphate Assay Kit, Colorimetric, ab65622, Abcam). In brief, the rehydrated PVA grafts were dried at 60°C for 7 days. The dried grafts were then degraded in 10% nitric acid, then diluted to varying concentrations. The degraded polymer solutions were added into micro-plate and allowed to react with the assay reagent. The absorbances of the solutions were then measured. Using the absorbance, the amount of phosphate in the PVA graft was calculated.
Fourier-transform infrared (FTIR) spectroscopy was performed following a published protocol (Pohan et al., 2020). PVA grafts were cut to 1 cm segments, and the segments were then cut open longitudinally. The grafts were dried flat. Fourier-transform infrared (FTIR) spectroscopy was performed using Thermo Fisher Scientific FTIR (Nicolett 6700) fitted with germanium and a high sensitivity pyroelectric detector. Percent transmittance of the samples were collected between 400 and 4,000 cm−1. Sixty-four scans were acquired at a spectral resolution of 4 cm−1. Data were normalized by modifying previously published protocol (Ahmed et al., 2019). The data was normalized to the highest % transmittance and the PVA film spectrum was subtracted from the % transmittance spectra.
Differential scanning calorimetry (DSC; TA Instruments DSC Q2000) was performed following the published protocol (Pohan et al., 2020). In brief, the samples were dried at 60°C for at least 1 week 10 g ± 0.1 g of samples were measured and added into the Tzero Aluminum Hermetic pan. The heating cycle was set from 30°C to 260°C at the ramp rate of 10°C/min. Data were analyzed using the TA Universal Analysis software. Fractional crystallinity was calculated using heat of melting of 100% crystalline PVA of 138.60 J/g (Peppas and Merrill, 1976).
PVA grafts were submerged in DI water for at least a week to ensure thorough removal of charged ions from the grafts. Small sections of the tubular grafts were cut from the PVA grafts. Any residual DI water lingering on the PVA sections were removed prior to measuring the weights of the sections. The sections were then dried at 60°C for 5 days. The weights of the sections were measured every day for the subsequent days until the weight of the sections did not change further. Swelling ratio was calculated using the following equation (Lack, 2004):
For longitudinal elastic modulus and ultimate strength measurement, the grafts were cut into 8 cm segments. The prepared samples were loaded onto the tensile machine (AGSX Shimadzu, Japan) with the gauge lengths of 2 cm. The samples were then stretched at a rate of 25mm/min until the tensile failure of the sample. For circumferential elastic modulus and ultimate strength measurement, the grafts were cut into 2 mm width rings. Curved holders were loaded onto the tensile testing machine grips. The PVA rings were loaded onto the holders so that the rings were held by the holders. The holders were then separated to achieve a gauge length of 5 mm. The samples were then stretched at a rate of 10 mm/min until the sample failed.
Suture retention strength of the PVA grafts were measured using published protocol with modifications (Chaouat, 2008; Pohan et al., 2020). PVA grafts were cut into 4 cm segments. Using 7–0 suture, a single suture was made 5 mm from the edge of the segment for each sample. The remaining suture end was taped securely onto an immovable surface so that the sample was hanging by the suture. Load was applied at 10 g/min onto the sample until the sample broke. The weight at which the sample broke was measured.
Statistical significance was determined using a two-way ANOVA followed by Tukey's multiple comparison analysis with 95% confidence interval using MatLab. The data are presented as mean ± standard deviation. For all the presented data, p < 0.05 is denoted by * unless otherwise specified in the figure caption. The correlations between components were compared using principle component analysis (PCA). PCA plots were generated using JMP statistical software.
The relationships between the burst pressure vs wall thickness and compliance vs wall thickness are shown in Figure 2. The cross-sectional images of the PVA grafts with different layers are shown in Figure 2A. The red arrow highlights the region in the graft that has different transparency. The wall thickness of the grafts increased linearly with the increased number of layers (Figure 2B). As shown in Figure 2C, a linear increase in burst pressure with increasing wall thickness was also observed. The compliance of the grafts displayed an inverse relationship with the wall thickness (Figure 2D).
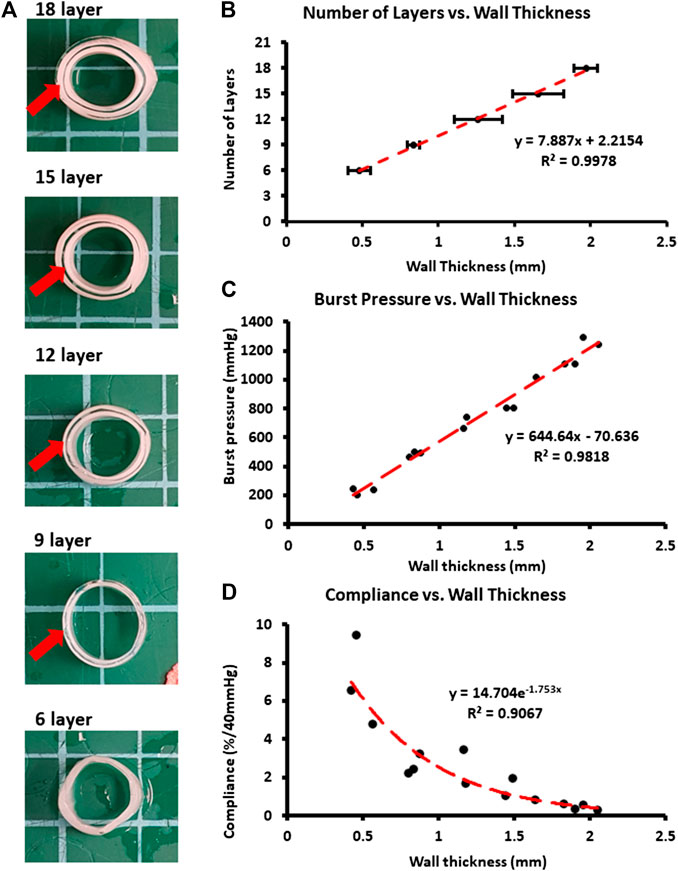
FIGURE 2. Physical and mechanical characterization of grafts with differential number of layers. (A) Cross-sectional images. Red arrows used to identify difference level of transparency between layers. (B) Wall thickness of the samples for differential number of layers. (C) Burst pressure plotted against the wall thickness. (D) Compliance plotted against the wall thickness. *p < 0.05 between indicated groups. n = 9 for all groups. Error bar represents standard deviation.
All of the grafts that were made using different fabrication parameters had 9 layers. The complete list of conditions used for fabrications and their fabrication outcomes are shown in Supplementary Table S1. The images of the grafts that fabricated successfully are shown in Figure 1B. The cross-sectional images of the successfully fabricated grafts are shown in Figure 3A. The wall thickness of the grafts was quantified (Figure 3B). LS, 15 W, 60-2D, and 60-4D had significantly thinner walls than the control group, while 30 W, 18-2D, and 18-4D showed no statistical difference from the control group. The wall thickness of 15 W was significantly thinner than 30 W. 60-2D and 60-4D did not show any statistical difference in wall thickness. Also, 18-2D and 18-4D did not show any statistical difference in wall thickness.
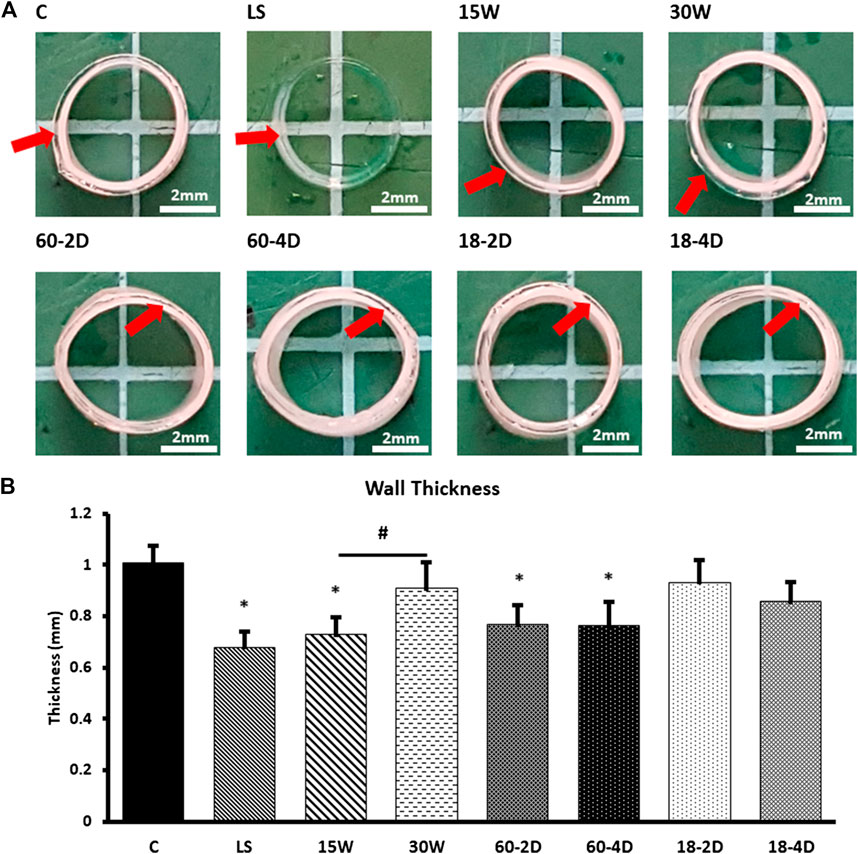
FIGURE 3. Physical characterization of the experimental groups. (A) Cross-sectional images. Red arrows used to identify difference level of transparency between layers within a sample. (B) Wall thickness of the samples for different number of layers. (C) Wall thickness of the samples. *Indicates p < 0.05 with respect to control group. # Indicates p < 0.05 between the groups being compared. n = 9 for all samples.
Despite having thinner walls than the control, grafts from LS, 60-2D, and 60-4D conditions had significantly lower compliance than the control group (p < 0.05, Figure 4A). Regardless of the post-fabrication drying temperature, the samples that were subjected to extra dehydration process post-fabrication had significantly lower compliance than the control group (Figure 4A). 30 W had lower compliance than the control group as well, despite having comparable wall thickness. Lastly, 15 W did not have statistically significant differences in compliance compared to the control group despite having thinner wall thickness. Within each group with the same fabrication or post-fabrication variations, all groups displayed an inverse relationship between wall thickness and compliance (Figure 4B). The burst pressure of 15 W was significantly lower than control, which was as expected due to the lower wall thickness of the group (Figure 4C). However, 60-2D and 60-4D had higher burst pressure than the controls despite having thinner walls. LS, 30 W, 18-2D, and 18-4D did not have significantly different burst pressure with respect to the control group. Within each group with the same fabrication or post-fabrication variations, all of the groups showed positive linear relationship between the wall thickness and the burst pressure (Figure 4D). Swelling ratio was used to estimate the crosslinking density. LS, 60-2D, and 60-4D had less swelling than the control group (Figure 4E). 15 W had higher swelling ratio than the control group. No correlation between the swelling ratio and the wall thickness was observed (Figure 4F). Further assessment of the burst pressure was performed by normalizing the burst pressure per unit thickness (Supplementary Figure S1). When the data was normalized to wall thickness, LS, 60-2D, and 60-4D had significantly higher normalized burst pressure than the control group. Additionally, 60-2D and 60-4D had higher normalized burst pressure than 18-2D and 18-4D.
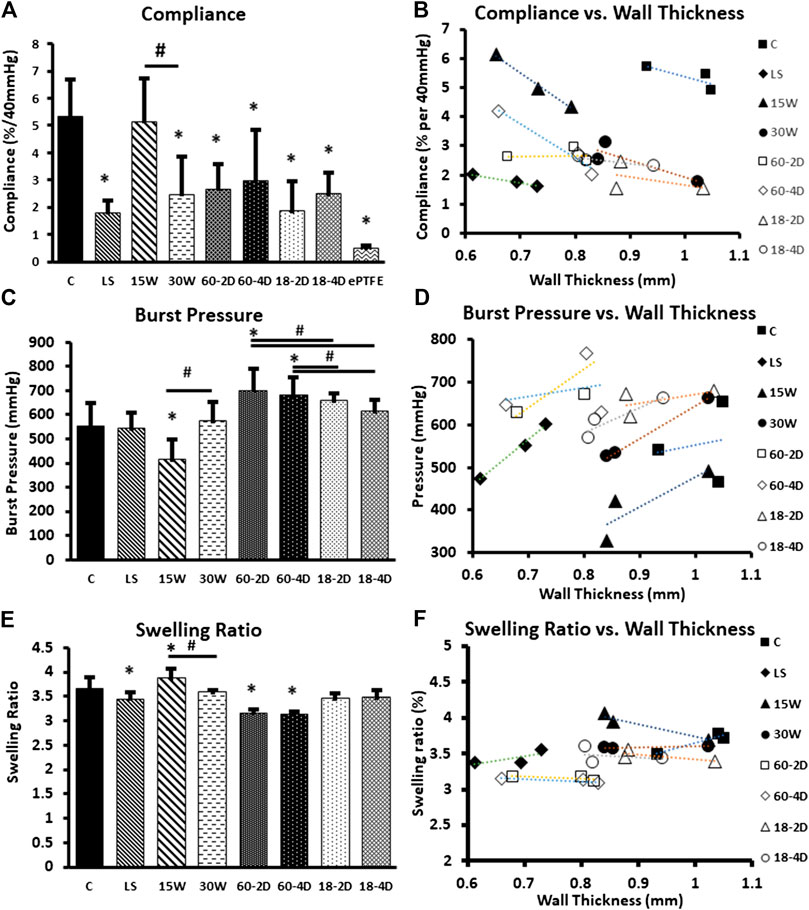
FIGURE 4. Bulk properties of the samples. (A) Compliance of each group. (B) Compliance of each group plotted against their respective wall thickness. Average values of compliance and wall thickness of the internal replicates used to plot the graph. (C) Burst pressure of each group. (D) Burst pressure of each group plotted against their respective wall thickness. Average values of burst pressure and wall thickness of the internal replicates used to plot the graph. (E) Swelling ratio of each group, and (F) swelling ratio plotted with respect to the wall thickness of each group. *Indicates p < 0.05 with respect to control group. # Indicates p < 0.05 between the groups being compared. n = 9 for all samples.
Phosphate content was quantified for the samples to verify the crosslinking density of the covalent crosslinking with STMP. There was no significant difference in phosphate content among the control, LS, 15W, 30W, 60-2D, and 18-2D (Figure 5A). On the other hand, both LS and 15 W had significantly higher phosphate content than the 18-2D and Film. FTIR was performed to identify if there were any changes in crosslinking between the groups or if there were any changes in functional groups introduced due to change in the fabrication process. Figure 5B shows FTIR data using normalized percent transmittance of the control group (C), LS, 60-2D, and 18-2D rehydrated in NaCl. All of the groups displayed peaks at similar wavenumbers, indicating there were no noticeable differences between samples in terms of functional groups. DSC was performed to further assess the degree of crosslinking. Figure 6 shows the DSC thermogram for control, 60-2D, and 18-2D. 18-2D had higher degree of crystallinity and crystallization temperature than the control group. Additional DSC data is shown in Supplementary Figure S2.
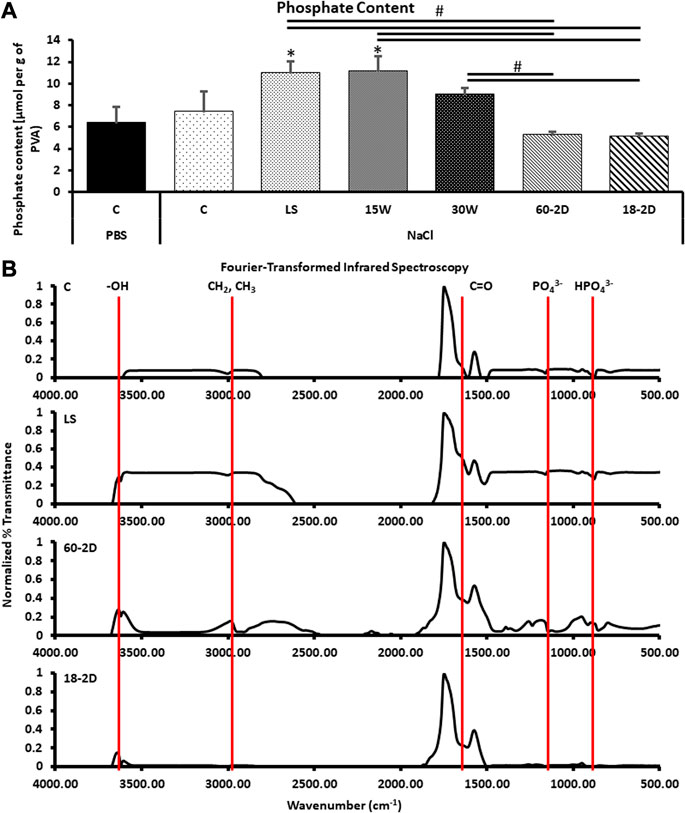
FIGURE 5. Functional groups and STMP crosslinking density in PVA films. (A) Quantification of phosphate content for the samples to characterize covalent crosslinking by STMP. *Indicates p < 0.05 between the indicated groups. n = 6 for all groups. C PBS was control sample rehydrated in NaCl solution. *Indicates p < 0.05 with respect to the control groups. #Indicates p < 0.05 between the groups being compared. (B) Fourier-transform infrared spectroscopy data. Data was normalized to PVA films. n = 3 for all samples.
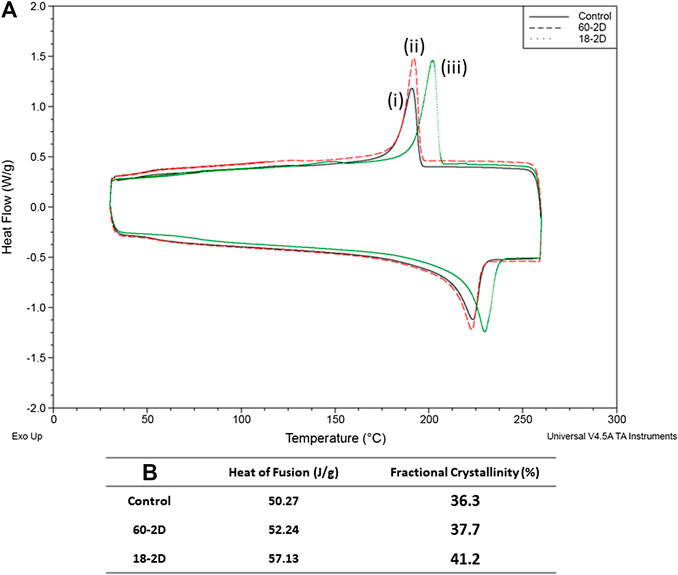
FIGURE 6. Degree or crosslinking. Differential Scanning Calorimetry (DSC) data. (A) DSC of (i) control, (ii) 60-2D, and (iii) 18-2D. Data is shown for the second heating and cooling cycle. (B) Heat of fusion and fractional crystallinity of the samples. n = 1 for all groups.
The interlayer adhesion was assessed in Figure 7. The shear strength of all of the groups were not significantly different from the control group. However, 15 W had the average shear strength of 3.75 MPa, which was more than twice higher than that of the control group (1.69 MPa). Statistical analysis between 15 W and control revealed p = 0.057. The interlayer adhesion of 15 W was also significantly higher than 30 W (p < 0.05). The 3D images of the polymers after the adhesive shear tests are shown in Figure 5B, then were used to acquire the height profile used to plot graphs in Figures 7C–J. These height profiles were then used to identify whether the polymers had high interlayer adhesion. 15 W had the highest slope, and therefore high interlayer adhesion, while other groups showed flat lines.
Supplementary Figure S3 shows graphs of the different properties measured plotted against either the wall thickness (Supplementary Figures S1B–S3A) or compliance (Supplementary Figures S3C–S3F). There was no obvious correlation between the measured properties with either the wall thickness or the compliance.
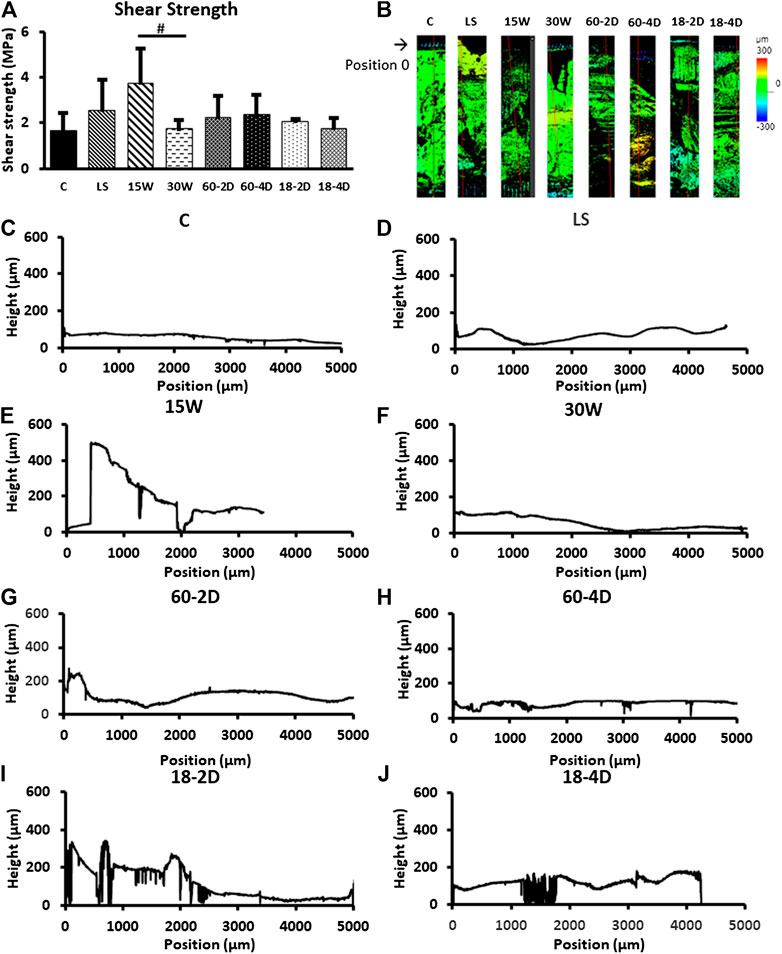
FIGURE 7. Interfacial energy. (A) The adhesive strength of groups. 15 W had p = 0.0571 with respect to the control group, and p = 0.0495 with respect to the 30 W. (B) Height map of the samples after adhesive shear test. (C)–(J) Height profile of the samples. *Indicates p < 0.05 with respect to control group. # Indicates p < 0.05 between the groups being compared. n = 3 for all samples.
PCA analysis showed that the wall thickness and compliance showed a high positive correlation (Figure 8A). Also, it showed that the compliance and burst pressure showed a high negative correlation (Figure 8B). All other components did not display significant correlation (Supplementary Figure S4).
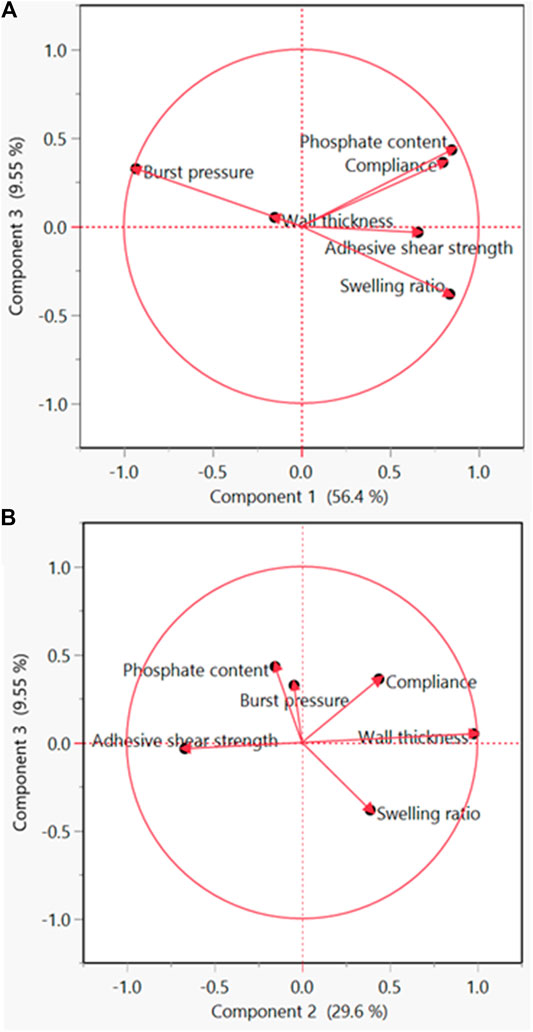
FIGURE 8. Principle component analysis (PCA) for the identification of significant components. (A) PCA plot of component 1 vs. component 3. (B) PCA plot of component 2 vs. component 3.
Figure 9 shows the additional mechanical properties of selected groups. The groups with the highest and lowest compliance were chosen for the additional analysis. There was no statistical difference between all of the groups for all conditions except for the LS for circumferential elastic modulus (Figures 9A–D). The suture retention strength of the groups also did not show any statistical difference (Figure 9E).

FIGURE 9. Additional bulk mechanical properties of the selected groups. (A) Longitudinal tensile curve. (B) Circumferential tensile curve. (C) Longitudinal ultimate tensile strength and elastic modulus for each groups. (D) Circumferential ultimate tensile stress and elastic modulus. (E) Suture retention strength. n = 6 for tensile test results, and n = 9 for suture retention strength for all groups. *Indicates p < 0.05 with respect to the control group.
Mechanical failure of vascular grafts can result in clinical catastrophe. To ensure the safety of the patients, vascular grafts were traditionally developed to have high mechanical properties matching the native blood vessel properties (Table 1 (Hansen et al., 1995; Fung, 1998; Kambric et al. 1984; Catanese III et al., 1999; Tai et al., 2000; Krejza et al., 2006; Sarkar, 2006; Konig et al., 2009; Markiewicz et al., 2017; Wise, 2011). Compliance, the elasticity of the blood vessel when exposed to internal pressure, is one of the important parameters that is being studied in vascular graft engineering to understand the current limitations of small diameter vascular grafts (Szafron, 2019; Jeong et al., 2020). There are methods to increase the compliance of a material. One of the methods is to reduce the wall thickness (Biglino, 2013; Nezarati et al., 2015; Gao, 2019). However, reducing the wall thickness can negatively affect the burst pressure (Menon, 2011; Zhu and Leis, 2012). Using vascular grafts with low burst pressure could become a critical problem for the patients with the vascular graft implants. Therefore, it is important to understand the effects different parameters have on the burst pressure when increasing the compliance of the vascular grafts. Two parameters that have been found to affect the mechanical properties of hydrogels are interlayer adhesion and crosslinking density (Leone, 2010).
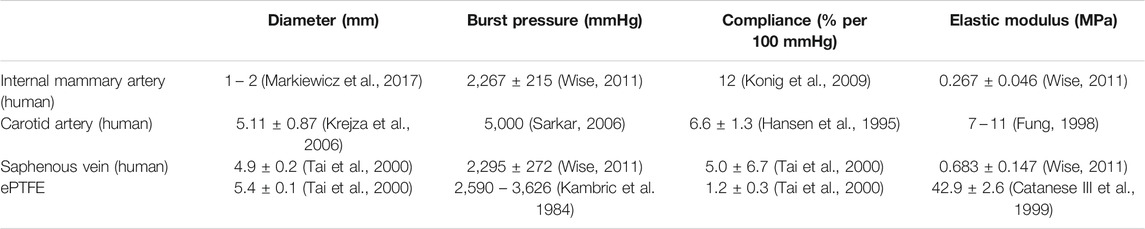
TABLE 1. Reported values of mechanical properties of native blood vessels and expanded polytetrafluoroethylene (ePTFE).
Crosslinking of PVA has been extensively studied. A well-established physical crosslinking method of PVA is freeze-thawing. PVA grafts with freeze-thawing crosslinking are mainly fabricated by bulk molding fabrication. PVA hydrogels crosslinked using freeze-thawing have been shown to have tailored mechanical properties by varying the number of freeze-thawing cycles (Peppas, 1975; Gupta et al., 2012; Holloway et al., 2013). The freeze-thawing crosslinking of PVA involves phase separation and crystalline formation. Hydrogen bonds form in the aqueous solution of PVA. During the freezing of PVA solution, ice forms. The formation of ice induces the growth of polymer crystallinity. The growth of polymer crystallinity acts as physical crosslinking points. Subsequently, water-insoluble hydrogels are formed in the later thermal cycles. The abundant hydroxyl groups in the backbones of PVA polymer chains also provide reactive sites for hydrogen bonding for chemical crosslinking of PVA (Otsuka and Suzuki, 2009). One of the most commonly used crosslinking agent for PVA is glutaraldehyde. It reacts with hydroxyl groups to form an ester bond. Chaouat 2008) found that the hydroxyl groups on PVA can also react with STMP to crosslink PVA hydrogels by phosphoesterification. The PVA hydrogels chemically crosslinked with STMP were shown to be capable of achieving a wide range of mechanical properties by altering the fabrication parameters such as humidity and water evaporation (Cutiongco et al., 2016b). A recent study comparing the hemocompatibility of PVA hydrogels crosslinked by STMP, glutaraldehyde, and freeze-thawing found that crosslinking methods also affect the biological performance of PVA (Bates et al., 2020).
PVA vascular grafts are fabricated using dip-casting with cylindrical molds (Cutiongco et al., 2016a). Different mechanical properties of the PVA vascular grafts can be achieved by altering the number of layers and fabrication parameters. We have observed heterogeneity in transparency between the layers (Figure 2A, red arrows) in PVA vascular grafts. The observed heterogeneity can be the result of inconsistencies in crosslinking between the layers (Peacock and Calhoun, 2012). The heterogeneity can also be an indication of a weak interlayer adhesion. A potential method of overcoming the weak interlayer adhesion would be increasing the interlayer crosslinking (Yu et al., 2013). With PVA hydrogels, the interlayer crosslinking could occur by having hydrogen bonding between the residual –OH groups of the PVA layers. It was hypothesized that through increasing the interlayer adhesion, the resulting grafts can have high compliance while maintaining burst pressure. Moreover, the heterogeneity suggests that the crosslinking density can be further fine-tuned. We hypothesized that a decrease in the chemical crosslinking density will result in higher compliance while causing a decrease in burst pressure. Furthermore, we hypothesize that post-fabrication processing can affect physical crosslinking, and impact the compliance and burst pressure.
Most often, tensile measurements are made to assess the mechanical properties of the polymers (Abraham et al., 1998; Peiffer and Nielsen, 1979). Additional properties, such as residual stress, rheology, Izod impact measurement, etc. (Peiffer and Nielsen, 1979; Abraham et al., 1998), are also tested depending on the application of the polymers. For vascular grafts, burst pressure and compliance are important parameters to measure. Although PVA vascular grafts have been studied previously (Elshazly, 2004; Chaouat, 2008), the relationship between the wall thickness and burst pressure and compliance have not been characterized. Thorough characterization of the compliance and burst pressure of the grafts with different wall thickness was performed first to identify the compliance and burst pressure achieved by different wall thickness. The relationship between the wall thickness and burst pressure (Figure 2C) was expected as the structural integrity of tubes is dependent on the wall thickness (Menon, 2011; Zhu and Leis, 2012). The grafts with 6 layers displayed high compliance, but its burst pressure was only 232.7 ± 22.8 mmHg. As systolic blood pressure can rise to 220 mmHg during exercises, PVA grafts with 6 layers were deemed too weak. Grafts with 9 layers have a burst pressure of 485.5 ± 17.9 mmHg, which is at least double the systolic pressure of 220 mmHg. However, the compliance of the grafts with 9 layers was 2.6 ± 0.54% per 40 mmHg. Furthermore, compliance of the PVA grafts with more than 9 layers had compliance <2% per 40 mmHg. As shown in Table 1 (Kambric et al. 1984; Hansen et al., 1995; Fung, 1998; Catanese III et al., 1999; Tai et al., 2000; Krejza et al., 2006; Sarkar, 2006; Konig et al., 2009; Wise, 2011; Markiewicz et al., 2017) and Figure 4A, the compliances of the PVA grafts with 9 layers and ePTFE are lower than the native blood vessels. After assessing the compliance and burst pressure of the groups, the PVA vascular grafts with 9 layers was chosen for further investigation as they had the highest compliance with good burst pressure. Using the PVA grafts with 9 layers, the effect of crosslinking density and interlayer adhesion on the compliance and burst pressure were assessed.
The standard fabrication method is described in Figure 1A in detail. The crosslinking of PVA using crosslinker STMP in NaOH solution has been described in the literature numerous times (Elshazly, 2004; Chaouat, 2008; Leone, 2010; Ino et al., 2013). In brief, the -OH groups on PVA loses the hydrogen atom in the highly basic solution created by NaOH, and becomes reactive. This reactive site then reacts with the STMP. Subsequently, another PVA molecule reacts with the STMP and results in a crosslinked polymer. This process can be modified via changing the PVA concentration, STMP concentration, NaOH concentration, temperature, humidity, and waiting time between the dips (Chaouat, 2008). The fabrication conditions were varied to achieve different level of interlayer adhesion and crosslinking density.
The interlayer adhesion occurs when there are crosslinks that spans multiple layers of polymers. The mechanical properties of PVA vascular grafts can be affected by the interlayer adhesion as PVA graft fabrication method is a dip-casting process with waiting periods between dips. The dip-casting process is a type of polymer fabrication method where the mold is dipped multiple times to achieve the desired thickness (Abraham et al., 1998; Nautiyal et al., 2017; Srinivasan et al. 2020). Due to the process requiring crosslinking of the layers after each dip, the drying condition of the layers is important to prevent delamination for this fabrication method (Abraham et al., 1998). One of the easiest parameters to control for dip-casting process is the waiting time between the dips. Waiting time is required to allow for the chemical reactions that crosslinks PVA molecules to occur (Chaouat, 2008). Shorter wait time between each dip prevents completion of the reactions, allowing for more partially crosslinked sites for each dip. These partial crosslinking sites can react with the newly applied layer, increasing the interlayer adhesion (Yu et al., 2013). Therefore, the drying time should be kept short for the subsequent layers to be applied before crosslinking of the previous layer is completed to increase the interlayer adhesion.
For the control, the waiting time between the dips is 15 min in the first 4 dips, 25 min in the fifth to seventh dips, and 30 min for the eighth dip and beyond (Figure 1A). Instead of increasing the dipping time throughout the fabrication process, the waiting times between dips were kept consistent for the groups comparing the effects of the interlayer adhesion. 15 W was fabricated with a flat 15-min waiting time for all waiting steps instead of the standard protocol. 30 W was made using a flat 30-min waiting time for all waiting steps. The waiting times for 15 and 30 W were kept constant so that interlayer adhesion throughout the grafts would remain consistent. There are many methods to make measurements to assess the adhesion between layers (Awaja et al., 2009). The most standard method of measuring the interlayer adhesion is the adhesive shear test (which is also known as lap shear test) (Awaja et al., 2009).
The crosslinking density and concentration of STMP are positively correlated to the stiffness of the material (Leone, 2010). As decrease in crosslinking agent can result in lowered crosslinking density, STMP concentration was decreased for one of the experimental groups (LS samples). Also, the concentration of NaOH was reported to be positively related to the crosslinking density (Lack, 2004). Therefore, 15% w/v NaOH concentration was explored to achieve decreased crosslinking density to assess the effect of low crosslinking density. However, the graft could not be fabricated using the low concentration of NaOH (Supplementary Table S1). We also speculate post-fabrication thermal drying may induce additional physical crosslinking, resulting in higher crosslinking density. To create the PVA grafts with higher crosslinking density, additional groups (60-2D, 60-4D, 18-2D, and 18-4D) were made with extra drying step post-fabrication to encourage additional physical crosslinking.
As shown in Figure 3B, 15 W had significantly thinner wall than the control group. However, the wall thickness of 30 W was not significantly different from the control group. While the 15 and 30 W had consistent waiting times between the dips, control group had 15-min waiting time for the first four dips, 25-min waiting time for the 5th–7th dips, then 30-min waiting time for 8th or more dips. The data showed that the longer waiting time is needed and waiting time of the outer layer was related to wall thickness in the outer layer. When the waiting time of the outer later was decreased in 15 W, the thickness was decreased, compared to 30 W and control. However, it appears that increasing the early dip waiting time did not significantly affect the thickness.
15 W had higher adhesive shear strength than all of the other groups. While not statistically significant against the control group, 15 W showed a trend toward significantly higher adhesive shear strength than the control group (p = 0.057), and a significantly higher adhesive shear strength than 30 W (p < 0.05). This indicates that the 15 W had higher adhesion between layers than the other groups, which is in agreement with the height profiles shown in Figures 5C–J. As 15 and 30 W were fabricated with a flat 15 and 30-min waiting time, respectively, the significant higher shear strength in 15 W further demonstrated that the shorter waiting time would increase the interlayer adhesive strength. This could be the result of a larger quantity of partial crosslinking sites available for a shorter waiting time in 15 W. The partial crosslinking sites can then work as a bridge between the layers to allow for a larger number of interpenetrating crosslinks (Awaja et al., 2009). With longer waiting time between layers, the partial crosslinking sites can become crosslinked. This can reduce the crosslinking between the layers. Except for 15 and 30W, all of the samples had variable drying time. For the control group, LS, 60-2D, 60-4D, 18-2D, and 18-4D, the last two layers were applied with 30-min waiting intervals. This could be the reason these groups did not show statistical difference in the adhesive shear strength.
15 W had a higher swelling ratio compared to the control group. The partial crosslinking sites could also attribute to the higher swelling ratio. This partial crosslinking sites may have resulted in lower crosslinking density, which could account for the lower burst pressure. However, it is also important to note that the wall thickness of 15 W was significantly thinner than the control, indicating that the decrease in burst pressure could also be due to the thinner walls (Menon, 2011). When the burst pressures were normalized to the wall thickness of the samples, 15 W did not show significant difference from the control group (Supplementary Figure S1). This suggests that the affect from partial crosslinking on burst pressure was less significant than the influence from wall thickness.
The crosslinking of PVA was achieved by phosphoesterification, thus the content of phosphate also reflects the number of chemical crosslinking bonds formed during the fabrication. With lower concentration of STMP added in the reaction solution, it was expected that the resulting PVA grafts would display lower concentration of phosphate to indicate a lower chemical crosslinking density. However, LS showed lower phosphate content than the control group (Supplementary Figure S1). The lower phosphate content in conjunction with the lower swelling ratio, LS displayed higher crosslinking density compared to the control group. This is in agreement with the burst pressure normalized to wall thickness (Supplementary Figure S1). The burst pressure should increase with increase in crosslinking density. A potential explanation for higher crosslinking density is the presence of tighter network due to the multifunctional nature of STMP. As phosphate groups from STMP has 4 potential reactive sites, more than two reactions can occur on a single phosphate group. When less phosphate groups are available, hydroxyl groups have less phosphate groups to react with. Phosphate groups become the limiting reagents, causing multiple phosphoesterification to occur on one phosphate. This results in tighter mesh formation, and therefore tighter crosslinking density. For the PVA crosslinked in abundance of phosphate, more phosphate could react with the hydroxyl groups. The abundance could result in phosphate population that did not react with multiple hydroxyl groups in the polymer network. These unbound phosphate groups then get washed away during the rehydration and storage, effectively resulted in a lower phosphate content in the hydrogels.
The difference in the crosslinking density among 15W, 30 W and the control, observed from the phosphate assay (Figure 5A), indicated that the waiting time in between different layers affected the chemical crosslinking density. 15 W had a significantly higher swelling ratio and significantly lower wall thickness than 30 W. Comparing the mechanical properties of 15 and 30W, 30 W had significantly lower compliance and significantly higher burst pressure. With a decrease in waiting time from 30 to 15 min between each dip, more interpenetrating crosslink occurs. The interpenetrating crosslinks contribute to the observation of increased chemical crosslinking density observed from the phosphate assay. Similar to LS, 30 W had longer waiting time between each dip, allowing more time for polymer chain to get aligned for hydrogen bonding, which may have contributed to the decreased compliance and increased burst pressure.
Although the chemical crosslinking density should not change during the additional drying due to extensive washing steps, physical crosslinking may have occurred during 60°C drying. After the STMP crosslinking of PVA, residual hydroxyl groups remain available for hydrogen bonding formation. PVA polymer chains display increased mobility at high temperature. The mobile polymer chains have a higher chance to get aligned, bringing the hydroxyl groups close to form hydrogen bonding. This process was achieved through subjecting the fabricated control groups to additional drying.
The extra-drying groups were 60-2D, 60-4D, 18-2D, and 18-4D. 60-2WD and 60-4WD are the two groups that were dried in the 60°C for 2 and 4 weeks, respectively. These two groups had thinner wall thickness than the control groups. 18-2D and 18-4D were the two groups that were dried in the 18°C for 2 and 4 weeks, respectively. The wall thickness of these groups did not differ from that of the control group. The two groups dried at 60°C had lower swelling ratio than the control group regardless of the length of drying, indicating that they may have higher crosslinking density than the control group. Drying in the 18°C did not alter the swelling ratio of the samples, suggesting that the crosslinking density of the groups dried post-fabrication at 18°C was not different from that of the control group. The compliance of the 18-2D and 18-4D were comparable to the compliance of 60-2D and 60-4D. All of the post-fabrication drying groups had lower compliance than the control group. 18-2D and 18-4D had similar burst pressure compared to the control group. However, 60-2D and 60-4D had higher burst pressure than the control group. There was no difference observed based on the length of extra drying (2 vs. 4 weeks) for both temperatures. This suggests that the additional physical crosslinking occurred during dehydration rather than the storage.
As the length of drying (2 vs. 4 weeks) did not affect the performance of the grafts, further analysis was performed using 18-2D and 60-2D only. According to the phosphate quantification assay (Figure 5A), 60-2D and 18-2D did not display any difference in total phosphate content within the polymers. FTIR did not also display any difference between the control group and the extra-drying groups (Figure 5B). DSC analysis was performed in addition to assess the degree of crystallinity and overall crosslinking (Figure 6 and Supplementary Figure S2). The DSC results suggested that 18-2D had higher crystallinity and crystallization temperature than the control group, while 60-2D showed a slightly higher fractional crystallinity than the control group. The higher crystallinity, suggesting a higher physical crosslinking, may explain the lower compliance and slight increase in the burst pressure from the post-fabrication drying step. However, while physical crosslinking density can be used to influence compliance and burst pressure, its effect might not be as significant as chemical crosslinking.
The group that had the highest compliance (15W) and the group that had the lowest compliance (LS) were used to perform additional mechanical property analysis. Both the longitudinal and circumferential tensile data (Figures 9A–D) agreed with the compliance data in that the 15W and control group did not show a statistical difference in mechanical behavior. LS had lower compliance than the control group, therefore it was as expected that the group is less elastic than the control group (Figure 9D). Suture retention was not affected by the different fabrication conditions. To reiterate, 15W had higher interlayer adhesion but lower crosslinking density than the control group. Therefore, it could be that the increased interlayer adhesion can also increase the suture retention strength. LS also had a thinner wall thickness than the control group. LS had not significantly different interlayer adhesion and higher crosslinking density compared to the control group. This could indicate that higher crosslinking density can increase the suture retention strength as well.
We investigated the effects of interlayer adhesion and crosslinking density on the compliance of PVA vascular grafts. We found that the higher crosslinking density resulted in higher burst pressure, but resulted in lower compliance. Also, we have found that the increase in interlayer adhesion could increase the burst pressure without sacrificing the compliance. While the findings in this article sheds light on how to improve the performance of the PVA vascular grafts, there are still shortcomings of the PVA crosslinking method utilized here. PVA-STMP crosslinking method using dip-casting is a slow process. This limits the shapes, and therefore applications, of the grafts such fabrication method can produce. Furthermore, PVA tubular grafts are prone to kinking. Kinking could potentially affect the blood flow when the graft is implanted in the patients, resulting in negative clinical outcome. Further research should be performed to improve the fabrication process of PVA-STMP vascular grafts to increase the potential application. Also, the kink resistance of the grafts should be improved to result in better clinical outcome.
The original contributions presented in the study are included in the article/Supplementary Material, further inquiries can be directed to the corresponding author.
YJ performed the experiments, performed data analysis, and contributed to writing and editing of the article. EY performed data analysis, and contributed to writing and editing of the article. TM performed data analysis, and contributed to writing and editing of the paper. Lastly, YY performed data analysis, and contributed to writing and editing of the article.
The authors would like to thank the National Institute of Health (NIH RO1 HL130274-01A1), NSERC-CREATE Training in Global Biomedical Technology Research and Innovation at the University of Waterloo (CREATE-509950-2018), NSERC Canada Discovery Grant (RGPIN-2016-04043), John R. Evans Leaders Fund - Canada Foundation for Innovation (35573), and Mitacs Research Training Award for Financial Support.
The authors declare that the research was conducted in the absence of any commercial or financial relationships that could be construed as a potential conflict of interest.
The authors would like to thank Clyde Overby for editing the work.
The Supplementary Material for this article can be found online at: https://www.frontiersin.org/articles/10.3389/fmats.2020.595295/full#supplementary-material.
Abbott, W. M., Megerman, J., Hasson, J. E., L'Italien, G., and Warnock, D. F. (1987). Effect of compliance mismatch on vascular graft patency. J. Vasc. Surg. 5 (2), 376–382. doi:10.1016/0741-5214(87)90148-0
Abraham, G., Frontini, P., and Cuadrado, T. (1998). Molding of biomedical segmented polyurethane delamination events and stretching behavior. J. Appl. Polym. Sci. 69 (11), 2159–2167. doi:10.1002/(sici)1097-4628(19980912)69:11<2159::aid-app7>3.0.co;2-f
Ahmed, A. A., Stella, G., Leinweber, P., Freese, D., and Kühn, O. (2019). Infrared spectroscopic characterization of phosphate binding at the goethite–water interface. Phys. Chem. Chem. Phys. 21 (8), 4421–4434. doi:10.26434/chemrxiv.7370048.v2
Awaja, F., Gilbert, M., Kelly, G., Fox, B., and Pigram, P. J. (2009). Adhesion of polymers. Prog. Polym. Sci. 34 (9), 948–968. doi:10.1016/j.progpolymsci.2009.04.007
Bates, N. M., Maugis, D., and Barquins, M. (2020). Evaluation of the effect of crosslinking method of poly (vinyl alcohol) hydrogels on thrombogenicity. Cardiovasc. Eng. Technol. 12, 1–8. doi:10.1007/978-1-4899-3454-3_5
Biglino, G. (2013). Rapid prototyping compliant arterial phantoms for in-vitro studies and device testing. J. Cardiovasc. Magn. Reson. 15 (1), 2. doi:10.1007/978-1-4899-3454-3
Catanese, J., Gilbert, M., and Kelly, G. (1999). Mechanical properties of medical grade expanded polytetrafluoroethylene: the effects of internodal distance, density, and displacement rate. Jpn. Soc. Biomater. 48, 187–192. doi:10.1007/978-1-4899-3454-3_7
Chaouat, M. (2008). A novel cross‐linked poly (vinyl alcohol)(PVA) for vascular grafts. Adv. Funct. Mater. 18 (19), 2855–2861. doi:10.1016/j.polymer.2016.05.043
Chen, H., Stella, G., Leinweber, P., and Freese, D. (2016). Thermo-and water-induced shape memory poly (vinyl alcohol) supramolecular networks crosslinked by self-complementary quadruple hydrogen bonding. Polym. Chem. 7 (43), 6637–6644. doi:10.1039/c6py01302c
Court, R., Sutcliffe, M., and Tavakoli, S. (2001). Ageing of adhesively bonded joints—fracture and failure analysis using video imaging techniques. Int. J. Adhesion Adhes. 21 (6), 455–463. doi:10.1002/macp.201100149
Cutiongco, M. F. A., Frontini, P., and Cuadrado, T., (2015). Composite scaffold of poly (vinyl alcohol) and interfacial polyelectrolyte complexation fibers for controlled biomolecule delivery. Front. Bioeng. Biotechnol. 3, 3. doi:10.1021/acsmacrolett.7b00275.s001
Cutiongco, M. F., Sutcliffe, M., Chen, H., and Stella, G. (2016a). Planar and tubular patterning of micro and nano-topographies on poly (vinyl alcohol) hydrogel for improved endothelial cell responses. Biomaterials 84, 184–195. doi:10.1021/acsami.6b11476.s001
Cutiongco, M. F., Gilbert, M., and Kelly, G. (2016b). Submillimeter diameter poly (vinyl alcohol) vascular graft patency in rabbit model. Frontiers in bioengineering and biotechnology. 4, 44. doi:10.1021/acsami.6b11476.s003
Elshazly, T. H. (2004). Characterization of PVA hydrogels with regards to vascular graft development. Georgia: Georgia Institute of Technology.
Gao, J. (2019). Effect of wall structures on mechanical properties of small caliber PHBHHx vascular grafts. Fibers Polym. 20 (11), 2261–2267. doi:10.1021/acsami.6b11476.s002
Gupta, S., Goswami, S., and Sinha, A. (2012). A combined effect of freeze–haw cycles and polymer concentration on the structure and mechanical properties of transparent PVA gels. Biomed. Mater. 7 (1), 015006. doi:10.1021/acsami.6b11476.s004
Hansen, F., Kelly, G., Fox, B., and Pigram, P. J. (1995). Diameter and compliance in the human common carotid artery—variations with age and sex. Ultrasound Med. Biol. 21 (1), 1–9. doi:10.1021/acsami.6b11476.s005
Holloway, J. L., Lowman, A. M., and Palmese, G. R. (2013). The role of crystallization and phase separation in the formation of physically cross-linked PVA hydrogels. Soft Matter. 9 (3), 826–833. doi:10.1039/c2sm26763b
Ino, J. M., Fox, B., and Pigram, P. J. (2013). Evaluation of hemocompatibility and endothelialization of hybrid poly (vinyl alcohol)(PVA)/gelatin polymer films. J. Biomed. Mater. Res. B Appl. Biomater. 101 (8), 1549–1559. doi:10.1021/acs.iecr.9b01796.s001
Jeong, Y., Yao, Y., and Yim, E. K. (2020). Current understanding of intimal hyperplasia and effect of compliance in synthetic small diameter vascular grafts. Biomater. Sci. 24, 93–124. doi:10.1021/acs.macromol.6b00584.s001
Kim, H., Han, S., and Seo, Y. (2020). Novel dual curing process for a stereolithographically printed Part Triggers A remarkably improved interlayer adhesion and excellent mechanical properties. Langmuir. 14, 33–39. doi:10.1021/acs.jpcb.6b06009.s001
Konig, G., Gupta, S., Goswami, S., and Sinha, A. (2009). Mechanical properties of completely autologous human tissue engineered blood vessels compared to human saphenous vein and mammary artery. Biomaterials 30 (8), 1542–1550. doi:10.1016/j.biomaterials.2008.11.011
Krejza, J., Chen, H., Stella, G., Leinweber, P., and Freese, D. (2006). Carotid artery diameter in men and women and the relation to body and neck size. Stroke 37 (4), 1103–1105. doi:10.4149/bll_2019_147
Lack, S., (2004). Hydrogels based on pullulan crosslinked with sodium trimetaphosphate (STMP): rheological study. Polym. Bull. 52 (6), 429–436. doi:10.1111/j.1476-5381.2011.01264.x
Leone, G., (2010). PVA/STMP based hydrogels as potential substitutes of human vitreous. J. Mater. Sci. Mater. Med. 21 (8), 2491–2500. doi:10.1136/heartjnl-2019-bcs.189
Markiewicz, M. R., Ord, R., and Fernandes, R. P. (2017). Local and regional flap reconstruction of maxillofacial defects. Maxillofac. Surg. 29, 616–635. doi:10.1016/b978-0-7020-6056-4.00044-7
Menon, E. S. (2011). “Chapter 7—Pipe strength and wall thickness,” in Pipeline planning and construction field manual. Editor E. S. Menon (Houston, TX: Gulf Professional Publishing), 105–121.
Nautiyal, P., Boesl, B., and Agarwal, A. (2017). Harnessing three dimensional anatomy of graphene foam to induce superior damping in hierarchical polyimide nanostructures. Small. 13 (10), 1603473. doi:10.1002/smll.201603473
Nezarati, R. M., Boesl, B., and Agarwal, A. (2015). Electrospun vascular grafts with improved compliance matching to native vessels. J. Biomed. Mater. Res. B Appl. Biomater. 103 (2), 313–323. doi:10.1021/acsami.6b06024.s001
Otsuka, E., and Suzuki, A. (2009). A simple method to obtain a swollen PVA gel crosslinked by hydrogen bonds. J. Appl. Polym. Sci. 114 (1), 10–16. doi:10.1021/jacs.8b04119.s001
Peacock, A. J., and Calhoun, A. (2012). Polymer chemistry: properties and application. Berlin: Carl Hanser Verlag GmbH Co KG.
Peiffer, D. G., and Nielsen, L. E. (1979). Preparation and mechanical properties of thick interlayer composites. J. Appl. Polym. Sci. 23 (8), 2253–2264. doi:10.1021/acsami.9b19656.s001
Peppas, N. A., Stella, G., Leinweber, P., and Freese, D. (2006). Hydrogels in biology and medicine: from molecular principles to bionanotechnology. Adv. Mater. 18 (11), 1345–1360. doi:10.1021/acs.langmuir.6b01864.s002
Peppas, N. A., and Merrill, E. W. (1976). Differential scanning calorimetry of crystallized PVA hydrogels. J. Appl. Polym. Sci. 20 (6), 1457–1465. doi:10.1021/acsbiomaterials.6b00139.s003
Peppas, N. A. (1975). Turbidimetric studies of aqueous poly (vinyl alcohol) solutions. Makromol. Chem.: Macromol. Chem. Phys. 176 (11), 3433–3440. doi:10.1021/acsbiomaterials.6b00139.s001
Pohan, G., Lowman, A. M., and Palmese, G. R. (2020). Effect of ethylene oxide sterilization on polyvinyl alcohol hydrogel compared with gamma radiation. Tissue Eng. A. 6, 1077–1090. doi:10.1089/ten.tea.2020.0002
Pohan, G., Stella, G., and Leinweber, P. (2019). Luminal plasma treatment for small diameter polyvinyl alcohol tubular scaffolds. Front. Bioeng. Biotechnol. 7, 117. doi:10.1016/0146-5724(85)90031-7
Puy, N. M. B. C., McCarty, O., and Hinds, M. (2019). “Thrombogenicity of poly (Vinyl) alcohol hydrogels is dependent on the crosslinking agent,” in 42nd Society for biomaterials annual meeting and ExpositionThe pinnacle of biomaterials innovation and excellence. London: Society for Biomaterials.
Sarkar, S. (2006). The mechanical properties of infrainguinal vascular bypass grafts: their role in influencing patency. Eur. J. Vasc. Endovasc. Surg. 31 (6), 627–636. doi:10.1063/1.5018937
Srinivasan, E., Vanchinathan, T., and Siva Kumar, G. (2020). Fabrication of microcontroller based dip-casting for thin films depositions. Berlin: Springer.
Szafron, J. M. (2019). Optimization of tissue-engineered vascular graft design using computational modeling. Tissue Eng. C Methods 25 (10), 561–570. doi:10.1016/s0969-806x(01)00427-3
Tai, N., Merrill, E. W., and Szafron, J. M. (2000). Compliance properties of conduits used in vascular reconstruction. Br. J. Surg. 87 (11), 1516–1524. doi:10.3403/00343577u
Wise, S. G. (2011). A multilayered synthetic human elastin/polycaprolactone hybrid vascular graft with tailored mechanical properties. Acta Biomaterialia. 7 (1), 295–303. doi:10.1016/j.actbio.2010.11.009
Xiong, D.-S. (2008). Synthesis and properties of physically crosslinked poly (vinyl alcohol) hydrogels. J. China Univ. Min. Technol. 18 (2), 271–274. doi:10.1016/j.actbio.2010.07.022
Yao, Y. (2020). Fucoidan functionalization on poly (vinyl alcohol) hydrogels for improved endothelialization and hemocompatibility. Biomaterials 18 (2), 271–274. doi:10.1016/j.jmbbm.2012.02.026
Yu, L. Y., Daugaard, A. E., and Skov, A. L. (2013). Adhesion between polydimethylsiloxane layers by crosslinking. Adv. Sci. Technol. Trans. Tech. Publ. 17, 23. doi:10.1177/0885328220907775
Keywords: vascular graft, compliance, interlayer adhesion, crosslinking density, poly(vinyl alcohol), dip-casting
Citation: Jeong Y, Yao Y, Mekonnen TH and Yim EKF (2021) Changing Compliance of Poly(Vinyl Alcohol) Tubular Scaffold for Vascular Graft Applications Through Modifying Interlayer Adhesion and Crosslinking Density. Front. Mater. 7:595295. doi: 10.3389/fmats.2020.595295
Received: 15 August 2020; Accepted: 01 December 2020;
Published: 14 January 2021.
Edited by:
Patricia Krawczak, IMT Lille Douai, FranceReviewed by:
Guoping Guan, Donghua University, ChinaCopyright © 2021 Jeong, Yao, Mekonnen and Yim. This is an open-access article distributed under the terms of the Creative Commons Attribution License (CC BY). The use, distribution or reproduction in other forums is permitted, provided the original author(s) and the copyright owner(s) are credited and that the original publication in this journal is cited, in accordance with accepted academic practice. No use, distribution or reproduction is permitted which does not comply with these terms.
*Correspondence: Evelyn K. F. Yim, ZXlpbUB1d2F0ZXJsb28uY2E=
Disclaimer: All claims expressed in this article are solely those of the authors and do not necessarily represent those of their affiliated organizations, or those of the publisher, the editors and the reviewers. Any product that may be evaluated in this article or claim that may be made by its manufacturer is not guaranteed or endorsed by the publisher.
Research integrity at Frontiers
Learn more about the work of our research integrity team to safeguard the quality of each article we publish.