 Robert Fleishel
 Cole Cauthen2
 J. Brian Jordon
 Stephanie TerMaath
95% of researchers rate our articles as excellent or good
Learn more about the work of our research integrity team to safeguard the quality of each article we publish.
Find out more
ORIGINAL RESEARCH article
Front. Mater. , 11 February 2021
Sec. Mechanics of Materials
Volume 7 - 2020 | https://doi.org/10.3389/fmats.2020.590747
This article is part of the Research Topic Women in Science: Materials View all 34 articles
It is well established that fatigue crack nucleation and small crack growth in high strength aluminum alloys are highly influenced by the surrounding microstructure including grain boundaries, texture, inclusion barriers, among other factors. As such, specific and targeted experimental and computational methods are necessary to accurately capture and predict the discrete behavior of microstructurally small fatigue cracks. In this study, surface fatigue crack nucleation and microstructurally small crack growth in high strength aluminum alloys, commonly used in aerospace applications, are evaluated through a holistic approach encompassing fatigue testing, crack measurement, and computational prediction of crack growth rates. During fatigue testing, crack shapes and growth are quantified using a novel surface replication technique that is applied to investigate crack nucleation, as well as to collect validation data that includes an accurate description of crack shape during crack propagation, a challenging and essential component in predicting crack growth. Computational simulation of fatigue crack growth in non-straight, complex surface crack arrays typically requires high fidelity analysis using computationally expensive methods to account for the mathematical and geometrical complexities inherent in the solution. A dislocation distribution based technique has been previously demonstrated to rapidly and accurately predict the stress intensity factors for through cracks of complex shape. This method was expanded and investigated as an approach for rapidly predicting the crack growth rate of kinked and tortuous surface crack arrays, using the crack configuration and bulk material properties as inputs. To investigate the accuracy and effectiveness of this characterization approach, surface crack growth in AA7075-T7351 was experimentally analyzed and modeled under high cycle and low cycle fatigue conditions. This comprehensive approach was determined to be an expedient and applicable method for characterizing and evaluating the nucleation and crack growth rate of non-planar microstructurally small and short crack configurations.
Predicting the crack growth rate and direction in the early stages of crack growth is challenging due to several phenomena. The rate and direction of crack growth immediately following initiation is heavily dependent on microstructure (Hussain 1997; Stephens et al., 2001), and both can change rapidly as a crack grows across grain boundaries, through imperfections, and around inclusions. This behavior can cause microstructurally small cracks to kink or for several smaller cracks to form, later coalescing into a single dominant crack, in the early stages of crack growth. To characterize crack nucleation and to predict the growth of small cracks requires accurate correlation of crack shape with crack growth rate and a computational approach that accounts for complex crack shapes due to direction changes and crack branching. The objective of this research is to evaluate the accuracy and efficiency of a comprehensive approach to characterizing crack nucleation and predicting the crack growth rate of small cracks using a novel surface replication technique to obtain high resolution crack shapes and a computational predictive capability for the propagation of such non-straight cracks. The research was performed through experimental and computational components.
Recent analytical modeling of microstructurally small surface cracks has been successfully performed (Cauthen et al., 2017), in which a strip yield model (Daniewicz and Aveline, 2000) and CTOD (crack tip opening displacement) method were applied for a straight surface fatigue crack. An analytical multistage fatigue model, also assuming a straight crack, has been used to predict microstructurally small crack growth of aluminum alloys (McDowell et al., 2003; Xue et al., 2007; Bernard et al., 2013; McCullough et al., 2019). Research has also been performed to explore the non-straight nature of microcracks, including the effects of grain and crystal orientations (Herbig et al., 2011; Castelluccio and McDowell, 2012; Castelluccio and McDowell, 2016; Wilson et al., 2018). While many methods are available for predicting crack growth that account for both microstructure and crack shape using high fidelity modeling, including finite element methods (Wilson and Dunne, 2019), boundary element methods (Sun and Ma, 1997), and peridynamics (Silling and Abe, 2014), these methods require explicit modeling of the microstructure and significant computational time for a single analysis. The need to know the exact microstructure present around the crack tip makes applying such methods to existing crack configurations, especially in time critical situations such as during an inspection to determine remaining life, difficult.
Experimental approaches for quantification of nucleation and fatigue crack growth mechanisms in metals are well documented. Some methods employ micronotches where the initiation event can be readily located and observed. However this method does limit the observation of naturally occurring cracks where the initiation mechanisms which come from microstructural features or defects, such as intermetallic particles and persistent slip bands (PSBs) can be quantified (Gall et al., 1999; Xue et al., 2007; Ma et al., 2019; Zerbst et al., 2019; Dai et al., 2020). As such, without knowing the location of where the fatigue crack initiated, taking in-situ measurements without the use of a micronotch is improbable. An alternate approach that allows for naturally occurring fatigue cracks to initiate from microstructural features and/or defects is the surface replica approach. The main idea of the surface replica technique is to take intermittent surface replicas of the fatigue specimen over the lifetime of the test. Once the test is complete, analysis of the surface replicas can be examined in reverse order since the fatigue crack(s) that lead to ultimate fracture are the largest and easy to identify under low magnification and tracking them is straightforward. A relatively new technique for taking surface replicas uses a fast drying two-part silicon rubber compound that does not experience shrinkage compared to the more traditional acetate tape method (Newman et al., 1994). The procedure to make the surface replicas using the fast drying two-part silicon rubber compound, commercially known as Repliset, was first demonstrated by Newman et al. (2009). To demonstrate the use of fast drying two-part silicon rubber compound on quantifying fatigue mechanisms, previous work (Jordon et al., 2012) showed that the method could be used to quantify the fatigue crack nucleation stage and small crack growth rates in a high strength aluminum alloy. While the fast drying two-part silicon rubber replica method is not ideal for directly measuring subsurface crack growth, it has been used to further understand the mechanisms of surface dominated crack nucleation and growth from naturally occurring cracks. Recently, other metals have been examined using the fast drying two-part silicon rubber replica method including titanium (Hu et al., 2019; Zhu et al., 2019), magnesium alloys (Bernard et al., 2013; Cauthen et al., 2017), stainless steel (Deng et al., 2016), and nickel based super alloys (Deng et al., 2015; Qin et al., 2015; Deng et al., 2016; Zhu et al., 2016; Ye et al., 2017; Zhu et al., 2018), where these studies explored the effects of variation in grain size, maximum stress, and stress ratios (R values) on fatigue crack growth behavior. In addition, the fast drying two-part silicon rubber replica method has also been employed on a range of specimen geometries from standard notched specimen types (Bernard et al., 2013; Cauthen et al., 2017; Zhu et al., 2018), to laser created micro notches (Qin et al., 2015; Zhu et al., 2019), and aerospace components (Newman et al., 2009; Altıntaş and Güngör, 2013). The present study focuses on using the novel fast drying two-part silicon rubber replica method to quantify the fatigue crack nucleation and microstructurally small crack growth mechanisms of AA7075-T7351. In particular, the use of the surface replica approach provides direct and high resolution observation of both the surface crack initiation event and the subsequent propagation of small cracks where the crack kinking can be directly quantified. One of the advantages of this experimental method is the opportunity to directly correlate crack growth to sources of crack initiation that are also confirmed under high resolution scanning electron microcopy. As such, to the best of the authors’ knowledge, this is the first investigation to quantify surface crack nucleation that is directly linked to microstructurally small fatigue crack growth in AA7075-T7351 using the two-part silicon rubber replica method.
Using these measurements, the fatigue crack growth rates (FCGR) are numerically determined and compared to the experimental results to validate a fatigue crack growth model using a dislocation distribution based technique (DDT). DDT has been previously demonstrated to rapidly and accurately predict the stress intensity factors for a variety of problems (Lardner 1974; Barber 1992; Hills et al., 1996), including long, through crack arrays of complex shape (TerMaath et al., 2006; Yavuz et al., 2006). Dislocation distributions have also been used to model fatigue crack growth behavior (Yavuz et al., 2020). This method was expanded to predict the fatigue crack growth rate (FCGR) of short, surface cracks. To develop a rapid prediction capability for predicting the fatigue crack growth rate (FCGR) in kinked and tortuous surface crack arrays, a DDT was expanded to include short, surface crack analysis using the crack configuration and bulk material properties as inputs. While a goal of this research was to evaluate the DDT using experimental data that was correlated to the replica data, this method was chosen because it has been demonstrated for large arrays of cracks of complex shape and is robust as cracks grow near each other and coalesce, an important feature for future development and applicability to real world structures. FCGR prediction is achieved by combining a method for calculating the stress intensity factor (SIF, designated as K for linear elastic behavior) of complex shaped cracks (TerMaath, 2001) with empirical SIF based crack growth models (Paris, 1961) and geometric factors to account for surface crack depth (Raju and Newman, 1979). The use of a geometric factor vs. a strip-yield model to account for surface cracking reduces the complexity of the analysis and is less computationally expensive, an important consideration for future development for large arrays of surface cracks. The use of bulk material crack growth data enables this model to be applicable without specialized data collection or knowledge of the exact microstructure surrounding the crack due to the fact that K-based experimental crack growth data is more commonly available than CTOD experimental data. This model is explored for its applicability to determine the FCGR of small cracks in non-straight configurations, with the change in crack driving force, the stress intensity factor, accounting for the non-straight nature of the crack.
To investigate the applicability of the integrated experimental and computational approach for characterizing the fatigue crack growth behavior of kinked surface cracks, microstructurally small crack growth in AA7075-T7351 was experimentally analyzed and computationally modeled under high cycle and low cycle fatigue conditions. This legacy material was chosen to demonstrate the characterization approach due to its widespread use and well-established microstructural variability. The crack growth was measured on the surface of a shallow notched flat fatigue specimen using a novel, fast drying two-part silicon rubber surface replication technique. Fractography and Electron Backscatter Diffraction (EBSD) mapping of specimens were performed post-fracture to determine the source of crack initiation and distribution of intermetallic particles within the material, as well as to characterize the microstructure at the location of crack initiation. The crack configurations captured via surface replication were then input into the computational model to calculate the crack growth rate at varying stages of crack propagation and the computational results were compared to the experimental data.
The material used for testing in this study was a 63.5 mm thick rolled plate of AA7075-T7351. In this study, the fatigue specimens were cut out of the plate in the longitudinal orientation at the quarter thickness (t/4) and half thickness (t/2) in order to assess the effect of location dependent mechanisms in the rolled plate. This specimen design used in this study was a flat specimen with a reduced gauge, where this reduced gauge contains a shallow notch to facilitate fatigue crack initiation (Figure 1). While most of the specimen geometry was machined using wire electrical discharge machining (EDM), the shallow notch was prepared using a traditional milling tool. In addition, the shallow notch was machined into one side of the specimen geometry to facilitate natural crack initiation within a general location. Following machining, all surfaces were lightly polished using progressively finer polishing paper until a smooth surface was achieved. This specimen geometry was first used by (Tokaji et al., 2004) and has been successfully implemented to measure microstructurally small surface fatigue crack growth for magnesium alloys (Bernard et al., 2013; Cauthen et al., 2017; Cauthen et al., 2020).
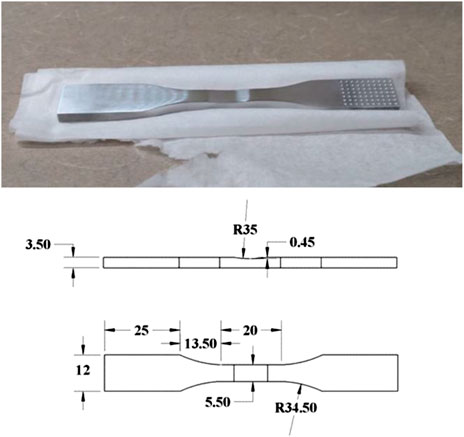
FIGURE 1. (A) Flat tensile specimen with shallow notch used for fatigue testing. (B) Specimen dimensions (mm).
Fatigue crack growth was evaluated for the test specimens in both the low cycle fatigue (LCF) and high cycle fatigue (HCF) regime at a load ratio of R = 0.1 and a test frequency below 10 Hz. Load levels for these regimes were chosen such that cycles to failure for LCF testing was approximately 104 cycles, and cycles to failure for HCF testing was approximately 105 cycles. Preliminary testing was conducted to find these desired load levels, and a stress range of 420 and 260 MPa was chosen for LCF and HCF testing, respectively. Eight samples, four in the HCF and four in the LCF regimes, were tested. The fatigue crack growth tests were conducted in ambient laboratory air and relative humidity and were terminated when full separation of the specimen was achieved. The application of the replica method for quantifying fatigue crack growth required the regular interruption of the fatigue tests at a mean cyclic load. Once stopped, the fatigue sample was dusted with particle free compressed air to remove any surface contaminates. Following the procedure detailed by Jordon et al. (2012), the Repliset® material, which is a two-part silicon rubber replica, was dispensed on to the shallow notch of the fatigue specimen using a mixing nozzle and dispensing gun. Tape was placed over the Repliset® material to hold it in place during the curing phase, where the curing time for the Repliset® material was approximately 5–10 min. Once cured, the tape was carefully pulled away from the specimen revealing an inverted replication of the surface of the shallow notch. This procedure was repeated such that 20–40 replicas were made over the life of each fatigue specimen. In the post-test crack evaluation procedure described by Jordon et al. (2012) each replica was coated with gold-palladium to improve the conductivity of the surface for scanning electron microscopy (SEM). However, they noted that the downside to using SEM to measure cracks was the tendency to melt the micron-sized features of the replicas under high magnification. As an alternate approach to using an SEM to measure the cracks, Bernard et al. (2013) demonstrated the efficacy of using an optical microscopy z-axis stitching method to measure cracks instead of the SEM approach. Similar, to Bernard et al. (2013), the surface replications in this present study were viewed and measured using a Keyence vhx-1000 optical microscope equipped with a Z axis imaging stacking feature that allowed for the entire surface of the replica to remain in focus. Crack measurements were made for one LCF and one HCF specimen at both considered thicknesses, for a total of four samples. Note that due to the nature of preparing each replica by hand, some of the replicas were applied with insufficient pressure during the curing process resulting in poor impressions, thus rendering some images of the crack not usable. For surface replications with low quality images, the data points were removed from the analysis. Between 15–30 data points were available for each of these four specimens. The replica images were used to create simplified crack geometries for input into the SIF prediction code. Depending on the crack shape, the surface cracks were dimensioned and modeled as a single, straight crack consisting of two crack segments, a two segment crack with a single kink, or a three segment crack with two kinks. Examples of the idealized kinked crack geometries overlaid on surface replication images are shown in Figure 2. A high and low value were measured for each crack segment length to capture uncertainty due to image quality and measurement error. The total crack length was the sum of the lengths of all crack segments.
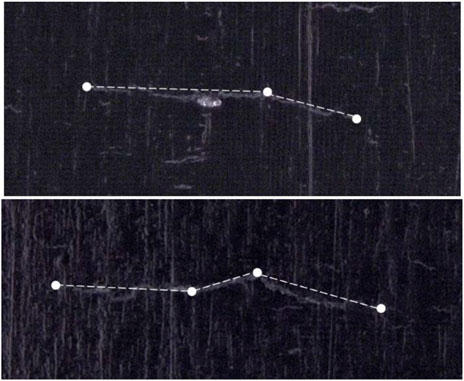
FIGURE 2. Examples of idealized kinked crack configurations overlaid on surface replication images. (A) a crack with two segments and a single kink, (B) a crack with three segments and two kinks.
Experimentally observed crack growth rates were calculated using the crack length measurements obtained from each surface replication. A two-point secant method was used to calculate the fatigue crack growth rate (Eq. 1).
where c is the total crack length, N is the cycle count, and n is the surface replication number. Note that because c is the total crack length, the computed growth rate is that of the entire crack, not an individual crack tip.
To characterize the microstructure and crack initiation, the fracture surface of each specimen was imaged using a scanning electron microscope (SEM). The crack initiation area of each specimen was examined, and the source of crack initiation was determined. Lastly, focus ion milling (FIB) was performed on the surface of the two LCF fractured specimens near the crack initiation site. Misorientation of grains was quantified at this location using EBSD. The observed fatigue crack’s position, crack length, and crack depth, d, were measured.
The computational approach developed and evaluated in this study consists of several steps to predict FCGR as described in this section. The DDT approach to calculate SIFs at the crack tips assumes a 2D infinite plate with a through crack and linear elastic behavior under remote stress. Therefore, the surface crack location in the bar and finite bar geometry must be measured and accounted for in another step in the analysis. Once ΔKI and ΔKII (representing mode I and II crack behavior respectively) are determined for each crack tip, a single equivalent stress intensity factor range (ΔKeq) is calculated according to Tanaka (Tanaka, 1974). A geometry factor is then applied to account for the surface crack depth. Using this corrected ΔKeq, the crack growth rate for the total crack growth is calculated via Paris law (Paris, 1961).
The computational model used to predict SIFs for microstructurally small crack growth is based on dislocation distribution theory that was originally developed for static loading (TerMaath et al., 2006; Yavuz et al., 2006) and adapted to fatigue loading (Yavuz et al., 2020). This model was chosen because it can solve for SIFs at the crack tips of kinked and branched cracks as well as combinations of the two. It also calculates the SIF at kinks by including the effects of wedge singularities so that crack growth at these locations can be evaluated. Importantly, it has been proven to be robust for cracks growing close to each other (TerMaath et al., 2006) and for large arrays of cracks of complex shapes (Yavuz et al., 2006), such that future development can capture this important scenario. Integrals are solved analytically (without numerical integration) eliminating this source of error. While not needed for this study, a significant benefit of this method is the capability to solve the stress and displacement field in a plate containing a large array of cracks of complex shapes, which can be highly interacting. This method is based on the isotropic bulk materials of the plate and assumes linear elastic behavior in an infinite body containing through cracks. A summary of this SIF prediction method is included in this section and full mathematical derivations are provided in (TerMaath, 2001).
The method is built on the superposition of two elastic problems, the trivial solution of the uncracked plate and the auxiliary problem that contains the cracks with prescribed tractions applied to the boundaries such the crack faces are traction free when the two problems are added (Eq. 2). Cracks are modeled as a series of crack segments of sufficient resolution to capture the crack configuration (as demonstrated in Figure 2). Thus, the foundation of the analysis is to solve for the crack opening displacement profiles for each crack segment that satisfy the global traction free condition. Once the opening displacement profile of each crack segment is determined, SIFs at crack tips and kinks, as well as the full stress and displacement fields in the plate, can be determined.
The variable σ∞ represents the far field loading conditions, ny and nx are the normals of the crack segment, ncs is the total number of crack segments in the analysis, and s denotes the tractions induced in a specific crack segment from the dislocation distributions. Z is the Cauchy singular integral used to solve for local stresses (Eq. 3), and one and two denote the tangential and normal direction of the crack segment, respectively.
The variable μ denotes the dislocation distribution at a point due to an opening displacement profile, i represents a specific crack segment, z is the location of the traction free point in complex notation, and t is the distance along the crack from the kink.
The traction free conditions are enforced at a user specified number of points along the crack segments and the point allocation is biased resulting in a higher density of points near the crack tips and kinks (TerMaath, 2001). The dislocation distributions are derived from opening displacement profiles that are constructed by summing terms from three types of critical crack behaviors (Eq. 4) to provide an overall crack shape with sufficient flexibility to capture the actual crack shape that meets the traction free boundary condition within a specified error. Eqs 4A−C are referred to as the Wedge, Polynomial, and Tip series, respectively, and each term in a series represents a degree of freedom. The total number of terms used for each series is designated as nw, np, and nt. Each series is used independently in the tangential and normal modes of deformation. Wedge series account for the stress singularity at a kink, polynomial series provide the opening and sliding crack displacements, and tip terms capture the singularity at a crack tip.
The variable A is the weighting coefficient of each term in the profile, and ρ is a measure of the wedge distortion per kink. After the opening profiles are constructed, they are converted to dislocation distributions and are then integrated according to Eq. 3. The opening displacements are turned on and off at crack segment ends via the use of Dirac delta and Heaviside step functions. Non-trivial physical constraints are applied at adjoining crack segments to ensure material continuity.
The weighting coefficients from the opening displacement profiles are solved using a least squares fit to determine the contribution of each dislocation distribution to the overall problem solution. The weighting coefficients of the j = 0 tip series directly represent the singularity of the crack tip, and thus the mode I and II stress intensity factor are solved according to Eq. 5, where G is the shear modulus of the material and κ is Kosolov’s constant which allows for plane strain or plane stress solutions.
It is essential for the analytical model to provide converged and accurate results with minimized computation time. Therefore, a convergence study on the model form parameters and uncertainty quantification (UQ) on the parameters representing measurement error were performed using the SIF prediction method to inform code optimization. The crack configuration investigated is shown in Figure 3 for the case of a V shaped crack with a single kink. This configuration was chosen as it is representative of the crack growth patterns observed from the replications of the experimental specimens, and literature values for this crack configuration are available for validation. For this case, the crack is loaded in normal unit tension only. The baseline length of crack segment one is 0.6 with an angle θ1 equal to 60° and the length of crack segment two is 1 with an angle θ2 of 0. It should be noted that all parameters investigated in the current effort are considered as independent parameters.
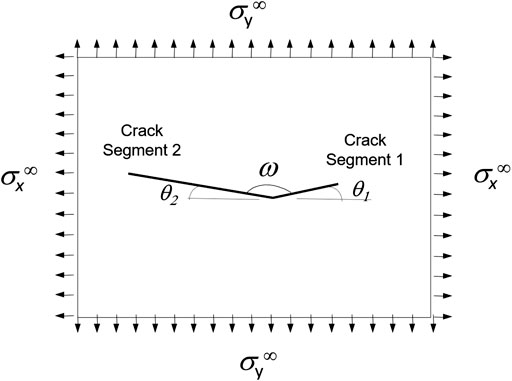
FIGURE 3. Crack configuration for two crack segments and a single kink.
A convergence study on the four model form parameters that are user-specified and defined as integer values consisted of the number of points assigned to each crack segment (the traction free condition is enforced at these points) and the number of wedge, tip and polynomial terms in approximating the opening displacement profile of each crack segment. Based on the results, the model form parameters were held at the following converged values for all analyses: 50 points were allocated along all crack segments and six terms were designated for all opening displacement profiles.
Measurement error is introduced when obtaining crack lengths and angles from images and is dependent on both image quality and human error. This experimental error was defined by 4 parameters: the measured length and angle of each crack segment. Measurement parameters were defined as normal distributions using the mean and standard deviations provided in Table 1 and were sampled using a Latin hypercube sampling function. Latin hypercube sampling stratifies the individual variables of the input vector, sampling from these strata, and randomly pairing them to build samples of the full input vector (Helton and Davis, 2003). A 10% standard deviation was chosen for the measurement error of the lengths and the 1.75° for the angles based on the resolution of the images obtained from the specimen replications.
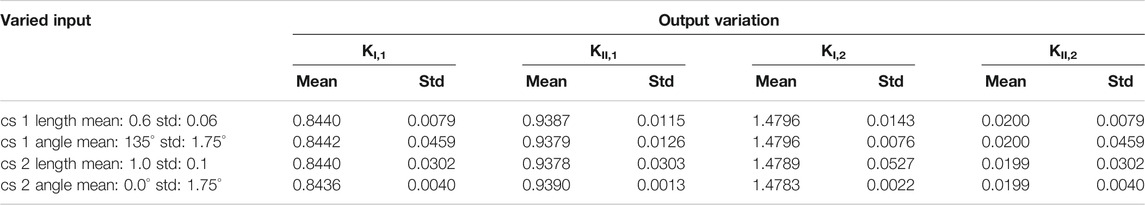
TABLE 1. UQ results for each input parameter relative to the output parameters.
For automated sampling and generation of input files, we utilized Distribution-based Input for Computational Evaluations (DICE). DICE is a general-purpose tool used for the design of experimental parametric studies (Nahshon and Reynolds 2016). DICE receives a parameter file and replaces the parameter values in text files based on user-defined parameters for the study being performed. DICE outputs a series of ready-to-execute analysis input files. The four input parameters were defined in a parameter definition file and sampled as probabilistic parameters as previously described.
UQ results are provided in Table 1. According to the standard deviation values, some parameters contributed higher uncertainty than others to the results. However, all standard deviations are on the order of two decimal places in the accuracy of the SIFs. This error is well within current capability to measure the SIF of a material and it was deemed that the uncertainty due to measurement error was acceptable for this study.
To generate straight crack results, the mode I and II SIFs were calculated according to Eq. 6 using the direct distance and incline between the crack tips and then converted to the effective SIF for use in the computational model.
where θ is the angle to the x-axis and
While the computational code was rigorously validated in previous publications on this method (TerMaath, 2001), a few additional cases representing the microcracks under investigation were analyzed using the SIF prediction method and compared with known values. A single straight crack at an incline in an infinite plate crack was divided into two equal crack segments for varying crack lengths such that c = 2a. The crack was loaded in unit biaxial tension and compared to the theoretical solution given in Eq. 6 (Sih et al., 1962). For unit biaxial tension loading,
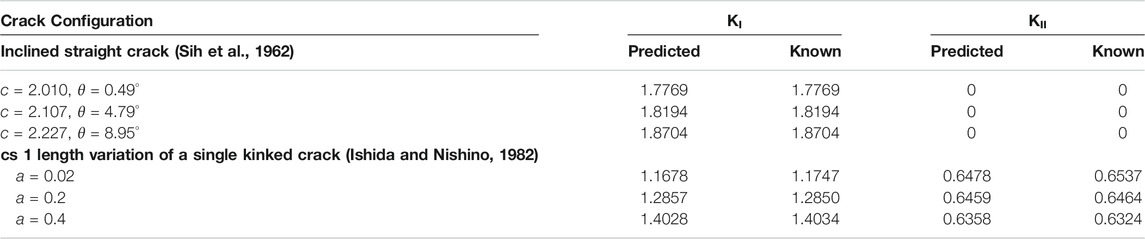
TABLE 2. Validation of SIF predicted values for an inclined straight crack SIF and a single kinked crack (specifically the crack tip of segment 1) with known values.
A second case for unit biaxial loading was performed using the crack configuration in Figure 3 for varying lengths of crack segment one which is held at a constant angle, θ1 = 60° and for constant values of crack segment two of a2 = 2 and θ2 = 0°. The comparison of the predicted SIFs with a known solution are provided in Table 2 (Ishida and Nishino, 1982). Again, the values are a close match.
To compare the prediction code with another computational method, two dimensional finite element (FE) models of through cracks were created in Abaqus (2014) for several different crack configurations. These were used to validate the SIF prediction method for cases where literature values are not available and to provide a comparison in computational cost differences relative to FE. The FE models evaluated mode I and II SIFs via the contour integral method, with quarter tip quadratic elements surrounding the crack tips. To obtain relevant comparisons to the SIF predictive code, which assumes a crack in an infinite plate, cracks were created in the center of a square with large dimensions relative to the crack, with the edge length being at least 10x larger than the total crack length for all cases studied. The converged number of elements required for the FE models ranged from 50,058 to 95,728. Table 3 shows the results for serval test cases, comparing SIF outputs and run times. In all cases studied, the predictive code was more accurate and required less computation time. For the problems studied in this paper, the time reduction is not of significant importance, but for cases with hundreds or thousands of crack segments, the reduction in computation time will be considerable. When considering meshing a large crack array in FE or another high resolution method, the modeling and computational times can become prohibitive and a lower fidelity method is essential.
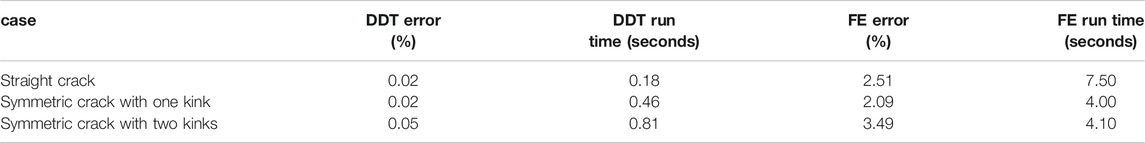
TABLE 3. Comparison of literature values, DDT results, and FE outputs for serval crack configurations.
The mode I and mode II SIF values at each crack tip were combined into a single effective SIF, Keq, to be input into a fatigue crack growth rate model. A wide range of methods to calculate Keq are available in literature. The method by Tanaka (1974), Eq. 7, was used due to its simplicity and applicability to the Paris model for crack growth (Qian and Fatemi 1996).
The SIF predictive method used to compute K assumes through cracks in an infinite plate, whereas the experimental testing produced surface cracks in specimens with a finite bar configuration. Therefore, both surface and edge effects were evaluated to determine the effects of these two assumptions on the model and to account for each.
To determine the range of validity of the infinite plate assumption and to account for edge effects, literature values for straight, off-center cracks in a finite bar were compared to solutions for a crack of the same dimensions in an infinite plate. For short cracks located away from the edge, edge effects are minimal and the results for the infinite plate solution are in reasonable agreement with those for a finite bar. As the crack grows closer to the edge and the crack length is on the order of the dimensions of the bar, the differences become significant and the limit of validity of the SIF predictions must be determined. To determine this limit, the center of each observed crack was measured relative to the specimen edge on the fracture surface and input into the solution from a SIF handbook (Murakami, 1987). An error in the range of 5–10% between finite bar and infinite plate results was considered acceptable. Once the crack grew to a length that caused an error over the specified limit, the SIF results were considered invalid. A representative example of this calculation using specimen HCF T/4 is shown Figure 4.
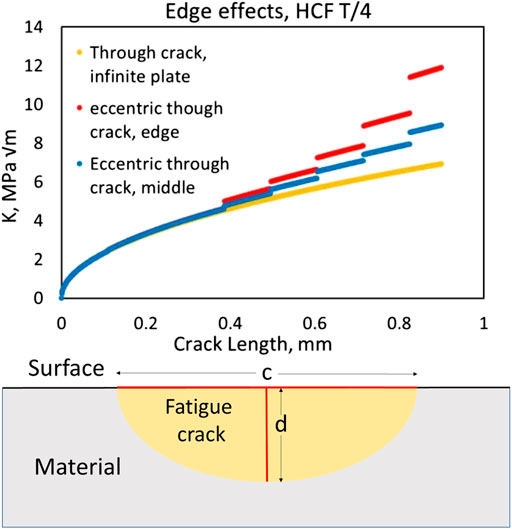
FIGURE 4. (A) Comparison of SIF results for varying crack location and plate size. Note that the solutions for the eccentric crack are piecewise due to the tabular look up format for some of the data. (B) Diagram of surface fatigue crack.
SIF solutions for straight surface cracks are available in a variety of handbooks and publications (Murakami, 1987; Dowling, 2012). A simple solution to a surface crack problem is to apply a geometry factor, F, which is a function of the aspect ratio to the through crack solution to obtain the SIF at either the surface of the crack or the deepest point (Eq. 8). ΔKeff will be used to an effective stress intensity factor range after this surface crack correction factor has been applied. For example, a crack with an aspect ratio of 1 (the ratio of crack depth, d, to the surface crack length, c) has a geometry factor of F = 0.73 that is applied to find the SIF at deepest point of the crack (Dowling 2012).
To determine the aspect ratio of the experimentally observed surface cracks, both literature estimates and aspect ratios on the final fracture surfaces were collected. Prior research suggests that crack aspect ratio remains consistent regardless of the initiating flaw geometry (Toribio et al., 2016) and is governed by the Paris law crack growth exponent, m, and loading configuration. The aspect ratios of the fatigue cracks on the final fracture surfaces were also measured, which ranged from 1.08 to 0.645 for the specimens tested. An average aspect ratio of 2d/c = 0.9 was applied to all experimentally investigated crack configurations. This value was chosen as representative to the majority of aspect ratios seen on the fracture surface, as well as its agreement to values seen in literature. A table with surface crack geometry factors for different crack aspect ratios is shown in Table 4. Using this average crack aspect ratio, a surface crack geometry factor of F = 0.705 was computed using the results presented in (Murakami, 1987), which accounts for crack depth and aspect ratio in a finite bar. The effects of using this average aspect ratio vs. the actual aspect ratio measured from the replications will be presented and reviewed in the discussion section.
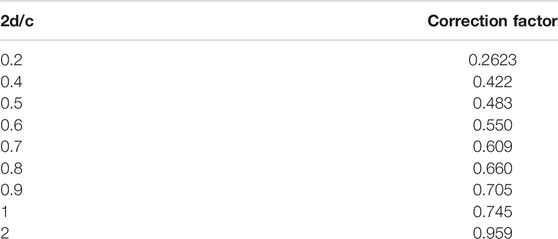
TABLE 4. Surface crack correction factors for various surface crack aspect ratios.
Once an effective SIF range was calculated, the values were input into a Paris Law predictive model (Paris, 1961) to calculate FCGR. The general form of this model relates ΔKeff to crack growth via an exponential relationship (Eq. 9). This model was chosen because material data to calculate the constants is commonly available for AA7075-T7351 as well as many other material types.
Where dc/dN is the crack growth per loading cycle, ΔK is the stress intensity factor range, and C, m are constants fitted to experimental crack growth data. The C and m constants for the Paris law crack growth model were calculated using datasets from (Newman et al., 2005) and the Metallic Materials Properties Development and Standardization, MMPDS, (FAA, 2015) for 7075-T7351 tested at a load ratio of R = 0.1. A combination of data sets was used to capture the wide range of SIFs produced in this research. The entirety of the MMPDS data was used, as well as the upper portion (region II in the crack growth curve) of the Newman data. The data and fitted curve used in the computational study is shown in Figure 5. The fitted curve covered a range of stress intensity factors from 3.86 to 63.46 MPa √m, and yielded an m exponent of 3.93 and C equal to 9.04e-12 (m/cycle)/(MPa √m)m.
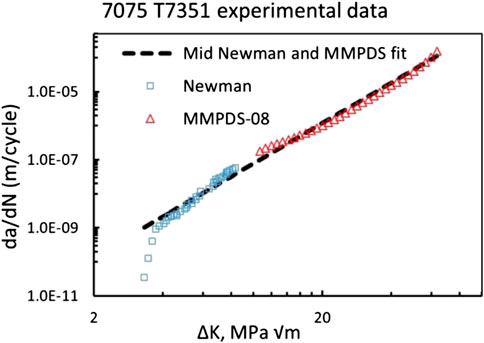
FIGURE 5. Fatigue crack growth rate data and linear fit used for Al 7075-T7531 tested at a load ratio of R = 0.1.
Table 5 displays the fatigue test results for the AA7075 specimens cut from both middle thickness (t/2) and quarter thickness (t/4) of the rolled plate. In general, the material displayed a consistent number of cycles to failure regardless of the thickness at which the specimen was cut. However, 1 t/4 LCF specimen failed at 100 cycles. The likely reason for this significant deviation in fatigue life is related to the source of crack initiation and will be discussed in more detail in the discussion section. Based on this fatigue life data, it appears there is no preferred sampling thickness for this batch of AA7075-T7351.
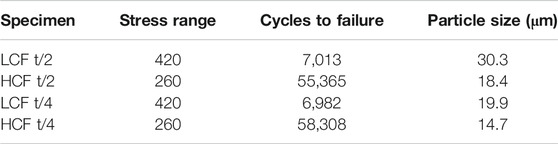
TABLE 5. Fatigue test results and particle size of crack initiating defects.
The two HCF specimens exhibited almost identical crack length vs. cycle trends except with regards to crack initiation. The two LCF specimens also closely compare, where the dominant crack spent the majority of the fatigue life under a crack length of 250 μm. The t/2 and t/4 thickness of the plate displayed very minimal differences in both the crack growth rate and number of cycles to failure.
The crack growth rate trends for the LCF specimens are different than the trends for the HCF specimens. From the beginning of the crack growth for both LCF specimens, the crack growth rate was observed to fluctuate and is non-linear. This trend continued to the end of fatigue life.
Through SEM, the source of crack initiation was determined to be a cracked intermetallic particle for each specimen observed in this study. In the vast majority of cases, a fatigue crack was found to nucleate from one or more particles at a single location and then propagate radially outward. In fact, we observed that a single specimen contained numerous large intermetallic particles (≈60 μm) throughout the fracture surface, but no noticeable fatigue crack was observed to initiate or propagate from these large particles. Of all the intermetallic particles that initiated fatigue cracks, the size ranged from approximately 10–30 μm. Upon scanning the intermetallic with EDS, all particles were determined to be iron-rich intermetallics. SEM images in back-scatter electron (BSE) mode of representative fracture surfaces illustrating the initiation site for LCF and HCF regimens are shown in Figures 6A–D, respectively. A summary of these crack initiating particles based on SEM analysis is presented in Table 5.
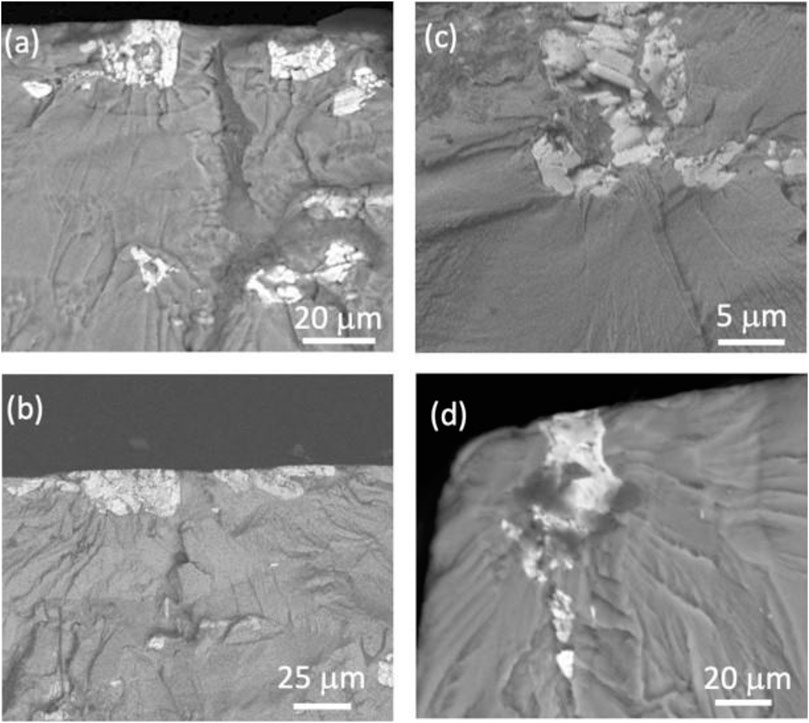
FIGURE 6. Representative back-scatter electron (BSE) images of iron-rich intermetallic particles that initiated fatigue cracks in the (A), (B) low cycle fatigue (LCF) and the (C), (D) high cycle fatigue (HCF) regimes. Note that the iron-rich intermetallic particles are brighter compared to the darker aluminum matrix.
EBSD was conducted on the surface of two specimens (one LCF t/2 and one LCF t/4) where the crack initiated and grain misorientation was measured. Figure 7 displays the grain orientation map and misorientation map for the LCF t/2 (7(a)) and LCF t/4 (7(b)) samples. Large, equiaxed grains were observed based on EBSD scan results for the LCF t/2 specimen at the initiation site (Figure 7A). The scan on the t/4 specimen (Figure 7B) revealed an equiaxed grain structure with combination of large grains and small grains. High angle misorientation was observed between most of the identifiable grains for both the t/2 and t/4 LCF specimens. The dominant cracks observed in this study were observed to have initiated in a region with large grains and high grain misorientation.

FIGURE 7. EBSD scans at the initiation site of the (A) LCF t/2 and (B) LCF t/4 specimens. Both sites were FIBed such that a smooth 50-100 μm wide surface remained for EBSD analysis.
The fatigue crack dimensions were measured on the fracture surface and used to determine the final crack aspect ratio and to compute the maximum crack length at the validity limit due to edge effects as indicated by the vertical lines in Figure 8.
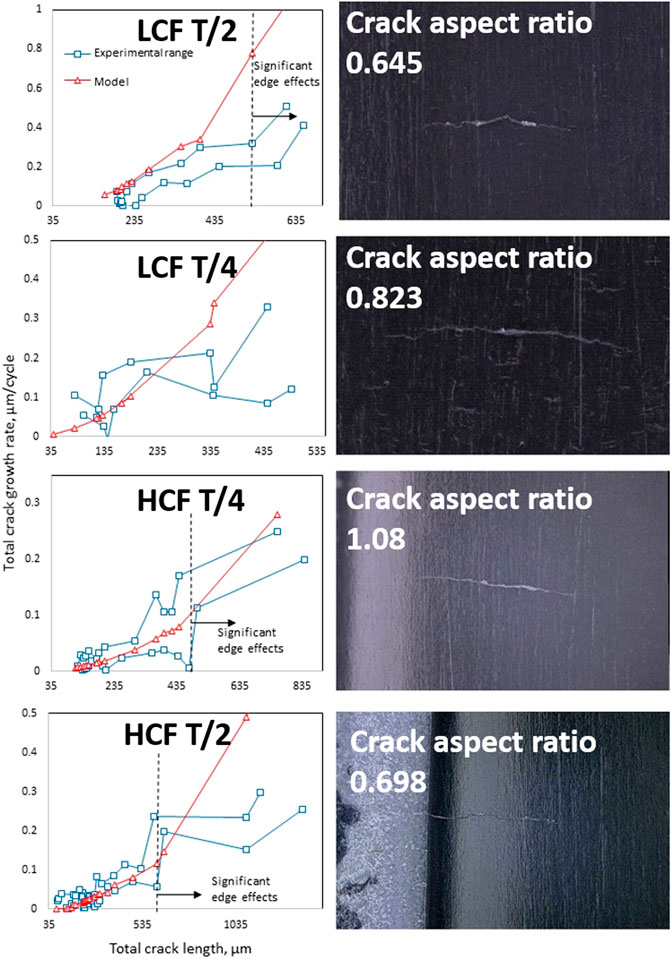
FIGURE 8. Model predictions vs. experimental crack growth for the (A) LCF t/2, (B) LCF t/4, (C) HCF t/4, and (D) HCF t/2. The red line shows the predicted value of crack growth at each crack length, and the green lines show the high and low estimates of experimental crack growth. The vertical blue line shows the rack length where significant edge effects begin.
The results of the kinked model predictions compared to the experimental results are shown in Figure 8 next to the geometries of the final crack configurations. The variation in the experimental crack growth rates is comparible to those determined in the FCGR charicterization of this alloy (Jordon et al., 2012), where the variations in crack growth rate change at a analogous amplitude over a similar distance of crack growth as the crack grows though changing microstructure.
The t/2 and t/4 thicknesses of the plate displayed very minimal differences in both crack growth rate and number of cycles to failure, though the t/4 specimens consistently demonstrated a longer fatigue life to crack initiation, when compared to the t/2 specimens. Both EBSD scans conducted displayed a similar grain structure when comparing the t/2 and t/4 LCF specimens. The scans revealed an equiaxed grain structure with primarily large grains, and high grain misorientation was observed between most of the identifiable grains. Based on the data captured in this study, it appears there is no preferred plate thickness for fatigue loading. This is an important observation because similar observations on crack initiation mechanisms revealed that cracks can initiate from casting pores in thick rolled plates (Cauthen et al., 2020). From the results presented in Table 8, it is clear that neither thickness possessed preferred crack growth resistance and therefore differences in fatigue life are dictated by crack initiation and microstructure.
An abundance of iron-rich intermetallic particles was found on the fracture surfaces, where intermetallic particles were found to initiate the dominant crack. EBSD results revealed an equiaxed grain structure with primarily large grains and high grain misorientation at the location of surface crack initiation. Furthermore, no evidence of surface crack initiation from persistence slip bands (PSB) was observed in contrast to observations made in other high strength aluminum alloys with high grain misorientations (Cauthen et al., 2020). However, due to the relatively high dispersion of the iron-rich intermetallic particles present in the legacy AA7075, it is not surprising that we observed cracks primarily initiating from these particles. These particles not only initiate cracks in AA7075 but can also influence the growth rates. The perturbation observed in small crack growth rates shown in Figure 13 has been shown to be influenced by discontinuities such as iron-rich intermetallic particles. In fact, crack growth rates have been observed to decrease significantly when cracks approached obstacles such as particles stringers in legacy AA7075. Once the driving forces exceeds the resistance provided by the iron-rich particle, the crack growth rate increases dramatically (Jordon et al., 2012).
After accounting for the actual crack depth in the LCF t/2 specimen, as discussed below, crack growth modeling predicted the FCGR obtained from experimental results within the measurement error bounds and range of validity (Figure 8) for all four specimens. The model reasonably predicted the crack growth rate early in the crack life, even in areas known to have large microstructural effects that cause fluctuations in the growth rate and limit the validity of a linear elastic, SIF based approach.
For all specimens tested, the model begins to severely over predict the growth rate at longer crack lengths. Note that this length scale is beyond the validity limit (shown as the vertical line in Figure 8) for which edge effects were estimated to be significant (greater than a 10%). This over prediction may be caused by plasticity induced crack closure effects, where crack closure occurs due to the combination of plastically deformed material left in the wake of the advancing crack and ahead of the crack tip (Walker et al., 2016).
The assumed crack depth also had a large effect on the predicted FCGR. The models were built on several assumptions, one of which was that the surface crack aspect ratio could be held constant at an average value with minimal error on the predicted FCGR. As seen in Table 4, as the crack becomes deeper, the surface geometry factor approaches one and converges to the SIF predicted by a through crack. For shallow cracks, the geometry factor is reduced. The geometry factor is applied to the effective SIF at each crack tip which is then input into the Paris law growth model, Eq. 9, where the crack growth is related to the SIF range raised to the m exponent. Therefore, the effect of the geometry factor error is raised by the power m. Thus, the effect of the error in the aspect ratio is higher for cracks with high SIFs than cracks with low SIFs, which helps explain the increased error caused by the geometry factor in the LCF T/2 FCGR predictions.
For the LCF T/2 specimen, the crack was shallower than the assumed aspect ratio, causing the actual crack growth to be lower than the original prediction. The FCGR was recalculated using the final aspect ratio observed on the fracture surface of 0.6 for this specimen and the results are compared in Figure 9. The results using the actual aspect ratio show a much better fit when compared to the experimental results. To further explore the error caused by an incorrect aspect ratio, we investigated the results for the HCF T/4 specimen (actual aspect ratio of 1.08) for varying aspect ratios. FCGRs were calculated using the bounding aspects ratios of 2 (approaching a through crack) and of 0.5 (representing a shallow crack) as presented in Figure 9. The assumed crack depth is shown to have a large effect on the predicted growth rate, although the assumed value of 0.9 predicted the FGCR within the bounds of the experimental results. Therefore, it is concluded that it is necessary to use a realistic crack depth to determine the aspect ratio and subsequent geometry factor. If measurement error prohibits determination of a highly accurate crack aspect ratio, the problem can be bounded by a high and low estimation.
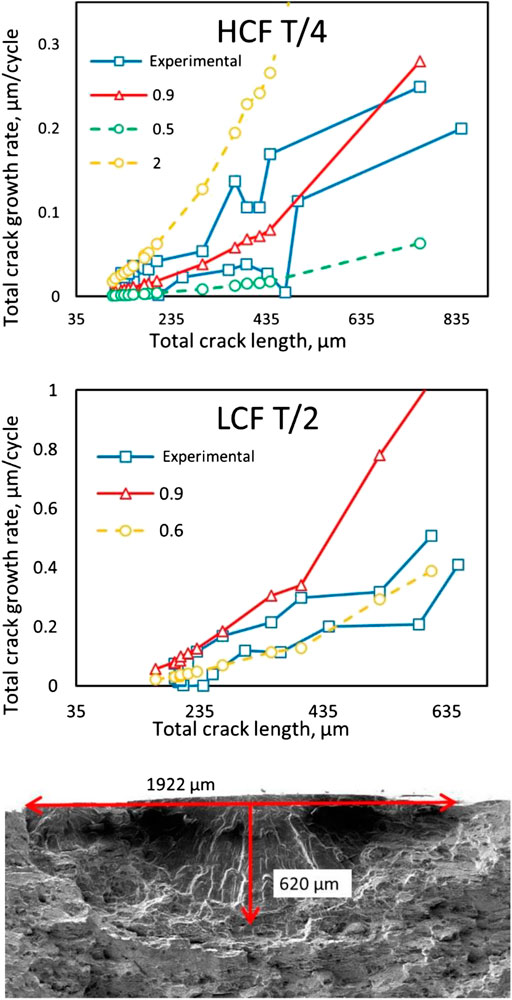
FIGURE 9. (A) Effect of crack depth on the FGCR of specimen HCF T/4 for crack aspect ratios of 0.5, 0.9, and 2.0 (B) Experimental vs. model results for sample LCF T/2, showing model results assuming an aspect ratio of 0.9 vs. the actual aspect ratio of 0.6 (C) The fracture surface and final aspect ratio of the crack seen observed on sample LCF T/2.
One pupose of this study was to investigate the usefulness of using DDT to model kinked surface fatigue crack growth. To do this, the SIFs predicted by the kinked crack model for the four specimens are compared to the SIFs predicted by modeling the cracks as straight. As shown in Figure 10 for specimen LCF T/2 results, the higher fidelity gained by including the kinks in the crack shape had a relatively small, but noticeable effect on the predicted crack growth for the fatigue specimens investigated in this study.
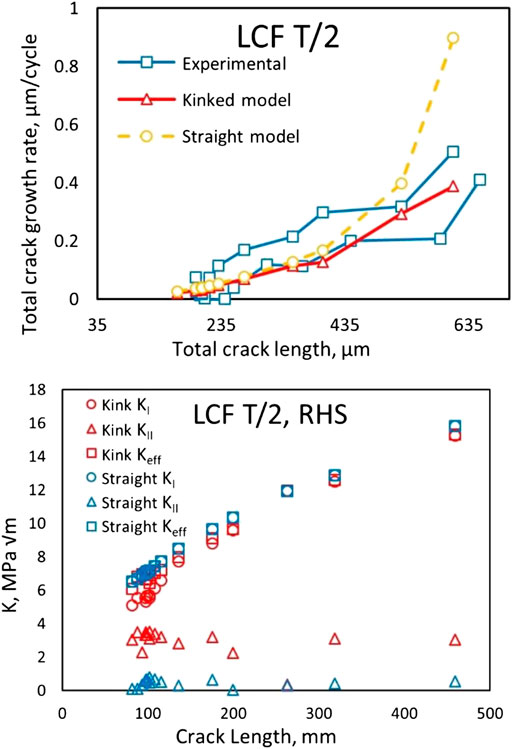
FIGURE 10. (A) Comparison of predicted FCGR for two LCF T/2 model configurations: a crack with a single kink and straight crack (B) Comparison of predicted FCGR (modes I, II, and effective) for the same two configurations.
A more substantial difference occurs in the mode II SIF between the straight and kinked models. The comparison for specimen LCF T/2 exhibited the largest divergence beween kinked and straight crack solutions, with more divergence between the solutions as the crack grows longer. This specimen configuration had a pronounced kink in the middle and displayed the fastest crack growth of the four specimens. As observed from a close inspection of the final crack configurations shown in Figure 8, the crack configurations were relatively flat or exhibited large kink opening angles, scenarios that are very close to a straight crack approximation and were loaded under tension applied perpendicular to the crack causing the importance of including kinks to be diminished.
To calculate the significance of including the kinks in the model prediction, a comparison between the experimental, straight, and kinked model values was made via a comparison of the percent error, using Eqs 10 and 11.
The percent improvement between the straight and kinked crack models was related to the amount of deviation from straight of the actual crack shape unsurprisingly. The straighter cracks observed, in samples HCF T/4 and LCF T/4, showed smaller improvements between the models than the more kinked cracks, HCF T/2 and LCF T/2.
Within each sample though, differences between the performance of straight and kinked crack models appear to be primarily a function of difference between the angles, or directions, of the crack tips in each model. An example of this correlation is seen in the comparison of stress intensity factors between the straight and kinked models of sample LCF T/2 in Figure 10B. During the beginning of crack growth, when the observed crack was a sharp “V” shape, crack kinking of the crack tip angles of the real crack were captured better by the kinked model. Data points in this range had a higher percent improvement between the straight and kinked models, in the range of 30–52%, than the LCF T/2 crack as a whole. As the crack grew longer and became straighter as the crack tips turned toward a direction of maximum normal stress, the differences between the straight and kinked models decreased, even though the crack was modeled in more detail with multiple kinks. A similar observation can be seen in sample HCF T/2, when higher differences between the straight and kinked model are observed near the crack kinks, but then decreases as the crack grows outward in the direction of higher normal stresses away from the kink. These examples show that differences between a straight crack model and a kinked crack model are more severe when the kinking is closer to the crack tip, with the difference diminishing as the crack grows and straightens away from kinks.
In this study, the nucleation and microstructurally small crack growth under fatigue loading for AA7075-T7351 was experimentally obtained, measured, and then modeled using a computational method based on DDT. In this work, microstructurally small fatigue crack growth was quantified using a novel surface replication process through interrupted fatigue testing. The replication process employed in this study used a fast-curing two-part epoxy that provided a submicron resolution of crack nucleation and propagation. This high-resolution surface replication process uniquely captured the microstructurally influenced fatigue crack growth behavior of the AA7075- T735 for the first time. In addition, using the spatial information taken from the replicas, the exact location for the fatigue initiation events on the fracture surface was known and subsequently imaged through scanning electron microscopy. As such, iron-rich intermetallic particles and clusters of particles were found to initiate fatigue cracks in this alloy. While iron-rich particles initiating fatigue cracks in AA7 alloys is not new information, the use the replica process coupled with post-mortem fracture surface analysis removed any ambiguity from the process of identifying sources of fatigue crack initiation.
Regarding the use of the surface replication process for model calibration, The high resolution replication technique provides critical input data for the prediction of the FCGR by providing a quantified crack shape. For the specimens investigated, crack growth modeling was found to predict experimental crack growth rates with an acceptable degree of accuracy. An important finding is that the geometry correction factor must be highly accurate, further emphasizing the importance of the high resolution technique to obtain crack shapes. Furthermore, the importance of explicitly modeling the kinks is exhibited when the angle or direction of the crack tips deviates from the shape of a straight crack, especially when the distance from the kink to the crack tip is small.
These results lead to the question of: what are the requirements in terms of crack configuration resolution for crack modeling to obtain converged and accurate results? Future work should address what amount of crack kinking/angle change is necessary and how many kinks/crack segments are required to obtain a given level of accuracy. Additionally, complex loading conditions may also necessitate higher fidelity modeling of the cracks. As a preliminary example, comparison of the results in Table 2 for biaxial loading demonstrate significant differences in the SIFs between a kinked crack and a straight crack model. (The straight cracks in Table 2 were created by generating a straight line between the two crack tips of the corresponding kinked cracks).
Another important consideration is investigating the limits of prediction accuracy with regards to the geometry factor. This factor was successfully applied for this focused study on one specimen type using a factor derived for straight cracks. A comprehensive study is needed to determine the applicability of this assumption for cracks with more significant kinking and branching and to explore the need to vary the geometry factor per crack segment. An extensive sensitivity analysis should be performed to explore the effects of varying crack segment shape, crack segment length, crack depth relative to plate thickness, loading conditions, and number of cracks relative to the geometry factor on the FCGR prediction accuracy.
The computational method was able to predict the FCGR for the cracks studied in this research. While the modeling resolution to include the effects of kink was not significant in this investigation, the computational foundation to predict the FCGR of kinked cracks was demonstrated. The method has been shown to be computationally efficient on a generic laptop computer and converges rapidly for a minimal number of DOF (measured by the number of opening terms included in an analysis). By integrating to obtain the solution, the method avoids many numerical approximations that increase the error in the results. Future applications of this method will benefit from the capability to obtain stress fields at discontinuities, including kinks and crack branching locations. Computational results also include full stress and displacement fields which will enable the prediction of crack path in future enhancements. Additionally, the method has been proven to converge for multiple crack arrays, even when the ligaments are very small between cracks (TerMaath et al., 2006). In summary, the method provides a fast yet accurate approach to evaluate existing crack patterns and conditions under general loading conditions and is applicable to small cracks through the use of the geometry factor. While the method is limited to modeling a crack array in a plate, this approximation does represent many real world scenarios. For example, this method has many potential applications for existing crack patterns that can be measured including:
• Informing inspection intervals
• Monitoring structural health
• Determining residual strength degradation
• Evaluating load-carrying capacity
• Informing repair and retirement strategies
• Locating areas where potential for new damage initiation is high (i.e., if corrosion, material defects, or overlooked cracks are present in a highly stressed area)
• Performing statistical studies using Monte Carlo simulation
The datasets presented in this article are not readily available because Data was generated under projects with proprietary restrictions by the sponsors. Requests to access the datasets should be directed to c3Rlcm1hYXRAdXRrLmVkdQ==.
RF – analytical framework development, calculations and results post-processing, sensitivity analysis and uncertainty quantification, paper writing. CC – experimental testing and results post-processing, analytical framework development, paper writing. SD – project coordination. JJ – project coordination, results post-processing, paper writing. AB - project administration. ST –analytical framework development and coding, calculations and results post-processing, paper writing, and project coordination.
The authors would like to thank Boeing for the partial funding of this project. Partial financial support was also provided by the Office of Naval Research (ONR) Structural Reliability Program through a Young Investigator Program grant (N00014-14-1-0516/N00014-16-1-2370) under the direction of Dr. Paul Hess.
Author AB was employed by The Boeing Company.
The remaining authors declare that the research was conducted in the absence of any commercial or financial relationships that could be construed as a potential conflict of interest.
Testing facilities used in this study were provided by the University of Alabama and the Central Analytical Facility. The authors thank the staff at the Central Analytical Facility for assistance with microscopy. The authors also thank University of Tennessee PhD students Cody Crusenberry and Corey Arndt for their help with the UQ. The DICE software was provided and developed at the Naval Surface Warfare Center Carderock Division and the authors appreciate the technical support from NAVSEA engineers Ken Nahshon and Nick Reynolds.
Abaqus (2014). Abaqus analysis user’s guide version 6.14. Available at: https://blogs.3ds.com/korea/wp-content/uploads/sites/6/2015/11/Co-Simulation-Using-Abaqus-and-FTire.pdf.
Altıntaş, E., and Güngör, E. (2013). Alternative surface roughness measurement technique for inaccessible surfaces of jet engine parts using the rubber silicon replica method. Metallogr. Microstruct. Anal. 2, 337–342. doi:10.1007/s13632-013-0092-6
Bernard, J. D., Jordon, J. B., Lugo, M., Hughes, J. M., Rayborn, D. C., and Horstemeyer, M. F. (2013). Observations and modeling of the small fatigue crack behavior of an extruded AZ61 magnesium alloy. Int. J. Fatig. 52, 20–29. doi:10.1016/j.ijfatigue.2013.02.015
Castelluccio, G. M., and McDowell, D. L. (2012). Assessment of small fatigue crack growth driving forces in single crystals with and without slip bands. Int. J. Fract. 176 (1), 49–64. doi:10.1007/s10704-012-9726-y
Castelluccio, G. M., and McDowell, David. L. (2016). Microstructure-sensitive small fatigue crack growth assessment: effect of strain ratio, multiaxial strain state, and geometric discontinuities. Int. J. Fatig. 82, 521–529. doi:10.1016/j.ijfatigue.2015.09.007
Cauthen, C., Anderson, K. V., Avery, D. Z., Baker, A., Williamson, C. J., Daniewicz, S. R., et al. (2020). Fatigue crack nucleation and microstructurally small crack growth mechanisms in high strength aluminum alloys. Int. J. Fatig. 140, 105790. doi:10.1016/j.ijfatigue.2020.105790
Cauthen, C., Daniewicz, S. R., and Shamsaei, N. (2017). Modeling fatigue crack growth behavior in rolled AZ31 magnesium alloy using CTOD based strip yield modeling. Int. J. Fatig. 96, 196–207. doi:10.1016/j.ijfatigue.2016.11.031
Dai, P., Luo, X., Yang, Y., Kou, Z., Huang, B., Zang, J., et al. (2020). The fracture behavior of 7085-T74 Al alloy ultra-thick plate during high cycle fatigue. Metall. Mater. Trans. 51, 3248–3255. doi:10.1007/s11661-020-05759-4
Daniewicz, S. R., and Aveline, C. R. (2000). Strip-yield and finite element analysis of part-through surface flaws. Eng. Fract. Mech. 67 (1), 21–39. doi:10.1016/S0013-7944(00)00032-1
Deng, G. J., Tu, S. T., Zhang, X. C., Wang, J., Zhang, C. C., Qian, X. Y., et al. (2016). Small fatigue crack initiation and growth mechanisms of nickel-based superalloy GH4169 at 650 °C in air. Eng. Fract. Mech. 153, 35–49. doi:10.1016/j.engfracmech.2015.12.014
Deng, G. J., Tu, S. T., Zhang, X. C., Wang, Q. Q., and Qin, C. H. (2015). Grain size effect on the small fatigue crack initiation and growth mechanisms of nickel-based superalloy GH4169. Eng. Fract. Mech. 134, 433–450. doi:10.1016/j.engfracmech.2015.01.002
Dowling, N. E. (2012). Mechanical behavior of materials: engineering methods for deformation, fracture, and fatigue. London, United Kingdom: Pearson.
FAA (2015). Metallic materials properties development and standardization. Washington, D.C., United States: Federal Aviation Administration.
Gall, K., Yang, N., and Horstemeyer, M. (1999). The debonding and fracture of Si particles during the fatigue of a cast Al-Si alloy. Mater. Trans. 30, 3079–3088. doi:10.1007/s11661-999-0218-2
Helton, J. C., and Davis, F. J. (2003). Latin hypercube sampling and the propagation of uncertainty in analyses of complex systems. Reliab. Eng. Syst. Saf. 81 (1), 23–69. doi:10.1016/S0951-8320(03)00058-9
Herbig, M., King, A., Peter, R., Henry, P., Erik, M., Marrow, J., et al. (2011). 3-D growth of a short fatigue crack within a polycrystalline microstructure studied using combined diffraction and phase-contrast X-ray tomography. Acta Mater. 59 (2), 590–601. doi:10.1016/j.actamat.2010.09.063
Hills, D., Kelly, P., Dai, D., and Korsunsky, A. (1996). Solution of crack problems: the distributed dislocation technique. Alphen aan den Rijn, Netherlands: Kluwer Academic Publishers.
Hu, X., Zhu, L., Jiang, R., Song, Y., and Qu, S. (2019). Small fatigue crack growth behavior of titanium alloy TC4 at different stress ratios. Fatig. Fract. Eng. Mater. Struct. 42, 339–351. doi:10.1111/ffe.12911
Hussain, K. (1997). Short fatigue crack behaviour and analytical models: a review. Eng. Fract. Mech. 58 (4), 327–354. doi:10.1016/S0013-7944(97)00102-1
Ishida, M., and Nishino, T. (1982). Formulae of stress intensity factor of bent cracks in plane problems. Trans. Japan Soc. Mech. Eng. 48, 430.
Jordon, J. B., Bernard, J. D., and Newman, J. C. (2012). Quantifying microstructurally small fatigue crack growth in an aluminum alloy using a silicon-rubber replica method. Int. J. Fatig. 36 (1), 206–210. doi:10.1016/j.ijfatigue.2011.07.016
Lardner, R. (1974). Mathematical theory of dislocations and fracture. Tonawanda, NY: University of Toronto press.
Ma, M., Zhang, J., Yi, D., and Wang, B. (2019). Investigation of high-cycle fatigue and fatigue crack propagation characteristic in 5083-O aluminum alloy. Int. J. Fatig. 126, 357–368. doi:1016/j.ijfatigue.2019.05.020
McCullough, R. R., Jordon, J. B., Allison, P. G., Rushing, T., and Garcia, L. (2019). Fatigue crack nucleation and small crack growth in an extruded 6061 aluminum alloy. Int. J. Fatig. 119, 52–61. doi:10.1016/j.ijfatigue.2018.09.023
McDowell, D. L., Gall, Ken., Horstemeyer, M. F., and Fan, J. (2003). Microstructure-based fatigue modeling of cast A356-T6 alloy. Eng. Fract. Mech. 70 (1), 49–80. doi:10.1016/S0013-7944(02)00021-8
Nahshon, K., and Reynolds, N. (2016). DICE: distribution-based input for computational evaluations. West Bethesda, MD: Naval Surface Warfare Center.
Newman, J. A., Willard, S. A., Smith, S. W., and Piascik, R. S. (2009). Replica-based crack inspection. Eng. Fract. Mech. 76, 898–910. doi:10.1016/j.engfracmech.2008.12.012
Newman, J., Schneider, J., Daniel, A., and McKnight, D. (2005). Compression pre-cracking to generate near threshold fatigue-crack-growth rates in two aluminum alloys. Int. J. Fatig. 27 (10-12), 1432–1440. doi:10.1016/j.ijfatigue.2005.07.006
Newman, J. C., Wu, X. R., Venneri, S. L., and Li, C. G. (1994). Small-crack effects in high-strength aluminum alloys. Hampton, VA: NASA, Langley Research Center.
Qian, J., and Fatemi, A. (1996). Mixed mode fatigue crack growth: a literature survey. Eng. Fract. Mech. 55 (6), 969–990. doi:10.1016/S0013-7944(96)00071-9
Qin, C. H., Zhang, X. C., Ye, S., and Tu, S. T. (2015). Grain size effect on multi-scale fatigue crack growth mechanism of Nickel-based alloy GH4169. Eng. Fract. Mech. 142, 140–153. doi:10.1016/j.engfracmech.2015.06.003
Raju, I. S., and Newman, J. C. (1979). Stress-intensity factors for a wide range of semi-elliptical surface cracks in finite-thickness plates. Eng. Fract. Mech. 11 (4), 817–829. doi:10.1016/0013-7944(79)90139-5
Sih, G. C., Paris, P. C., and Erdogan, F. (1962). Crack-tip, stress-intensity factors for plane extension and plate bending problems. J. Appl. Mech. 29, 306–312. doi:10.1115/1.3640546
Silling, S. A., and Abe, A. (2014). Peridynamic model for fatigue cracking. Albuquerque, NM: Sandia National Laboratories. SAND2014-18590.
Stephens, R. I., Ali, F., Stephens, R. R., and Fuchs, H. O. (2001). Metal fatigue in engineering. New York, NY: John Wiley and Sons.
Sun, D., and Ma, X. (1997). An application of the boundary element method to the fatigue crack propagation in a cracked heterogeneous body. Eng. Fract. Mech. 56 (6), 839–840. doi:10.1016/S0013-7944(96)00059-8
Tanaka, K. (1974). Fatigue crack propagation from a crack inclined to the cyclic tensile axis. Eng. Fract. Mech. 6 (3), 493–507. doi:10.1016/0013-7944(74)90007-1
TerMaath, S. C. (2001). A two-dimensional analytical technique for studying fracture in brittle materials containing interacting kinked and branched cracks. PhD dissertation. Ithaca (NY): Cornell University.
TerMaath, S. C., Phoenix, S. L., and Hui, C-Y. (2006). A technique for studying interacting cracks of complex geometry in 2D. Eng. Fract. Mech. 73 (8), 1086–1114. doi:10.1016/j.engfracmech.2004.09.009
Tokaji, K., Kamakura, M., Ishiizumi, Y., and Hasegawa, N. (2004). Fatigue behaviour and fracture mechanism of a rolled AZ31 magnesium alloy. Int. J. Fatig. 26 (11), 1217–1224. doi:10.1016/j.ijfatigue.2004.03.015
Toribio, J., Matos, J. C., and González, B. (2016). Aspect ratio evolution associated with surface cracks in sheets subjected to fatigue. Int. J. Fatig. 92, 588–595. doi:10.1016/j.ijfatigue.2016.03.028
Walker, K. F., Wang, C. H., and Newman, J. C. (2016). Closure measurement and analysis for small cracks from natural discontinuities in an aluminium alloy. Int. J. Fatig. 82, 256–262. doi:10.1016/j.ijfatigue.2015.03.016
Wilson, D., and Dunne, F. P. E. (2019). A mechanistic modelling methodology for microstructure-sensitive fatigue crack growth. J. Mech. Phys. Solid. 124, 827–848. doi:10.1016/j.jmps.2018.11.023
Wilson, D., Zheng, Z., and Dunne, F. P. E. (2018). A microstructure-sensitive driving force for crack growth. J. Mech. Phys. Solid. 121, 147–174. doi:10.1016/j.jmps.2018.07.005
Xue, Y., Dl McDowell, M. F. H., Dale, M. H., and Jordon, J. B. (2007). Microstructure-based multistage fatigue modeling of aluminum alloy 7075-T651. Eng. Fract. Mech. 74 (17), 2810–2823. doi:10.1016/j.engfracmech.2006.12.031
Yavuz, A. K., Phoenix, S. L., and TerMaath, S. C. (2006). An accurate and fast analysis for strongly interacting multiple crack configurations including kinked (V) and branched (Y) cracks. Int. J. Solid Struct. 43 (22-23), 6727–6750. doi:10.1016/j.ijsolstr.2006.02.005
Yavuz, A. K., Ahmed, T., and Halit, S. T. (2020). “Computer simulation of fatigue crack growth under different loading conditions using boundary cracklet method (BCM),” in Advances in science and engineering technology international conferences (ASET), Dubai, United Arab Emirates, February 4–April 9, 2020 (New York, NY: IEEE), 9118170.
Ye, S., Gong, J. G., Zhang, X. C., Tu, S. T., and Zhang, C. C. (2017). Effect of stress ratio on the fatigue crack propagation behavior of the nickel-based GH4169 alloy. Acta Metall. Sin. 30, 809–821. doi:10.1007/s40195-017-0567-6
Zerbst, U., Madia, M., Klinger, C., Bettge, D., and Murakami, Y. (2019). Defects as a root cause of fatigue failure of metallic components. I: basic aspects. Eng. Fail. Anal. 97, 777–792. doi:10.1016/j.engfailanal.2019.01.055
Zhu, L., Hu, X., Jiang, R., Song, Y., and Qu, S. (2019). Experimental investigation of small fatigue crack growth due to foreign object damage in titanium alloy TC4. Mater. Sci. Eng. 739, 214–224. doi:10.1016/j.msea.2018.10.031
Keywords: crack growth rate analysis, fatigue–cracks, aluminum alloy, computational modeling, surface crack behavior
Citation: Fleishel R, Cauthen C, Daniewicz S, Baker A, Jordon JB and TerMaath S (2021) Characterization of Surface Fatigue Crack Nucleation and Microstructurally Small Crack Growth in High Strength Aluminum Alloys. Front. Mater. 7:590747. doi: 10.3389/fmats.2020.590747
Received: 02 August 2020; Accepted: 10 December 2020;
Published: 11 February 2021.
Edited by:
Patricia Krawczak, IMT Lille Douai, FranceReviewed by:
Frédéric Charles Lebon, Aix-Marseille Université, FranceCopyright © 2021 Fleishel, Cauthen, Daniewicz, Baker, Jordon and TerMaath. This is an open-access article distributed under the terms of the Creative Commons Attribution License (CC BY). The use, distribution or reproduction in other forums is permitted, provided the original author(s) and the copyright owner(s) are credited and that the original publication in this journal is cited, in accordance with accepted academic practice. No use, distribution or reproduction is permitted which does not comply with these terms.
*Correspondence: Stephanie TerMaath, c3Rlcm1hYXRAdXRrLmVkdQ==
Disclaimer: All claims expressed in this article are solely those of the authors and do not necessarily represent those of their affiliated organizations, or those of the publisher, the editors and the reviewers. Any product that may be evaluated in this article or claim that may be made by its manufacturer is not guaranteed or endorsed by the publisher.
Research integrity at Frontiers
Learn more about the work of our research integrity team to safeguard the quality of each article we publish.