 Jingkui Zhang
 Juncai Xu
 Changshun Liu
 Ji Zheng1
- 1Anhui and Huaihe River Institute of Hydraulic Research, Hefei, China
- 2Department of Civil Engineering, Case Western Reserve University, Cleveland, OH, United States
The conventional design method of concrete mix ratio relies on a large number of tests for trial mixing and optimization, and the workload is massive. It is challenging to cope with today's diverse raw materials and the concrete's specific performance to fit modern concrete development. To innovate the design method of concrete mix ratio and effectively use the various complex novel raw materials, the traditional mix ratio test method can be replaced with the intelligent optimization algorithm, and the concrete performance prediction can be realized rapidly and accurately. The mixed ratio of the rubber fiber concrete was designed with its 28-day strength test. Then the range and variance analysis of the orthogonal test results were carried out to determine the optimal mix ratio and its influencing factors. A data set containing 114 sets of valid test data was collected by combining the rubber concrete mix test data published in recent years. Based on this data set, there are six influencing factors; rubber content, rubber particle size, and polypropylene fiber content are considered as the input variables, and the 28-day concrete compression, splitting tensile, and flexural strength are considered as the output variables. A strength prediction model of rubber fiber concrete is established based on the extreme learning machine (ELM). For verifying the ELM prediction model's performance, this article has conducted a comparison experiment between this model and other intelligent algorithm models. The results show that the model has the advantages of high accuracy and high generalization ability compared with other algorithm models such as conventional neural networks. It can be used as an effective method for predicting concrete performance. The method allows for the innovation and development of concrete mixing technology.
Introduction
With the development and application of green-energy-saving and resource recyclable materials, green and friendly waste rubber fiber concrete, which has excellent physical and mechanical properties, has attracted much attention. Rubber fiber concrete is a kind of engineering composite material made of ordinary concrete as a base material, mixed with waste rubber aggregates and fibers according to a specific ratio. It is solidified and hardened to form a kind of engineering composite material. Rubber fiber concrete has excellent properties such as good toughness, wear-resistance, and frost resistance. Besides, it effectively solves the problem of waste rubber treatment and improves the performance of concrete. So it plays a dual role in resource conservation and environmental protection. Rubber recycled concrete has become a hot topic in the research and development of the concrete industry and contributed to much research (Fang et al., 2001; Topçu and Demir, 2007; Reda Taha et al., 2008; Atahan and Yücel, 2012; Bravo and de Brito, 2012; Richardson et al., 2016). Farhad Aslani et al. prepared a self-compacting rubber fiber concrete. Fibers include polypropylene (PP) fiber and steel fiber, and they studied the influence of different rubber fiber particles' parameters on concrete's mechanical properties (Aslani and Gedeon, 2019). Zahid Hossain et al. studied rubber crumbs (CR), recycled coarse aggregate (RCA) and polypropylene fiber composite concrete, and tested the compressive strength, splitting tensile strength, and bending resistance at different ages (Zahid et al., 2019). Mostafa Jalal et al. prepared high-strength concrete by adding different fine rubber particles and polypropylene fibers. The performance of high-strength concrete (HSC), rubber high-strength concrete (RHSC), polypropylene high-strength concrete (PHSC), and polypropylene rubber high-strength concrete (PRHSC) before and after the high temperature was studied (Jalal et al., 2019a; Jalal et al., 2019b). Jiaqing Wang et al. prepared rubber fiber concrete samples with different rubber volume content and fiber volume fraction and made ordinary concrete samples for comparison. The synergistic effect of polypropylene fiber and rubber concrete was studied in terms of mechanical properties, durability properties, and microstructure (Wang et al., 2019).
Due to low hydrophilicity, the rubber particles have different properties than the concrete particles, and the adhesion between the two kinds of particles is poor. The rubber particles' strength is reduced after the concrete is mixed with the rubber aggregate. The performance of rubber fiber concrete is affected by many factors, and the research on the design of its mix ratio is still developing (Zheng et al., 2008; Skripkiūnas et al., 2009; Richardson et al., 2012). In practical engineering, for the performance of rubber fiber concrete to meet the requirements, a large number of tests are carried out to determine the optimal range of each influencing factor in the design of its mix ratio. This makes the mix ratio design process more complicated. Many workforce and material resources are consumed (Gao, 2018). Although the orthogonal test method has uniform dispersion features in the mix ratio design, it is an efficient and economical test design method. However, it still requires many experiments to get satisfactory results in practical engineering. This situation brings a significant challenge to the mix design. The traditional concrete strength test method is to test the concrete specimens after 28 days of standard curing. Thus, it is difficult to know whether the concrete's strength will meet the design requirements in time for concrete-based construction. If the final test strength of concrete does not meet the design requirements, it will seriously affect the construction period and construction quality. Therefore, how to get the expected 28-day strength of concrete with different mixing ratios in time for construction is a subject worthy of in-depth study. The concrete strength is affected by many factors such as cement strength grade, water-cement ratio, sand ratio, and admixture. There is a complex and highly nonlinear relationship between these influencing factors and concrete strength. So it is difficult to find out the regularity between them by using the traditional regression method. In recent years, the rapid development of machine learning technology has provided a platform for establishing this complicated nonlinear mapping relationship. The application of machine learning technology to establish a prediction model of material performance is a more effective method in improving novel materials development efficiency. It has become a hot international issue (Wu et al., 2019; Li et al., 2020).
In recent years, some scholars have applied machine learning methods such as neural networks (ANN), support vector machines (SVM), deep learning, and gray theory to the prediction of concrete strength. They have even made some valuable achievements (Ni and Wang, 2000; Lim et al., 2004; Topçu and Sarıdemir, 2008; Chou et al., 2014; Xu et al., 2015; Young et al., 2019; Xu and Yu, 2020). Mostafa Jalal et al. used an adaptive neurofuzzy inference system to establish a concrete compressive strength prediction model and studied the influence of cement content, rubber content, silica fume, and sample age on the concrete compressive strength (Jalal et al., 2020). They also used rubber powder and pozzolan to partially replace the aggregate and cement in the concrete raw materials and established three different regression models: linear regression model, logarithmic regression model, and power regression model to predict the compressive strength of concrete (Jalal et al., 2019a; Jalal et al., 2019b). Hesam Madanil et al. tried to use artificial neural methods such as adaptive neurofuzzy inference system (ANFIS), artificial neural network (ANN) technology, and linear and nonlinear regression analysis to predict the compressive strength of cement composite materials and compared the difference of those methods in predicting the strength of the cementitious mixture (Madanil et al., 2020).
However, these methods still have certain limitations. Traditional algorithms such as ANN and SVM are based on the Empirical Risk Minimization (ERM) criterion, which requires a sufficient number of learning samples to obtain a good learning effect. The limitations of the small sample test environment, such as poor adaptability and generalization, affect the prediction accuracy to a certain extent (Yeh, 2006; Li et al., 2015; Xu et al., 2017; Dutta et al., 2018; Prayogo, 2018). Therefore, it is necessary to study a more effective prediction method. Extreme learning machine (ELM) is a particular type of neural network. ELM only needs to set the number of hidden layer nodes of the network. During the algorithm's execution, there is no need to adjust the input weight of the network and the threshold of the hidden element. The weight and threshold can be initialized randomly, and the corresponding output weight can be obtained. It is only necessary to solve a linear least-squares problem. Its solution can be directly generated by the generalized inverse matrix from the hidden layer output matrix, and the optimal solution is unique. Due to this particular network design, ELM has a simple structure and has few training parameters, fast learning speed, and excellent generalization performance compared to other traditional algorithms that pursue infinite training samples. Because of this "ultimate learning speed," it is named the extreme learning machine (Huang et al., 2006; Huang et al., 2011).
Currently, the application of the ELM is mainly focused on fault diagnosis, defect detection, and sound analysis, but rarely in the field of material performance prediction (Bhat et al., 2008; Yaseen et al., 2018). Yaseen et al. proposed a high-precision prediction model of foam concrete compressive strength based on extreme learning machine (ELM) and compared it with multiple adaptive regression spline (MARS), M5 tree model, and support vector regression (SVR) (Yaseen et al., 2018). Jian Tang et al. compared several prediction modeling methods of concrete compressive strength based on extreme learning machine (ELM). The compressive strength of concrete is simulated and verified by various methods (Tang et al., 2014).
The number of data samples in the current literature is relatively small, and the model parameters need to be further optimized. Most approaches are for the strength prediction of ordinary concrete, while rubber fiber concrete with multivariable indicators has not yet been involved. Therefore, it is necessary to establish a prediction model and achieve a more accurate and useful performance prediction of rubber fiber concrete based on ELM. This article, combined with the orthogonal test results of rubber fiber concrete mix, collected relevant concrete mix test data. A prediction model based on ELM was established to predict rubber fiber concrete's mechanical properties and compared with other methods such as BP neural network. The model has high accuracy and robustness. It moves concrete mixing towards high efficiency, intelligence, and generalization. The work further enhances the level of innovation and the application of concrete mixing.
Laboratory Experiment
Raw Materials of Rubber Fiber Concrete
As a multicomponent composite material, rubber fiber concrete mainly consists of cement, fly ash, coarse aggregate, fine aggregate, rubber particles, polypropylene fiber, and additives. Cement (P·O 42.5 ordinary Portland cement produced by Conch Cement Co., Ltd.) was used. The chemical composition and performance indexes are shown in Tables 1 and 2.

TABLE 1. Cement chemical components (%).
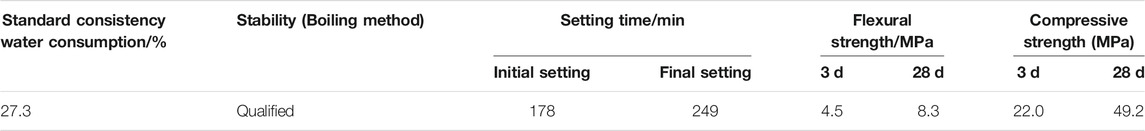
TABLE 2. Cement performance index.
Fly ash: grade II fly ash, material properties shown in Table 3.

TABLE 3. Physical and chemical performance indexes of fly ash.
Coarse aggregates: calcareous gravel, 5–25 mm continuous gradation, apparent density 2,720 kg/m3.
Fine aggregate: river sand, fineness modulus 2.55, apparent density 2,650 kg/m3.
Rubber particles: 10 orders (1140 kg/m3), 20 orders (1120 kg/m3), 40 orders (1130 kg/m3).
Polypropylene fiber: single bundle of staple fiber (12 mm).
Admixture: polycarboxylic acid superplasticizer, water reduction rate 20%.
Testing Scheme and Mix Ratio
According to "Specification for Mix Proportion Design of Ordinary Concrete" JGJ55-2011, the mix design of the C40 benchmark concrete was carried out to determine each cubic meter of concrete with a water-cement ratio of 0.4, a sand ratio of 42%, and a slump of 100–120 mm. The rubber aggregate was mixed into the concrete to replace part of the fine aggregate with an equal volume (substitution rate is 10–30%). The polypropylene fiber was added in the way of external reference. For the multi-index mixed design of rubber fiber concrete, it is necessary to investigate the influence of the three factors of rubber content, polypropylene fiber content, and rubber particle size on the mechanical properties of concrete at different levels. The L9 (33) orthogonal test scheme was used to optimize the mix proportion of the three levels of each influencing factor and seek the optimal level combination. The levels of various factors are shown in Table 4.
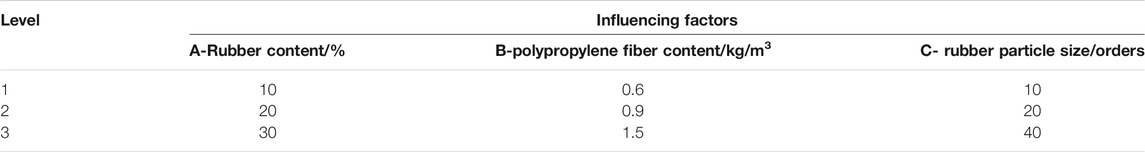
TABLE 4. Factor levels of orthogonal test.
In Table 4, the three levels and the three factors of rubber content, polypropylene fiber content, and rubber particle size are represented by A1, A2, A3, B1, B2, B3, and C1, C2, C3, respectively. The comprehensive combination test was carried out; the total number of mix ratio groups is 27. From the L9 (33) orthogonal test plan, the number of mix ratio groups obtained is nine groups, as shown in groups 1–9 of Table 5. Another nine sets of mix ratio designs were made in work, such as groups 10–18 in Table 5.

TABLE 5. Mix ratio of rubber fiber concrete.
Testing Content and Method
The testing content considers the 28-day compressive strength, split tensile strength, and flexural strength tests of rubber fiber concrete. According to the mix ratio of each group listed in Table 5, the rubber fiber concrete specimens were prepared by referring to "Standard for Test Methods of Mechanical Properties of General Concrete" GB/T 50081-2016. For each mixing ratio of 1–18 groups in Table 5, 3 groups of test blocks (3 test blocks for each group) were prepared for compressive, split tensile, and flexural strength tests. The size of the compression and splitting test block is 150 × 150 × 150 mm, and the size of the bending test block is 100 × 100 × 400 mm. The concrete was mixed with a forced mixer. The test piece was vibrated and compacted on the shaker, left to stand for 24 h in the room, and the numbering mark was marked. Then it was put into the standard curing room for 28 days. After that, the concrete strength test was performed. The various test blocks produced are shown in Figure 1.
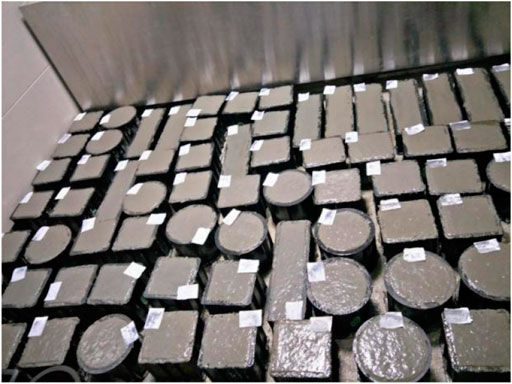
FIGURE 1. Test block for the strength test.
Experimental Results and Analysis
(1) Testing Results
Three test blocks with the same conditions were taken as a group, and the average of each test value was taken as the strength. The 28-day compressive, split-pull, and flexural strength of each group mix ratio is shown in Table 6, and the test process is shown in Figure 2.
(2) Orthogonal Range and Variance Analysis
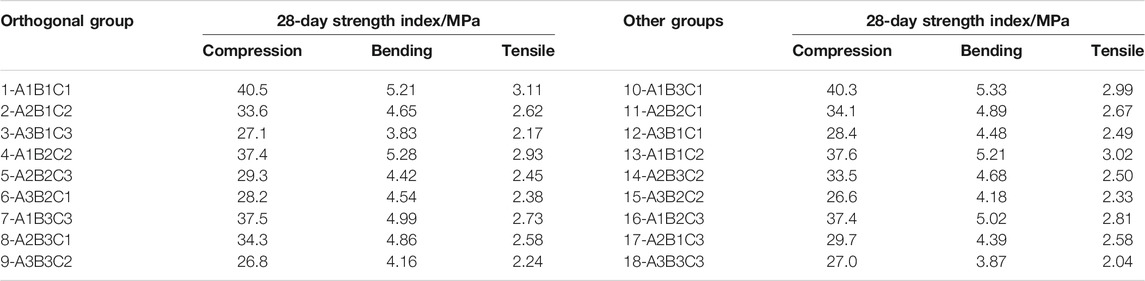
TABLE 6. Testing strength of rubber fiber reinforced concrete.
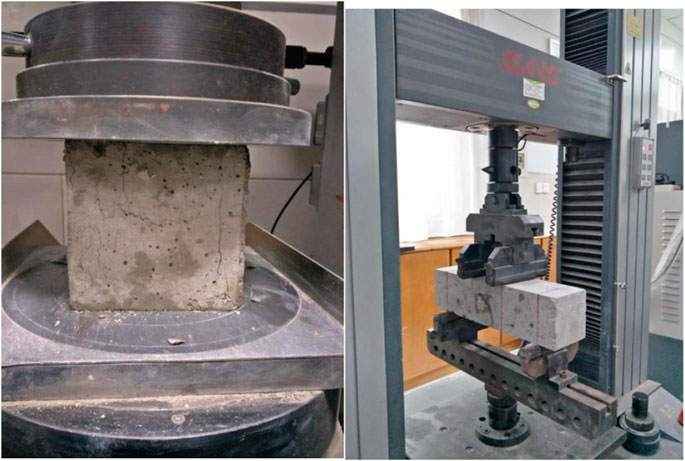
FIGURE 2. Specimen strength testing.
The orthogonal test results (group 1–9) in Table 6 were analyzed by range and variance. The analysis results are shown in Table 7. In Table 7, from the range analysis, the three influencing factors of the rubber content (A), polypropylene fiber content (B), and rubber particle size (C) were considered. The rubber content (A) is the largest for the effect of strength. The rubber particle size (C) is the second, and the effect of the polypropylene fiber content (B) is the smallest. The order of each influencing factor is rubber content > rubber particle size > polypropylene fiber content. From the analysis of variance, for the 28-day compressive strength, factor A is highly significant, while the other two factors are not significant. For the 28-day flexural strength, factor A is highly significant, the influence of factor C is significant, and factor B is no significant; for the 28-day tensile strength, factor A is exceptionally significant and factor C is highly significant. The primary and secondary factors influenced by variance analysis are consistent with the results of range analysis.
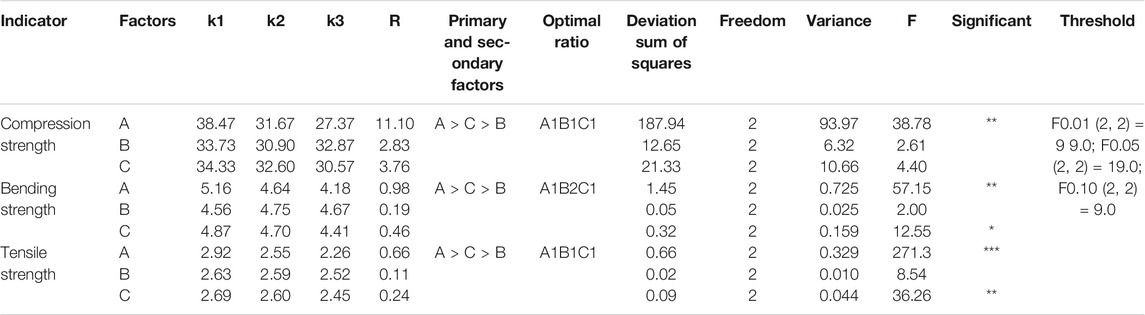
TABLE 7. Range and variance analysis results.
According to the concrete performance index mentioned above and the comprehensive analysis results of range and variance, it shows that the influence of rubber content A on the three essential indexes of 28-day compressive, flexural, and tensile strength is extremely significant, and A1 is the best. The rubber content selects A1. The fiber content B only has a significant effect on the compression ratio, and it is best when B2 is used. However, there is no significance to the other indicators. The fiber content selects B2. The rubber particle size C has a significant effect on the 28-day flexural and tensile strength, and it is best when C1 is used. Nevertheless, there is also no significance for the other indicators. The rubber particle size selects C1. Therefore, the optimal ratio of rubber fiber concrete obtained by comprehensive analysis is A1B2C1.
Influence of Various Factors on Rubber Concrete Performance
From the orthogonal test in Table 7, it can be seen that the influencing factors (A, B, C) of different levels (k1, k2, k3) affect the basic mechanical properties of rubber fiber concrete (compressive, flexural, and splitting tensile strength).
Analysis of Influence on Compressive Strength
It can be seen from Table 7 that the change in the number of rubber particles (A) has a significant effect on the compressive strength of rubber fiber concrete. With the increase in the number of rubber particles (A), the concrete cube's compressive strength shows a significant downward trend. The change of rubber content on the compressive strength of concrete is that the rubber particles are a low-strength organic elastic and hydrophobic material. It has low compatibility with the cement matrix and has a large difference in strength. There is a weak bonding surface inside the concrete, and the effective bearing area is reduced, resulting in decreasing the strength of the concrete.
The most important effect of polypropylene fiber parameter (B) on concrete strength is the weak interface effect and the crack resistance effect. It can be seen from Table 7 that the change in concrete compressive strength and fiber content is not a simple linear relationship with the increase of polypropylene fiber content. Generally, it first decreases and then rises. When polypropylene fiber's content increases from level k1 (0.6 kg/m3) to level k2 (0.9 kg/m3), the compressive strength is reduced. The weak interface effect of polypropylene fiber is evident at this stage. When the fiber content continues to increase to the level k3 (1.5 kg/m3), the concrete compressive strength rises again. The crack resistance effect of polypropylene fiber plays a leading role at this stage.
The impact of different rubber particle size (C) on concrete's compressive strength is also apparent. It can be seen from Table 7 that the compressive strength of the concrete mixed with rubber particles of particle size level k1 (10 mesh) is significantly higher than the particle size level k2 (20 mesh) and level k3 (40 mesh) when the rubber volume is the same. It can be seen that the addition of coarse rubber particles reduces the degree of weakening of the compressive strength of concrete while the specific surface area of fine rubber particles is relatively large. The larger the weak bonding surface formed between the cement matrix, the more unfavorable the compressive strength of concrete.
Analysis of Influence on Flexural Strength
It can be seen from Table 7 that the increase in the number of rubber particles (A) has a significant adverse effect on the flexural strength of concrete. In addition, the flexural strength of concrete decreases significantly with the decrease of the rubber particle size (C). The magnitude of the decrease in strength is even more remarkable when the rubber particle size changes from level k2 (20 mesh) to level k3 (40 mesh). With the increase of the content of polypropylene fiber (B), the flexural strength of concrete shows a change law that first increases and then gradually decreases. The crack resistance effect of polypropylene fiber is dominant within a particular content range, which strengthens toughness and delays the development of cracks. The flexural strength of concrete increases with the increase of fiber content. However, as polypropylene fiber's content increases, the weaker interfaces in the concrete matrix will increase, and the weak interface effect of polypropylene fibers is more prominent and gradually approaches the crack resistance effect. When the content exceeds the critical value, the polypropylene fiber's weak interface effect plays a leading role. It leads to a decrease in the strength of the concrete matrix, which shows that as the amount of polypropylene fiber increases, the flexural strength of concrete gradually decreases.
Analysis of Influence on Splitting Tensile Strength
It can be seen from Table 7 that the impact of rubber particle content (A) and rubber particle size (C) on the split tensile strength of concrete is similar to the impact mentioned earlier on flexural and compressive strength. By increasing the rubber particles' content and decreasing the rubber particle size, the splitting tensile strength of concrete shows a significant downward trend. Especially, the change of rubber particle content has a significant impact on the splitting tensile strength of concrete. The polypropylene fiber (B) content has no noticeable effect on the split tensile strength of concrete. The splitting strength of concrete decreases slightly with the increase of fiber content, but the overall change is not significant. Besides, it can be seen that, for the split tensile strength of concrete, the content of rubber particles (A) is hugely significant, the size of rubber particles (C) is significant, and the content of polypropylene fiber (B) is not significant.
Strength Prediction Model Based on Extreme Learning Machine
The orthogonal test's optimal mix ratio of rubber fiber concrete was finally determined through the range and variance analysis of the orthogonal test. The influence of various factors on the mechanical properties of concrete was also analyzed. However, the relationship between these influence factors and concrete strength is highly nonlinear. The traditional mixing ratio test method is time-consuming and labor-intensive and difficult to adapt to the requirements of using diverse and differentiated raw materials to prepare new concrete. The extreme learning machine (ELM) has good nonlinear mapping capabilities and reasonable response to the nonlinear relationship between concrete strength and various influencing factors. It can realize rapid and accurate prediction of the strength of rubber fiber concrete. Therefore, ELM modeling will be carried out in this article, and the obtained model will be used for the strength prediction of rubber fiber concrete.
Extreme Learning Machine Principle and Parameter Optimization
Given a set of M training samples (xi, yi), xi ∈ Rn, yi ∈ R, the number of hidden layer neurons is N in a single-layer feedforward neural network, and the activation function of each hidden layer neuron is f. Then the output of the network can be expressed as follows:
where wi and bi are the weight and bias of the i neuron in the hidden layer, respectively; βi is the output weights.
To reduce the error between prediction and target, the following relationship can be established:
Equation (2) can be simplified as follows:
where β = (β1 …βN)T; Y = (y1 …yN)T; H is the output matrix of the hidden layer. It can be defined as follows:
The output weight β can be obtained from β = H†Y according to (3), where H† is the Moore-Penrose generalized inverse of the matrix H.
Given a training sample set, activation function, and the number of hidden layer neurons, the ELM algorithm's specific steps are as follows:
(1) The hidden layer weight matrix wi and bias matrix bi are from probability distribution random setting.
(2) The hidden layer output matrix H is calculated.
(3) The output weight matrix
The hidden layer activation function of extreme learning machine usually chooses the Gaussian radial basis function. The prediction accuracy of the model is related to the selection of hyperparameters. The adjustment and optimization of hyperparameters usually use the Bayesian Optimization Algorithm (BOA). The optimization steps are as follows:
(1) Define the objective function: X* = argmax f(x).
(2) Randomly generate n initial sample points of hyperparameters. The hyperparameter distribution obeys the Gaussian distribution. Using Gaussian process obtains the prior distribution of the initial hyperparameters.
(3) The acquisition function is based on the principle of maximizing the expected increment and selecting the expected X that maximizes the expected function.
(4) Calculate the actual target value of X. If the conditions are met, output X is the optimal hyperparameter. Otherwise, add X and the real value to the initial sampling point and repeat the previous step.
Construction of Prediction Model
The orthogonal experiment design adopted a representative factor parameter combination for the experiment, and the resulting sample set was highly representative and comprehensive in the information. The complete sample set met the ELM algorithm's requirements for the representativeness of the training samples, and the accurate prediction model can be obtained through a small number of training samples. This paper combined the 27 sets of data obtained from the above-mentioned orthogonal test of the rubber fiber concrete's mix ratio and used searching engines such as Springer, Google, and CNKI (China National Knowledge Infrastructure) to collect the cement-based rubber data in recent years. The concrete mix ratio test data (a total of 87 data sets as shown in Table 8) was established, which contains 114 data sets. The selection of the data set's variable factors is based on the available information of all test data samples. According to the orthogonal test of the rubber fiber concrete's mix ratio, the rubber content, rubber particle size, and polypropylene fiber content are variable factors that affect the strength of concrete and the cement content water-cement ratio factors. The rubber aggregate is mixed in the same volume instead of as part of the fine aggregate, sand changes with the rubber content. Therefore, the data set established includes the above six influencing variables.
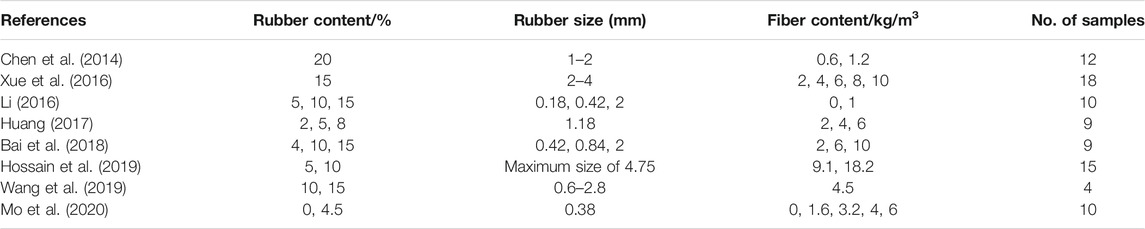
TABLE 8. 87 groups of rubber fiber concrete's test data sets.
The data set's six variables were taken as input parameters with the MATLAB program platform, and 28-day-old concrete compressive, flexural, and tensile strength were taken as output parameters. The rubber fiber concrete's strength prediction model was constructed. Since the established data set is from different researchers, a small part of the data samples lacks concrete flexural strength or tensile strength output variables. For making the data samples in the data set consistent and facilitating the model's training, the statistical regression relationship between the concrete compressive strength and its tensile strength or flexural strength was used based on the relevant literature. For a data sample with incomplete output variables, the tensile or flexural strength can be calculated from the sample's compressive strength. Thus, the three output variables were complemented. The influencing variables and their statistical descriptions are shown in Table 9.
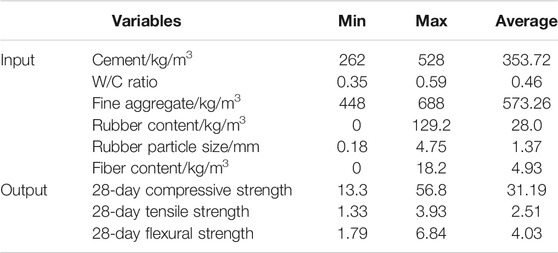
TABLE 9. Input and output variable in the data set.
To improve the efficiency and generalization characteristics of the model, first, the data set is normalized, and then about 80% of the original data set is randomly selected as the training and validation data set (90 data samples) and 20% as the test data set (24 data samples). A 5-fold cross-validation method is used to train and verify the ELM prediction model. The training and verification data set containing 90 data samples is randomly divided into five parts, and four of them are used as the training set and one as the verification set. The average of the five verification results is used to estimate the accuracy of the algorithm (performance index of the prediction model). Finally, the test data set is used to evaluate or validate the model. When the number of samples is limited, this method can effectively avoid over-learning and under-learning states. Thereby it can obtain a prediction model with good robustness and good generalization ability.
Model Performance Evaluation
In the process of training and testing, this article adopts the correlation coefficient (R2), relative standard deviation (RSD), and mean relative error (MRE) to evaluate the effectiveness and prediction accuracy of the model. The equation is as follows:
where xi is the measured or experimental value of concrete strength, yi is the predicted value or model output,
Efficient models with good predictive capabilities have lower RMSE and MAPE values and higher R values. The RSD is not more than 12%, and the MRE is not more than 10%. The accuracy of the model is relatively ideal.
Results and Discussion
The concrete strength value predicted and the actual concrete strength value in the data set are shown in Figures 3–5. Figure (a), (b), and (c) are the linear least squares regression lines between the output predicted value and the actual value of the ELM model for training, verification, and testing. R2, RSD, and MRE of each linear regression equation are listed in Table 10. It can be seen that the prediction of training, verification, and testing of the ELM model are close to the actual values. R2 values of each data set are relatively high, and the RSD and MRE are less than 10%. In considering multiple influencing parameters, the model can well establish the nonlinear relationship between input and output variables. It has good robustness for predicting the complex behavior of rubber fiber concrete mechanical properties.
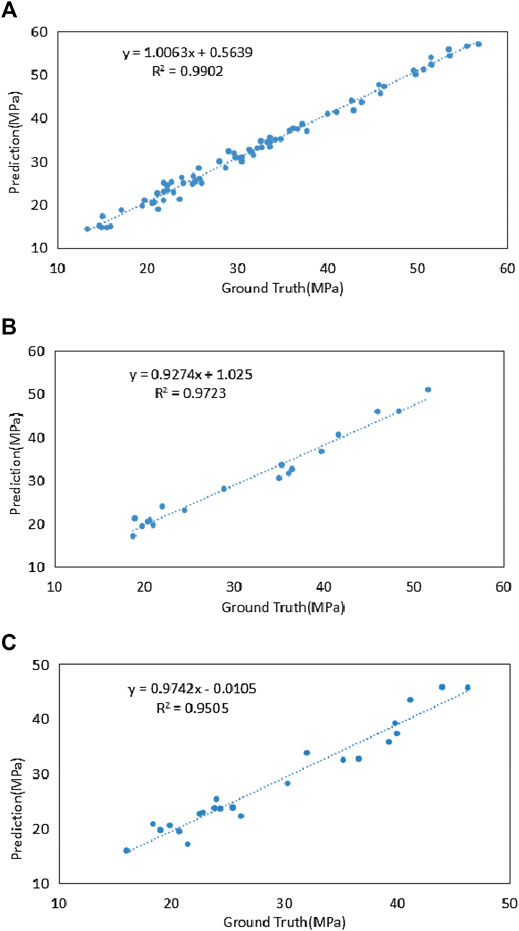
FIGURE 3. Correlation between predicted and experimental compressive strengths: (A) training dataset, (B) validation dataset, and (C) testing dataset of ELM.
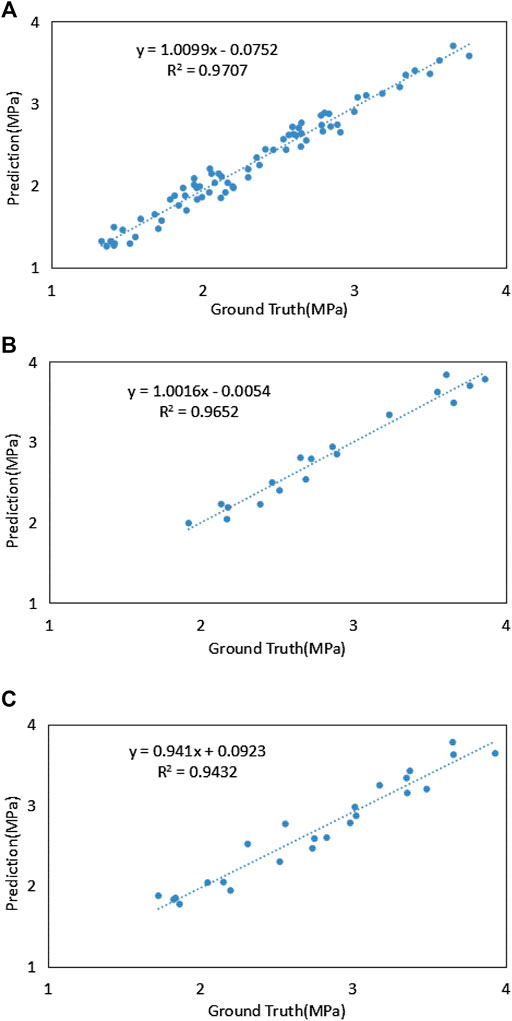
FIGURE 4. Correlation between predicted and experimental tensile strengths: (A) training dataset, (B) validation dataset, and (C) testing dataset of ELM.
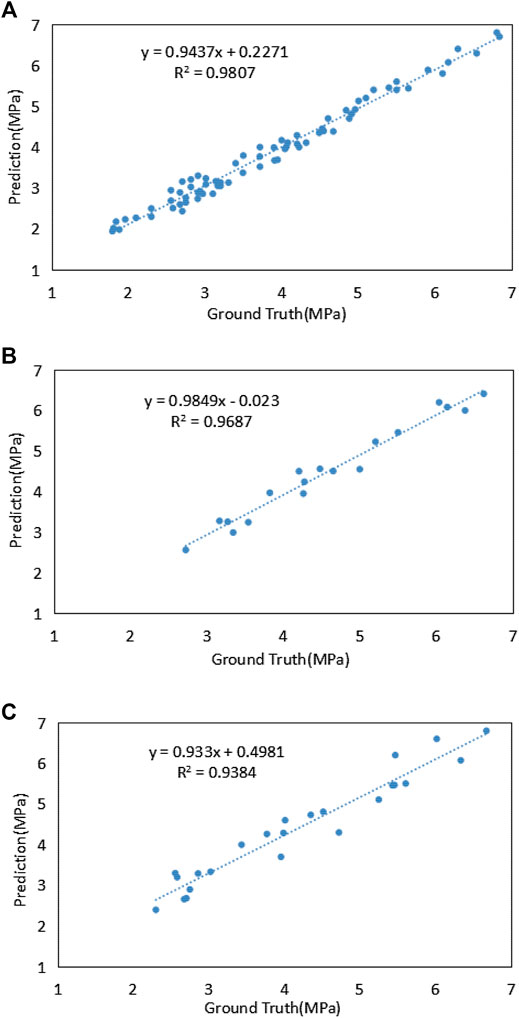
FIGURE 5. Correlation between predicted and experimental flexural strengths: (A) training dataset, (B) validation dataset, and (C) testing dataset of ELM.
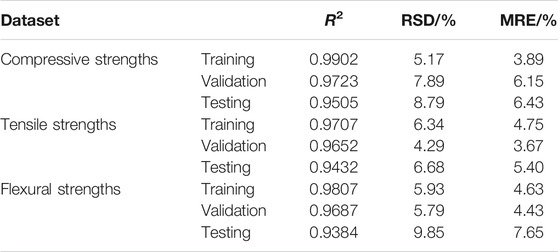
TABLE 10. Results of performance criteria of the ELM model.
According to Table 10, the average of the comprehensive performance indicators R2, RSD, and MRE of each stage of the ELM model are 0.9644, 6.75%, and 5.22%, respectively. For verifying the ELM's generalization performance and computational efficiency, this study also used BP neural network (BPNN) and support vector machine (SVM) to establish a prediction model and conducted a comparative experiment of the three algorithms.
For obtaining the best structure of the prediction model and ensuring its generalization, it is necessary to optimize the hyperparameters of the model. Levenberg–Marquardt method and Bayesian regularization were used to determine the optimal weight of the ANN model. A 5-fold cross-validation method was used to determine the optimal number of neurons in the network's hidden layer to avoid over-fitting and make the model have a better generalization and minimum prediction bias. The number of neurons in the input layer and the output layer is determined by the input and output parameters. The kernel function is a Gaussian function. For SVM's optimal penalty parameter C and RBF kernel parameter gamma, it is also obtained by optimizing the 5-fold cross-validation method. The cross-validation method can effectively avoid the over-fitting and under-fitting of the model.
The comprehensive performance indicators of each algorithm model are shown in Table 11. The training time of the model ignores super-parameter optimization. It can be seen from Table 11 that the extreme learning machine has the highest prediction accuracy compared with BP neural network and support vector machine. The training time is similar to that of a support vector machine and shorter than the BP neural network. It indicates that the generalization ability of extreme learning machines is more suitable for predicting the strength of rubber fiber concrete. BP neural network has the longest training time, but its accuracy is slightly higher than that of support vector machine.
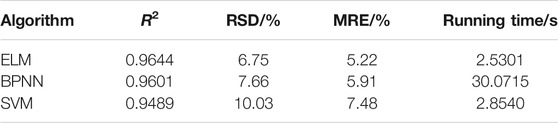
TABLE 11. Performance criteria comparison of different machine-learning models.
Wu Xiaoping et al. used Bayesian optimization of the extreme learning machine prediction model to predict concrete compressive strength. The model has higher accuracy and higher efficiency of model training than classic algorithms (Wu et al., 2020). The BP neural network has the highest prediction accuracy in the experiment, but the calculation performance is the worst, and the training time is the longest. The training time of extreme learning and support vector machine is similar, and both are shorter than the BP neural network. Jian Tang et al. compared several concrete compressive strength prediction model methods based on extreme learning machines (ELMs) (Tang et al., 2014). The results show that the conventional ELMs algorithm has fast modeling speed and high prediction accuracy and can be used to predict concrete's compressive strength. Thus, our experimental results are basically consistent with the above-mentioned literature.
Conclusions
The rubber fiber concrete mix was designed with the orthogonal test method. The rubber fiber concrete's mix test data were collected based on published articles in recent years. A data set containing 114 sets was obtained. Based on the data set and the MATLAB platform, a strength prediction model of rubber fiber concrete was established with ELM. The prediction performance of the model was also verified.
The conclusions can be drawn as follows:
(1) Orthogonal experiment design adopts a representative factor parameter combination for the experiment, and the obtained sample set is highly representative and complete in its information. The orthogonal test method was used to design the mix ratio of rubber fiber concrete and its 28-day strength test for obtaining the complete data sample. The complete sample set meets the ELM algorithm's requirements for representing the training samples, and an accurate prediction model can be obtained through a small number of training samples.
(2) There is a highly nonlinear relationship between rubber fiber concrete's strength and its influencing factors, challenging to deal with using traditional regression methods. With the orthogonal experiment, there are six influencing factors; rubber content, rubber particle size, and polypropylene fiber content are used as input; and 28-day concrete compression, splitting tensile, and flexural strength are used as output. One strength prediction model was established based on ELM. The experimental results show that the model has strong nonlinear mapping ability and high prediction accuracy. It can be used as an effective method for the strength prediction of the rubber fiber concrete.
(3) Since the generalization accuracy of the ELM model is greatly affected by the hyperparameters, the ELM needs further research in the super-parameter optimization method and the reduction of optimization time. It is also difficult to carry out a large number of mix ratio tests in the laboratory. The complete rubber fiber concrete's mix ratio test data samples currently available are limited. Although ELM has outstanding advantages over other small sample modeling methods, the prediction accuracy of this method still depends on the number and quality of learning samples. Therefore, it is necessary to continuously enrich the learning samples to further improve the prediction model's reliability in future practical applications.
Data Availability Statement
The original contributions presented in the study are included in the article/Supplementary Material; further inquiries can be directed to the corresponding author.
Author Contributions
JZ (1st author) designed experiments, analyzed data, and wrote the article. JX analyzed data and supervised the project. CL did experiments and collected data. JZ (4th author) did experiments and collected data.
Conflict of Interest
The authors declare that the research was conducted in the absence of any commercial or financial relationships that could be construed as a potential conflict of interest.
Acknowledgments
This research was funded by the Open Research Fund of Key Laboratory of Hydraulic and Waterway Engineering of the Ministry of Education (Grant No. SLK2017A02), the Open Research Fund of State Key Laboratory of Simulation and Regulation of Water Cycle in River Basin (Grant No. IWHR-SKL-KF201810) and the Open Research Fund of the Fundamental Science on Radioactive Geology and Exploration Technology Laboratory (Grant No. RGET1502). The authors would like to thank the Associate Editor Bahman Ghiassi, and two reviewers for their constructive comments to improve the early version of this paper.
References
Aslani, F., and Gedeon, R. (2019). Experimental investigation into the properties of self-compacting rubberised concrete incorporating polypropylene and steel fibers. Struct. Concr. 20, 267–281. doi:10.1002/suco.201800182
Atahan, A. O., and Yücel, A. Ö. (2012). Crumb rubber in concrete: static and dynamic evaluation. Construct. Build. Mater 36, 617–622. doi:10.1016/j.conbuildmat.2012.04.068
Bai, C., Ma, F. H., Liu, S. X., and Wang, J. M. (2018). Preparation of plastic steel fiber reinforced rubber concrete and its test analysis of frost resistance. Non-Metall. Mines. 41 (2), 35–37. doi:10.16339/j.cnki.jsjsyzdh.202001028
Bhat, A. U., Merchant, S. S., and Bhagwat, S. S. (2008). Prediction of melting points of organic compounds using extreme learning machines. Ind. Eng. Chem. Res. 47 (3), 920–925. doi:10.1021/ie0704647
Bravo, M., and de Brito, J. (2012). Concrete made with used tyre aggregate: durability-related performance. J. Clean. Prod. 25, 42–50. doi:10.1016/j.jclepro.2011.11.066
Chen, A. J., Chen, M., Wang, D. F., and Hu, F. Q. (2014). Research on the basic properties of the polypropylene fiber rubber recycled concrete. Concrete 9, 57–60. doi:10.3969/j.issn.1002-3550.2014.09.014
Chou, J. S., Tsai, C. F., Pham, A. D., and Lu, Y. H. (2014). Machine learning in concrete strength simulations: multi-nation data analytics. Construct. Build. Mater 73, 771–780. doi:10.1016/j.conbuildmat.2014.09.054
Dutta, S., Samui, P., and Kim, D. (2018). Comparison of machine learning techniques to predict compressive strength of concrete. Comput. Concr. 21 (4), 463–470. doi:10.12989/cac.2018.21.4.463
Fang, Y., Zhan, M., and Wang, Y. (2001). The status of recycling of waste rubber. Mater. Des. 22 (2), 123–128. doi:10.1016/S0261-3069(00)00052-2
Gao, W. (2018). Influencing factors and deep learning prediction model of compression strength of recycled concrete. Concrete 11, 58–61. doi:10.3969/j.issn.1002-3550.2018.11.015.70
Hossain, F. Z., Shahjalal, M., Islam, K., Tiznobaik, M., and Alam, S. (2019). Mechanical properties of recycled aggregate concrete containing crumb rubber and polypropylene fiber. Construct. Build. Mater. 225, 983–996. doi:10.1016/j.conbuildmat.2019.07.245
Huang, G. B., Zhu, Q. Y., and Siew, C. K. (2006). Extreme learning machine: theory and applications. Neurocomputing 70 (1-3), 489–501. doi:10.1016/j.neucom.2005.12.126
Huang, G., Zhou, H., Ding, X., and Zhang, R. (2011). Extreme learning machine for regression and multiclass classification. IEEE Trans. Syst. Man Cybern. Part B (Cybernetics) 42 (2), 513–529. doi:10.1109/TSMCB.2011.2168604
Huang, J. T. (2017). Research on mix proportion and constitutive relation of plastic steel fiber-rubber concrete used in road. J. Taiyuan Univ. Technol. 48 (6), 978–983. doi:10.19540/j.cnki.cjcmm.20190626.501
Jalal, M., Arabali, P., Grasley, Z., and Bullard, J. W. (2019a). Application of adaptive neuro-fuzzy inference system for strength prediction of rubberized concrete containing silica fume and zeolite. J. Mater. Des. Appl. 237, 90370. doi:10.1177/1464420719890370
Jalal, M., Nassi, N., and Hamid, J. (2019b). Waste tire rubber and pozzolans in concrete: a trade-off between cleaner production and mechanical properties in a greener concrete. J. Clean. Prod. 238, 117882. doi:10.1016/j.jclepro.2019.117882
Jalal, M., Poura, A., Zachary, G., and Jeffrey, W. B. (2020). Application of adaptive neuro-fuzzy inference system for strength prediction of rubberized concrete containing silica fume and zeolite. Proc. Inst. Mech. Eng. 234(3), 438–451. doi:10.1177/1464420719890370
Li, K., Hu, C., Liu, G., and Xue, W. (2015). Building's electricity consumption prediction using optimized artificial neural networks and principal component analysis. Energy Build 108, 106–113. doi:10.1016/j.enbuild.2015.09.002
Li, R., Xie, L., Wang, W. Y., Liaw, P. K., and Zhang, Y. (2020). High-throughput calculations for high-entropy alloys: a brief review. Front. Mater 7, 290. doi:10.3389/fmats.2020.00290
Li, X. H. (2016). Research on mechanical properties and durability of fiber-rubber concrete. Build. Sci. 32 (7), 118–122. doi:10.13614/j.cnki.11-962/tu.2016.07.019
Lim, C. H., Yoon, Y. S., and Kim, J. H. (2004). Genetic algorithm in mix proportioning of high-performance concrete. Cem. Concr. Res. 34 (3), 409–420. doi:10.1016/j.cemconres.2003.08.018
Madani, H., Kooshafar, M., and Emadi, M. (2020). Compressive strength prediction of nanosilica-Incorporated cement mixtures using adaptive neuro-fuzzy inference system and artificial neural network models. Struct. Des. Constr. 25 (3), 04020021. doi:10.1061/(ASCE)SC.1943-5576.0000499
Mo, J., Zeng, L., Liu, Y., Ma, L., Liu, C., et al. (2020). Mechanical properties and damping capacity of polypropylene fiber reinforced concrete modified by rubber powder. Construct. Build. Mater 242, 118111. doi:10.1016/j.conbuildmat.2020.118111
Ni, H. G., and Wang, J. Z. (2000). Prediction of compressive strength of concrete by neural networks. Cem. Concr. Res. 30 (8), 1245–1250. doi:10.1016/S0008-8846(00)00345-8
Prayogo, D. (2018). Metaheuristic-based machine learning system for prediction of compressive strength based on concrete mixture properties and early-age strength test results. Civ. Eng. Dimens. 20 (1), 21–29. doi:10.9744/ced.20.1.21-29
Reda Taha, M. M., El Dieb, A. S., Abd El Wahab, M., and Abdel Hameed, M. (2008). Mechanical, fracture, and microstructural investigations of rubber concrete. J. Mater. Civ. Eng. 20 (10), 640–649. doi:10.1061/(ASCE)0899-1561.20082010640
Richardson, A., Coventry, K., Edmondson, V., and Dias, E. (2016). Crumb rubber used in concrete to provide freeze–thaw protection (optimal particle size). J. Clean. Prod. 112, 599–606. doi:10.1016/j.jclepro.2015.08.028
Richardson, A. E., Coventry, K. A., and Ward, G. (2012). Freeze/thaw protection of concrete with optimum rubber crumb content. J. Clean. Prod. 23 (1), 96–103. doi:10.1016/j.jclepro.2011.10.013
Skripkiūnas, G., Grinys, A., and Miškinis, K. (2009). Damping properties of concrete with rubber waste additives. Mater. Sci. 15 (3), 266–272. doi:10.1177/1045389X15586452
Tang, J., Dong, Y., and Zhao, L. (2014). Comparison of several extreme learning machine algorithm for modeling concrete compressive strength. Appl. Mech. Mater 548–549, 1735–1738. doi:10.4028/www.scientific.net/AMM.548-549.1735
Topçu, İ. B., and Demir, A. (2007). Durability of rubberized Mortar and concrete. J. Mater. Civ. Eng. 19 (2), 173–178. doi:10.1061/(ASCE)0899-1561.2007192173
Topçu, İ. B., and Sarıdemir, M. (2008). Prediction of rubberized concrete properties using artificial neural network and fuzzy logic. Constr. Build. Mater 22 (4), 532–540. doi:10.1016/j.conbuildmat.2006.11.007
Wang, J., Dai, Q., Ruizhe, S., and Guo, S. (2019). Mechanical, durability, and microstructural properties of macro synthetic polypropylene (PP) fiber-reinforced rubber concrete. J. Clean. Prod. 234, 1351–1364. doi:10.1016/j.jclepro.2019.06.272
Wu, C. T., Chang, H. T., Wu, C. Y., Chen, S. W., et al. (2019). Machine learning recommends affordable new Ti alloy with bone-like modulus. Mater. Today. 54, 697. doi:10.1016/j.mattod.2019.08.008
Wu, X., Li, Y., Zhang, Y., Ruan, Y., and Liu, Z. (2020). Prediction of concrete compressive strength based on BOA-ELM. Comput. Technol. Autom. 39 (1), 140–144. doi:10.16339/j.cnki.jsjsyzdh.202001028
Xu, J., Ren, Q., and Shen, Z. (2015). Prediction of the strength of concrete radiation shielding based on LS-SVM. Ann. Nucl. Energy 85, 296–300. doi:10.1016/j.anucene.2015.05.030
Xu, J., Ren, Q., and Shen, Z. (2017). Sensitivity analysis of the influencing factors of slope stability based on LS-SVM. Geomech. Eng. 13 (3), 447–458. doi:10.12989/gae.2017.13.3.447
Xu, J., and Yu, X. (2020). Detection of concrete structural defects using impact echo based on deep networks. J. Test. Eval. 49 (1), 801. doi:10.1520/jte20190801
Xue, G., Wu, C. F., and Hu, X. L. (2016). Experiment study on stress-train relationship of plastic fiber reinforced concrete rubber. Bull. Chin. Ceram. Soc. 35 (11), 3796–3802. doi:10.16552/j.cnki.issn1001-1625.2016.11.052
Yaseen, Z. M., Deo, R. C., Hilal, A., Abd, A. M., Bueno, L. C., Salcedo-Sanz, S., et al. (2018). Predicting compressive strength of lightweight foamed concrete using extreme learning machine model. Adv. Eng. Softw. 115, 112–125. doi:10.1016/j.advengsoft.2017.09.004
Yeh, I. C. (2006). Analysis of strength of concrete using design of experiments and neural networks. J. Mater. Civ. Eng. 18 (4), 597–604. doi:10.1061/(ASCE)0899-1561.2006184597
Young, B. A., Hall, A., Pilon, L., Gupta, P., and Sant, G. (2019). Can the compressive strength of concrete be estimated from knowledge of the mixture proportions?: new insights from statistical analysis and machine learning methods. Cem. Concr. Res. 115, 379–388. doi:10.1016/j.cemconres.2018.09.006
Keywords: rubber fiber concrete, mix ratio design, intelligent optimization, concrete strength, extreme learning machine
Citation: Zhang J, Xu J, Liu C and Zheng J (2021) Prediction of Rubber Fiber Concrete Strength Using Extreme Learning Machine. Front. Mater. 7:582635. doi: 10.3389/fmats.2020.582635
Received: 13 July 2020; Accepted: 10 December 2020;
Published: 28 January 2021.
Edited by:
Bahman Ghiassi, University of Nottingham, United KingdomReviewed by:
Warda Ashraf, University of Texas at Arlington, United StatesHung-Wei Yen, National Taiwan University, Taiwan
Copyright © 2021 Zhang, Xu, Liu and Zheng. This is an open-access article distributed under the terms of the Creative Commons Attribution License (CC BY). The use, distribution or reproduction in other forums is permitted, provided the original author(s) and the copyright owner(s) are credited and that the original publication in this journal is cited, in accordance with accepted academic practice. No use, distribution or reproduction is permitted which does not comply with these terms.
*Correspondence: Juncai Xu, anh4MzA3QGNhc2UuZWR1