 Dongxin Niu
 Chao Zhao
 Daoxi Li
 Zhi Wang
 Zongqiang Luo
 Weiwen Zhang
94% of researchers rate our articles as excellent or good
Learn more about the work of our research integrity team to safeguard the quality of each article we publish.
Find out more
ORIGINAL RESEARCH article
Front. Mater., 16 December 2020
Sec. Mechanics of Materials
Volume 7 - 2020 | https://doi.org/10.3389/fmats.2020.577867
This article is part of the Research Topic2021 Retrospective: Mechanics of MaterialsView all 9 articles
Three constitutive models, strain-compensated Arrhenius model, modified Johnson–Cook (JC) model, and modified Zerilli–Armstrong (ZA) model, were established for the hot-deformed Cu-15Ni-8Sn alloy based on hot compression tests. By introducing average absolute relative error (AARE), correlation coefficient (R), and relative error, the prediction accuracy of these three models was assessed. The results indicate that strain-compensated Arrhenius model has the highest accuracy at describing the flow stress behavior of the studied alloy, followed by modified JC model and modified ZA model. Moreover, the strain-compensated Arrhenius model established in this work has a great practicability in the hot-extrusion simulation of Cu-15Ni-8Sn alloys. This article provides a theoretical basis for optimizing hot deformation parameters in industrial production of the Cu-15Ni-8Sn alloys.
As an attractive substitute for Cu-Be alloys, Cu-15Ni-8Sn alloys have drawn more and more attention owing to their high mechanical strength, excellent wear resistance, and corrosion resistance (Zhang et al., 2017b; Jiang et al., 2019; Cheng et al., 2020; Singh et al., 2007). They are expected to be widely used in aerospace, mechanical systems, and electronic industry (Li et al., 2017; Wang et al., 2019). Along with the research progress on Cu-15Ni-8Sn alloys, the industrialized production of these alloys has been given more and more attention. Most metallic materials underwent at least one of the deformation processes, such as rolling, forging, and extrusion. These processes not only decide materials’ final or near-net shapes, but also effectively reduce cast defects, such as porosities and slag inclusions (Cribb et al., 2013; Luo et al., 2019). Moreover, as-cast Cu-15Ni-8Sn alloy ingots usually need a long time homogenization treatment due to inevitably inverse segregation of Sn, where the large-sized grains will be obtained. Therefore, hot deformation process was usually used to refine the grain size and eliminate cast defects, which plays an important role in improving the mechanical properties of these alloys. Many previous researches have shown that the hot deformation parameters have a significant impact on alloy’s microstructure and properties. Zhao et al. (2017; 2020) reported that increasing extrusion ratio of Cu-15Ni-8Sn alloys can refine grains and increase recrystallization percentage, which effectively improves the elongation and strength. Thus, it has great significance in optimizing these parameters for achieving optimized properties in industrial productions. The constitutive models have been widely used to predict flow stress, which have high prediction accuracy, and hence they are essential for optimizing the hot deformation parameters of Cu-15Ni-8Sn alloy.
Nowadays, many constitutive models have been proposed and modified to describe the hot deformation behavior of metallic materials under given loading conditions (He et al., 2008; Lin et al., 2009). Among these models, modified Johnson–Cook (JC) model (Umbrello et al., 2007; Grujicic et al., 2012), strain-compensated Arrhenius model (Kumar et al., 2018), and modified Zerilli–Armstrong (ZA) model (Zerilli and Armstrong, 1987) have been widely used. However, for different materials, the most suitable model is usually different. Rudra et al. (2019) compared the three models’ accuracy for Al-10%SiCp composite and concluded that modified ZA model is the most suitable compared to the other two models. Yang et al. (2020) investigated the constitutive model of TC17 alloys and found that strain-compensated Arrhenius model has a good agreement with the experimental results. Even for the same Cu-based alloys, different alloy elements can lead to different suitable constitutive models. Zhang et al. (2017a) studied the hot deformation behavior of Cu-Cr-Nb alloys and established a strain-compensated Arrhenius model with high accuracy. But that is m-JC model for Cu-Zn-Si alloys (Wang et al., 2003). Nowadays, there is no work reporting the suitable constitutive model for Cu-15Ni-8Sn alloy which is crucial for prediction and tuning their microstructure and mechanical properties during industrialization. The previous constitutive models for other Cu alloys might shed light on the hot deformation of Cu-15Ni-8Sn alloys. However, a full and precise answer is needed since Cu-15Ni-8Sn alloys show much different microstructure, phase stability, and recrystallization behavior with other Cu alloys such as Cu-Cr-Nb alloys. It is useful for finding the appropriate hot deformation process.
In this work, the constitutive models for the hot-deformed Cu-15Ni-8Sn alloy were built based on strain-compensated Arrhenius model, modified JC model, and modified ZA model. The accuracy of these models was assessed by average absolute relative errors (AARE), correlation coefficient (R), and relative error. Furthermore, the model’s practicability in hot-extrusion simulation of Cu-15Ni-8Sn alloys has been evaluated.
The ingots with a designed composition of Cu-15Ni-8Sn-0.3Si-0.1Ti (wt%) were prepared using high purity Cu, Ni, Sn, Si, and Ti in intermediate frequency induction furnace. Minor addition of Si and Ti is usually used in these alloys to refine grains and improve mechanical proprieties. The actual chemical components of the ingot are listed in Table 1. The ingots underwent homogenization treatment at 1,113 K for 8 h. Subsequently, a number of ingots were machined into the cylindrical specimens with a size of Φ8 mm×12 mm for compression tests, and the remaining ingots were machined to cylindrical specimens with a size of Φ50 mm × 50 mm for hot-extrusion experiments.
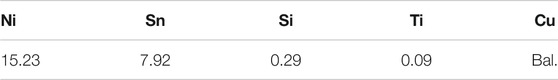
TABLE 1. Chemical compositions of the alloy (wt%).
Compression tests were carried out on Gleeble-3500 thermal simulator under different temperatures (1,023, 1,073, 1,123, and 1,173 K) and different strain rates (0.001, 0.01, 0.1, 1, and 10 s−1) with a total strain of 0.9. The detailed results of compression tests were shown in our previous works (Zhao et al., 2019). Based on the hot compression test, the flow stress data obtained in the strain range of 0.1–0.9 at intervals of 0.1 were used to calibrate constitutive models, and the compression stress data obtained in the strain range of 0.1–0.9 at intervals of 0.05 were used to validate the model.
Hot extrusion was carried out on a 2,000 KN vertical extruding machine, and then the samples were naturally cooled to room temperature in air. The detailed extrusion parameters are listed in Table 2. The OM images were obtained with a LEICA/DMI 5,000 M optical microscope. The grain size distribution map was drawn from more than 50 random areas based on the observation of OM images, and the average grain size was measured according to the linear-intercept method using an image analysis software installed on the Leica materials workstation.

TABLE 2. The hot-extrusion parameters.
The Arrhenius model is usually used to describe the material hot deformation behavior, which can be expressed as Eqs. 1–3 (Kumar et al., 2018):
where
By taking natural logarithm form to Eqs. 1–3, the following equations can be obtained:
where n1, n2, and n can be calculated from the slop of fitting curves
By regarding
However, the strain, which has a significant effect on the flow stress, is not taken into account in Arrhenius model. Here, a strain compensation method, shown as Eqs. 8–11, was introduced in this work based on the study reported by Kumar et al. (2018). The different parameter values of α, n, Q, and A at each strain can be calculated following the above-mentioned method. Subsequently, the fitting curve is drawn to obtain the coefficients in Eqs. 9–12, and the results are listed in Table 3.
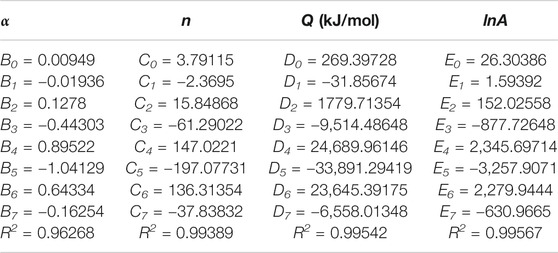
TABLE 3. Coefficient of polynomial for α, lnA, n, and Q.
Modified JC model can be expressed as Eq. 12 (Grujicic et al., 2012):
where σ is flow stress; ε is true strain; A1, B1, B2, C1, λ1, and λ2 are material constants;
a. At Reference Strain Rate and Reference Temperature
Equation 12 can be simplified to the following form:
where the values of A1, B1, and B2 can be calculated from the fitting curve between ε and σ.
a. At Reference Temperature
Equation 12 can be simplified to the following form:
Through drawing the fitting curve
a. At Each Strain Rate
A new relationship
where the values of λ can be obtained from the fitting curve of
The calculated values of the coefficients are listed in Table 4.
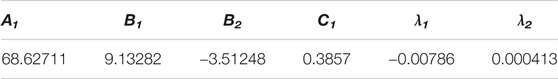
TABLE 4. Values of the coefficients in modified JC model.
Modified ZA model can be expressed as Eq. 16 (Samantaray et al., 2011):
where C1, C2, C3, C4, C5, C6, C7, and n are material constants; T* is equal to (T − Tref), where Tref is the reference temperature;
a. At Reference Strain Rate
The natural logarithm form is taken to both sides of the equation to obtain the following form. Here, M and N are introduced to the equation to make it clearer.
By drawing fitting curve
a. At Each Strain Rate
The natural logarithm of the modified ZA model is taken to generate the following equation:
where four values of
The calculated values of the coefficients are listed in Table 5.
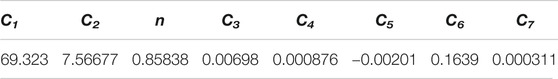
TABLE 5. Values of the parameters in modified ZA model.
The predictability of the flow stress-strain relationship by the constitutive models is assessed by graphical comparison between the calculated values and the experimental data at varied experimental conditions, as shown in Figures 1–3. As shown in Figure 1, the flow stress-strain curve, calculated by the sc-Arrhenius model, fits well with the experimental data except the conditions at high temperature of 1,173 K and high strain rate of 10 s−1. Under this condition, the calculated values are higher than the experimental data after the strain of 0.2. Under this condition, an unsteady deformation zone, cracks appear in the specimen, leading to a rapid reduction in flow stress with the strain increasing [19]. Because sc-Arrhenius model is failed to predict the reduction in flow stress contributed by the crack formation, the calculated results are higher than the experimental data at high strain rates.
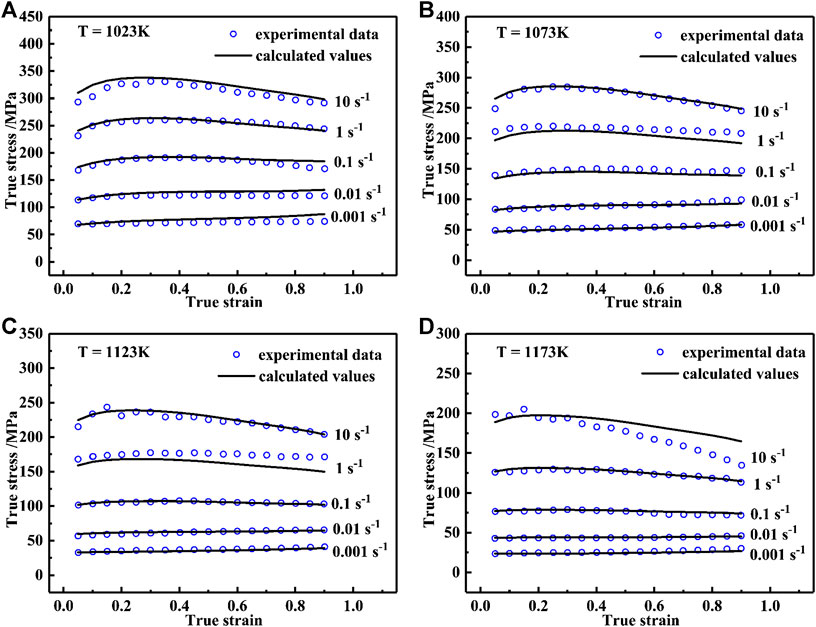
FIGURE 1. Comparison between experimental data and values calculated by sc-Arrhenius model.
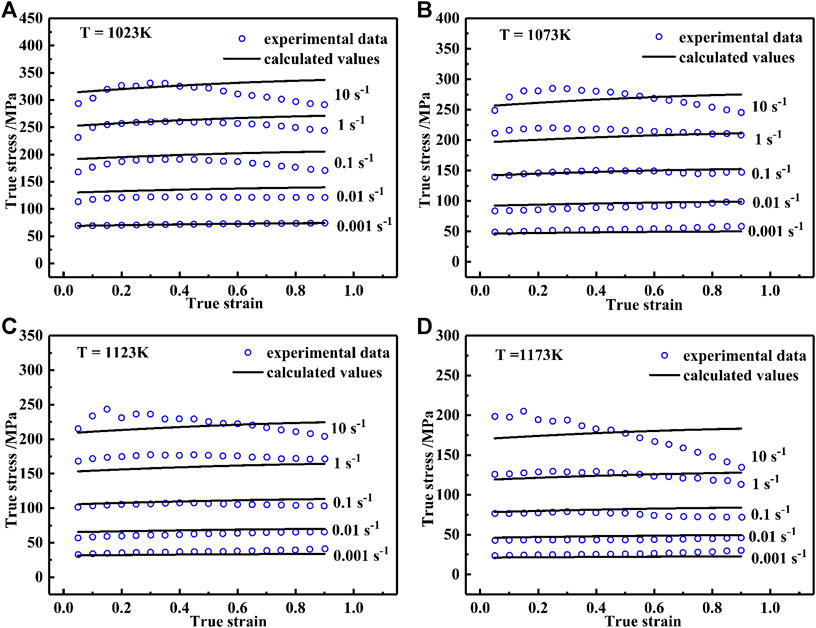
FIGURE 2. Comparison between experimental data and values calculated by m-JC model.
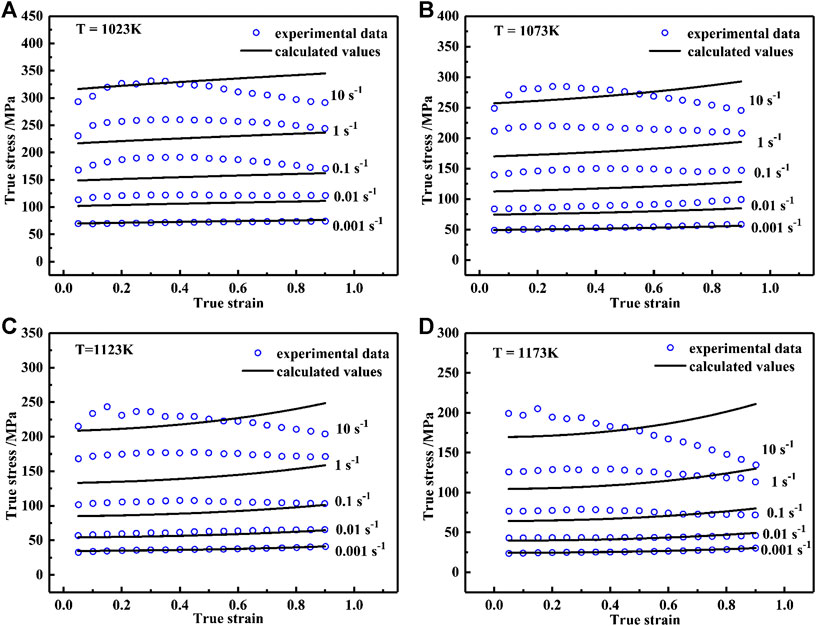
FIGURE 3. Comparison between experimental data and values calculated by m-ZA model.
Figure 2 shows the comparison results of the m-JC model, which indicates that it can only maintain a high predictability at low strain rates. With increasing strain rate (above 0.1 s−1), the predicted results gradually deviate from the experimental data. Additionally, the calculated values of m-JC model are higher than the experimental data after the strain of 0.6, which indicates that m-JC model has low ability to predict the reduction trend in flow stress caused by dynamic recrystallization.
Figure 3 shows the comparison between the experimental and predicted flow stress values obtained by m-ZA model. The m-ZA model’s calculation results show a large deviation from experimental data at strain rate above 0.01 s−1, where the predicted values are initially much lower than the experimental data. Moreover, the predicted values constantly increase with increasing strain, which disagrees with the reduction trend of experimental data.
The accuracy of the three models is further verified via employing average absolute relative error (AARE), correlation coefficient (R), and relative error. The R exhibits the linear relationship between experimental and calculated values; the relative error describes the prediction accuracy of a model; and AARE is obtained by term-by-term calculation of relative error. Their expressions are shown as follows (Rudra et al., 2019):
where Ei is the experimental value; Pi is the calculated value;
Figure 4 shows the plots of average absolute relative error, correlation coefficient, and relative error between the calculated values using Eqs. 20–22 and the experimental data. It can be seen that the sc-Arrhenius model has the highest correlation coefficient of 0.997, followed by m-JC model (0.989) and m-ZA model (0.941), indicating that the calculated values of sc-Arrhenius model have the strongest linearity with experimental data. Figure 5 shows the distribution of relative errors obtained from the three models. It is found that sc-Arrhenius model shows the highest accuracy with relative error range from −19.932 to 12.541%. Moreover, the relative error values of more than 95% of samples calculated by sc-Arrhenius model are within ±10%. Table 6 shows the results of AARE calculated by the three models. The sc-Arrhenius model has the lowest value of 0.034, followed by m-JC model (0.075) and m-ZA model (0.098). The results of AARE are in agreement with the results of relative errors. In conclusion, the sc-Arrhenius model possesses the highest prediction accuracy, which shows the highest value of R, lowest value of relative error, and lowest value of AARE.
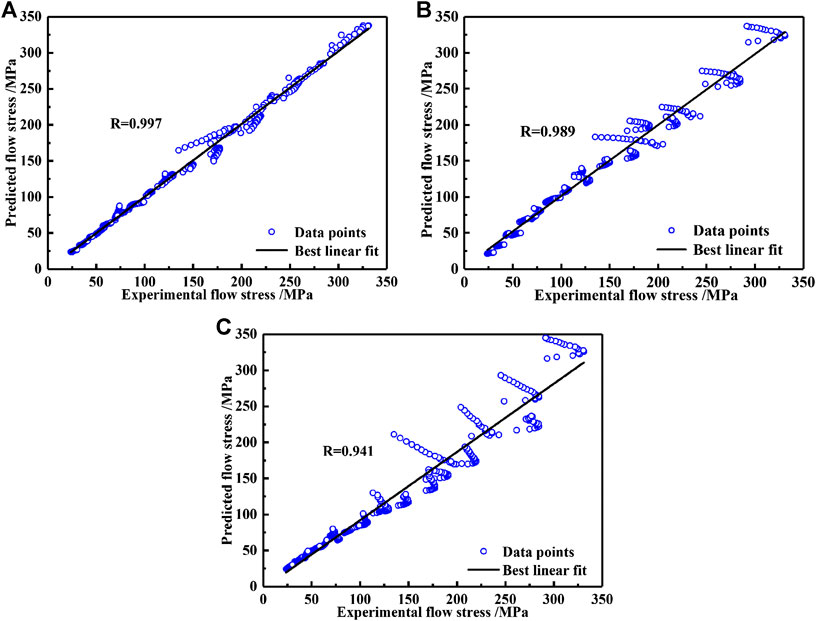
FIGURE 4. Correlation between experimental and predicted flow stress calculated by (A) sc-Arrhenius model; (B) m-JC model; (C) m-ZA model.
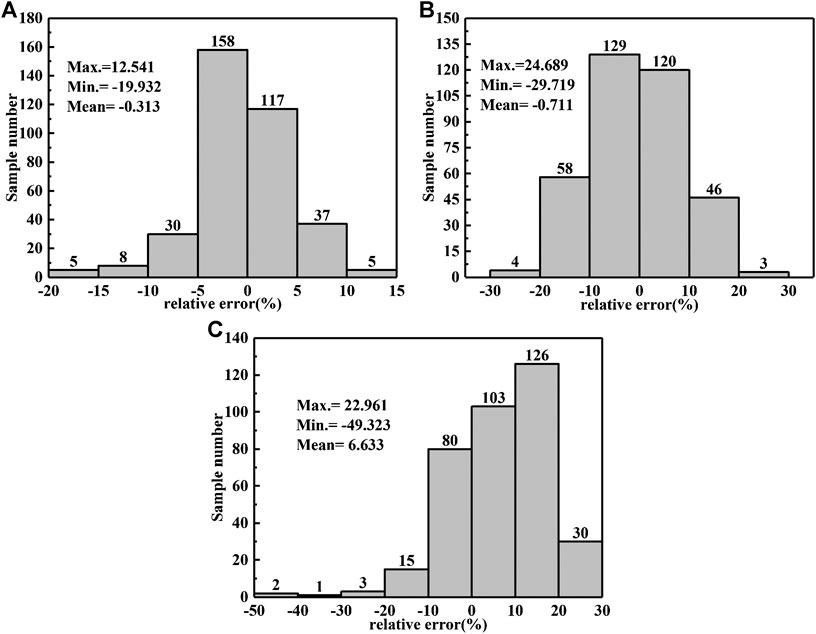
FIGURE 5. Results of relative errors analysis by using (A) sc-Arrhenius model; (B) m-JC model; (C) m-ZA model.

TABLE 6. Results of AARE calculated by the three models.
The highest prediction accuracy of sc-Arrhenius model could be due to the comprehensive consideration of the strain, strain rate, and temperature. Lennon and Ramesh (2004) pointed out that the effects of temperature, strain, and strain rate are coupled together in FCC metals, and thus considering each term independently is unreasonable. Strain-compensated Arrhenius model takes the coupled effect of strain rate and temperature into consideration by using Z parameter, which is equal to
As for m-JC model and m-ZA model, the prediction accuracy deteriorates as the strain rate increases. Under the condition of low strain rate (below 0.1 s−1), the prediction results arise from their method of evaluating the effects of temperature, strain, and strain rate. M-JC model only considers the coupled effect of the strain rate and temperature, while the effect of the strain is considered independently. This method fails to describe the weakening of strain hardening caused by restoration process. Thus, the reduction trend in flow stress cannot be described accurately (e.g., at the condition of 1,023 K and 0.1 s−1). Although m-ZA model considers the coupled effect of strain rate and temperature by parameter C4 and the coupled effect of strain and temperature by parameter C6 (Samantaray et al., 2009), the predicted flow stress at higher strain rate is still little lower than experimental data. This phenomenon results from the fact that parameters C2 and n, which relate to strain hardening, are calculated only using the data at reference strain rate. Thus, it fails to predict the strain hardening behavior at higher strain rate. The same phenomenon is also observed in Samantaray et al.’s work (Samantaray et al., 2009; Samantaray et al., 2011). Additionally, under the condition of high strain rate (above 0.1 s−1), the prediction inaccuracy of m-JC model and m-ZA model attributes to the fact that these deformation conditions are located in the unsteady zone of the studied alloys. Our previous study on processing map has pointed out that the unsteady zone is in the range of 1,023–1,198 K and strain rate is greater than 0.6 s−1 at a true strain of 0.9 (Zhao et al., 2019). Many cracks were observed in the hot compression specimens tested under these conditions, which are responsible for the decrease of flow stress at high strain rate. However, constitutive models fail to take material instability into account, and the calculated results still increase with the strain because of strain hardening. Owing to this reason, the opposite trend between the predicted and experimental results is observed at high strain rate (above 0.1 s−1).
The above results indicate that the constitutive model of sc-Arrhenius model shows the best accuracy for prediction of the flow stress-strain relationship of the hot-deformed Cu-15Ni-8Sn alloy. Here, we further verify the practicability of sc-Arrhenius model in simulation of the hot-extruded Cu-15Ni-8Sn alloy. Usually, for evaluating the practicability of a model, comparing the stress between simulation and experiment is considered as the best method. Given the fact that real-time stress data during the actual extrusion cannot be measured, an indirect method is necessary to be employed to evaluate the practicability. Here, we used finite element analysis (FEA), where the prediction accuracy of temperature, strain, and grain size is all based on the accurate prediction of stress. The accurate simulation of FEA on the basis of Arrhenius model can be considered indirect proof of the practicality of Arrhenius model.
Hot-extrusion experimental methods were described in detail in the above section. Hot-extrusion simulation was performed by using MARC finite element simulation software. Relevant formation parameters are similar to those shown in Table 2. The geometric model was established based on experimental methods. The flow stress database, describing the plasticity, was calculated by the sc-Arrhenius model and linked to simulation software. According to the fact that grain size change during hot-extrusion deformation mainly results from dynamic recrystallization (DRX) (Li et al., 2010; Zhao et al., 2017), DRX is taken into account in the simulation. The final result of simulation was obtained using the data at die outlet, after which no DRX exists. As a comparison, the microstructure of extrusion bar around die outlet was studied.
Figure 6A shows the simulated result of the grain size contour. By analyzing simulation data at the position of die outlet, the grain size distribution map is drawn as shown in Figure 6B. The predicted average grain size is ∼16.7 μm. Figure 7A shows a representative OM image obtained from the extrusion bar around die outlet. Figure 7B shows the grain size distribution map based on more than 50 random OM images. The average grain size is measured as ∼15.5 μm. Comparing the results of simulation and experiment, it can be concluded that sc-Arrhenius model has a great practicability in finite element analysis for hot-deformed Cu-15Ni-8Sn alloys.
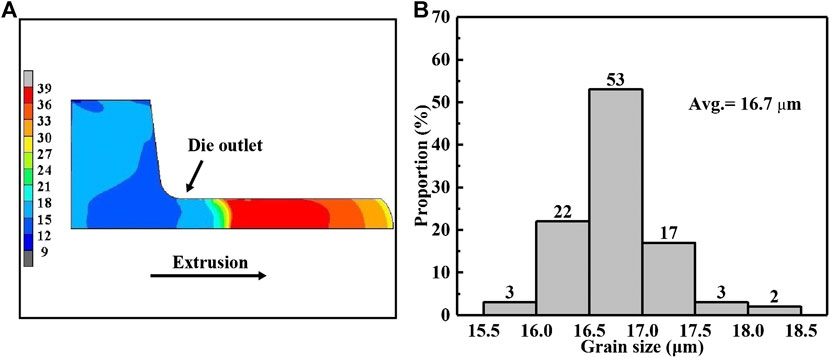
FIGURE 6. The results of hot-extrusion simulation: (A) grain size contour; (B) grain size distribution of the bar around die outlet.
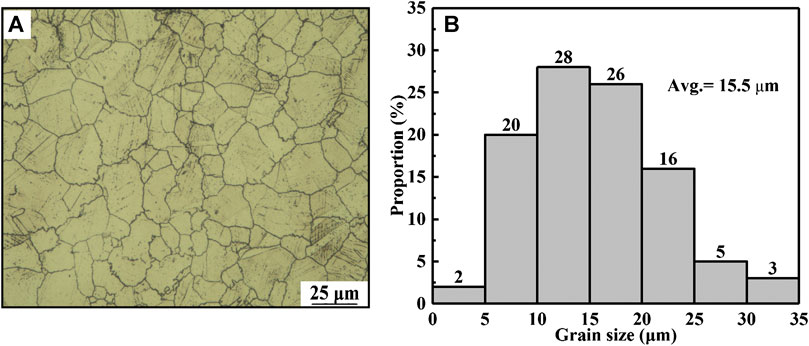
FIGURE 7. The results of hot-extrusion experiment: (A) representative OM image; (B) grain size distribution of the bar around die outlet.
In this article, the hot compression tests of Cu-15Ni-8Sn alloys at different temperatures from 1,023 to 1,173 K and strain rates from 0.001 to 10 s−1 were carried out. Three kinds of constitutive models (sc-Arrhenius model, m-JC model, and m-ZA model) were established and compared with each other. The following conclusions can be drawn:
The strain-compensated Arrhenius model, modified JC model, and modified ZA model of Cu-15Ni-8Sn alloys were established based on hot compression tests, where the sc-Arrhenius model has the highest predictability among the three models. For sc-Arrhenius model, m-JC model, and m-ZA model, the AARE is 0.034, 0.075, and 0.098, respectively, the correlation coefficients are 0.997, 0.989, and 0.941, respectively, and the proportion of samples with relative errors within ±10% is 95, 70, and 51%, respectively.
The practicability of sc-Arrhenius model of the hot-extruded Cu-15Ni-8Sn alloy was verified by performing both simulation and experiment. The simulation and experimental results show similar grain size of 16.7 and 15.5 μm, respectively, indicating that sc-Arrhenius model can accurately predict the flow stress behavior of the hot deformation process of Cu-15Ni-8Sn alloy. This model may provide a theoretical basis for optimization of hot-extrusion parameters.
The raw data supporting the conclusions of this article will be made available by the authors, without undue reservation.
DN, CZ, and DL designed the experiments and conducted the data analysis. ZL and WZ provided the experimental resources and conducted experimental supervision. DN organized the database and wrote the first draft of the manuscript. DN, CZ, ZW, and WZ did the writing-review and editing.
This work was sponsored by the Guangdong Natural Science Foundation for Research Team (Grant No. 2015A030312003) and Guangdong Special Fund Project of Applied Technology Research and Development (Grant No. 2016B090931002).
The authors declare that the research was conducted in the absence of any commercial or financial relationships that could be construed as a potential conflict of interest.
Cheng, J. J., Gan, X. P., Li, Z., Lei, Q., and Zhou, K. C. (2020). Wear map for sliding wear behavior of Cu-15Ni-8Sn alloy against bearing steel under oil-lubricated condition. J. Cent. South Univ. 27 (2), 311–324. doi:10.1007/s11771-020-4297-y
Cribb, W. R., Gedeon, M. J., and Grensing, F. C. (2013). Performance advances in copper-nickel-tin spinodal alloys. Adv. Mater. Process. 171 (9), 23–28. doi:10.1016/j.actamat.2013.07.017
Grujicic, M., Pandurangan, B., Yen, C.-F., and Cheeseman, B. A. (2012). Modifications in the AA5083 johnson-cook material model for use in friction stir welding computational analyses. J. Mater. Eng. Perform. 21 (11), 2207–2217. doi:10.1007/s11665-011-0118-7
He, X., Yu, Z., and Lai, X. (2008). A method to predict flow stress considering dynamic recrystallization during hot deformation. Comput. Mater. Sci. 44 (2), 760–764. doi:10.1016/j.commatsci.2008.05.021
Jiang, Y. Z., Li, Z., Xiao, Z., Xing, Y., Zhang, Y., and Fang, M. (2019). Microstructure and properties of a Cu-Ni-Sn alloy treated by two-stage thermomechanical processing. J. Miner. Met. Mater. Soc. 71 (8), 2734–2741. doi:10.1007/s11837-019-03606-5
Kumar, S., Aashranth, B., Davinci, M. A., Samantaray, D., Borah, U., and Bhaduri, A. K. (2018). Assessing constitutive models for prediction of high-temperature flow behavior with a perspective of alloy development. J. Mater. Eng. Perform. 27 (4), 2024–2037. doi:10.1007/s11665-018-3237-6
Lennon, A. M., and Ramesh, K. T. (2004). The influence of crystal structure on the dynamic behavior of materials at high temperatures. Int. J. Plast. 20 (2), 269–290. doi:10.1016/s0749-6419(03)00037-8
Li, H., Lu, M., and Luo, J. (2010). “The modulus mensuration of Yada model and the microstructure simulation of casting AZ31 magnesium alloy,’ in Manufacturing science and engineering, pts 1-5. Editors Z. Jiang, and C. L. Zhang, 75–80.
Li, Z., Jiang, Y. X., Peng, G. W., and Gan, X. P. (2017). Effect of dynamic strain aging on the deformation behavior and microstructure of cu-15ni-8sn alloy. J. Alloys Compd. 718 (2017), 182–187. doi:10.1016/j.jallcom.2017.05.127
Lin, Y.-C., Chen, M.-S., and Zhang, J. (2009). Modeling of flow stress of 42CrMo steel under hot compression. Mater. Sci. Eng. 499 (1–2), 88–92. doi:10.1016/j.msea.2007.11.119
Luo, B., Li, D., Zhao, C., Wang, Z., Luo, Z., and Zhang, W. (2019). A low Sn content Cu-Ni-Sn alloy with high strength and good ductility. Mater. Sci. Eng. 746, 154–161. doi:10.1016/j.msea.2018.12.120
Rudra, A., Ashiq, M., Das, S., and Dasgupta, R. (2019). Constitutive Modeling for Predicting High-Temperature Flow Behavior in Aluminum 5083+10 Wt Pct SiCp Composite. Metall. Mater. Trans. B 50 (2), 1060–1076. doi:10.1007/s11663-019-01531-1
Samantaray, D., Mandal, S., Borah, U., Bhaduri, A. K., and Sivaprasad, P. V. (2009). A thermo-viscoplastic constitutive model to predict elevated-temperature flow behaviour in a titanium-modified austenitic stainless steel. Mater. Sci. Eng. 526 (1–2), 1–6. doi:10.1016/j.msea.2009.08.009
Samantaray, D., Mandal, S., Phaniraj, C., and Bhaduri, A. K. (2011). Flow behavior and microstructural evolution during hot deformation of AISI Type 316 L(N) austenitic stainless steel. Mater. Sci. Eng. 528 (29–30), 8565–8572. doi:10.1016/j.msea.2011.08.012
Singh, J. B., Cai, W., and Bellon, P. (2007). Dry sliding of Cu-15 wt%Ni-8 wt%Sn bronze: wear behaviour and micro structures. Wear 263, 830–841. doi:10.1016/j.wear.2007.01.061
Umbrello, D., M’Saoubi, R., and Outeiro, J. C. (2007). The influence of Johnson-Cook material constants on finite element simulation of machining of AISI 316L steel. Int. J. Mach. Tool Manufact. 47 (3–4), 462–470. doi:10.1016/j.ijmachtools.2006.06.006
Wang, J. B., Zhou, X. L., Li, J., Brochu, M., and Zhao, Y. F. (2020). Microstructures and properties of slm-manufactured Cu-15Ni-8Sn alloy. Addit. Manuf. 31, 100921. doi:10.1016/j.addma.2019.100921
Wang, Y., Zhou, Y. X., and Xia, Y. M. (2003). A constitutive description of tensile behavior for brass over a wide range of strain rates. Mater. Sci. Eng. 372, 186–190. doi:10.1016/j.msea.2003.12.00
Yang, X. K., Wang, K. S., Zhang, Z. J., Guo, M., Cai, J., and Yang, Q. X. (2020). Flow stress prediction for as-cast TC17 titanium alloy. Rare Met. Mater. Eng. 49 (4), 1131–1139.
Zerilli, F. J., and Armstrong, R. W. (1987). Dislocation-mechanics-based constitutive relations for material dynamics calculations. J. Appl. Phys. 61 (5), 1816–1825. doi:10.1063/1.338024
Zhang, Y., Sun, H., Volinsky, A. A., Tian, B., Song, K., Wang, B., et al. (2017a). Hot workability and constitutive model of the Cu-Zr-Nd alloy. Vacuum 146, 35–43. doi:10.1016/j.vacuum.2017.09.017
Zhang, Y., Xiao, Z., Zhao, Y., Li, Z., Xing, Y., and Zhou, K. (2017b). Effect of thermo-mechanical treatments on corrosion behavior of Cu-15Ni-8Sn alloy in 3.5 wt% NaCl solution. Mater. Chem. Phys. 199, 54–66. doi:10.1016/j.matchemphys.2017.06.041
Zhao, C., Wang, X., Yu, Y. G., Luo, Z. Q., and Zhang, W. W. (2017). Microstructure evolution of hot-extruded Cu-15Ni-8Sn alloy with different extrusion ratios. Mater. Sci. Forum 898, 1140–1147. doi:10.4028/www.scientific.net/MSF.898.1140
Zhao, C., Wang, Z., Li, D., Pan, D., Lou, B., Luo, Z., et al. (2020). Optimization of strength and ductility in an as-extruded Cu-15Ni-8Sn alloy by the additions of Si and Ti. J. Alloys Compd. 823, 153759. doi:10.1016/j.jallcom.2020.153759
Keywords: Cu-15Ni-8Sn alloy, hot deformation, flow stress behavior, constitutive models, simulation
Citation: Niu D, Zhao C, Li D, Wang Z, Luo Z and Zhang W (2020) Constitutive Modeling of the Flow Stress Behavior for the Hot Deformation of Cu-15Ni-8Sn Alloys. Front. Mater. 7:577867. doi: 10.3389/fmats.2020.577867
Received: 30 June 2020; Accepted: 06 November 2020;
Published: 16 December 2020.
Edited by:
Massimiliano Fraldi, University of Naples Federico II, ItalyReviewed by:
Qiao Yanxin, Jiangsu University of Science and Technology, ChinaCopyright © 2020 Niu, Zhao, Li, Wang, Luo and Zhang. This is an open-access article distributed under the terms of the Creative Commons Attribution License (CC BY). The use, distribution or reproduction in other forums is permitted, provided the original author(s) and the copyright owner(s) are credited and that the original publication in this journal is cited, in accordance with accepted academic practice. No use, distribution or reproduction is permitted which does not comply with these terms.
*Correspondence: Weiwen Zhang, bWV3emhhbmdAc2N1dC5lZHUuY24=
Disclaimer: All claims expressed in this article are solely those of the authors and do not necessarily represent those of their affiliated organizations, or those of the publisher, the editors and the reviewers. Any product that may be evaluated in this article or claim that may be made by its manufacturer is not guaranteed or endorsed by the publisher.
Research integrity at Frontiers
Learn more about the work of our research integrity team to safeguard the quality of each article we publish.