 Sara Mohamadi
 David Lattanzi
 Hoda Azari
- 1Department of Civil, Environmental, and Infrastructure Engineering, George Mason University, Fairfax, VA, United States
- 2Turner-Fairbank Highway Research Center, McLean, VA, United States
To maintain infrastructure safety and integrity, nondestructive evaluation (NDE) technologies are often used for detection of subsurface defects and for holistic condition assessment of structures. While the rapid advances in data collection and the diversity of available sensing technologies provide new opportunities, the ability to efficiently process data and combine heterogeneous data sources to make robust decisions remains a challenge. Heterogeneous NDE measurements often conflict with one another and methods to visualize integrated results are usually developed ad hoc. In this work, a framework is presented to support fusion of multiple NDE techniques in order to improve both detection and quantification accuracy while also improving the visualization of NDE results. For data sources with waveform representations, the discrete wavelet transform (DWT) is used to extract salient features and facilitate fusion with scalar-valued NDE measurements. The description of a signal in terms of its salient features using a wavelet transform allows for capturing the significance of the original data, while suppressing measurement noise. The complete set of measurements is then fused using nonparametric machine learning so as to relax the need for Bayesian assumptions regarding statistical distributions. A novel visualization schema based on classifier confidence intervals is then employed to support holistic visualization and decision making. To validate the capabilities of the proposed methodology, an experimental prototype system was created and tested from NDE measurements of laboratory-scale bridge decks at Turner-Fairbank highway research center (TFHRC). The laboratory decks exhibit various types of artificial defects and several non-destructive tests were previously carried out by research center technicians to characterize the existing damages. The results suggest that the chosen feature extraction process, in this case the DWT, plays a critical role in classifier performance. The experimental evaluation also indicates a need for nonlinear machine learning algorithms for optimal fusion performance. In particular, support vector machines provided the most robust and consistent data fusion and defect detection capabilities. Overall, data fusion combinations are shown to provide more accurate and consistent detection results when compared to single NDE detection approaches, particularly for the detection of subsurface delamination.
Introduction
To preserve infrastructure safety and integrity, reliable and effective damage detection techniques need to be established. Increasingly, nondestructive evaluation (NDE) technologies are used for the detection of surface and subsurface defects, evaluation of the extent of defects, and as a critical aspect of holistic asset management. A key challenge with NDE is that the accuracy of the data from a single source is dependent on operator training and environmental conditions that can add considerable uncertainty to defect detection and quantification (McCann and Forde 2001). From a practical standpoint, this measurement uncertainty has inhibited the adoption of NDE across many application domains.
To reduce measurement uncertainty, researchers have explored the concept of using multiple NDE methods in conjunction with data fusion algorithms. Recent advances in sensing and data analytics have led to the adoption of data fusion in fields such as computer vision and image analysis (Chen et al., 2017), transportation systems (Faouzi, Leung, and Kurian 2011; Faouzi and Klein 2016), biometrics (Haghighat, Abdel-Mottaleb, and Alhalabi 2016), and structural health monitoring (Sun et al., 2016; Wu and Jahanshahi, 2018; Ramos et al., 2015; Chen et al., 2017; Habib et al., 2016; Kralovec and Schagerl, 2020). In these cases, the use of data fusion was shown to provide a better interpretation of observed information by decreasing the measurement uncertainty present in individual source data (Faouzi and Klein, 2016).
Data fusion encompasses a vast array of analytical methods ranging from Bayesian probabilistic approaches, Dempster–Shafer (DS) evidence approaches, fuzzy reasoning, and machine learning (Wu and Jahanshahi, 2018; Khan and Anwar, 2019). These methods have been used for damage identification, quantification, and system response estimates (Hall and Llinas, 2001; Chair and Varshney, 1986; Liu et al., 1999; Vanik et al., 2000). For example, a recursive Bayesian framework was used to update the parameters of a crack growth model, as well as the probability distribution of the crack size and crack growth rate (Rabiei and Modarres, 2013), and a neural network and fuzzy inference were combined to evaluate the structural condition of a cable bridge (Sun et al., 2016).
Data fusion can generally be carried out at various “levels” of data processing ranging from combinations of raw data to a fusion of individual operational decisions (Steinberg and Bowman, 2017). Data-level fusion refers to combining raw data directly and it is possible only if the sensors measure the same physical quantities. On the other hand, if the survey observations are heterogeneous, then the data must be fused at the feature-level or decision-level. For feature-level fusion, a vector of data descriptors is extracted from the raw measurements of individual NDE results and the features are then combined together into a single concatenated descriptor vector (Chen and Jen, 2000). This combined vector can be further processed through machine learning techniques based on neural networks or clustering algorithms (Kittler 1975; Sun et al., 2016). Once features are fused through machine learning, the resulting output reflects the correlations in data content and reduces the uncertainty of results. Decision-level fusion is the blending of operational decisions derived from individual data streams considered in isolation. Decision-level fusion naturally leads to loss of performance, but this type of fusion represents a feasible fusion approach when fusion at lower levels is not practical or advisable.
Frequently applied fusion methods in structural health monitoring include: Bayesian probabilistic approaches including techniques such as Kalman filtering (Vanik et al., 2000; Rabiei and Modarres, 2013; Ramos et al., 2015), Dempster–Shafer (DS) evidential reasoning (Wu, 2004; Huang et al., 2014), and machine learning algorithms such as artificial neural networks (ANN) (Chen and Jahanshahi, 2018; Jiang et al., 2011) or support vector machines (SVM) (Zhou et al., 2015). SHM applications tend to focus on the fusion of time-series sensor data, such as from accelerometers, to reduce measurement and state-estimation uncertainty.
In this work, the application of machine learning driven data fusion to the NDE assessment of concrete bridge decks is considered. Bridge deck deterioration plays a critical role in highway asset management due to the costs and traffic disruptions associated with deck repair and replacement. While pattern analysis and machine learning have been studied for use with individual concrete NDE methods, they have not been considered as a basis for data fusion. Furthermore, how the results of NDE data fusion can be intuitively visualized and assessed holistically by engineers remains an under-studied problem.
The primary contributions of this work are:
•A wavelet-based approach to extracting statistically relevant features from NDE waveforms
•A non-parametric machine learning approach to the fusion of NDE data features
•A novel visualization schema for representing the fused results and measurement uncertainty
In order to best illustrate the benefits of NDE fusion, the machine learning models developed in this work were trained and evaluated for the detection of single defect classes (binary classification). As such, they do not provide defect diagnosis across a range of observed defects. Such considerations may lead to different conclusions regarding fusion efficacy and are an avenue for future work.
The remainder of this paper is structured as follows. First, the overall methodological framework is presented. This is followed by an experimental case study to illustrate the behavior and performance of the approach, based on laboratory scale data collected at the Turner-Fairbank Highway Research Center (TFHRC). The NDE data for this case study was captured in a manner that mimicked the NDE systems available onboard an inspection robot developed at TFHRC, illustrating a potential practical application for the proposed framework. The following NDE methods were considered (see Experimental Validation for more details): ultrasonic surface waves (USW), impact echo (IE), ground penetrating radar (GPR), electrical resistivity (ER), ultrasonic tomography (UT), half-cell potential (HCP), infrared thermography (IRT), and impulse response (IR). The paper concludes with a discussion of outstanding research efforts that must be considered prior to practical implementation.
Methodology
The primary focus of this study was on the development of a feature-level fusion approach (Figure 1). A decision-level fusion approach was also developed for comparative purposes and is discussed in Decision Fusion. First, data from multiple NDE sources are preprocessed for spatial registration and salient numerical features are extracted from each NDE data source. Feature extraction is achieved through the discrete wavelet transform (DWT). Once extracted, features are combined into a concatenated feature (descriptor) vector. This feature vector then serves as input to a supervised machine learning classifier trained to detect subsurface defects in the concrete specimen. For model training, features extracted from test data were manually labeled to generate a ground truth. Once the machine learning model assesses the likelihood of a defect at each location along a bridge deck, the probability of occurrence of damage across the deck is visualized as a red-blue heatmap.
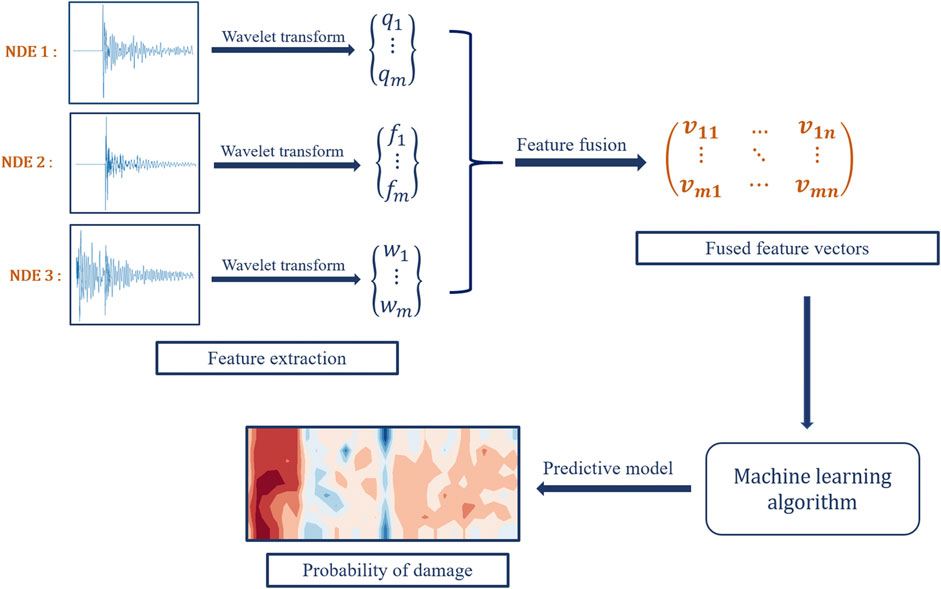
FIGURE 1. Schematic overview of the proposed methodology for multiple NDE feature fusion.
Data Preprocessing
Data preprocessing encompasses a range of tasks such as data cleaning, data transformation, and feature extraction (Nantasenamat et al., 2009). In this work, the emphasis for data preprocessing is on making heterogeneous NDE datasets spatially compatible followed by feature extraction. Even for robotic multi-NDE systems, discrepancies in the location of measurements is inevitable. To accommodate, measurements are linearly interpolated onto a consistent 2D grid spacing. Incomplete data is also an inevitable problem in handling most real-world data sources, and is interpolated as well.
Some NDE techniques provide scalar valued measurements at each test point (e.g., HCP or ER) while others produce a waveform result (e.g., IE or GPR). This data heterogeneity necessitates fusion at either the feature or decision-level. To fuse at the feature-level, numerical feature must first be extracted from waveform measurements. These descriptors are then concatenated with scalar response data (Figure 2).
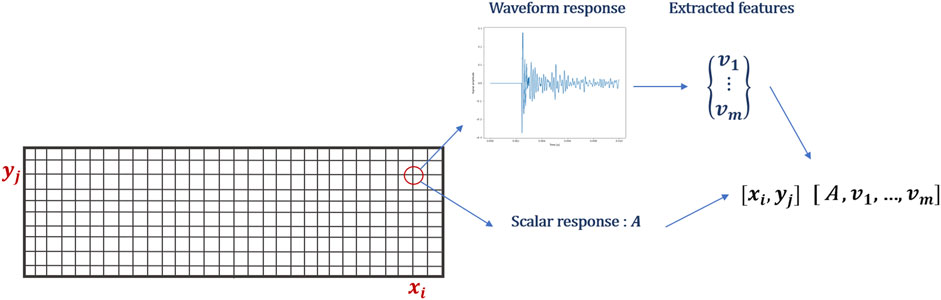
FIGURE 2. Combining scalar and waveform responses of interpolated data.
Waveform Feature Extraction
Feature extraction refers to the process of extracting statistically salient numerical descriptors from the original data. In most conventional approaches to NDE data analysis, feature extraction has focused on reducing an NDE waveform measurement to a single scalar-valued representation. For data fusion, such approaches dramatically reduce the amount of relevant information. The wavelet transform is a time-frequency analysis technique that is commonly used for advanced signal processing (Daubechies, 1992). It was developed as an alternative to the short time Fourier (Mallat 1989; Nouri Shirazi et al., 2014) to overcome problems related to the simultaneous representation of frequency and time resolution properties. Compared to a traditional Fourier analysis, a wavelet transformation has the ability to simultaneously reproduce temporal and scale data, making it better suited for analyzing signals that are periodic, transient (or non-stationary), and noisy. As a result, wavelet transforms are increasingly employed in numerous applications for feature extraction (Epinat et al., 2001; Ghazali et al., 2007; Luk et al., 2008; Al Ghayab et al., 2019). In particular, wavelet transforms have recently seen use in SHM and NDE analysis, for instance in the assessment of acoustic IE measurements of concrete slabs (Saadat et al., 2004; Khatam et al., 2007; Yeh and Liu, 2008; Hou et al., 2015).
Wavelets can be considered as a family of functions constructed from translations and dilations of a single function called the “mother wavelet” (t) (Mallat, 2009). They are defined by the following equation:
The parameter a is the scale, and it measures the degree of compression. The parameter b is the translation parameter that determines the time location of the wavelet and t is time (Debnath and Shah, 2014). For a signal (t), the transformed wavelet representation of the signal, Ws, at scale a, position b is defined as an inner product:
The wavelet transform can be implemented in either a continuous or discrete form. The widely used DWT is employed in this study. DWT is an adaptive decomposition which decomposes a signal with high- and low-pass filters and increases the frequency resolution in lower frequency bands (Zhang et al., 2018a). The DWT decomposes a signal onto a set of bases that correspond to different time and frequency scales or resolutions (Figure 3). At the first stage of decomposition, the initial signal is decomposed into approximation and detail coefficients. The first level approximation coefficients are further decomposed into second-level approximation and detail coefficients, and the process is repeated, resulting in levels of approximation and detail that capture both frequency and time domain information about a signal (Zhang et al., 2016). The approximations are the high-scale, low-frequency components of the signal, while the details are low-scale, high frequency. This wavelet decomposition also suppresses signal noise, effectively serving to denoise the signals prior to data fusion.
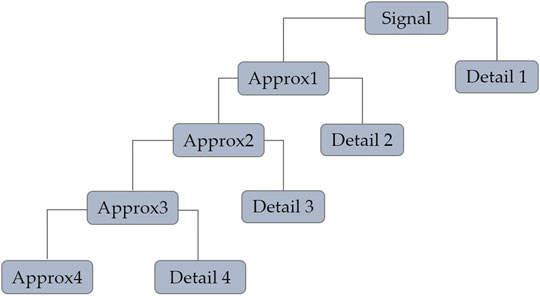
FIGURE 3. Schematic discrete wavelet transforms for the four-level Symlet wavelet decomposition used in this work.
In this work, a fourth order variant of the Daubechies wavelet, known as the Symlet wavelet, is used in conjunction with the DWT. This particular wavelet feature extraction approach was first developed in (Zhang et al., 2016) for the analysis of IE data. In this study, this wavelet extraction approach is applied to both IE and GPR signals. Both IE and GPR signals are considered transient in nature with nonstationary noise characteristics, indicating that they are well suited for wavelet representation (Zhang et al., 2018b). Based on prior studies and empirical analysis by the authors, a four-level decomposition is adopted for both IE and GPR signals and decomposition, as illustrated in Figure 4. After decomposition and reconstruction of sub-signals, four features are extracted from each wavelet basis. The root mean square (i.e., average power of signal), standard deviation (i.e., Second spectral moment), kurtosis (i.e., Third spectral moment) and skewness (i.e., Fourth spectral moment). Overall, this results in 20 features for each original measurement signal. These features extracted from IE and GPR signals are later combined into a vector as an input to a given statistical model. The functions for feature calculation are defined as follows:
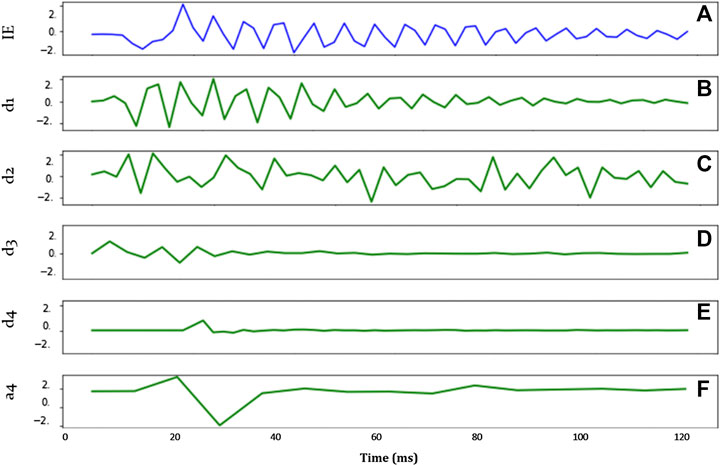
FIGURE 4. A) Original IE signal; (B–E) reconstructed detail coefficients at level 1(B), level 2 (C), level 3(D), level 4(E); (F) reconstructed approximation coefficients at level 4.
Let
Data Interpolation
In a multi-NDE assessment scenario, the goal is to capture measurements at identical locations across an assessment area. However, the practicalities of NDE mean that it is typically not possible to achieve this goal. For instance, in the experimental study of this work, NDE measurement spacing was not consistent across NDE techniques and there were intermittent missing measurements. Prior to data fusion, NDE values must be interpolated onto a consistent grid spacing. In the example shown in Figure 5, the grid spacings of measurements NDE 1 and NDE 2 are different. Features from NDE 2 are measured at grid points x0, x, and x1, resulting in measurements u0, u, and u1. Features extracted from NDE 1 are only measured at grid points x0 and x1 (measurements f0 and f1). The features f at location x are linearly interpolated via first order polynomial. The relationship between spatially distributed NDE measurements is not well-defined, and more complex interpolation approaches could prove more suitable. This is one potential avenue for future study.
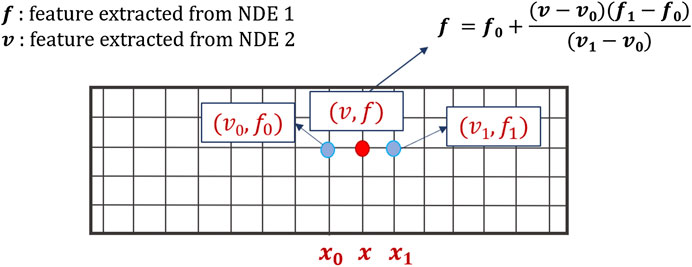
FIGURE 5. Linear interpolation of NDE data.
Data Fusion
As discussed previously, feature and decision-level fusion are considered in this study because the heterogeneity of bridge deck NDE data prohibits the use of data level fusion. In general, the “higher up” in the fusion ontology from data to decision-level, the greater the loss of information. As such, it is generally advisable to fuse data at the lowest possible level, motivating the focus on feature-level fusion in this work.
The general concept is to take the concatenated set of wavelet features extracted from each NDE measurement (Waveform Feature Extraction) at each location and use the combined vector of features as the inputs into a statistical model that associates the vector with a statistical assessment of material condition. Here this statistical model takes the form of a statistical classification problem, one that classifies a feature vector as being a member of either a “detected defect” or “sound concrete” assessment class. Multiclass classifications are also possible, though they were not extensively studied here due to limited data availability (see Experimental Validation for more details). Ultimately, the end result is that the raw data from each NDE source is effectively fused together to provide an enhanced assessment.
There are a broad range of classification algorithms that can be used such purposes. Generally, they can be divided into parametric and nonparametric methods. Parametric techniques make assumptions about the underlying statistical distribution or the measurement uncertainty of observations in order to enable inference. Implicitly, such techniques often require statistical stationarity, as well as consistent and quantifiable measurement uncertainty. The alternative are nonparametric fusion methods. Nonparametric methods relax assumptions regarding underlying statistical distributions and instead construct a model of measurement states from sets of existing data (Tsiliki and Kossida, 2011). Such approaches have the advantage of being applicable to highly complex and nonlinear statistical problems. Machine learning approaches have become the dominant paradigm for nonparametric data fusion, with ANN and SVM as the most widely used approaches. ANN have the advantage of being more flexible with respect to data input and can be highly tuned for optimization to a specific problem domain. SVM have fewer user parameters (hyperparameters), making them more suitable for rapid prototyping and problems with less data available for model training (Dong et al., 2009). Given the limited size of the available data sets for prototyping, the focus here is on the use of SVM. The behavior of several other methods are presented as well for comparative purposes. These methods included: logistic regression, decision tree-based models and ANN. The weighted decision-level fusion is also studied and is briefly discussed (Lu and Michaels, 2009; Heideklang and Shokouhi, 2013).
Conventional machine learning performance metrics are used to assess data fusion capabilities, including confusion matrices, ROC curves and F1 scores (Fawcett, 2006). While classifiers typically produce a discrete classification, statistical probabilities are used for class separation. This statistical probability provides a more nuanced representation of classifier performance, and can be used for holistic assessment and visualization purposes (see Holistic Visualization for details).
Feature Fusion - SVM
SVM are a group of algorithms that were originally designed for binary classification, and gained popularity due to promising performance in a wide range of applications (Cortes and Vapnik, 1995; Cristianini and Shawe-Taylor, 2000; Ruiz and Lopez-de-Teruel, 2001). SVMs attempt to discriminate between classes of data by finding the optimal high-dimensional hyperplanes that bisect the data, and then combining these hyperplane bi-sections to enable more complex reasoning. The original data points from an input feature vector are projected by a kernel function into a higher dimension feature space (Figure 6). In this space, SVM tends to find the hyperplane that separates the data with the largest margin. The method places class-separating hyperplanes in the original or transformed feature space, and the new sample is labeled with the class label that maximizes the decision function—the distance between support vectors (Boser et al., 1992; Vapnik, 2000).
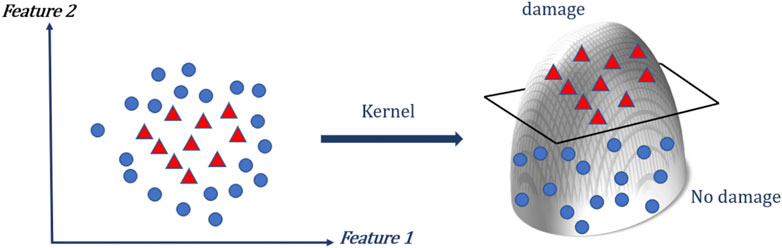
FIGURE 6. Support Vector Machine illustration of projection of 2D data into a higher dimension through kernel function projection.
The SVM is especially suited for scenarios with smaller sample sizes, as is the case for many NDE assessment scenarios (Luts et al., 2012). In contrast to other algorithms, SVM tends to use all available features, even if they are not of real statistical importance, and therefore requires more care regarding cleaning and preprocessing of the input data.
SVM Standardization
Standardization (i.e., feature scaling) refers to the process of rescaling the values of the input variables so that they share a common scale, in order to reduce classifier biasing. Standardization is an important step for SVM classifiers. For instance, many elements used in the RBF kernel of Support Vector Machines assume that all features are centered around 0 and have variance in the same order. If a feature has a variance that is orders of magnitude larger than others, it can potentially dominate the objective function and make the estimator unable to learn from other features. Data standardization also can speed up training time of SVM by starting the training process for each feature within the same scale (Kotsiantis et al., 2006). Here, features are standardized by removing the mean and scaling to a unit variance. The standard score of a sample x is calculated as:
where u is the mean of the training samples and s is the standard deviation of the training samples (Shanker et al., 1996). Centering and scaling happen independently on each feature by computing the relevant statistics from samples in the training set. These scaling parameters are then applied to the test data.
Hyperparameter Identification
Prior to model training and fitting, the model hyperparameters must be optimized (Wang et al., 2010). Good model selection is the key to getting good performance from any machine learning algorithm. Also, if the hyperparameters are not selected appropriately, an SVM may take an unduly long time to train (Nalepa et al., 2018). The SVM model contains two main parameters that must be optimized: the kernel function used for dimensional reprojection, and the regularization parameter (c). SVM algorithms can use different types of kernel functions such as linear, polynomial, sigmoid, and radial basis functions (RBF). The regularization parameter (c) is used to prevent overfitting. In this study, a hyperparameter search (grid search) is performed across combinations of different kernel functions and regularization parameters. The performance of the selected hyperparameters and resulting trained model is then measured on a dedicated evaluation set that was not used during formal model selection and training. Different combinations of hyperparameters are compared against each other based on model predictive performance. For the experimental data set discussed in Experimental Validation, a combination of the Radial Based Function and regularization parameter, c, equal to unity showed the best performance among all combinations.
Other Considered Classifiers
To provide a point of comparison with SVM data fusion, logistic regression, decision trees, and ANN are presented and evaluated here as well. Logistic regression is a simple, parametric machine learning algorithm which assumes a linear mapping function between input data and output classification, and has been used extensively in the data fusion literature (Pigeon et al., 2000; Sohn and Lee, 2003). Generally, this function is a linear combination of the input variables. The benefit of the algorithm is that it does not require as much training data as methods such as methods such as SVM and ANN, however it is constrained to the specified logistic functional form, which may or may not be sufficiently accurate. As will be shown in Experimental Validation, since logistic regression is only suitable for linear problems, its performance was strongly biased to one of the technique’s results and did not provide a true fusion of information for NDE data.
Tree-based learning models such as the Decision tree (DT) classifier are nonparametric algorithms that first select the best feature for an initial separation of the data (root node) using the concept of information gain ratio. It then builds subtrees and nodes in a recursive manner that splits the data into classes based on an evaluation of each feature in an input vector (Demirbas, 1989). Decision trees generally work better for larger datasets and are prone to overfitting.
An ANN employs a complex network of nonlinear response functions, with the value of each function in the network weighted based on an optimized fitting to training data (Zhang et al., 2017). The input “layer” of the network can range from combinations of raw data to a set of extracted data features to a numerical representation of a set of decisions. The output can be a layer of the same size and type as the input, or smaller. Increasing the complexity of an ANN architecture allows for more nonlinear and sophisticated representations and fusions and is the basis for modern deep learning strategies. However, such increases in complexity typically require even larger increases in the amount of training data used to find network weights. Similarly, SVM outperformed the ANN in the preliminary analysis. The reason is that unlike ANNs, the computational complexity of SVMs does not depend on the dimensionality of the input space. ANNs use empirical risk minimization, while SVMs use structural risk minimization. The reason that SVMs often outperform ANNs in practice, particularly for smaller data sets, is that SVMs are less prone to overfitting (Olson and Dursun, 2008). In recent years, deep learning–based approaches have become popular across research fields due to their ability to automatically learn meaningful feature representations from the raw data (Hinton et al., 2006; Najafabadi et al., 2015). However for smaller dataset sizes, such as those in this study, deep learning algorithms do not perform well and become prone to overfitting (Brownlee, 2017).
Decision Fusion
Decision-level fusion combines information after each sensor source has been independently processed to make a preliminary determination of the existence of damage. Such fusions are valuable when an effective workflow for using a single data source in decision making already exists. Decision-level fusion then allows those existing workflows to be integrated and combined. As a point of comparison, the weighted decision combination algorithm (Hall and Llinas, 2001) was used in this study.
Weighted decision making assumes that each individual assessment has its own weight with respect to accuracy or validity. These weights can be assumed equal for simplicity, however usually the decision from a data source with less precision and confidence is assigned a smaller weight contribution prior to the fusion. For classification tasks, the selection of appropriate thresholds is needed to assign the predicted damage pattern. This method therefore requires a priori assumptions regarding statistical distributions or the uncertainty of any given measurement.
It should be noted that many data fusion techniques can be used for decision-level fusion as easily as they can for feature or data-level fusions. What differs across these levels is the simplicity of the inputs to the algorithms, with data-level fusion requiring the largest and most complex inputs and decision-level requiring the simplest, with correlated requirements for the size of the data necessary for training and testing. Feature-level stands as a flexible compromise between the two extremes.
Holistic Visualization
The developed approach to visualization stemmed from a series of interviews the authors performed with NDE end-users, as well as recent advances in data visualization (Rangwala et al., 2009; Choo et al., 2012). Rather than present the discrete output classification of the machine learner at each measurement location, the model’s statistical confidence in its prediction is presented (Figure 7). To accomplish this, the aggregated detection results across the deck slab are shown as a contour heat map, as is common practice. But rather than indicate a discretized detection, what is shown is in fact the machine learning model’s classification confidence at each location, represented by a probability score ranging from 0.0 (confident in no defect) to 1.0 (confident in a detected defect). Once the probability of a defect’s existence is estimated by the fusion algorithm for each measurement grid location, the grids with the same probability value range are then connected through polygonization. Further polygons are filled with varying shades of color corresponding to their probability score (Figure 8). The heat map uses a two color diverging heat map scale, with varying shades of blue if no defect is more likely, and varying shades of red for a likely detected defect (Moreland, 2009). Lighter color intensity indicates lower model confidence, with a white midpoint suggesting no confidence in an assessment. The resulting heatmap provides end users with a data product that is familiar to them while presenting nuanced information in an intuitive and comprehensible format. Moreover, the confidence thresholds can potentially be tuned and controlled by the end user, as several interview participants requested.
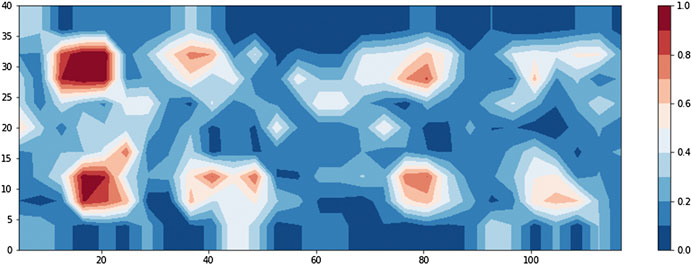
FIGURE 7. Heat map showing confidence of defect prediction.
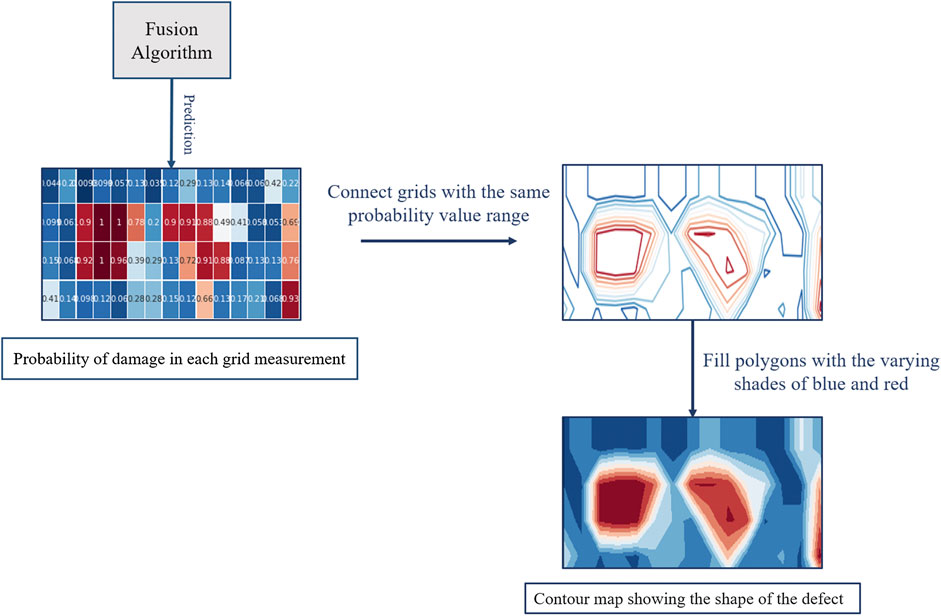
FIGURE 8. Flowchart of the process for generating fusion confidence visualizations.
Experimental Validation
This section presents an experimental study designed to illustrate the potential capabilities of a machine-learning approach to data fusion. Prior to this study, researchers at Turner-Fairbank Highway Research Center (TFHRC) constructed a series of laboratory-scale bridge decks and performed a set of NDE assessments on those decks. Overall, eight NDE techniques were used to collect synchronous data from the specimens. Four of these NDE measurements simulate measurements from the Federal Highway Administration (FHWA) Robotics-Assisted Bridge Inspection Tool (RABIT), a robot designed to perform synchronous multi-NDE assessments of bridge decks (Gucunski et al., 2017; La et al., 2017; Gibb et al., 2018; Ahmed et al., 2020). The other four are commonly used techniques for bridge deck NDE.
The data from these NDE assessments was used to prototype and test the data fusion algorithms discussed in Methodology. The performance of the data fusion algorithm was tested for two different types of defects and NDE methods. The first set of tests focused on deck corrosion detection, while the second sets of tests explored algorithm performance for sub-surface delamination detection.
It is important to note that these experiments were all performed under idealized laboratory conditions. While the test specimens and data are representative of real-world scenarios, environmental conditions and the practicalities of full-scale field assessments will inevitably degrade algorithm behavior. Still, the results of these experiments illustrate the potential benefits of data fusion and serve as motivation for larger-scale testing under field conditions.
Nondestructive Evaluation Data Generation
Researchers at TFHRC constructed eight geometrically identical concrete decks with a series of controlled subsurface defects (Figure 9). These defects included deep and shallow delamination, honeycombing, voids and vertical cracks and accelerated corrosion. The 12 × 8 inch artificial delaminations were built using plexiglass and plastic gutter guards. Two plexiglass sheets with a thickness of 0.093 inches were cut to size, and two layers of plastic gutter guard were placed between the sheets to create an air gap, then the edges were sealed with duct tape. This artificial delamination was used to simulate shallow and deep delaminations at the top and bottom rebar levels. The artificial honeycombing was simulated with a bag of loose aggregates. For each honeycomb defect, 12 lbs of aggregate were placed into mesh bags and the edges were stitched with wire. The mesh bags were then placed in wood molds and secured to the rebar cage. The 23 × 8 × 2 inch voids were simulated with Styrofoam boards, Corrugated plastic sheets with a height of either 6 inches or 2.5 inches, a thickness of 0.16 inch, and a length of 10 inches were used to simulate vertical cracks within the concrete structure. Then the RC decks were then constructed using normal-weight concrete mix with a water-to-cement ratio of 0.37.
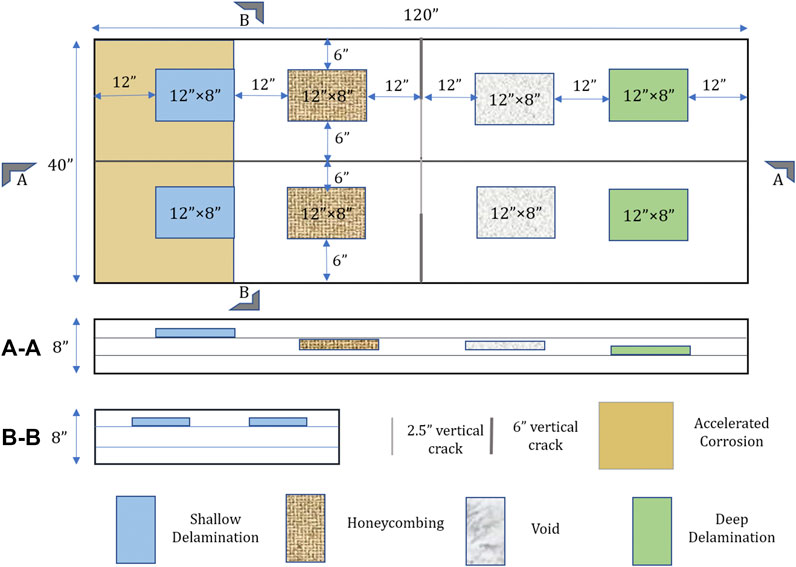
FIGURE 9. Laboratory-scale bridge deck specimen design. Section (A-A) shows the location for each defect type with respect to slab depth. Section (B-B) shows defect placement for shallow delaminations. The placement of other defects in the cross-section is similar, accounting for variations in depth.
After the RC decks were fully cured, prior to data collection, accelerated corrosion was employed to create a corrosive environment with elevated chloride content in the concrete and active corrosion in the pre-corroded rebar. Different levels and uneven distribution of chloride content were introduced by a sponge saturated with NaCl solution. The reader should consult (Meng et al., 2020) for more details on deck construction and the development of the corrosive environment. Of the eight specimens, four also had an overlay. After construction of the test specimens, 8 NDE techniques were used to collect synchronous data from the specimens. Employed technologies included ultrasonic surface waves (USW), IE, GPR, ER (RABIT-based techniques), ultrasonic tomography (UT), HCP, infrared thermography (IRT) and impulse response (IR).
Of all eight NDE techniques, HCP, ER and GPR A-scan data were used in this research for corrosion detection: HCP for detection of corrosion activity, ER for detection of corrosive environment, and GPR for condition assessment. Previous nondestructive testing (NDT) applications on RC decks have demonstrated that ER and GPR can detect corrosive environments in concrete (elevated chloride content in this study), and HCP can detect active corrosion in the reinforcement (Gucunski et al., 2011; Gucunski et al., 2012). For delamination detection, GPR, IE and ER were used for condition assessment. For each specimen, nine gridlines were established with a spacing of 4 inches in the transverse direction, and 29 gridlines with a spacing of 4 inches were set in the longitudinal direction. For all techniques, data was collected on a specific grid spacing across the deck surface, though that spacing varied based on the specific NDE method used. ER, HCP and IE data were collected at grid points, and GPR A-scans were collected along each gridlines. The GPR was set to 36 scan/foot, resulting 322 scans along the longitudinal direction. As discussed in Data Interpolation, the data from each NDE method was linearly interpolated to generate approximate measurements on a consistent grid spacing. The specifics of the data set are shown in Table 1.
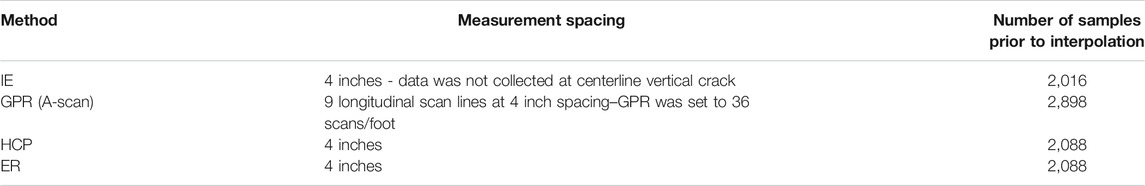
TABLE 1. Details of NDE measurements used for data fusion.
Data Fusion for Corrosion Detection
There are various electrochemical and physical methods for the detection of corrosion in concrete and the advantages and disadvantages of each respective method is well-explained in the literature (Alonso et al., 1988). The study concludes that there is no optimal method, and usually a combination of several techniques is used. For this study, three different NDE methods were chosen for corrosion detection: HCP, GPR, and ER. The HCP technique is a generally accepted method for identifying active corrosion in reinforced concrete bridge decks. The method is supported by an American Society for Testing Materials C876–09 standard (ASTM C876–09 1999). standard with well-defined thresholds distinguishing actively corroded and non-corroded areas. GPR data has been shown to correlate reasonably well with HCP data on bridge decks (Martino et al., 2014). ER probes are also frequently used in corrosion monitoring systems in various industrial fields, especially in the Petro-chemical industry (Legat, 2007). In previous study (Legat et al., 2004) it was shown that measurements with ER probes are efficient for measuring the corrosion of steel in concrete.
The HCP and ER data sources provided scalar values (voltage and resistivity value respectively) at each measurement location, whereas the GPR data was a waveform. Wavelet features were extracted from the GPR signal (including mean power of reconstructed waveform and second, third, and fourth spectral moment of spectrum of reconstructed waveform from each wavelet basis, see Waveform Feature Extraction) and combined with the scalar-valued HCP and ER data for model training and testing. All the values were standardized and hyperparameters were identified prior to training, as discussed in Methodology. Classifiers were then trained using 70% of the data and tested on the remaining 30%. Using the training dataset, the classifier automatically determines an optimal decision boundary, a hypersurface that partitions data into defect and no defect classes. The classifier then classifies all the points on one side of the decision boundary as belonging to one class and all those on the other side as belonging to the other class. Unfortunately, direct interpretation of this hypersurface is challenging, and is a significant downside to machine learning driven analysis.
Corrosion Detection: Results and Discussion
Once the scalar values from ER and HCP data sources and extracted features from GPR waveform are combined into a concatenated vector, this vector is then an input to a statistical model. In this study, as explained in Feature fusion ‐ SVM (Other Considered Classifiers), ANN, decision tree, and logistic regression algorithms are considered to provide a point of comparison to SVM fusion. The performance of all mentioned algorithms are shown in Table 2. The results of this comparative analysis show that the SVM and ANN fusion algorithms produced relatively similar results. Accuracy for the decision tree model was slightly degraded, mostly due to a loss of precision. The logistic regression approach yielded by far the worst results, indicating that the statistical relationships between NDE measurements and corrosion are sufficiently nonlinear in nature to warrant more sophisticated machine learning approaches. Given the comparably performance of the SVM and ANN classifiers, the SVM approach is preferable due to the fewer hyperparameters and reduced risk of model overfitting.
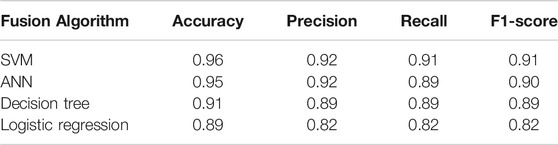
TABLE 2. Comparison of fusion algorithm performance for corrosion detection.
Decision Fusion for Corrosion Detection
As a point of comparison, a decision-level fusion approach was also developed. This approach combined the independent detection assessments of various different NDE methods, weighting them based on their statistical significance, a technique referred to as a Weighted-Sum Model (Hall and Llinas, 2001). Each NDE technique was used to generate an independent decision based on its own features and an SVM classifier, with a binary declaration of either “corrosion” or “no corrosion.” The weight of each decision was then determined. Several metrics for weighting were considered, including false positive rate, probability of detection (recall), and precision (Lu and Michaels, 2009). Using precision as the criterion, the order of weights was GPR > HCP > ER. Considering recall, the order of weights changed to HCP > GPR > ER. For the false positive rate, the resulting weight order was GPR > HCP > ER. The resulting weighted decisions were then combined and compared against the SVM classifier (Table 3). As is shown, the accuracy never reached the level of feature-level fusion via SVM. Similar results were found for decision fusion of delamination defects.

TABLE 3. Comparison of weighted decision combination with various weight order in corrosion detection.
SVM Fusion Analysis
Once SVM was identified as the preferred machine learning method for corrosion detection, a more in-depth analysis of SVM model behavior was performed. In addition to a fusion of all the techniques, different fusion combinations were studied. The goal was to understand the effect of adding an NDE data source to fusion models and identify the best combination of techniques for deck assessment. The following data fusion combinations were tested: ER + HCP, ER + GPR, HCP + GPR, and ER + HCP + GPR. SVM classifiers were also constructed for each NDE type separately. For scalar-valued HCP and ER data a linear function was fit to the data, whereas for the waveform GPR data, wavelet-based features were fit to an SVM model with a RBF function, similar to the model used for the fused case.
Some of these algorithms didn’t increase the corrosion detection accuracy in compare with individual techniques, also their underperformance in comparison with SVM was more for delamination detection.
The resulting Receiver-Operator-Characteristic (ROC) curves from each fusion combination for corrosion detection is shown in Figure 10. The area under a ROC curve is an effective measure of the sensitivity of a classifier to variations in classification thresholds, with a larger area indicating a more robust classifier. What can clearly be seen is that HCP on its own is a highly effective method of quantifying corrosion, whereas ER and GPR perform relatively poorly in isolation. In fact, GPR actually serves to degrade classifier accuracy when fused with HCP data. This behavior is due to the nature of laboratory conditions for the HCP measurements that were idealized, and may not be representative of performance under field conditions. After the RC decks were fully cured, accelerated corrosion was employed with elevated chloride content in the concrete and active corrosion in the pre-corroded rebar. This caused corrosion to occur much faster compared to natural conditions (Meng et al., 2020). This type of accelerated corrosion is ideal for HCP measurements and led to high detection accuracy for HCP (Yuan et al., 2007). Such a result reflects the potential for model biasing that can occur in machine learning. The fusion of all three data sources is slightly better than for HCP or HCP + ER, but these differences are statistically negligible. The most notable result is that the fusion of ER + GPR is measurably better than either measurement on its own, and highlights the value of statistical data fusion.
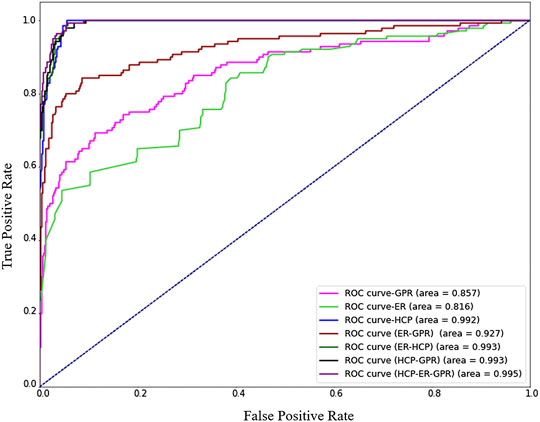
FIGURE 10. Receiver Operating Characteristic curve of Support Vector Machine for corrosion detection.
A visualization heat map for the complete fusion (HCP + ER + GPR) is shown in Figure 11. An analysis of the visualization shows that the certainty of corrosion was degraded near the upper left corner of the slab. Again, the reasons for this loss in detection certainty are likely due to experimental testing conditions.
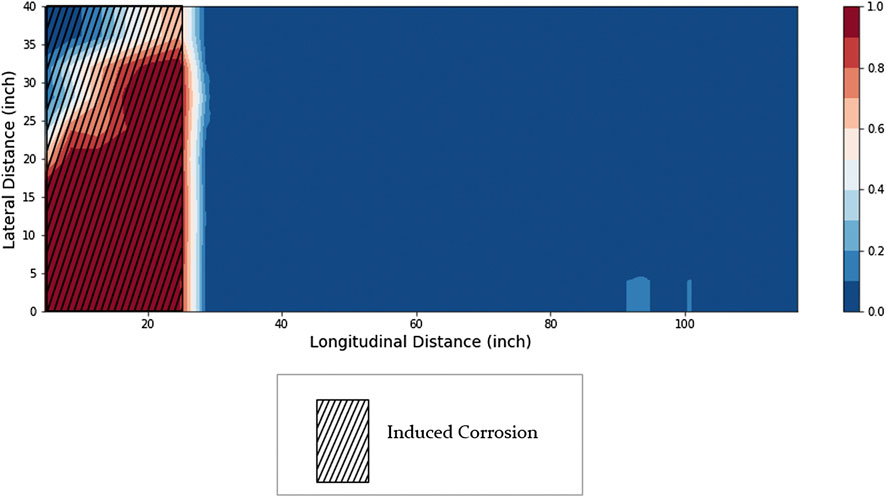
FIGURE 11. Fusion heat map based on Support Vector Machine indicating existence of corrosion in slab.
Data Fusion for Delamination and Crack Detection
To evaluate the impact of data fusion for detecting subsurface delamination and cracks, three NDE methods were considered: GPR, ER and IE. Similar to the procedure for corrosion detection, data from these techniques were combined into a unified dataset. Like GPR, IE produces a waveform signal at each grid location, and wavelet features were extracted from IE and GPR (Waveform Feature Extraction). Once salient features were extracted using wavelet transform, a series of classifiers were prototyped. As with the corrosion tests, the SVM classifier produced the most accurate and robust classifications. Results for the ANN, decision tree, and logistic regression classifiers, as well as the decision-level fusions were similar to the corrosion tests and are not reported here.
Delamination Detection: Results and Discussion
The resulting ROC curves for SVM classifiers for delamination and crack detection are shown in Figure 12, and the resulting heat map is shown in Figure 13. For this set of tests, no single NDE method dominated classifier performance and single-source NDE assessments were consistently poor performers. In all cases, fusions produced substantially improved assessments, and the complete data fusion was substantially better than any other combination. These results not only show that the fusion algorithm significantly improve delamination detection capabilities on their own, but the fusion of any combination of techniques results in a substantial improvement in detection accuracy compared individual techniques. This was most notable for IE data. For example, IE + GPR fusion improved detection accuracy by +50% compared to IE and GPR detection. These results show the most dramatic improvements from data fusion observed in this study and should be the focus of future data fusion efforts.
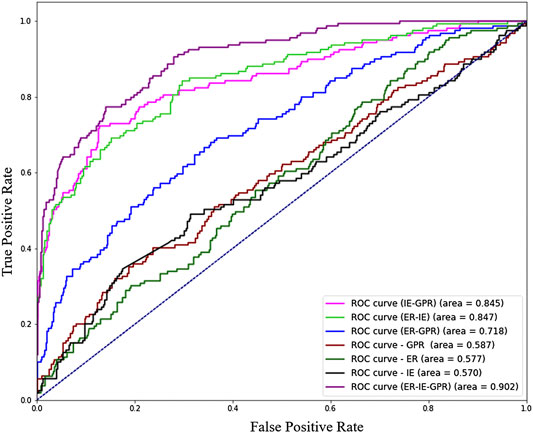
FIGURE 12. Receiver Operating Characteristic curve of Support Vector Machine classifiers for delamination detection.
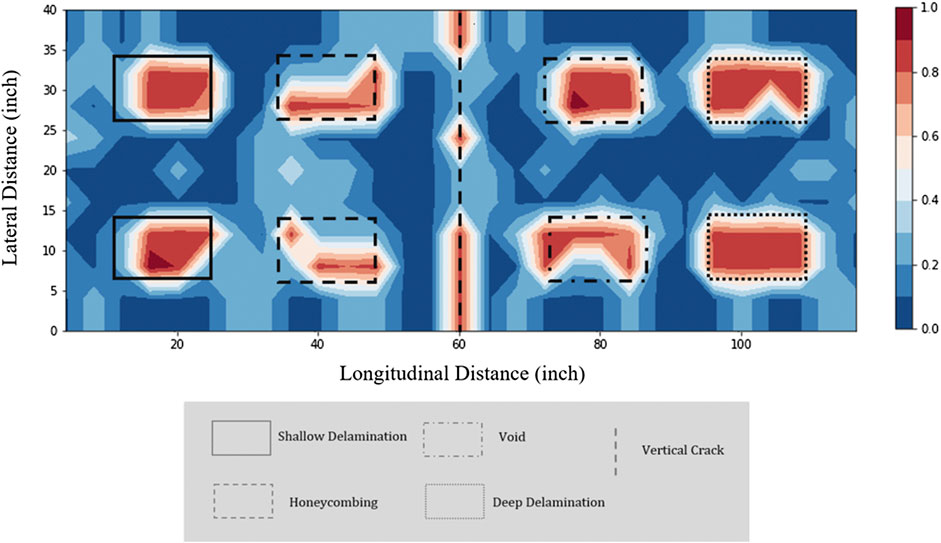
FIGURE 13. Support Vector Machine fusion heat map indicating the existence and extents of delamination and cracking.
The results for the ER data warrant additional discussion. ER measurements are not designed to explicitly detect delaminations in concrete, but rather the associated rebar corrosion, and the artificial delaminations of this test were not corroded to simulate this relationship. Yet adding ER data to the fusion of IR and GPR had a measurable beneficial impact on detection accuracy and served to reduce measurement uncertainty across the slab. An analysis of the results indicates that this benefit is not isolated to the corroded left-hand portion of the slab or any particular type of defect within the slab. While not conclusive, the authors believe that this result may be related to how the artificial defects are installed within the test slabs and may not be representative of field conditions. Further investigation is warranted and highlights the need for physics-driven understanding of machine learning analysis.
While not shown here for clarity, an initial series of tests utilized scalar-valued measurements extracted from the IE waveform results, as was done in (Hsiao et al., 2008). Single-source classifications were comparable between waveform and scalar valued NDE data. The benefits of data fusion without the complete waveform response were negligible. What this suggests is that components of an NDE signal that are not relevant for single-source assessments can be of high value for a data fusion scenario.
The behavior of the fused SVM classifier is more clearly seen in the heatmap visualization of Figure 12. The upper and lower part of the crack in the middle of the slab was detected while the middle part was not detected because of the shallower crack depth (2” vs. 6”). While not every defect was perfectly identified, a large portion of each of the eight defects was classified as a delamination by the SVM. The worst performance was seen for the honeycombing defect, where a smaller portion of the defect was detected. The other six defects were more clearly detected. For a holistic assessment, this kind of visualization goes beyond defect detection and illustrates both the extents of a defect and NDE detection confidence in an intuitive context that is familiar to engineers and inspectors.
Conclusion and Future Work
In this work, a methodology to process and fuse multiple NDE data sources for bridge deck defect detection is developed. This approach leverages a wavelet transform (DWT) to extract numerical features from waveform NDE responses. Using the DWT provides consistent feature extraction that is well suited to signals that are periodic, transient (or non-stationary), and noisy. In conjunction with scalar-valued NDE measurements, these data sources are used as input in a machine learning classifier to provide a feature-level data fusion of NDE measurements. Support vector machine methods showed demonstrably better detection accuracy than other machine learning algorithms, most noticeably when compared to linear classification methods that more closely mirror conventional assessment methods. The benefits of data fusion were most significant for the detection of delaminations and cracks, while the results from the corrosion analysis were likely biased by how HCP data was collected in the laboratory and may not be representative of realistic field performance. Overall, the findings of this study show that data fusion has a measurable and positive impact on defect detection performance for both corrosion assessment and generalized defect detection. The visualization approach developed in this study is capable of intuitively representing the classifiers detection confidence—a key criterion for inspectors and engineers managed as part of this study—and provides a more nuanced representation of NDE assessments that help to quantify the geometric extents of a defect. As stated before, the laboratory conditions for the test data likely overestimate classifier accuracy under field conditions, but they do reflect the relative benefits of data fusion over single-source NDE assessments. It is also important to emphasize that the data fusion processes developed in this work do not allow direct insight into the capabilities of any single NDE method to detect defects such as delaminations. Creating fusion approaches that provide such insights is a compelling avenue for future work.
This study was part of an on-going research program and various part of the presented methodology are being considered for further improvement. The goal of this study was to fundamentally explore fusion viability, leveraging NDE data relevant to the FHWA RABIT inspection system. While the results show the promise of data fusion, there are many unanswered questions. For instance, this study only considered a small subset of possible data fusion combinations and defect classes, and the results showed that data fusion was more beneficial for delamination detection than corrosion. This suggests the need for additional studies that consider a broader range of NDE methods and defect types, and that the benefits of fusion for any given scenario cannot be easily generalized to other scenarios. However, the framework and evaluative methodology presented here are generalizable enough to be effective for a diverse range of experimental scenarios. As stated earlier, the statistical learning models developed here are not capable of distinguishing between defect classes, a simplification that aided illustration of the impact of NDE fusion. Future work could include expanding the work to include defect diagnosis, rather than detection, for instance the distinction between shallow and deep defects for a given data fusion. Based on these initial findings, additional studies on the wavelet decomposition-based feature extraction methods are warranted as well. There is also a need to evaluate these approaches under realistic field conditions. Lastly, the probability score of damage in the structural component can be modeled as stochastic process and tracked over time and using time series modeling their future states can be predicted. Tracking the fused data for prognostic purposes would be highly beneficial to engineers and managers attempting to do portfolio-level asset management.
Data Availability Statement
The data analyzed in this study is subject to the following licenses/restrictions: Datasets are property of Federal Highway Administration. Requests to access these datasets should be directed toaG9kYS5hemFyaUBkb3QuZ292.
Ethics Statement
Ethical review and approval was not required for the study on human participants in accordance with the local legislation and institutional requirements. Written informed consent for participation was not required for this study in accordance with the national legislation and the institutional requirements.
Author Contributions
SM developed the algorithms, performed the experiments, and generated the first draft of the paper. DL and HA oversaw the research program and provided guidance. DL and HA provided major revisions and comments on the manuscript.
Funding
Portions of this work were supported by grants from the Federal Highway Administration (TO#693JJ318F000190) and the Office of Naval Research (No. N00014-18-1-2014). Any opinions, findings, and conclusions or recommendations expressed in this material are those of the authors and do not necessarily reflect the views of the Office of Naval Research or the Federal Highway Administration.
Conflict of Interest
The authors declare that the research was conducted in the absence of any commercial or financial relationships that could be construed as a potential conflict of interest.
Acknowledgments
The authors would like to thank Sattar Dorafshan and Russell Kok for their help in accessing and working with the experimental data sets used in this paper.
References
Ahmed, H., La, H. M., and Gucunski, N. (2020). Review of non-destructive civil infrastructure evaluation for bridges: state-of-the-art robotic platforms, sensors and algorithms. Sensors 20 (14), 3954. doi:10.3390/s20143954
Al Ghayab, H. R., Li, Y., Siuly, S., and Abdulla, S. (2019). A feature extraction technique based on tunable Q-factor wavelet transform for brain signal classification. J. Neurosci. Methods 312, 43–52. doi:10.1016/j.jneumeth.2018.11.014
Alonso, C., Andrade, C., and González, J. A. (1988). Relation between resistivity and corrosion rate of reinforcements in carbonated mortar made with several cement types. Cement Concr. Res. 18 (5), 687–698. doi:10.1016/0008-8846(88)90091-9
ASTM C876-09 (1999). Standard test method for half cell potentials of reinforcing steel in concrete. West Conshohocken, PA: ASTM
Boser, B. E., Guyon, I. M., and Vapnik, V. N. (1992). “A training algorithm for optimal margin classifiers,” in Proceedings of the fifth annual ACM Workshop on computational learning theory, Pittsburgh, PA: Association for Computing Machinery, 144–152.
Brownlee, J. (2017). Deep learning with Python: develop deep learning models on theano and TensorFlow using keras. Vermont VIC, Australia: Machine Learning Mastery.
Chair, Z., and Varshney, P. K.. (1986). Optimal data fusion in multiple sensor detection systems. IEEE Trans. Aero. Electron. Syst. AES-22 (1), 98–101. doi:10.1109/taes.1986.310699
Chen, F.-C., and Jahanshahi, M. R.. (2018). NB-CNN: deep learning-based crack detection using convolutional neural network and naïve bayes data fusion. IEEE Trans. Ind. Electron. 65 (5), 4392–4400. doi:10.1109/tie.2017.2764844
Chen, F.-C., Jahanshahi, M. R., Wu, R.-T., and Joffe, C. (2017). A texture-based video processing methodology using bayesian data fusion for autonomous crack detection on metallic surfaces. Comput. Aided Civ. Infrastruct. Eng. 32 (4), 271–287. doi:10.1111/mice.12256
Chen, S.-L., and Jen, Y. W. (2000). Data fusion neural network for Tool condition monitoring in CNC milling machining. Int. J. Mach. Tool Manufact. 40 (3), 381–400. doi:10.1016/s0890-6955(99)00066-8
Choo, J., Li, F., Joo, K., and Park, H. (2012). “A visual analytics approach for protein disorder prediction,” in Expanding the Frontiers of Visual Analytics and Visualization. Editors J. Dill, R. Earnshaw, D. Kasik, J. Vince, and P. C. Wong, (London: Springer London).
Cortes, C., and Vapnik, V. (1995). Support-vector networks. Mach. Learn. 20 (3), 273–297. doi:10.1023/a:1022627411411
Cristianini, N., and Shawe-Taylor, J. (2000). An introduction to support vector machines and other kernel-based learning methods. cambridge core. Cambridge, UK: Cambridge University Press.
Daubechies, I. (1992). “Ten lectures on wavelets,” in CBMS-NSF regional conference series in applied mathematics. Philadelphia, PA: Society for Industrial and Applied Mathematics.
Debnath, L., and Shah, F. A. (2014). Wavelet transforms and their applications. Berlin, Germany: Springer.
Demirbas, K. (1989). Distributed sensor data fusion with binary decision trees. IEEE Trans. Aero. Electron. Syst. 25 (5), 643–649. doi:10.1109/7.42081
Dong, J., Zhuang, D., Huang, Y., and Fu, J. (2009). Advances in multi-sensor data fusion: algorithms and applications. Sensors 9 (10), 7771–7784. doi:10.3390/s91007771
Epinat, V., Stein, A., de Jong, S. M., and Bouma, J. (2001). A wavelet characterization of high-resolution NDVI patterns for precision agriculture. Int. J. Appl. Earth Obs. Geoinf. 3 (2), 121–132. doi:10.1016/s0303-2434(01)85003-0
Faouzi, N.-E. E., Leung, H., and Kurian, A. (2011). Data fusion in intelligent transportation systems: progress and challenges - a survey. Inf. Fusion 12 (1), 4–10. doi:10.1016/j.inffus.2010.06.001
Faouzi, N.-E. E., and Klein, L. A. (2016). Data fusion for ITS: techniques and research needs. Transp. Res. Proc. 15, 495–512. doi:10.1016/j.trpro.2016.06.042
Fawcett, T. (2006). An introduction to ROC analysis. Pattern Recogn. Lett. 27 (8), 861–874. doi:10.1016/j.patrec.2005.10.010
Ghazali, K. H., Mansor, M. F., Mustafa, M. M., and Hussain, A. (2007). “Feature extraction technique using discrete wavelet transform for image classification,” in 2007 5th Student Conference on Research and Development, Selangor, Malaysia, December12–11, 2007, (IEEE), 1–4.
Gibb, S., La, H. M., Le, T., Nguyen, L., Schmid, R., and Pham, H. (2018). Nondestructive evaluation sensor fusion with autonomous robotic system for civil infrastructure inspection. J. Field Robot. 35 (6), 988–1004. doi:10.1002/rob.21791
Gucunski, N., Basily, B., Kim, J., Yi, J., Duong, T., Dinh, K., et al. (2017). RABIT: implementation, performance validation and integration with other robotic platforms for improved management of bridge decks. Int. J. Intell Robot Appl. 1 (3), 271–286. doi:10.1007/s41315-017-0027-5
Gucunski, N., Imani, A., Romero, F., Nazarian, S., Yuan, D., Herbert, W., et al. (2012). Nondestructive testing to identify concrete bridge deck deterioration. Washington, D.C.: Transportation Research Board.
Gucunski, N., Romero, F., Kruschwitz, S., Feldmann, R., and Parvardeh, H. (2011). Comprehensive bridge deck deterioration mapping of nine bridges by nondestructive evaluation technologies. Ames, IA: Iowa Department of Transportation.
Habib, C., Makhoul, A., Darazi, R., and Salim, C. (2016). Self-adaptive data collection and fusion for health monitoring based on body sensor networks. IEEE Trans. Ind. Inf. 12 (6), 2342–2352. doi:10.1109/tii.2016.2575800
Haghighat, M., Abdel-Mottaleb, M., and Alhalabi, W. (2016). Discriminant correlation analysis: real-time feature level fusion for multimodal biometric recognition. IEEE Trans. Inf. Forensics Secur. 11 (9), 1984–1996. doi:10.1109/tifs.2016.2569061
Heideklang, R., and Shokouhi, P. (2013). “Application of data fusion in nondestructive testing (NDT),” in Proceedings of the 16th international Conference on information fusion, Istanbul, Turkey, July 9–12, 2013, (IEEE), 835–841.
Hinton, G. E., Osindero, S., and Teh, Y.-W. (2006). A fast learning algorithm for deep belief nets. Neural Comput. 18 (7), 1527–1554. doi:10.1162/neco.2006.18.7.1527
Hou, J., Jankowski, Ł., and Ou, J. (2015). Frequency-domain substructure isolation for local damage identification. Adv. Struct. Eng. 18 (1), 137–153. doi:10.1260/1369-4332.18.1.137
Hsiao, C., Cheng, C.-C., Liou, T., and Juang, Y. (2008). Detecting flaws in concrete blocks using the impact-echo method. NDT E Int. 41 (2), 98–107. doi:10.1016/j.ndteint.2007.08.008
Huang, J., Liu, W., and Sun, X. (2014). A pavement crack detection method combining 2D with 3D information based on dempster-shafer theory. Comput. Aided Civ. Infrastruct. Eng. 29 (4), 299–313. doi:10.1111/mice.12041
Jiang, S.-F., Zhang, C.-M., and Zhang, S. (2011). Two-stage structural damage detection using fuzzy neural networks and data fusion techniques. Expert Syst. Appl. 38 (1), 511–519. doi:10.1016/j.eswa.2010.06.093
Khan, M. N., and Anwar, S. (2019). Time-domain data fusion using weighted evidence and dempster-shafer combination rule: application in object classification. Sensors 19 (23), 5187. doi:10.3390/s19235187
Khatam, H., Golafshani, A. A., Beheshti-Aval, S. B., and Noori, M. (2007). Harmonic class loading for damage identification in beams using wavelet analysis. Struct. Health Monit. 6 (1), 67–80. doi:10.1177/1475921707072064
Kittler, J. (1975). Mathematical methods of feature selection in pattern recognition. Int. J. Man Mach. Stud. 7, 609–637. doi:10.1016/S0020-7373(75)80023-X
Kotsiantis, S. B., Zaharakis, I. D., and Pintelas, P. E. (2006). Machine learning: a review of classification and combining techniques. Artif. Intell. Rev. 26 (3), 159–190. doi:10.1007/s10462-007-9052-3
Kralovec, C., and Schagerl, M. (2020). Review of structural health monitoring methods regarding a multi-sensor approach for damage assessment of metal and composite structures. Sensors 20 (3), 826. doi:10.3390/s20030826
La, H. M., Gucunski, N., Dana, K., and Kee, S.-H. (2017). Development of an autonomous bridge deck inspection robotic system. J. Field Robot. 34 (8), 1489–1504. doi:10.1002/rob.21725
Legat, A., Leban, M., and Bajt, Ž. (2004). Corrosion processes of steel in concrete characterized by means of electrochemical noise. Electrochim. Acta 49 (17), 2741–2751. doi:10.1016/j.electacta.2004.01.036
Legat, A. (2007). Monitoring of steel corrosion in concrete by electrode arrays and electrical resistance probes. Electrochim. Acta 52 (27), 7590–7598. doi:10.1016/j.electacta.2007.06.060
Liu, Z., Tsukada, K., Hanasaki, K., and Kurisu, M. (1999). Two-dimensional eddy current signal enhancement via multifrequency data fusion. Res. Nondestr. Eval. 11 (3), 165–177. doi:10.1080/09349849908968154
Lu, Y., and Michaels, J. E. (2009). Feature extraction and sensor fusion for ultrasonic structural health monitoring under changing environmental conditions. IEEE Sensor. J. 9 (11), 1462–1471. doi:10.1109/JSEN.2009.2019339
Luk, B. L., Jiang, Z. D., Liu, L. K. P., and Tong, F. (2008). “Impact acoustic non-destructive evaluation in noisy environment based on wavelet packet decomposition,” in Proceedings of the international conference on mechanical engineering and mechanics 2007, Wuxi, China, November 5–7, 2007, 4.
Luts, J., Molenberghs, G., Verbeke, G., Van Huffel, S., and Suykens, J. A. K. (2012). A mixed effects least squares support vector machine model for classification of longitudinal data. Comput. Stat. Data Anal. 56 (3), 611–628. doi:10.1016/j.csda.2011.09.008
Mallat, S. G. (1989). A theory for multiresolution signal decomposition: the wavelet representation. IEEE Trans. Pattern Anal. Mach. Intell. 11 (7), 674–693. doi:10.1109/34.192463
Mallat, S. (2009). A wavelet tour of signal processing: the sparse way. 3rd Edn. Cambridge, MA: Academic Press.
Martino, N., Birken, R., Maser, K., and Wang, M. (2014). Developing a deterioration threshold model for the assessment of concrete bridge decks using ground penetrating radar. Washington, D.C.: Transportation Research Board.
McCann, D. M., and Forde, M. C. (2001). Review of NDT methods in the assessment of concrete and masonry structures. NDT E Int. 34 (2), 71–84. doi:10.1016/s0963-8695(00)00032-3
Meng, D., Lin, S., and Azari, H. (2020). Nondestructive corrosion evaluation of reinforced concrete bridge decks with overlays: an experimental study. J. Test. Eval. 48 (1), 20180388. doi:10.1520/jte20180388
Moreland, K. (2009). “Diverging color maps for scientific visualization,” in Advances in visual computing 5th International Symposium. Lecture notes in computer science. Las Vegas, NV, November 30–December 2, 2009, (Berlin, Heidelberg: Springer), 92–103.
Najafabadi, M. M., Villanustre, F., Khoshgoftaar, T. M., Naeem, S., Randall, W., and Muharemagic, E. (2015). Deep learning applications and challenges in big data analytics. Journal of Big Data 2 (1), 1. doi:10.1186/s40537-014-0007-7
Nalepa, J., Kawulok, M., and Dudzik, W. (2018). “Tuning and evolving support vector machine models,” in International Conference on man-machine interactions. Advances in intelligent systems and computing. (Cham, Switzerland: Springer International Publishing), 5, 418–428.
Nantasenamat, C., Isarankura-Na-Ayudhya, C., Naenna, T., and Prachayasittikul, V. (2009). A practical overview of quantitative structure-activity relationship. EXCLI J. 8, 74–88. doi:10.17877/DE290R-690
Nouri Shirazi, M. R., Mollamahmoudi, H., and Seyedpoor, S. M. (2014). Structural damage identification using an adaptive multi-stage optimization method based on a modified particle swarm algorithm. J. Optim. Theor. Appl. 160 (3), 1009–1019. doi:10.1007/s10957-013-0316-6
Olson, D. L., and Dursun, D. (2008). Advanced data mining techniques. Berlin, Germany: Springer Science & Business Media.
Pigeon, S., Druyts, P., and Verlinde, P. (2000). Applying logistic regression to the fusion of the NIST'99 1-speaker submissions. Digit. Signal Process. 10 (1), 237–248. doi:10.1006/dspr.1999.0358
Rabiei, M., and Modarres, M. (2013). A recursive bayesian framework for structural health management using online monitoring and periodic inspections. Reliab. Eng. Syst. Saf. 112, 154–164. doi:10.1016/j.ress.2012.11.020
Ramos, L. F., Miranda, T., Mishra, M., Fernandes, F. M., and Manning, E. (2015). A bayesian approach for NDT data fusion: the saint torcato church case study. Eng. Struct. 84, 120–129. doi:10.1016/j.engstruct.2014.11.015
Rangwala, H., Kauffman, C., and Karypis, G. (2009). A kernel framework for protein residue annotation. BMC Bioinf. 10, 439. doi:10.1186/1471-2105-10-439
Ruiz, A., and Lopez-de-Teruel, P. E. (2001). Nonlinear kernel-based statistical pattern analysis. IEEE Trans. Neural Network. 12 (1), 16–32. doi:10.1109/72.896793
Saadat, S., Noori, M. N., Buckner, G. D., Furukawa, T., and Suzuki, Y. (2004). Structural health monitoring and damage detection using an intelligent parameter varying (IPV) technique. Int. J. Non Lin. Mech. 39 (10), 1687–1697. doi:10.1016/j.ijnonlinmec.2004.03.001
Shanker, M., Hu, M. Y., and Hung, M. S. (1996). Effect of data standardization on neural network training. Omega 24 (4), 385–397. doi:10.1016/0305-0483(96)00010-2
Sohn, S. Y., and Lee, S. H. (2003). Data fusion, ensemble and clustering to improve the classification accuracy for the severity of road traffic accidents in korea. Saf. Sci. 41 (1), 1–14. doi:10.1016/s0925-7535(01)00032-7
Steinberg, A. N., Bowman, C. L., and White, F. E. (2017). “Revisions to the JDL data fusion model,” in Handbook of multisensor data fusion. Editors M.Liggins, D.Hall, and J. Llinas, (Boca Raton, FL: CRC Press).
Sun, D., Lee, V. C. S., and Lu, Y. (2016). “An intelligent data fusion framework for structural health monitoring,” in 2016 IEEE 11th Conference on Industrial Electronics and Applications (ICIEA), Hefei, China, June 5–7, 2016, (IEEE), 49–54.
Tsiliki, G., and Kossida, S. (2011). Fusion methodologies for biomedical data. Journal of Proteomics 74 (12), 2774–2785. doi:10.1016/j.jprot.2011.07.001
Vanik, M. W., Beck, J. L., and Au, S. K. (2000). Bayesian probabilistic approach to structural health monitoring. J. Eng. Mech. 126 (7), 738–745. doi:10.1061/(asce)0733-9399(2000)126:7(738)
Vapnik, V. (2000). The nature of statistical learning theory. Information science and statistics. 2nd ed.. New York: Springer-Verlag.
Wang, T., Huang, H., Tian, S., and Xu, J. (2010). Feature selection for SVM via optimization of kernel polarization with Gaussian ARD kernels. Expert Syst. Appl. 37 (9), 6663–6668. doi:10.1016/j.eswa.2010.03.054
Wu, H. (2004). Sensor data fusion for context -aware computing using dempster -shafer theory. Pittsburgh, PA: Carnegie Mellon University.
Wu, R.-T., and Jahanshahi, M. R. (2018). Data fusion approaches for structural health monitoring and system identification: past, present, and future. Struct. Health Monit. 19 (6). doi:10.1177/1475921718798769
Yeh, P.-L., and Liu, P.-L. (2008). Application of the wavelet transform and the enhanced fourier spectrum in the impact echo test. NDT E Int. 41 (5), 382–394. doi:10.1016/j.ndteint.2008.01.002
Yuan, Y., Ji, Y., and Shah, S. P. (2007). Comparison of two accelerated corrosion techniques for concrete structures. ACI Struct. J; Farmington Hills 104 (3), 344–347. doi:10.14359/18624
Zhang, A., Wang, K. C. P., Li, B., Yang, E., Dai, X., and Peng, Y., et al. (2017). Automated Pixel‐Level Pavement Crack Detection on 3D Asphalt Surfaces Using a Deep‐Learning Network. Comput.-Aided Civ. Infrastructure Eng. 32 (10), 805–819. doi:10.1111/mice.12297
Zhang, G., Li, C., Zhou, H., and Wagner, T. (2018a). Punching process monitoring using wavelet transform based feature extraction and semi-supervised clustering. Proc. Manufac. 26, 1204–1212. doi:10.1016/j.promfg.2018.07.156
Zhang, J.-K., Yan, W., and Cui, D.-M. (2016). Concrete condition assessment using impact-echo method and extreme learning machines. Sensors 16 (4), 447. doi:10.3390/s16040447
Zhang, X., Nilot, E., Feng, X., Ren, Q., and Zhang, Z. (2018b). IMF-slices for GPR data processing using variational mode decomposition method. Rem. Sens. 10 (3), 476. doi:10.3390/rs10030476
Keywords: data fusion, nondestructive Evaluation, visualization, machine learning, support vector machine, feature extraction, wavelet transform
Citation: Mohamadi S, Lattanzi D and Azari H (2020) Fusion and Visualization of Bridge Deck Nondestructive Evaluation Data via Machine Learning. Front. Mater. 7:576918. doi: 10.3389/fmats.2020.576918
Received: 27 June 2020; Accepted: 19 October 2020;
Published: 16 November 2020.
Edited by:
Juncai Xu, Case Western Reserve University, United StatesReviewed by:
Nenad Gucunski, Rutgers, The State University of New Jersey, United StatesJinyoung Kim, Ajou University, South Korea
Hung Manh La, University of Nevada, Reno, United States
Copyright © 2020 Mohamadi, Lattanzi and Azari. This is an open-access article distributed under the terms of the Creative Commons Attribution License (CC BY). The use, distribution or reproduction in other forums is permitted, provided the original author(s) and the copyright owner(s) are credited and that the original publication in this journal is cited, in accordance with accepted academic practice. No use, distribution or reproduction is permitted which does not comply with these terms.
*Correspondence: David Lattanzi, ZGxhdHRhbnpAZ211LmVkdQ==