 Manjuan Yang
 Zhongyin Guo1
 Wenhua Zhang
 Guangming Chen
 Liwen Zhang
95% of researchers rate our articles as excellent or good
Learn more about the work of our research integrity team to safeguard the quality of each article we publish.
Find out more
ORIGINAL RESEARCH article
Front. Mater. , 30 October 2020
Sec. Structural Materials
Volume 7 - 2020 | https://doi.org/10.3389/fmats.2020.552043
This article is part of the Research Topic Recycled Materials in Civil Engineering View all 8 articles
Crumb rubber mortar (CRM) made from scrap tires can be used in highway, high-speed railways, and airport pavements as a structural material, which may help to solve the problems of raw material shortage and waste tire pollution at the same time. To develop it, a systematic study of the stress-strain behavior of CRM under static and dynamic compression is therefore very important. In this paper, the CRM specimens containing four different contents of crumb rubber (5, 10, 15, 20%) and four different rubber particle sizes (0.595, 0.297, 0.250, 0.177 mm) were prepared to study the workability of fresh CRM and the stress-strain curve of hardened CRM under static compression and dynamic compression. The result shows that the fluidity of CRM decreases obviously with the addition of crumb rubber and the increase of fine particle rubber size. The CRM, when the incorporating crumb rubber increased in the mortar, presented a decrease in its static compressive strength and modulus of elasticity, but an increase in its critical strain and compressive toughness. The CRM also showed an obvious strain rate effect. When the incorporated rubber contents remained constant, the CRM increased its dynamic compressive strength and dynamic increase factor with the increase of strain rates. Similar to that in the static compressive test, the addition of crumb rubber has a positive effect in enhancing the deformation and energy absorption properties under dynamic impact loading.
China’s rapid development in transportation prompts the generation of a large number of scrap vehicle tires every year. In 2018, according to the China Rubber Industry Association, 379.8 million scrap vehicle tires with a total weight of 14,590 kt were generated in China. However, only 40% of those scrap tires were recycled or properly managed, leaving the rest larger part disposed of landfills without proper management, which leads to other problems such as landfilling, health, and environmental challenges (Strukar et al., 2019) since scrap vehicle tires are difficult to be degraded under natural conditions. Therefore, the disposal of waste tires has been a major problem for countries around the world (Roychand et al., 2020).
On the other hand, the industry of civil engineering has been experiencing increasing scarcity of natural construction materials (Li et al., 2018). Thus, using waste tire rubber in mortar or concrete will be a very helpful method to substitute the traditional natural aggregate or cement (Karakurt, 2015). Consequently, numerous studies focusing on the material properties of rubberized cement-based materials have been undertaken (Li et al., 2019; Strukar et al., 2019; Roychand et al., 2020; Xu et al., 2020). These researches found that the rubberized cement-based materials, with the addition of rubber particles, have the advantages of low density, good sound absorption, high acid resistance, well freeze-thaw resistance, fine chloride permeability resistance, increased damping capacity, and great bending impact strength and toughness (Li et al., 2019).
Scholars worldwide have conducted substantial experimental research on the mechanical properties of crumb rubber mortar (CRM). For example, Uygunoğlu and Topçu (2010) investigated the influence of scrap rubber with five different replacement ratios on the flowability, apparent porosity, water absorption by weight, compressive and flexural strength, and dynamic modulus of elasticity of mortar. They found that scrap rubber’s partial replacement of sand results in the degradation of mortar in freshness and hardness/toughness. Similar results also have been found by many other researchers (Al-Akhras and Smadi, 2004; Corinaldesi et al., 2011; Lv et al., 2019). The study of Angelin et al. (2019), focusing on the mechanical properties of the particle geometry of crumb rubber, shows that rubberized mortars produced with fiber particles have higher mechanical strengths. To reduce the negative effect of scrap rubber on mortar strength, researchers have worked on it and invented many methods. Chou et al., through partially oxidizing crumb rubber and using it as additives of mortar, found that the compressive strength of the oxidized rubberized mortars (with 6 wt%) is greater than that of mortars without the crumb rubber. Onuaguluchi (2015), adopting limestone powder pre-coated crumb rubber and silica fume to enhance the performance of rubberized cement mortar, finally pointed out the relevant enhancement to the mechanical properties of the mortar.
Angelin et al. (2019) examined the mechanical behavior of CRM by conducting triaxial tests, eventually establishing a damage constitutive model of CRM.
Furthermore, because of the damping capacity, bending impact strength, and high toughness of the CRM, as a structural material, has been introduced into highways, high-speed railways, and airport pavements (Song et al., 2018), where the structural material always suffers the dynamic impact loading. Existing studies have shown that the same material under dynamic impact loads responses completely different from that under static conditions. Although researches of investigating the dynamic properties of crumb rubber mortar by using Split-Hopkinson Pressure Bar (SHPB) device or drop hammer (Atahan and Yücel, 2012; Liu et al., 2012; Feng et al., 2018; Gerges et al., 2018; Yang et al., 2019) have been found, the reference on the dynamic properties of CRM is still rare.
It is important to systematically study the stress-strain behavior of CRM under the static and dynamic compressive tests. In this paper, the CRM specimens containing four different contents of crumb rubber (5, 10, 15, 20%) and four different rubber particle sizes (0.595, 0.297, 0.250, 0.177 mm) were prepared. Then, the workability of fresh CRM was studied. The hydraulic servo test system and SHPB device were used to conduct static and dynamic compressive tests, respectively. The compressive strength, elastic modulus, critical strain, compressive toughness under static compressive tests of CRM were obtained. The dynamic stress, the dynamic increase factor (DIF), critical strain, and compressive toughness under dynamic impact were also systemically studied.
A Chinese standard graded 42.5 P. I type Portland cement with a compressive strength of 47.6 MPa at 28 days and a type of grade I fly ash with a density of 2,670 kg/m3 were used, with their chemical composition of cement and fly ash shown in Table 1. Common river sand with fineness modulus 2.6 was used as fine aggregate. To ensure the flowability of CRM, the superplasticizer of polycarboxylic produced by Jiangsu Bote new materials Co., Ltd., was used. The silane coupling agent was used to strengthen the bond between the crumb rubber and the cement matrix. The crumb rubber with four different particle sizes including 0.595 mm (30 mesh), 0.297 mm (50 mesh), 0.250 mm (60 mesh), and 0.177 mm (80 mesh). The apparent density of those four different size crumb rubber is 1,040 kg/m3. All the raw materials are shown in Figure 1.
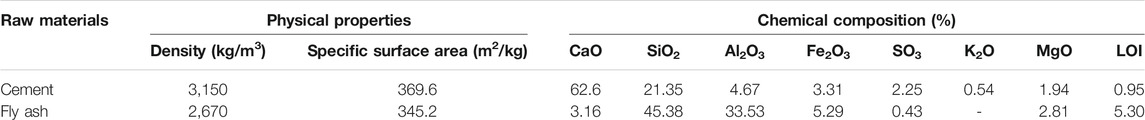
TABLE 1. Chemical composition of cement clinker.
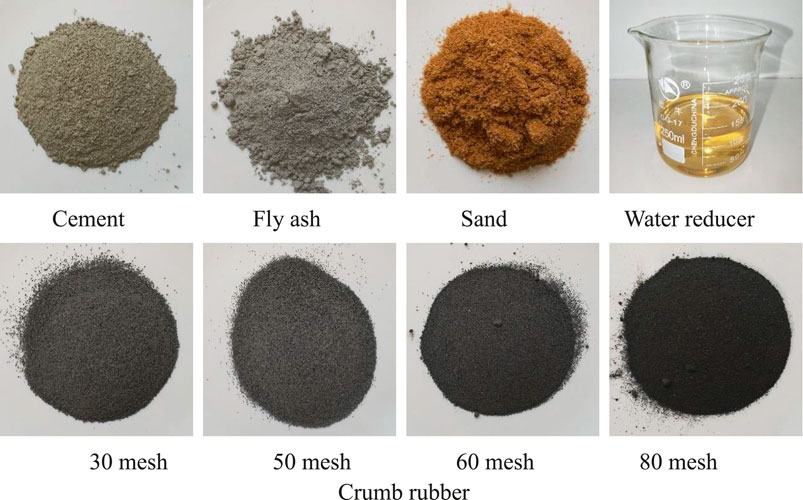
FIGURE 1. Raw material.
C50 ordinary cement mortar was designed as the reference mortar (RM), and the mixture proportion of RM is shown in Table 2. The influence of crumb rubber content and particle size on the static and dynamic compressive properties of CRM were studied. Crumb rubber with size of 0.177 mm (80 mesh) replaced 5, 10, 15, and 20% of the sand volume. Those four CRMs were shortened for R80–05, R80–10, R80–15, and R80–20, respectively. Four different crumb rubber particle sizes including 0.595 mm (30 mesh), 0.297 mm (50 mesh), 0.250 mm (60 mesh), and 0.177 mm (80 mesh) were used, crumb rubber replaced 10% of the sand volume. Those four CRMs were shortened for R30–10, R50–10, R60–10, R80–10, respectively. At the same time, the silane coupling agent of KH570 produced by Nanjing Quanxi Chemical Co., Ltd. was used to enhance the bonding strength between the rubber particles and the cement matrix, with the content being 0.006% of the rubber mass. The mixture proportion of CRM is shown in Table 2.
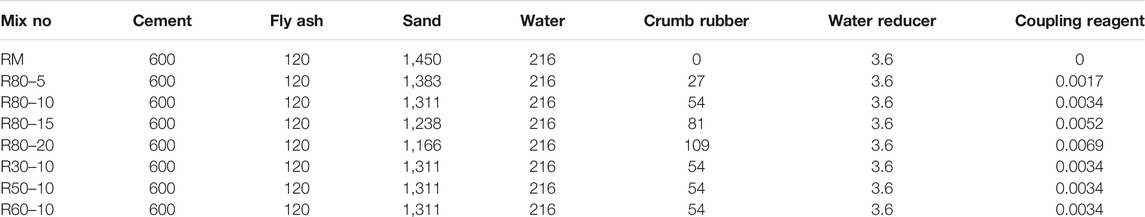
TABLE 2. The mixture proportion of CRM (kg/m3).
The preparation process of CRM is described as follows. Firstly, the sand, cement, crumb rubber, and fly ash were poured into the mixer and then mixed for about 2 min. Secondly, the mixture of water, silane coupling agent, and water reducer was added to mix for 2 min. Thirdly, the mixed CRM was cast into the steel mold and placed on the vibration table for compaction. Fourthly, the specimens were cover by a plastic sheet to avoid the evaporation of water. Finally, after 24 h, the specimens were demolded and placed in a standard curing room with a temperature of 20°C and a humidity of 98% for 28 days.
The fluidity test was carried out according to the national standards of P.R.C GB/T 2419–2005 (China National Standardization Management Committee, 2005). Firstly, the truncated conical model was put on a jump table and then filled with fresh mortar. Secondly, the mold was removed and the machine then started its operation for 25 s, with the table vibration frequency at one time per second. Finally, the diameter of the mortar expansion was measured after the vibration. The fluidity is the average of the flow spread of mortar measured in two perpendicular directions after jolts in the flow table test.
To conduct the uniaxial compression test, a hydraulic servo test system was used on cylindrical specimens with a dimension of Ø100 mm × 200 mm. In the test, two LVDTs were fixed in the middle of mortar specimens for measuring strain. Axial loads applied on cylindrical specimens were controlled by a displacement of 0.05 mm/min. The test data were collected by the TDS data acquisition instrument. The test setup and three specimens used in conducting the compressive test are shown in Figure 2. The average value was served as the final compressive strength of CRM.
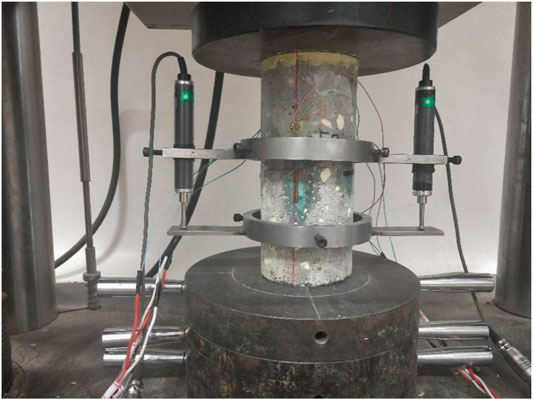
FIGURE 2. Test setup and specimen.
The SHPB device was used to conduct a dynamic test on CRM, just as shown in Figure 3. SHPB device is mainly composed of a bullet, an incident bar, and a transmission bar. Bullets are 500 mm long. Incident bars and transmission bars are comparatively much longer, for 5.5 and 3.5 m in length, respectively, but both are 75 mm in diameter. The strain gauges pasted on the incident bar and the transmission bar were used for strain collection.
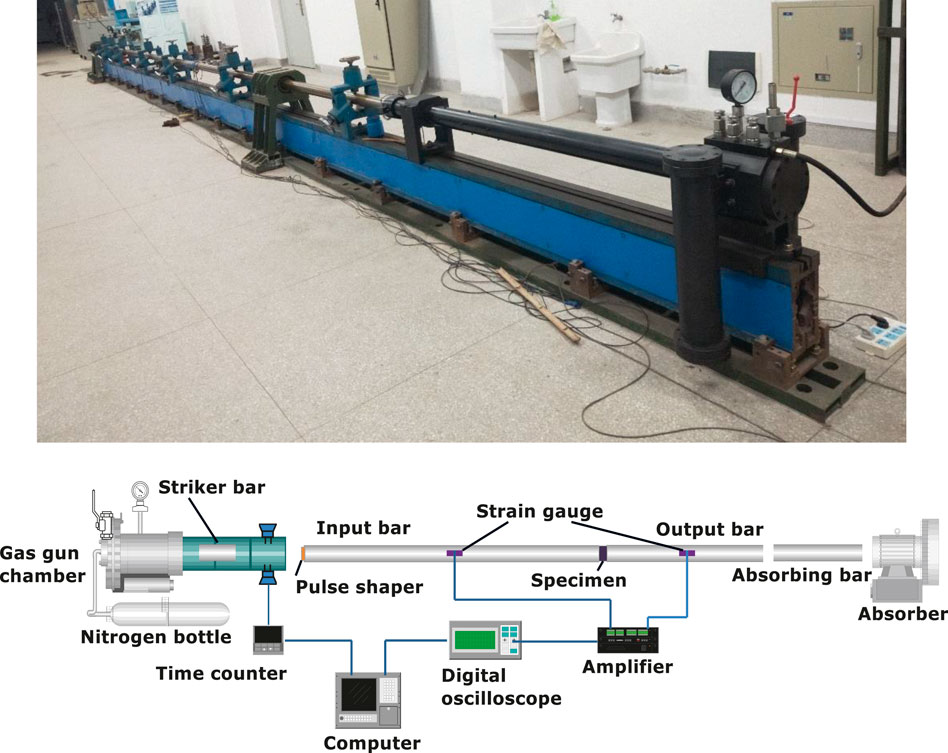
FIGURE 3. Schematic diagram of Split-Hopkinson Pressure Bar.
During the test, the specimen was sandwiched between the incident bar and the transmission bar. Driven by high-pressure gas, the bullet stroke the incident bar at a certain speed, generating a stress pulse
Where
The specimen of the dynamic test was a cylindrical specimen with a diameter of 75 mm and a thickness of 35 mm. Since the smoothness of both ends of the specimen has a significant influence on the test result, the specimen was polished before the test by a high-precision grinder to ensure that the specimen had a roughness less than 20 μm in both ends.
(a) Influence of crumb rubber content on fluidity
(b) Influence of rubber particle size on fluidity
The flow table test and results of the fresh mortar mixes are shown in Figures 4 and 5, respectively. As Figure 4 and Figure 5A suggests, mortar fluidity decreases obviously with the addition of crumb rubber. The higher the content of the crumb rubber, the less the mortar fluidity. This is in accordance with the data of the fluidity of R80–5, R80–10, R80–15, and R80–20, which are 217.5, 209.2, 205.6, and 198.5 mm, respectively. Compared with the 224.3 mm of the reference mortar RM fluidity, they are reduced by 3.0, 6.7, 8.3, and 11.5%, respectively. The linear relationship between rubber content and fluidity is obvious, which corresponds well with the results reported by other researchers (Uygunoğlu and Topçu, 2010; Corinaldesi et al., 2011). The decreased flowability of rubber powder mortar is due to the rough rubber particles, which result in increasing the friction forces between the rubber particles and the other components of the mix.
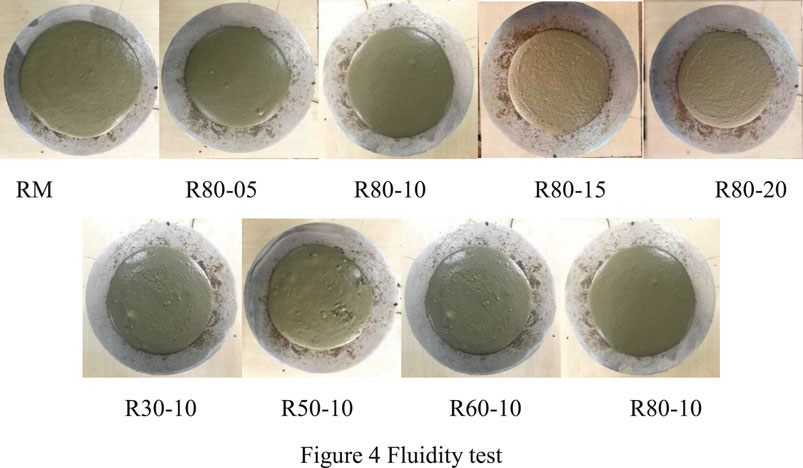
FIGURE 4. Fluidity test.
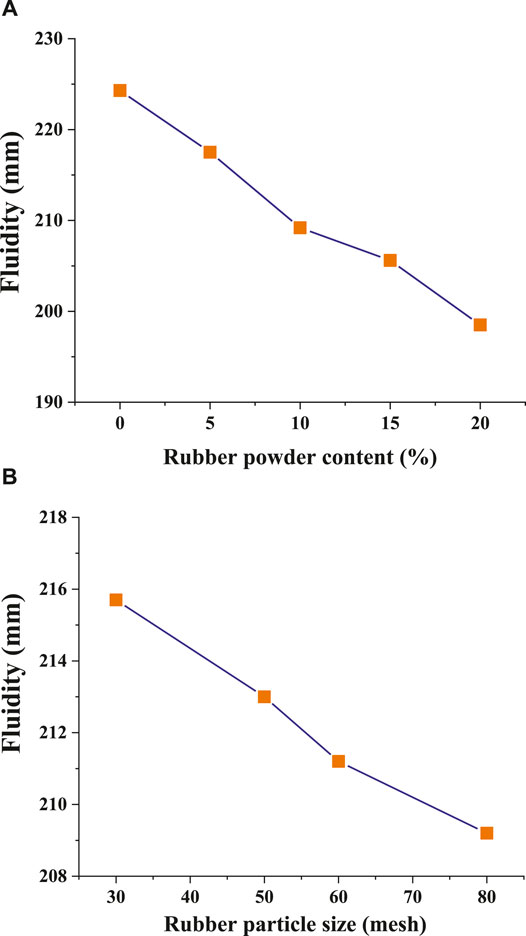
FIGURE 5. Fluidity results of the mortar.
The effect of rubber particle size on the fluidity is shown in Figure 5B. As the figure displays, the fluidity of R30–10, R50–10, R60–10, and R80–10 are 215.7, 213.0, 211.2, and 209.2 mm, respectively. CRM with fine rubber particles exhibits a worse fluidity for larger rubber particles. This is ascribed to the fact that the smaller rubber particle has a contrarily higher surface area, thus increasing the water needed to encapsulate rubber particles. The results also point out that although the rubber particle size does affect the fluidity, the effect is not remarkable. The difference of fluidity between four different particle-sized rubber mortar is not obvious.
The static compressive stress-strain curves of mortar specimens with different rubber content and different rubber particle size are shown in Figures 6A,B, respectively. It can be seen from the figure that the stress-strain curves of all the specimens are composed of the ascending portion and the descending portion. The curves all climb up linearly in the initial part, then continue their increase in a slower way until up to the peak point. It shows that the stress and strain are linear at the beginning but nonlinear when the stress exceeds a certain value. At that moment, the crack inside the specimen got generated. Finally, when the stress reaches the peak value, the curve drops rapidly.
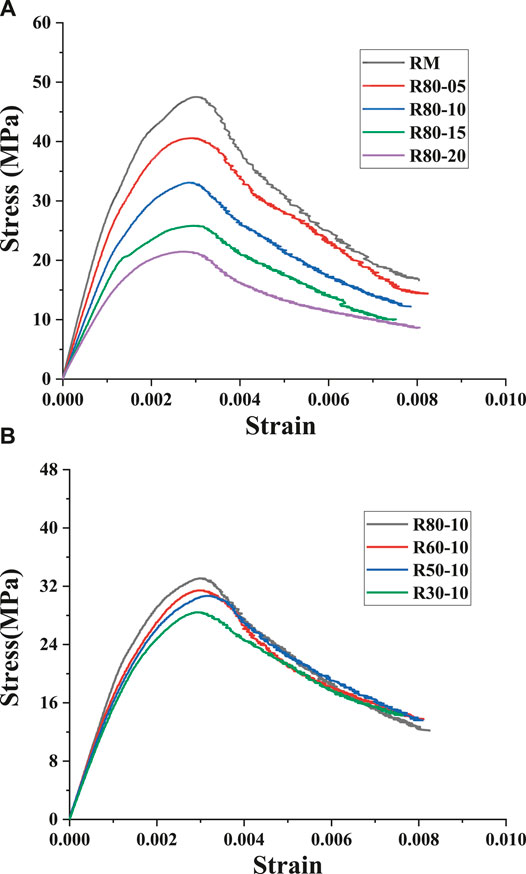
FIGURE 6. Static stress-strain curves of the mortar specimens.
As shown in Figure 6A, the stress-strain curve of mortar is significantly affected by the amount of crumb rubber. The higher the content of crumb rubber is, the more gentle the ascending and descending portion of the curve will be. However, Figure 6B reveals that the size of crumb rubber has no significant effect on the stress-strain curve of mortar specimens. The four curves are close to each other, except for the difference in peak stress.
The compressive strength was obtained from the stress-strain curve of peak stress and then summarized in Table 3. According to it, the content of crumb rubber and the particle size of crumb rubber both have a significant influence on the static compressive strength of mortar. With the increase of rubber content, the strength of mortar decreased significantly. Specifically, after adding 5, 10, 15 and 20% of crumb rubber, the relative values of compressive strength of the mortar specimens were 85, 69, 54, and 45%, respectively. This phenomenon is consistent with the effect of rubber particles on rubber mortar.
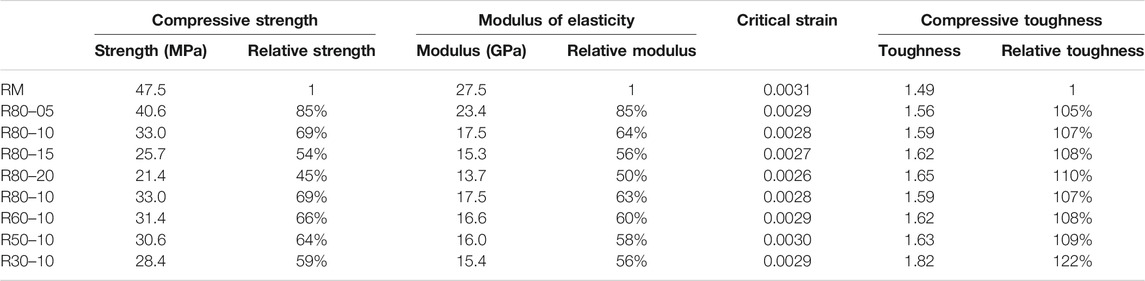
TABLE 3. Static stress-strain test results for all groups.
The strength decrease in the RM with the increasing rubber content is attributable to the following reasons. Firstly, as the crumb rubber particle is an elastoplastic material with low strength, the crumb rubber can easily absorb water on the surface during the mixing process, wherein a thick water film would be formed around the rubber particle, consequently resulting in a weak interface transition zone (ITZ) between rubber and mortar. Moreover, when crumb rubber is used, viscoelastic particles will reduce the bonding between the crumb rubber and the cement matrix. The less than perfect bond between the cement paste and the rubber can also contribute to slippage between the two materials, and differential strain is thus likely to develop in the microstructure, which will serve to increase the tensile stress (Dehdezi et al., 2015). Therefore, in the compressive strength testing, cracks tend to develop and propagate from the areas where the ITZ bond is weak, eventually resulting in a significant decline in mechanical properties. The strength decrease is attributed to the interface transition zone between cement paste and rubber, but the addition of the silane coupling agent will improve the interface between cement and rubber. On the one hand, the silane coupling agent dehydrates and condenses on the cement surface to form a chemical bond. On the other hand, the alkane group of the silane coupling agent has a better affinity with crumb rubber.
There is an exponential relationship between the compressive strength and the content of crumb rubber, as the results are shown in Figure 7. It proves that the fitting equation is correspondent well with the test results. The relationship is shown in Eq. 4.
where
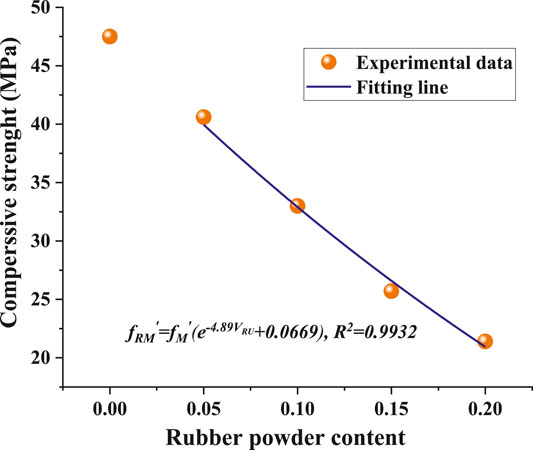
FIGURE 7. Effect of rubber content on the modulus of elasticity.
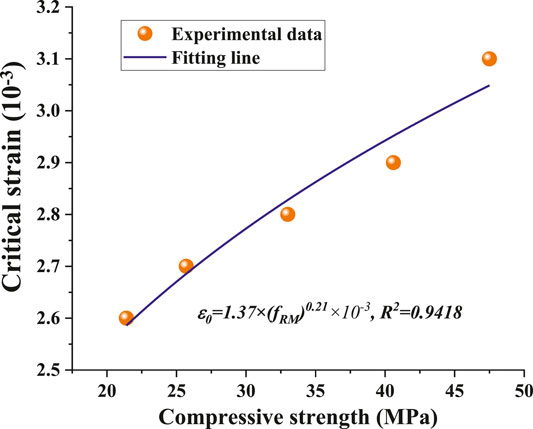
FIGURE 8. Effect of rubber content on the critical strain.
Just as shown in Table 3, with the increase of crumb rubber mesh, compressive strength shows an increasing trend, indicating that the smaller the rubber particle, the higher the compressive strength. So when the particle size of crumb rubber was 0.177 mm (80 mesh), 0.250 mm (60 mesh), 0.297 mm (50 mesh), and 0.595 mm (30 mesh), and the correspondent relative strength was 69, 66, 64, and 59%, respectively. This is because the smaller the particle size of crumb rubber is, the more uniformly it can be dispersed in the mortar. Compared with the CRM with larger particle size, the internal stress state of the CRM with smaller particle size is more uniform when the specimen was under loading. This is because hardened mortar and crumb rubber are two materials with a great difference in physical properties. Compared with crumb rubber, hardened mortar has much higher strength and elastic modulus. Therefore, crumb rubber is the defect of mortar. The larger particle size of crumb rubber will increase the degree of internal heterogeneity, since the ITZ between the rubber and the matrix is the weakest link due to compatibility issues between the polymer in the rubber and the matrix.
The elastic modulus of CRM was calculated according to the ASTM C469 (ASTM, 2014) as follows.
where
The results of the elastic modulus of specimens are summarized in Table 3, from which it can be seen that similar to the rule of compressive strength, both the content and particle size of crumb rubber have an obvious influence on the elastic modulus. To be specific, the value of elastic modulus decreases significantly when more and more crumb rubber was added. Data show that when 5, 10, 15, and 20% crumb rubber was used, the relative values of elastic modulus of the mortar specimens were 85, 64, 56, and 60%, respectively. This is because rubber particle, as a kind of viscoelastic material with low strength, once increase its amount, will significantly decrease the internal deformation resistance of the mortar.
Table 3 also points out an exponential relationship between the elastic modulus and the content of crumb rubber. The results are shown in Figure 7, which clearly illustrates the fitting equation corresponding well with the test results. The relationship is shown in Eq. (10).
Where
The effect of crumb rubber particle size on the elastic modulus of mortar is shown in Table 3. Its data suggest that a smaller crumb rubber particle size corresponds to a higher elastic modulus of mortar specimen. The relative elastic modulus of R80–10, R60–10, R50–10, and R30–10 are 64, 60, 58, and 56%, respectively. Compared with the effect of the crumb rubber content, the effect of the particle size of crumb rubber on the elastic modulus is not very significant. The R30–10 with the largest particle size is only 12% lower than the R80–10 with the smallest particle size. This can be explained as follows. The crumb rubber with small particle size is generally evenly distributed in the mortar. Therefore, the deformation of each crumb rubber, which is limited by the mortar wrapped outside, is small. As to the crumb rubber with large particle size, however, the larger the diameter of each rubber particle is, the larger the accumulated deformation may be. Besides, the rubber particle is less restrained by external mortar. Therefore, the crumb rubber with large particle size has poor resistance to deformation and has a high potential to produce large deformation.
The results of critical strain are shown in Table 3, from which it can be seen that the increase of crumb rubber content will result in a decrease of critical strain. This result is consistent with the research on the crumb rubber concrete conducted by Li et al. (2018), but contrary to the research conducted by Son et al. (2011). This contradiction can be explained as follows. The critical strain is the transition from the elastic stage to the inelastic stage, whose value is determined by the strength and deformation capacity. The specimen with high strength has a long elastic stage, which results in increasing the critical strain value. Besides, despite the increase of the content of crumb rubber, the deformation ability of CRM specimen also increases, which however, will lead to a decrease in compressive strength at the same time in a more significant way. Therefore, when the content of the crumb rubber is high, the critical strain value is small.
A power function occurs between the critical strain and the compressive strength. Just as in Figure 8, a fitting line is shown after the non-linear data regression analysis of the experimental results, proving the fitting equation correspondent well with the test results. The function is shown in Eq. 11.
where
According to Table 3, the particle size of crumb rubber has no obvious effect on the critical strain. No significant difference has been found in the critical strain of four different CRM specimens, due to the small difference between the four-particle sizes. Besides, the strength values of the four specimens are also very close.
Compressive toughness refers to the ability of elastic deformation and energy absorption of materials without fracturing. A method proposed by Khaloo et al. (2008) was used in this study to calculate the compressive toughness (Figure 9) obtained by dividing the area under the stress-strain curve up to 80% of the peak stress in the post-peak curve region (A + B region) by the area up to the peak stress (A region). The compressive toughness of CRM specimens is listed in Table 3.
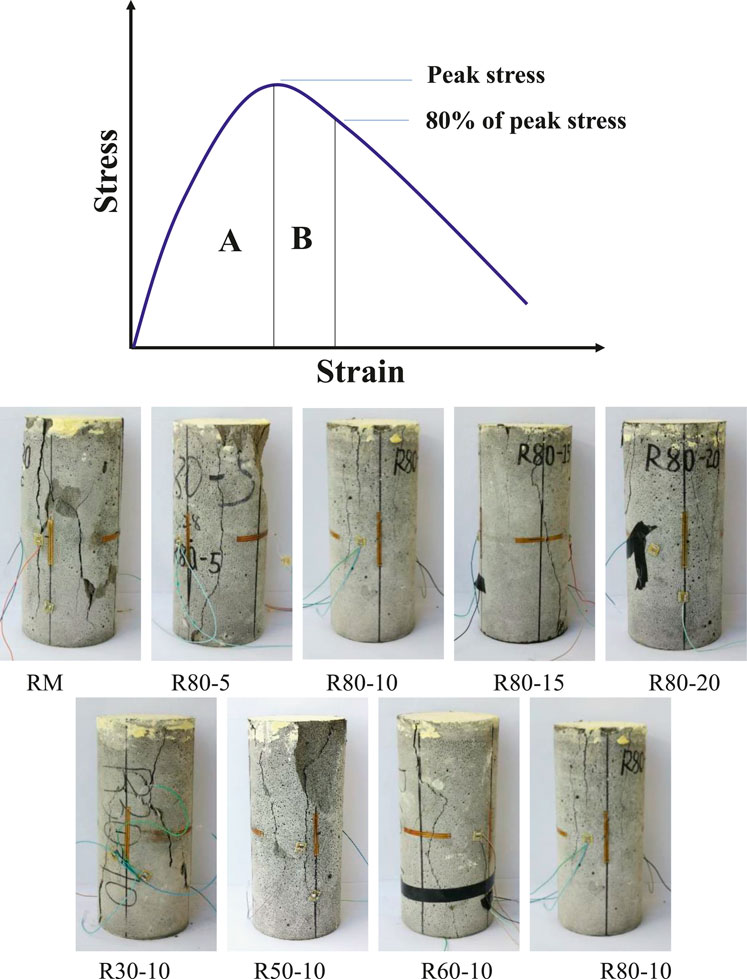
FIGURE 9. Evaluation of toughness index.
The results of compressive toughness are shown in Table 3. It can be seen from the table that the increase of crumb rubber content can improve the compressive toughness of the material. Compared with the RM mortar without crumb rubber, the compressive toughness of the RM mortar with 5, 10, 15, and 20% crumb rubber increased by 5, 7, 8, and 10%, respectively. Besides, the particle size of crumb rubber also affects the compressive toughness. Compared with RM, the compressive toughness of r80–10, r60–10, r50–10 and r30–10 increased by 7, 8, 9, and 22%, respectively. It shows that the larger the particle size of crumb rubber, the higher the compressive toughness. Similar to the explanation for compressive strength, this happens because that as rubber being a viscoelastic material, the addition of crumb rubber can improve the deformation ability and compressive toughness of mortar. When the particle size of rubber particles changes to be large, the accumulated deformation of rubber particles is getting larger, while the constraint of mortar is decreasing less, consequently resulting in higher compressive toughness.
The failure mode of the CRM specimens is shown in Figure 10. As in the figure, the specimen manifests the cone failure and split failure, but no obvious rule has been found of the amount of crumb rubber and the particle size of crumb rubber to the failure morphology. Most of the specimens have the mode of cleavage failure, while R80–5 and R50–10 specimens show conical failure.
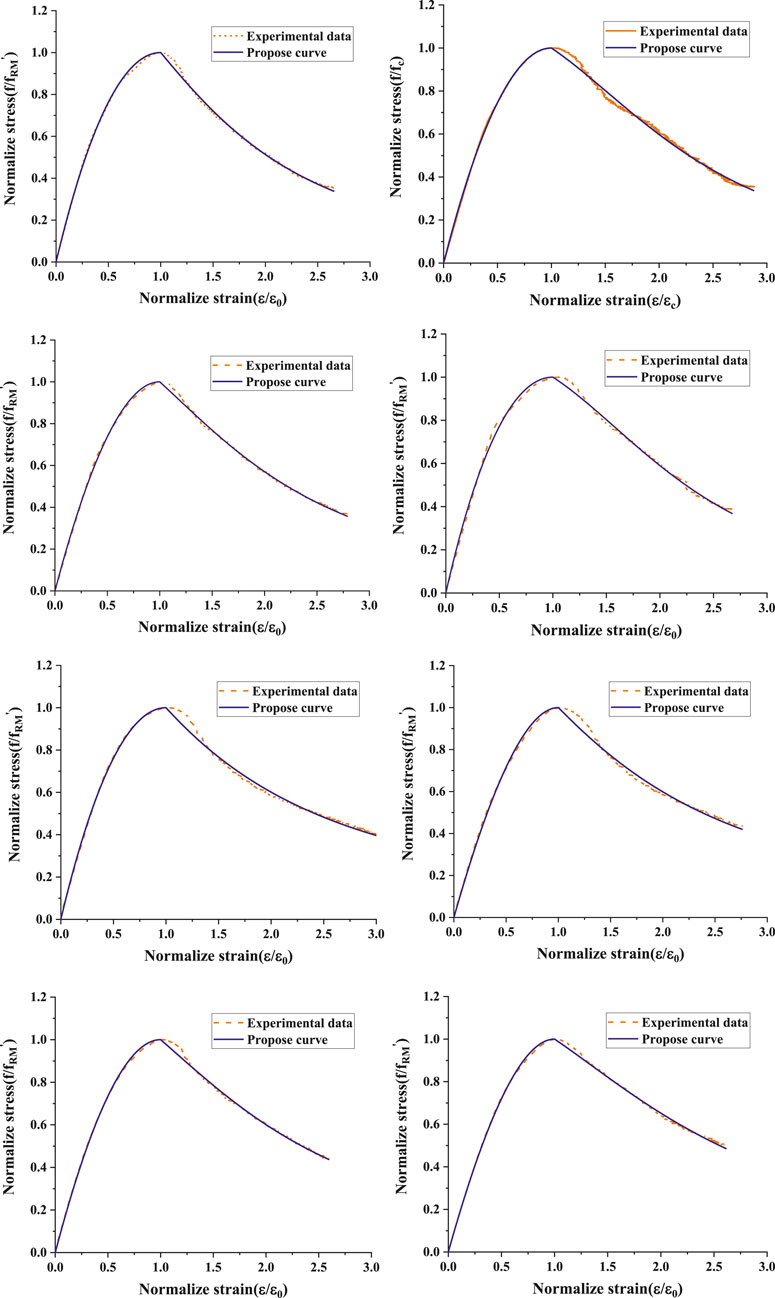
FIGURE 10. Comparison between stress-strain model and experimental results.
The stress-strain curve of CRM can reflect the mechanical properties during compression, which is necessary for structure analysis and the establishment of bearing capacity. In this paper, the analytical expression of the stress-strain law suggested by Zhenhai (2004) was introduced as the basic model equation to predict the stress-strain curves, just as shown in formula 12 and 13.
where σ and ε are the actual stress and actual strain value, respectively;
Eqs. 12 and 13 are used, in a normalized manner, to generate the complete stress-strain curve for different A, B, and C values, which are summarized in Table 4. The parameters A, B, and C were determined by fitting the stress-stain data with Origin software. Eqs. 12 and 13 were used as custom functions. The goodness of fit R 2 can be obtained after fitting. The correlation coefficient was obtained between the theoretical curve and the experimental one were determined according to R 2 value. As the A value decreases, the curve decreases its slope. In another word, the elastic modulus of the mortar decreases. Therefore, the A value is related to the elastic modulus of the mortar. In the meanwhile, the B− and C– values affect the descending part of the stress-strain curve. To make it clear, the comparison of proposed model equations with experimental results are shown in Figure 10, which points out that there is a very good correlation between the experimental data with the analytical curves.
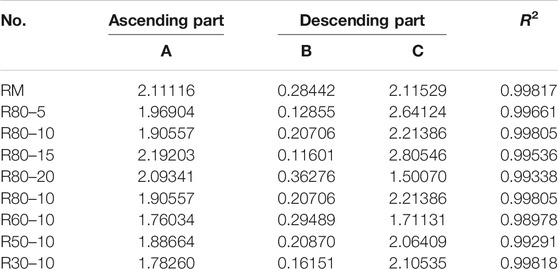
TABLE 4. Values of parameters A, B, and C for different specimens.
In this paper, the influence of different strain rates on the properties of CRM was studied. Four strain rates included 40, 60, 80, and 100 s−1 were selected in the experiment. The above Figure 11 shows the dynamic compressive stress-strain curves of CRM under four different strain rates. Similar to the static compressive behavior, the stress-strain curve of all specimens under dynamic compressive is composed of the ascending portion and the descending portion. The ascending portion is approximately a straight line, indicating that the stress and strain are nearly linear. When the stress reaches the peak value, the curve drops gradually. For the curves of the same mixture specimen under different strain rates, the ascending portion of the curves is found coincide at the beginning. It shows that the elastic modulus of the specimens is of similar performance under different strain rates, indicating that with the increase of strain rate, the peak of the curve is getting higher and higher.
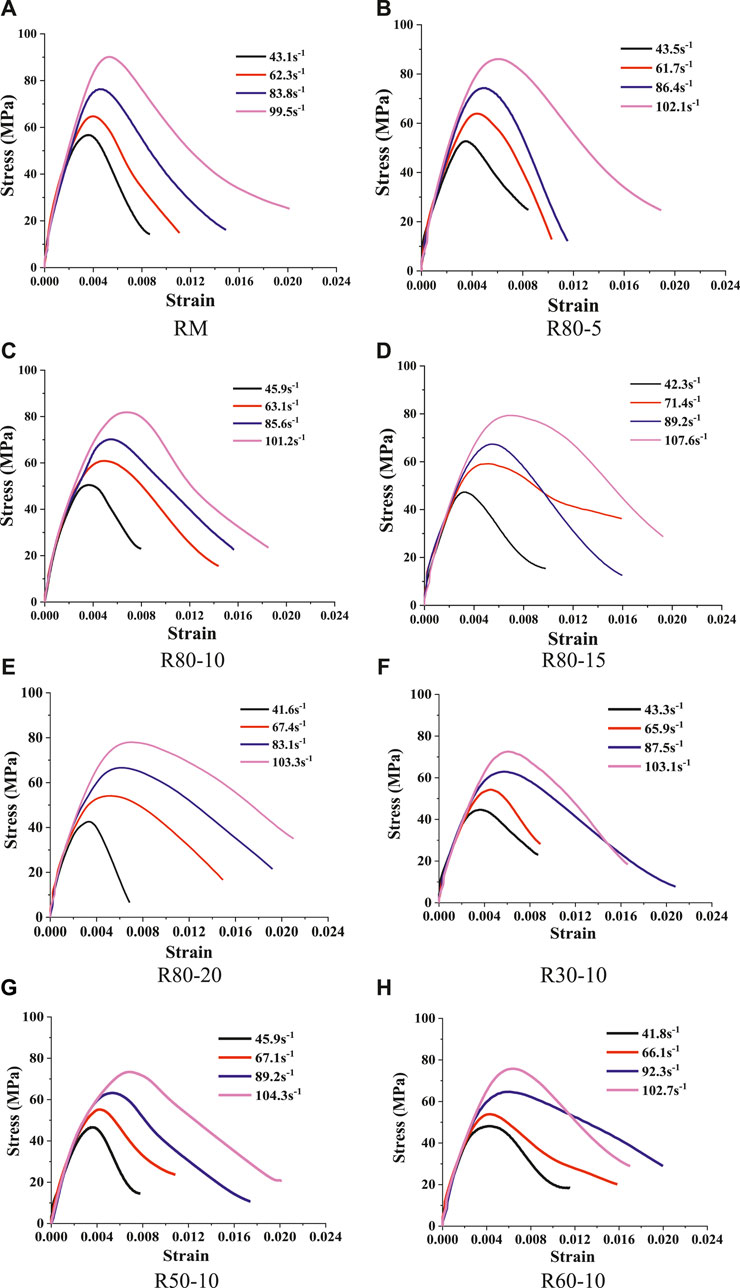
FIGURE 11. Dynamic compressive stress-strain curve of Crumb rubber mortar.
From Figures 11A–E, it can be seen that the content of crumb rubber has a significant impact on the stress-strain curve of mortar, especially on the descending portion of the curve. The increase in the content of crumb rubber helps form a comparatively gentle curve. Figures 11F–H indicates that the crumb rubber particle size has little influence on the stress-strain curve of mortar, thus resulting in relatively similar curves.
Based on the analysis of the dynamic compressive stress-strain curve, the dynamic strength, and the critical strain can be obtained. To analyze the dynamic effect of rubber mortar, the dynamic increase factor (DIF), which can be obtained by dividing dynamic strength by static compressive strength, was introduced. The compressive toughness was also used in the dynamic compressive test, whose calculation method was the same as in part 3.2.5. All of those data are summarized in Table 5.
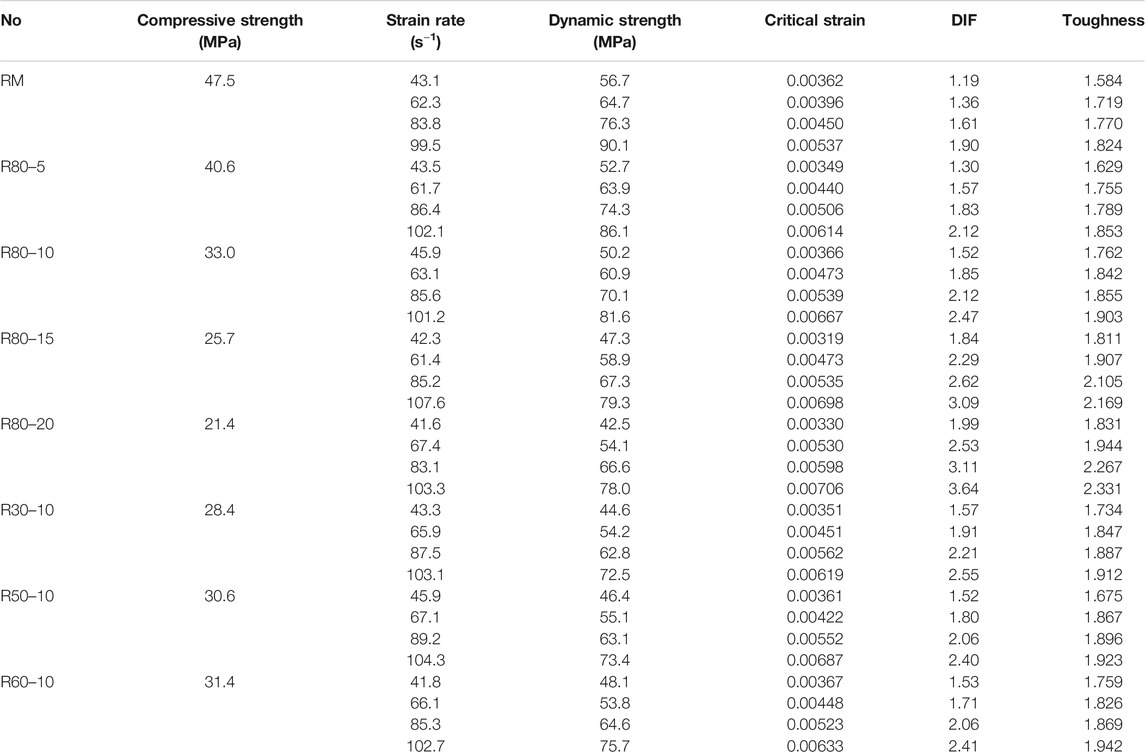
TABLE 5. Dynamic test result of CRM.
Figure 12 explains the relationship between dynamic strength and strain rate of mortar with different crumb rubber contents. The dynamic strength increases with the increase of strain rate for all specimens, referring that the rubber mortar has an obvious strain rate effect under impact load. For example, the dynamic strength of R80–20 was 42.5 MPa when the strain rate was 41.6 s−1. With the strain rate increased to 67.4, 83.1, and 103.3 s−1, the dynamic strength climbed up to 54.1, 66.6, and 78.0 MPa, respectively. Besides, Figure 12 points out that crumb rubber content impacts significantly on dynamic strength. More specifically, under a similar strain rate, the larger the content of crumb rubber is, the smaller the dynamic strength will be. This situation is similar to the rule of static mechanical properties. Because as crumb rubber being a highly elastic polymer material with low strength, the higher the content is, the lower the resistance to high strain dynamic impact load will be.
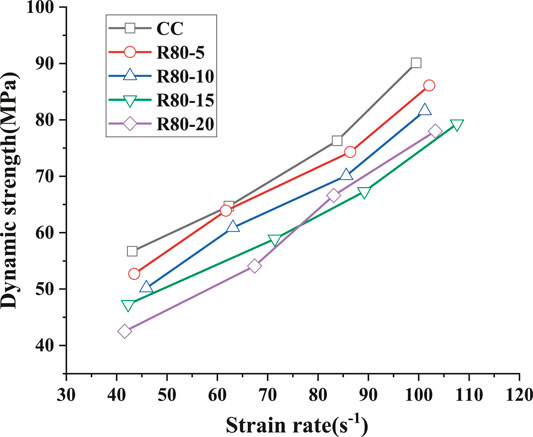
FIGURE 12. Relationship between dynamic strength and strain rate of mortar with different contents of crumb rubber.
Figure 13 shows the relationship between dynamic strength and strain rate of rubber mortar with various sizes of crumb rubber. In particular, the dynamic strength of the specimens with 30, 50, and 60 mesh crumb rubbers was not significantly different but rather close under a similar strain rate. However, R80–10 manifested the highest dynamic impact strength, which was similar to that of the static compressive strength. This is due to that the crumb rubber with the small particle size of 80 mesh has a relatively larger specific surface area, thus ensuring the large contact area with the cement matrix and the even dispersion of very small crumb rubber in the mortar. Therefore, the dynamic strength of R80–10 with smaller rubber particles is higher than that of R30–10, R50–10, and R60–10.
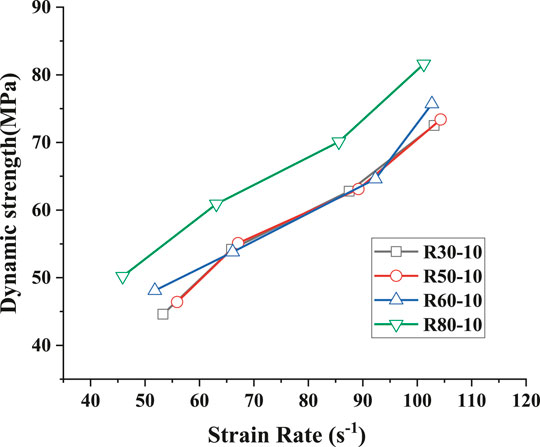
FIGURE 13. Relationship between dynamic strength and strain rate of rubber mortar with different sizes of crumb rubber.
The relationship between DIF and strain rate of the specimen with different content of crumb rubber is illustrated in Figure 14, which specifies that the higher the content of crumb rubber is, the higher the DIF value is. In another word, the mortar with a higher rubber content has a more obvious strain rate effect, and the compressive strength has improved to a greater extent under the dynamic impact. For example, the DIFs of RM, R80–05, R80–10, R80–15, and R80–20 are 1.90, 2.12, 2.47, 3.09, and 3.64 under the strain rate of 100 s−1, respectively.
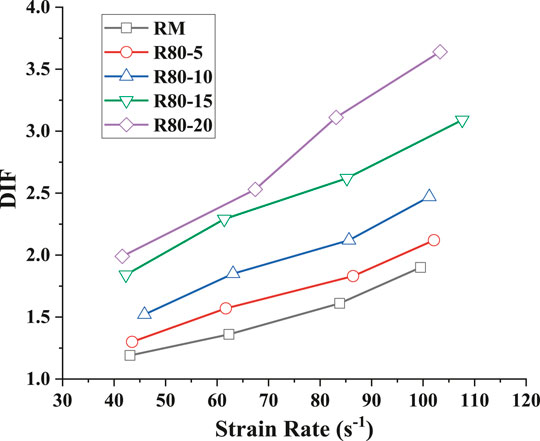
FIGURE 14. The relationship between (Dynamic Increase Factor) DIF and strain rate.
Based on a large number of experiments, many scholars (Bischoff and Perry, 1991; Chen et al., 2013) found that there is an exponential relationship between DIF and strain rate. The DIF of mortar with various contents of crumb rubber depends on the logarithm of the strain rate directly. For a given strain rate, the DIF of CRM may be estimated from the following constitutive model (15)–(19), and the curves are shown in Figure 15.
where
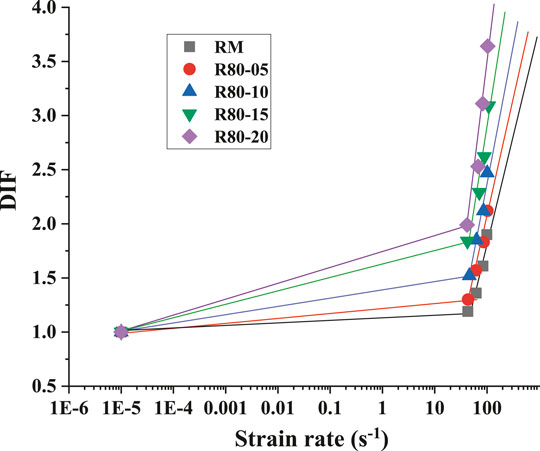
FIGURE 15. Regression function of DIF and strain rate.
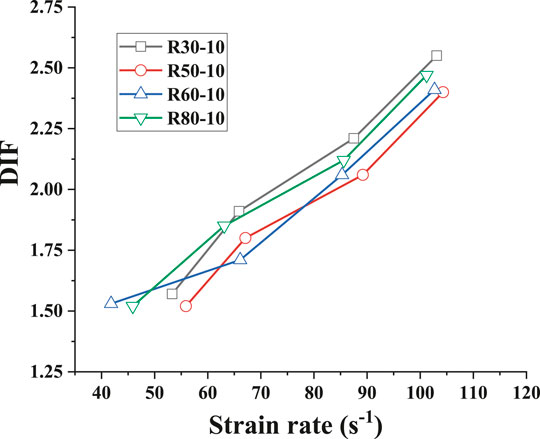
FIGURE 16. Relationship between DIF and strain rate of rubber mortar with different sizes of crumb rubber.
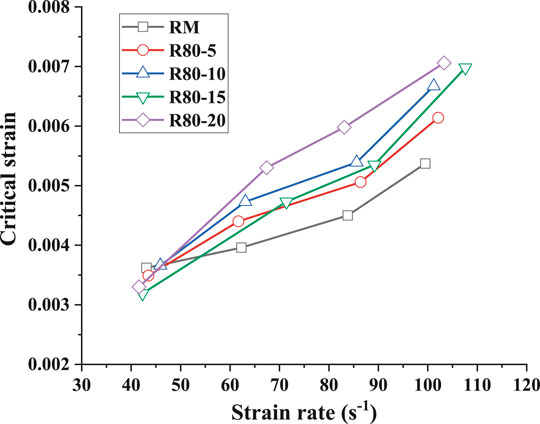
FIGURE 17. The relationship between critical strain and strain rate of rubber mortar with different contents of crumb rubber.
The relationship between DIF and strain rate of rubber mortar with different particle sizes is shown in Figure 16. As the figure displays, the particle size of crumb rubber has no obvious influence on DIF value and the DIF value of different mix proportions is close under the condition of approximate strain rate. This can be attributed to that R80–10, R60–10, R50–10, and R30–10 have similar static compressive strength and deformation capacity. Therefore, there is no obvious difference in the condition of dynamic impact.
Figure 17 illustrates the relation between the critical strain and content of CRM. It can be seen from the figure that under the condition of low strain rate (45 s−1), no significant difference of critical strain has been found between the specimens with different rubber contents. However, under the condition of dynamic compression, the increase of the content of crumb rubber will initiate the increase in the critical strain value. Consequently, compared with RM, R80–05, R80–10, and R80–15, R80–20, the specimen with the largest crumb rubber content, has the largest critical strain value, which is different from that under static compression. This phenomenon can be explained as follows. The critical strain value is determined by two factors: the strength and deformation capacity. When under the static compression condition, strength will decrease with the increase of crumb rubber content. On the other hand, the lower static strength will result in the more obvious the dynamic strain effect. In general, the specimens with a high content of crumb rubber will have higher strength growth and will obtain a larger critical strain. Therefore, when the content of the crumb rubber is high, the critical strain value becomes large, too.
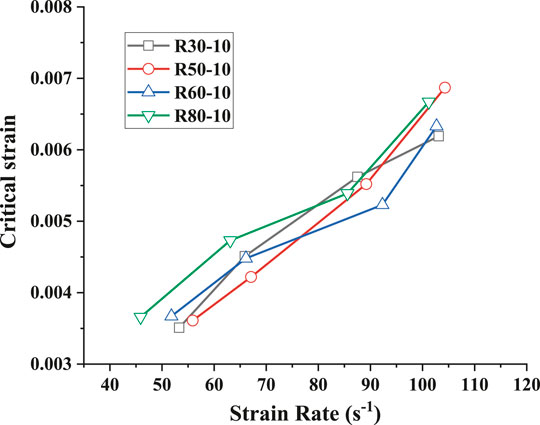
FIGURE 18. The relationship between critical strain and strain rate of rubber mortar with different sizes of crumb rubber.
Figure 18 shows the effect of the particle size of crumb rubber on the critical strain. It conveys that the particle size of crumb rubber has little effect on the critical strain under the dynamic impact because no significant difference has been found in the critical strain of four kinds of CRM specimens. This phenomenon is consistent with the performance of static compression.
The compressive toughness of rubber mortar specimens under impact load is shown in Table 5 and Figure 19. According to them, the compressive toughness index increases with the increase of the content of crumb rubber, indicating that crumb rubber plays an important role in improving the energy dissipation capacity of mortar materials. Under the condition of a high strain rate, the rubber mortar with high content shows better energy absorption capacity. For example, under the strain rate of 100 s−1, the compressive toughness of R80–5, R80–10, R80–15, and R80–20 were 1.853, 1.903, 2.169, and 2.331, respectively, meaning an increase of 1.6, 4.3, 18.9, and 27.8% compared with 1.824 of the RM. Besides, under the condition of high strain rate dynamic impact, cracks will gradually appear inside the rubber mortar, and when the cracks extend to the position of crumb rubber particles, the crumb rubber particles will deform greatly because of the external stress. Since the rubber is a kind of viscoelastic material, it has good deformation capacity and viscous energy dissipation capacity. Therefore, under the action of external forces, the friction deformation, which is significantly greater than brittle mortar, will occur between the rubber particles and the cement base. Apart from that, the stress-strain curve in Figure 11 also suggests that the mortar mixed with crumb rubber has a large peak strain. Moreover, the higher the content of crumb rubber, the greater the peak strain. The higher the strain rate is, the more significant the frictional deformation and energy dissipation between crumb rubber particles and cement matrix will be.
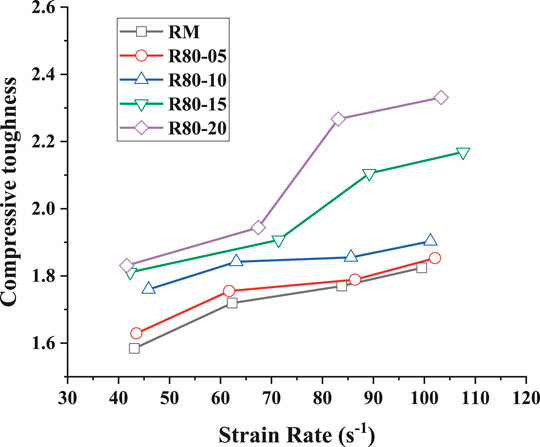
FIGURE 19. Compressive toughness of mortar with different rubber contents under dynamic impact.
The compressive toughness of CRM with different particle sizes is shown in Figure 20. There was no significant difference in the compressive toughness of the CRM with four different particle sizes.
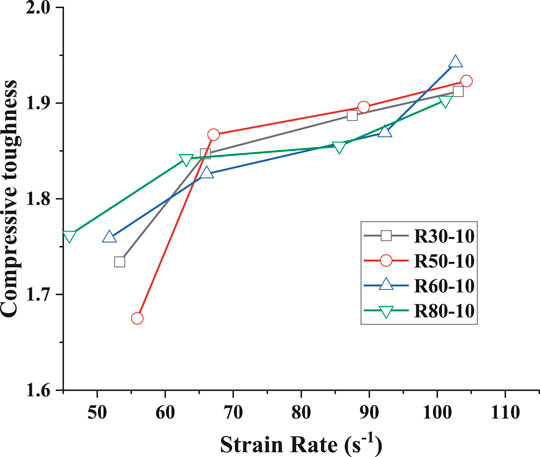
FIGURE 20. Compressive toughness of mortar with different rubber particle sizes.
The failure patterns of rubber mortar with different crumb rubber contents under four-strain rates are shown in Figure 21. According to the figure, the damage degree of the specimen decreases, with the increase of rubber content. As shown in Figure 21A, RM specimens without rubber tend to show pulverized failure under the impact resistance test of strain rate 43.1 s−1. When the rubber content reaches 5%, as shown in Figure 9B, the crushing degree of the specimen decreases. The minimum element size of the specimen after failure significantly increased compared with that of the RM group. When the content of crumb rubber continued to increase to 10, 15, and 20%, the specimen could still maintain its shape under the impact load of medium strain rate (60.0 s−1). Therefore, under the condition of the medium strain rate, the increase of the content of crumb rubber has a significant effect on the dynamic compression performance and failure form of mortar. With the increase of strain rate, all the specimens show crushing failure.
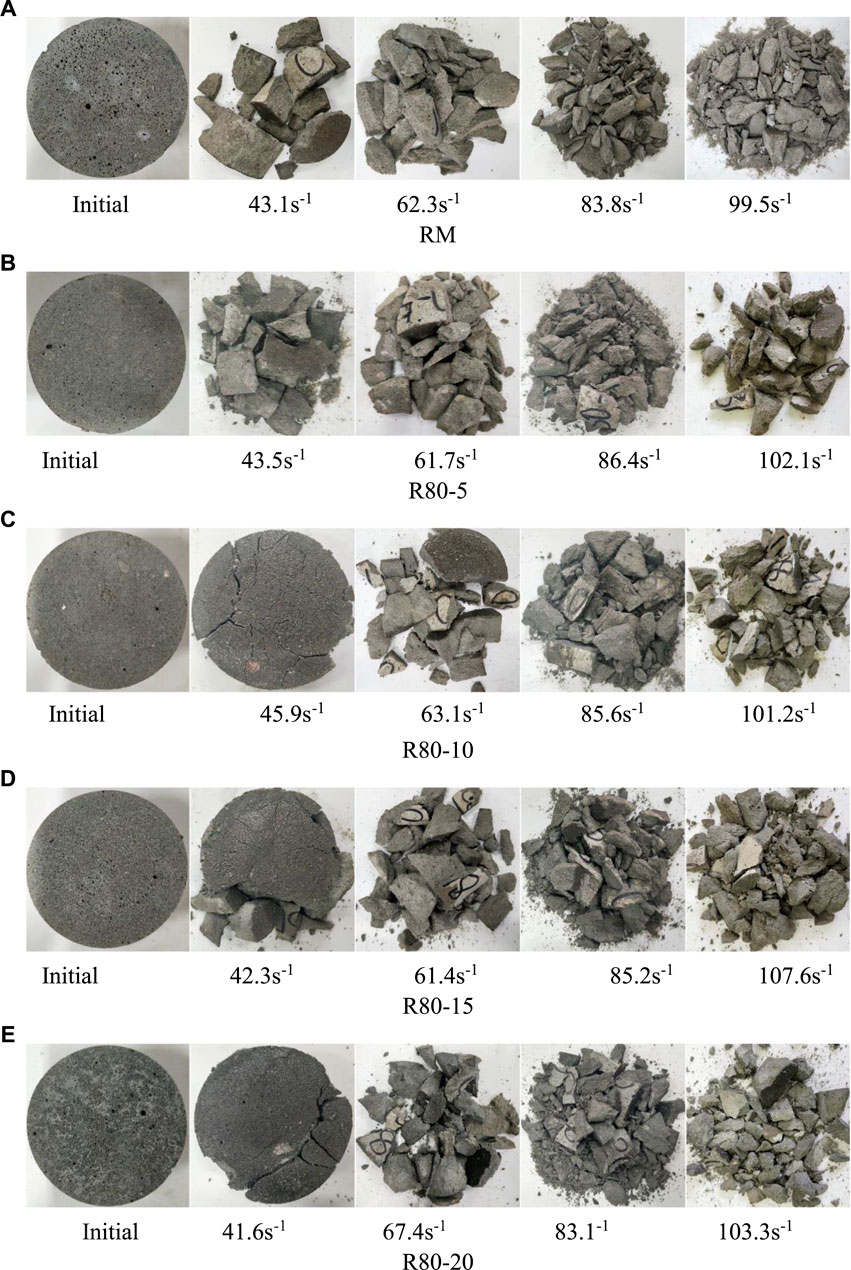
FIGURE 21. Influence of rubber dosage on failure pattern.
The influence of different rubber particle sizes on failure morphology is shown in Figures 22A–D. Rubber mortar with different particle sizes showed similar failure patterns. With the increase of strain rate, the failure of the specimen became more and more serious. When the strain rate was around 45 s−1, the specimen showed complete crushing. With the further increase of strain rate, the specimen showed comminuted failure. Besides, there is no significant difference between the size of the CRM.
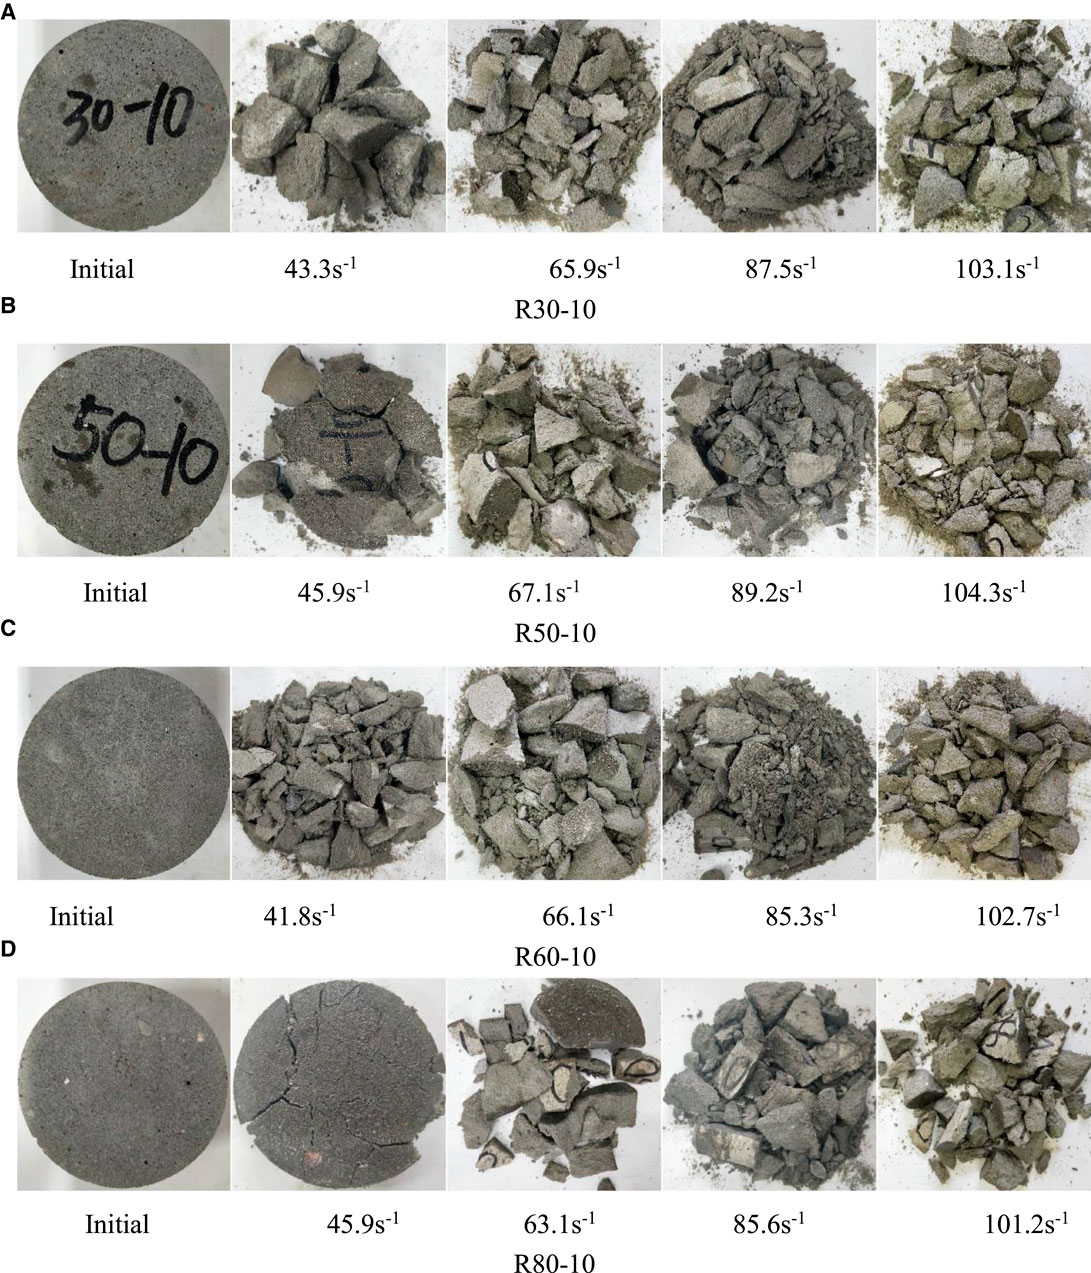
FIGURE 22. Effect of rubber particle size on the failure pattern.
(1) The fluidity of mortar decreases obviously with the addition of crumb rubber. CRM with fine rubber particles exhibits a worse fluidity for larger rubber particles.
(2) Incorporating crumb rubber in the mortar will result in a decrease in static compressive strength and modulus of elasticity of CRM. The static compressive strength and modulus of elasticity of the mortar with smaller rubber size are higher than that of the mortar with larger rubber size.
(3) The addition of crumb rubber has a positive effect on enhancing the deformation and energy absorption properties. The critical strain, compressive toughness of CRM increase with the increasing content of crumb rubber. However, the particle size of crumb rubber has no significant effect on the critical strain.
(4) The Guo Zhenhai model was introduced as the basic model equation to predict the stress-strain curves of crumb mortar, which proves that a very good correlation occurs between the experimental data with the analytical curves.
(5) The CRM shows an obvious strain rate effect. The dynamic compressive strength of the CRM and DIF will increase with the increase of strain rates if rubber contents remain constant.
(6) The dynamic compressive strength of CRM has been significantly reduced as the rubber replacement increases. However, the DIF increases with the increase in rubber content.
(7) The mortar with a higher rubber content has a more obvious strain rate effect, and the compressive strength has improved to a greater extent under the dynamic impact. The higher the content of the crumb rubber is, the higher the DIF value is. The particle size of crumb rubber has no obvious influence on DIF value. The DIF value of different mix proportions is close under the condition of approximate strain rate.
(8) Similar to the static compressive test, the addition of crumb rubber under dynamic impact loading has a positive effect in enhancing the deformation and energy absorption properties. The dynamic compressive toughness of the CRM increases with the increase in rubber content. However, the particle sizes of rubber have little effect on dynamic compressive toughness.
The raw data supporting the conclusions of this article will be made available by the authors, without undue reservation.
MY, ZG and WZ contributed to the conception of the study. MY and WZ performed the experiment. ZG, GC, and LZ contributed significantly to analysis and manuscript preparation. MY and WZ performed the data analyses and wrote the manuscript. GC and LZ helped to perform the analysis with constructive discussions.
This research was financially supported by the National Natural Science Foundation of China (51678309, 51978339), State Key Laboratory of Silicate Materials for Architectures (Wuhan University of Technology), Priority Academic Program Development Jiangsu Higher Education Institutions (PDPA).
The authors declare that the research was conducted in the absence of any commercial or financial relationships that could be construed as a potential conflict of interest.
Al-Akhras, N. M., and Smadi, M. M. (2004). Properties of tire rubber ash mortar. Cem. Concr. Compos. 26, 821–826. doi:10.1016/j.cemconcomp.2004.01.004
Angelin, A. F., Miranda, E. J. P., Santos, J. M. C. D., Lintz, R. C. C., and Gachet-Barbosa, L. A. (2019). Rubberized mortar: The influence of aggregate granulometry in mechanical resistances and acoustic behavior. Constr. Build. Mater. 200, 248–254. doi:10.1016/j.conbuildmat.2018.12.123
ASTM (2014). Standard test method for static modulus of elasticity and poisson's ratio of concrete in compression. ASTM C469 / C469M-14, West Conshohocken, PA: ASTM.
Atahan, A. O., and Yücel, A. Ö. (2012). Crumb rubber in concrete: Static and dynamic evaluation. Constr. Build. Mater. 36, 617–622. doi:10.1016/j.conbuildmat.2012.04.068
Bischoff, P. H., and Perry, S. H. (1991). Compressive behaviour of concrete at high strain rates. Mater. Struct. 24, 425–450. doi:10.1007/bf02472016
Chen, X., Wu, S., and Zhou, J. (2013). Experimental and modeling study of dynamic mechanical properties of cement paste, mortar and concrete. Constr. Build. Mater. 47, 419–430. doi:10.1016/j.conbuildmat.2013.05.063
China National Standardization Management Committee (2005). Test method for fluidity of cement mortar. GB/T2419-2005 (Beijing). Beijing, China: China Standards Press.
Corinaldesi, V., Mazzoli, A., and Moriconi, G. (2011). Mechanical behaviour and thermal conductivity of mortars containing waste rubber particles. Mater. Des. 32, 1646–1650. doi:10.1016/j.matdes.2010.10.013
Dehdezi, P. K., Erdem, S., and Blankson, M. A. (2015). Physico-mechanical, microstructural and dynamic properties of newly developed artificial fly ash based lightweight aggregate - Rubber concrete composite. Compos. B Eng. 79, 451–455. doi:10.1016/j.compositesb.2015.05.005
Feng, W., Liu, F., Yang, F., Li, L., and Jing, L. (2018). Experimental study on dynamic split tensile properties of rubber concrete. Constr. Build. Mater. 165, 675–687. doi:10.1016/j.conbuildmat.2018.01.073
Gerges, N. N., Issa, C. A., and Fawaz, S. A. (2018). Rubber concrete: mechanical and dynamical properties. Case Stud. Constr. Mater. 9, e00184. doi:10.1016/j.cscm.2018.e00184
Karakurt, C. (2015). Microstructure properties of waste tire rubber composites: an overview. J. Mater. Cycles Waste Manag. 17, 422–433. doi:10.1007/s10163-014-0263-9
Khaloo, A. R., Dehestani, M., and Rahmatabadi, P. (2008). Mechanical properties of concrete containing a high volume of tire-rubber particles. Waste Manag. 28, 2472–2482. doi:10.1016/j.wasman.2008.01.015
Li, D., Zhuge, Y., Gravina, R., and Mills, J. E. (2018). Compressive stress strain behavior of crumb rubber concrete (CRC) and application in reinforced CRC slab. Constr. Build. Mater. 166, 745–759. doi:10.1016/j.conbuildmat.2018.01.142
Li, Y., Zhang, X., Wang, R., and Lei, Y. (2019). Performance enhancement of rubberised concrete via surface modification of rubber: A review. Constr. Build. Mater. 227, 116691. doi:10.1016/j.conbuildmat.2019.116691
Liu, F., Chen, G., Li, L., and Guo, Y. (2012). Study of impact performance of rubber reinforced concrete. Constr. Build. Mater. 36, 604–616. doi:10.1016/j.conbuildmat.2012.06.014
Lv, J., Du, Q., Zhou, T., He, Z., and Li, K. (2019). Fresh and mechanical properties of self-compacting rubber lightweight aggregate concrete and corresponding mortar. Adv. Mater. Sci. Eng. 2019, 1–14. doi:10.1155/2019/8372547
Onuaguluchi, O. (2015). Effects of surface pre-coating and silica fume on crumb rubber-cement matrix interface and cement mortar properties. J. Clean. Prod. 104, 339–345. doi:10.1016/j.jclepro.2015.04.116
Ravichandran, G., and Subhash, G. (1994). Critical appraisal of limiting strain rates for compression testing of ceramics in a split hopkinson pressure bar. J. Am. Ceram. Soc. 77, 263–267. doi:10.1111/j.1151-2916.1994.tb06987.x
Roychand, R., Gravina, R. J., Zhuge, Y., Ma, X., Youssf, O., and Mills, J. E. (2020). A comprehensive review on the mechanical properties of waste tire rubber concrete. Constr. Build. Mater. 237, 117651. doi:10.1016/j.conbuildmat.2019.117651
Son, K. S., Hajirasouliha, I., and Pilakoutas, K. (2011). Strength and deformability of waste tyre rubber-filled reinforced concrete columns. Constr. Build. Mater. 25, 218–226. doi:10.1016/j.conbuildmat.2010.06.035
Song, W.-J., Qiao, W.-G., Yang, X.-X., Lin, D.-G., and Li, Y.-Z. (2018). Mechanical properties and constitutive equations of crumb rubber mortars. Constr. Build. Mater. 172, 660–669. doi:10.1016/j.conbuildmat.2018.03.263
Strukar, K., Kalman Šipoš, T., Miličević, I., and Bušić, R. (2019). Potential use of rubber as aggregate in structural reinforced concrete element - A review. Eng. Struct. 188, 452–468. doi:10.1016/j.engstruct.2019.03.031
Uygunoğlu, T., and Topçu, 0.B. (2010). The role of scrap rubber particles on the drying shrinkage and mechanical properties of self-consolidating mortars. Constr Build Mater. 24, 1141–1150. doi:10.1016%2Fj.conbuildmat.2009.12.027
Xu, J., Yao, Z., Yang, G., and Han, Q. (2020). Research on crumb rubber concrete: from a multi-scale review. Constr. Build. Mater. 232, 117282. doi:10.1016/j.conbuildmat.2019.117282
Yang, G., Chen, X., Guo, S., and Xuan, W. (2019). Dynamic mechanical performance of self-compacting concrete containing crumb rubber under high strain rates. Ksce J. Civ. Eng. 23, 3669–3681. doi:10.1007/s12205-019-0024-3
Keywords: crumb rubber mortar, stress-strain, split-Hopkinson pressure bar, dynamic impact, compression
Citation: Yang M, Guo Z, Zhang W, Chen G and Zhang L (2020) Static and Dynamic Compressive Stress-Strain Behavior of Recycled Tire Crumb Rubber Mortar. Front. Mater. 7:552043. doi: 10.3389/fmats.2020.552043
Received: 15 April 2020; Accepted: 17 August 2020;
Published: 30 October 2020.
Edited by:
Carlos Chastre, New University of Lisbon, PortugalReviewed by:
Yunchao Tang, Zhongkai University of Agriculture and Engineering, ChinaCopyright © 2020 Yang, Guo, Zhang, Chen and Zhang. This is an open-access article distributed under the terms of the Creative Commons Attribution License (CC BY). The use, distribution or reproduction in other forums is permitted, provided the original author(s) and the copyright owner(s) are credited and that the original publication in this journal is cited, in accordance with accepted academic practice. No use, distribution or reproduction is permitted which does not comply with these terms.
*Correspondence: Wenhua Zhang, emhhbmd3ZW5odWFAbmpmdS5lZHUuY24=
Disclaimer: All claims expressed in this article are solely those of the authors and do not necessarily represent those of their affiliated organizations, or those of the publisher, the editors and the reviewers. Any product that may be evaluated in this article or claim that may be made by its manufacturer is not guaranteed or endorsed by the publisher.
Research integrity at Frontiers
Learn more about the work of our research integrity team to safeguard the quality of each article we publish.