 Kent Salomonsson
 Ales Svoboda
 Nils-Eric Andersson
 Anders E. W. Jarfors
- 1Department of Materials and Manufacturing, Jönköping University, Jönköping, Sweden
- 2Department of Mechanical Engineering, University of Skövde, Skövde, Sweden
- 3Department of Engineering Sciences and Mathematics, Luleå University, Luleå University of Technology, Luleå, Sweden
A finite element analysis of a complex assembly was made. The material description used was a physically based material model with dislocation density as an internal state variable. This analysis showed the importance of the materials’ behavior in the process as there is discrepancy between the bolt head contact pressure and the internals state of the materials where the assembly process allows for recovery. The end state is governed by both the tightening process and the thermal history and strongly influenced by the thermal expansion of the AZ91D alloy.
Introduction
Modern products are commonly complex assemblies of parts made from different materials made by different processes to provide the desired function. Critical in this is the fact that these products are made from dissimilar materials. Joining of dissimilar materials is not an easy task and taking in the importance of the end-of-life management with requirements on easy disassembly and separation of the materials for either reuse, remanufacturing or material recycling screw fittings is a powerful way to solve this (Bogue, 2007).
In the management of screw fittings involving dissimilar materials, it is important to ensure that the screws stay in place over the component life. This results in that the thread design (Guo et al., 2012) as well as both the assembly process and quality assurance of the assembly and process is important. As a result, the assembly process can involve several steps involving tightening and test running of the equipment and retightening to avoid issues that the screw is getting loose after delivery to the customer. This matter thus also involves factors such as mechanical vibration and temperature loads during the assembly process (Chen et al., 2017).
The processes and changes in material properties occurring in a dissimilar materials situation will result in a nonlinear manner and are very complex to interpret, causing a need for simulation support of complex assembly processes. To perform this kind of simulation, the initial and boundary condition for the assembly process must be known (Yu et al., 2015). Furthermore, accurate description of the material behavior of the critical materials in the multimaterial assembly must be used to describe stress and recovery processes that may occur changing the performance of the assembly. Having these it should be possible to describe and create a better understanding of critical steps and material choices and their performance in the assembly (Yu et al., 2015).
In the current study, a multimaterial screw fitting involving AZ91D magnesium and different steel parts in the form of a carburetor for a handheld tool is studied. The objective is to simulate this multimaterial screw fitting process to derive better understanding of the multimaterial complexity in mechanical joining. In this study, an advanced dislocation density model is used to describe the behavior of the AZ91D material. This was chosen to show the potential for use and capability of physically based modeling in the description of real complex assemblies. Critical for the current study is to understand the end state of the assembly as this is an important quality indication of the assembly and part in the design and selection of materials and dimensions as well as tolerances.
Description of the Complex Screw Fitting Test Case
Description of Part Assembly
The part studied was a carburetor assembly where the steel carburetor was mounted by use of four screws on top of the combustion chamber cylinder, Figures 1A. The four screws fixing the carburetor are visible, and the region studied in the current case was the lower left in the top view shown in Figures 1B.
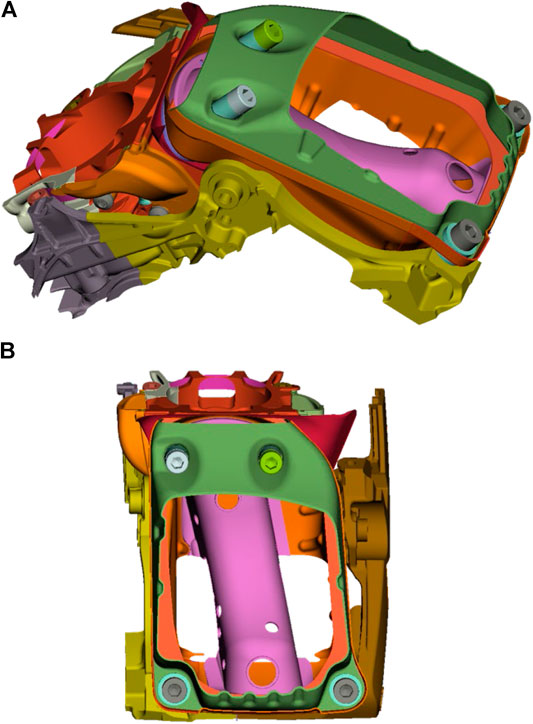
FIGURE 1. Assembly of the carburetor with (A) iso view and (B) top view.
Actual Physical Assembly Process Description
The actual physical assembly process is a combination of tightening the screw, heating, retightening, and ending with a test run of the engine. This will then result in the end state of the assembly. The steps of the assembly process of the part are as follows:
(1) Tightening the screw to 18 Nm at room temperature (RT)
(2) Running the engine to a semisteady state temperature at maximum power
(3) Cooling the engine to 125°C
(4) Holding the temperature at 125°C
(5) Retightening of the screws to 18 Nm at 125°C
(6) Cooling to RT
Numerical Modeling of the Physical Assembly Process
In order to study the screw fitting assembly process, one of the screws was selected for analysis as described in Description of Part Assembly. The preferred way of analysis was to create a finite element model and recreate the assembly process in a virtual setting. A region of the carburetor was selected large enough so that the boundary conditions did not affect the strain field in the vicinity of the selected screw fitting, to minimize the simulation time. A cross-section of the screw fitting is shown in Figure 2, which illustrates the different components involved.
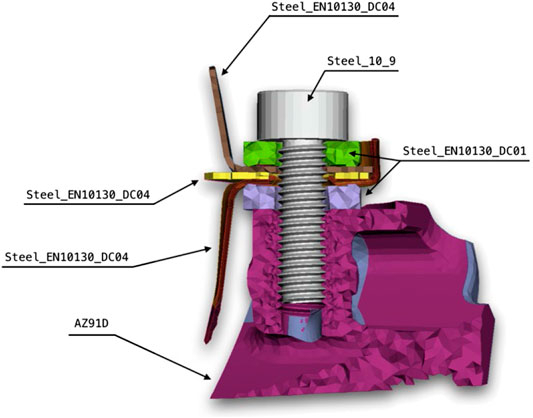
FIGURE 2. Cut FE model of the carburetor.
The magnesium alloy (AZ91D) component was considered the most critical component of the assembly; thus, its deformation and end state became the primary objective of the study. For this reason, the finite element mesh is denser in the threading.
Finite Element Model
The finite element model (FE model) is composed of first-order tetrahedral elements, pyramid elements, and hexahedral elements. The total number of finite elements was approximately 230,000. Preliminary studies of the screw fitting assembly process showed that the size of the linear finite elements, that is, a first-order model, is sufficient for analyzing plastic strains in the component.
The simulations were carried out using MSC Marc 12™ and the implicit coupled thermal displacement solver. Contact was modeled using a mortar contact algorithm and a constant Coulomb coefficient of friction of 0.3 for all contact surfaces.
Boundary Conditions and Loads
Due to the selection of only one screw for the analysis, a section of the carburetor was cut, and symmetry Dirichlet boundary conditions were applied to the surfaces shown in Figure 3.
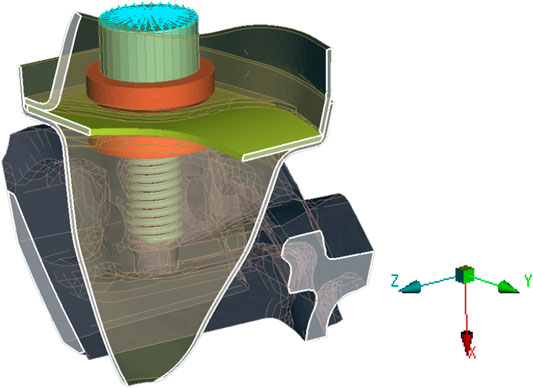
FIGURE 3. FE model of the cut section of the carburetor indicating the boundary condition surfaces.
Following the physical assembly process, the tightening of the screw was simulated by applying a torque of 18 Nm to the screw head also indicated in Figure 3. Apart from these mechanical boundary conditions and loads, a temperature load was also applied.
The initial thermal condition was that the whole assembly was at RT. The thermal load was highly complex as it originated from running the engine and as such involved transients and gradients over the assembly. To overcome this, the input originated from thermal measurements at specific locations used to calibrate a Computational Fluid Dynamics (CFD) simulation of the engine, provided by the product owner. This thermal field under a semisteady state was used to construct the thermal load for the simulated section of the assembly. The heating cycle was nearly linear to the steady temperature, and thus linear heating was assumed. The thermal load was constructed as linear heating from RT up to the semisteady state temperature field predicted by the CFD simulation. This means that the gradients were also reproduced implicitly, meaning that the linear heating rates varied in the different parts of the cross-section as part of the approximation.
Material Constitutive Models
Referring to Figure 2, it can be seen that mainly steels of different grades are used for most of the components except one which is made of a magnesium alloy AZ91D. Due to the loads that were applied, the steel components only deform elastically as a result of the applied boundary conditions and loads. In Table 1, the material elastic properties are shown. The magnesium alloy component deformed elastically as well as plastically. In the following section, the plasticity model used for the magnesium component is described in detail.
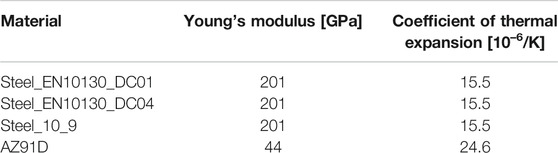
TABLE 1. Material elastic properties used in the FE model.
Formulation of the Constitutive Model
Deformation of metals is commonly described by empirical equations, relating flow stress to plastic strain, strain rate, and temperature. Empirical models are determined by means of fitting the model equations and parameters to experimental data without consideration of the actual physical processes occurring during the deformation. Despite good fit to measured stress-strain data within the range of strains, strain rates, and temperature, empirical relations typically lack predictive capabilities beyond the range used for fitting the parameters in terms of deformation conditions and material microstructure.
Inelastic deformation of AZ91D alloy is controlled by dislocation glide mechanisms with solute atoms as essential obstacles and varying morphologies. The advantage of using physically based flow stress models is an expected larger domain of validity since these models possess predicting capability outside the range of experimental data used for calibration.
The present model is a type of von Mises plasticity that uses von Mises function for deviatoric plasticity, and we assume associated flow rule. The difference to empirical plasticity models, that are of a curve-fitting nature, is that plastic strain is not used as an internal variable. The presented model includes a coupled set of evolution equations for the internal state variables, dislocation density, and vacancy concentration. The concept of the dislocation density is the amount (length) of dislocations for a representative volume element divided by its volume. The model considers both mobile and immobile dislocations. The microstructure is not represented explicitly but in an averaged sense.
The user subroutine interface WKSLP was used to implement a material model into MSC.Marc™ software. The subroutine allows the introduction of relations for yield stress and corresponding hardening slope as a function of strain, strain rate, and temperature. The implementation used is based on the additive decomposition of the spatial rate of the deformation tensor. A midpoint-projection type algorithm was used for the integration of the constitute relations.
Details of the model, including experimental procedures and parameter optimization, are found in Lindgren et al. (2008) for low strain rate applications, and modeling of high strain rate phenomena is presented in Wedberg et al. (2012) for AISI 316L. Dini et al. (2017) presented a dislocation density based constitutive model, including the effects of microstructure scale and temperature to predict flow stress of as-cast AZ91D alloy. This model is the basis for the current work. The fitting by Dini et al. (2018) was made on material produced with a wide range of cooling rates to vary the secondary dendrite arm spacing. The method used was a Bridgeman casting process that produces a relatively large grain size. Jarfors (2018) showed that for the case of Mg-alloys there is a physical significance of both primary grain size and secondary dendrite arm spacing due to coinciding growth directions and deformation planes which has consequences for the Hall-Petch relationship. Basic equations of the model are described shown in the next section, but the parameters have been refitted to the behavior of the commercially produced AZ91D material that had a significantly smaller grain size than the materials used by Dini et al. (2018).
Flow Stress Physical Model
An incompressible von Mises plasticity model was used under the assumption of isotropic plasticity. Flow stress was split into two components. The first component was due to long-range barriers, σG, which is unaffected by thermal energy, and a second component arising from short-range barriers, σ*, which is thermally activated; see Bergström (1969) and Lindgren et al. (2008). Hence, the yield stress in Eq. 1 was defined as the sum of the resistance from the long-range and short-range barriers:
Long-Range Barrier Contribution
The long-range barriers from Eq. 1 are due to interactions with the dislocation substructure and are directly related to the immobile dislocation density; see Seeger (1956). This was described as follows:
Here, m is the Taylor orientation factor transforming the effects of resolved shear stress in different slip systems into effective stress-strain relations and is affected by the texture, α is a proportionality factor that for the ideal theoretical case with a Poisson distribution is ½ but for real materials may deviate, ρi is the immobile dislocation density, G is a temperature-dependent shear modulus, and b is the Euclidean length of Burgers vector.
Short-Range Term Contribution
The short-range term in Eq. 1 is the thermally activated flow stress component. The strength of obstacles, which a dislocation encounters during its motion, determines the dependence of flow strength to applied strain rate. The velocity and density of mobile dislocations are related to the plastic strain rate according to the Orowan equation (Orowan, 1948),
where
Here,
If the stress is insufficient to drive a dislocation to pass a barrier having the activation energy
Here,
The strain rate dependent part of the yield stress from Eq. 1 can be derived according to the Kocks-Mecking formulation (Kocks et al., 1975), as
where
Dislocation Density Evolution Modeling
The equation for the flow stress, Eq. 1, requires evolution equations for internal state variables, which are the dislocation density and the vacancy concentration. The mobile dislocation density was assumed to be significantly smaller than the immobile dislocation density; see Bergström (1983). The immobile dislocation density is expressed in terms of hardening (+) and recovery (−) contributions. The presented model is tracing only the density of immobile dislocations ρi
where the index i denotes the immobile dislocation density.
Hardening Process
Mobile dislocations move over a mean free path Λ before they are immobilized or annihilated. According to the Orowan equation, the density of mobile dislocations and their average velocity are proportional to the plastic strain rate. It is reasonable to assume that an increase in immobile dislocation density also follows the same relation. Thus the pile-up of immobile dislocation density can be written (Bergström, 1983; Estrin, 1998) as
The mean free path can be computed from the initial grain size g0, secondary dendrite arm spacing λ2, and the dislocation subcell diameter s, see Dini et al. (2018), as
The size of dislocation subcells is related to the immobile dislocation density by the calibration parameter Kc. The formation and evolution of subcells are modeled using a relation proposed by Holt (1970)
It should here be noted that due to the unique relation of dendrite growth directions and the slip planes in HCP materials such as an AZ91D Mg alloy this description is still not sufficient to be completely generalized, most likely due to the relationship between twinning and grain size (Jarfors, 2018).
Restoration Processes
The creation and motion of vacancies are related to the recovery of dislocations, which usually occurs at elevated temperatures. The creation of vacancies requires energy and their concentration increases with temperature and deformation. Recovery, remobilization, and/or annihilation of dislocations are proportional to the dislocation density and controlled by dislocation glide and climb. Bergström (1983) described dislocation recovery by glide as
where Ω is a recovery function that depends on temperature and strain rate. This model accommodates dynamic recovery due to the strain rate. Static recovery controlled by diffusional climb was assumed to have the following form; see Militzer et al. (1994).
In Eq. 13,
where a is lattice constant,
Generation and Migration of Vacancies
The calculation of the vacancy concentration is required for the solution of Eq. 13. When a crystalline material is kept sufficient time at a given temperature, an equilibrium vacancies concentration is reached. Deforming the material or changing the temperature generates the excess vacancies, defined as
The stress σy in Eq. 15 is equal to the flow stress during plastic deformation; the factor
Model Calibration
An in-house Matlab™ based software was used to obtain the calibrated parameters of the model. The software uses constrained minimization routine in Matlab™ and can handle multiple experiments for the optimization. All parameters for the dislocation model presented in Dini et al. (2018) were used as initial values. In the next step, the initial parameters for as-cast material were recalibrated using data from compression and tensile tests performed on high-pressure die-cast material. This step was necessary due to the nature of the Hall-Petch contribution in the AZ91D Mg alloy as described by Jarfors (2018). The materials constants of the model are to be found in Dini et al. (2018), while the calibrated temperature-independent parameters for the model presented in the current paper are collated in Table 2. The temperature-dependent calibrated parameters are collated in Table 3.
TABLE 2. Calibrated parameters of the model.
TABLE 3. Calibrated temperature-dependent parameters of the model.
The quality of the calibration and validation of the calibration were made through fitting and optimizing the model through one set of tensile tests and comparing these with another set of tensile tests for the high-pressure die-cast materials with only six samples needed for the recalibration. The fit between experimental data and tensile data for validation is shown in Figure 4.
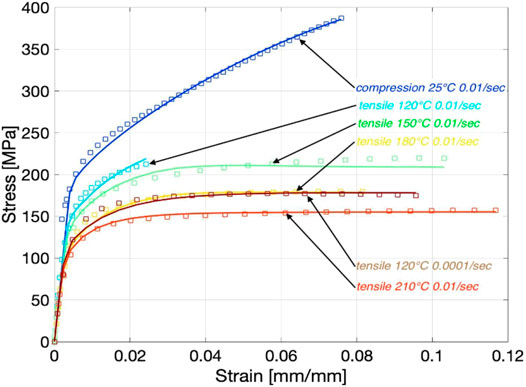
FIGURE 4. Flow stress curves used for the calibration. The lines are computed values.
Results and Discussion
Contact Pressure Evolution
The quality of a screw fitting is hard to evaluate, as there are many loads and conditions that may determine this, but a first step is to evaluate this as the evolution of the average contact pressure on the mating surface of the contact pressure of the screw. This surface and the pressure distribution on this surface at the end of the simulation/assembly cycle are shown in Figure 5A. Here it can be noticed that the contact pressure is highest near the threading and lesser at the outer edge of the bolt head. This is a clear indication that there is an elastic interaction and that the distance from the threading increases the area of the bolt, and as such, this should be proportional to the inverse of the square of the distance from the threading. The pressure distribution is not entirely symmetric which also reflects that the screw enters the threading that is a helix and a slight asymmetry is to be expected as the distance to the threading contact surface is asymmetric. Similarly, as the screw is in the corner of the assembly, a slight asymmetry in the substrate stiffness is also expected all showing up as an asymmetry. One quality of the screw fitting design would be the asymmetry of the contact as friction is not maximized. In the current case for the real assembly the washer is knurled, and the pattern on the surface would aid the friction and secure the screw as long as the contact pressure is sufficient.
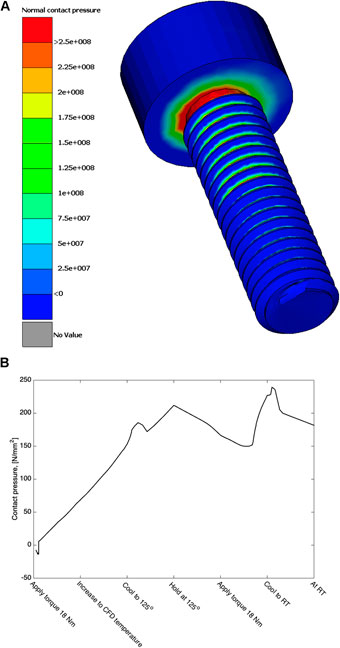
FIGURE 5. Contact pressure at the mating surface of the screw: (A) the distribution of pressure on the screw head at the end of the assembly, (B) the evolution of the average contact pressure on the contact surface.
In Figure 5B, the evolution of the contact pressure in the quasistatic analysis is shown. Each step in the assembly is visible. In the application of the torque the bolt is rotated till the required moment of 18 Nm is achieved. In the very beginning there is no contact between the bolt and surface, but once contact is made, there is a steady increase until an approximate contact pressure of 50 MPa is reached corresponding to 1/3 of the yield strength at RT. The conditions in the threads are discussed in the following section as they require special attention.
After this first step, the combustion engine is started and run at maximum power to reach maximum temperature meaning that temperatures are well above the maximum service temperature in some regions but also meaning that significant temperature gradients are generated. This temperature field was modeled by use of CFD and incorporated into the coupled thermal-structural finite element model as linearly increasing from RT to the steady state solution of the CFD simulation. As the thermal expansion of the AZ91D alloy is higher than the surrounding materials, the pressure is increased as the screw is pulled toward the mating surface. The contact pressure here reaches above 150 MPa and is in the range for yielding at RT. Here it should be noted that it is likely that a limited plastic deformation takes place at the contact surface.
The third step is the cooling of the engine to 125°C. This implies that the temperature of the AZ91D alloy is made even and all gradients are removed. Initially, there is an increase followed by a decrease and then again an increase in the contact pressure. The increase is a clear indication that there initially is a continued expansion of the AZ91D alloy as the cooler regions of the engine will increase in temperature and vice versa.
The fourth step is to hold the assembly at 125°C, and during this step, there is a reduction of contact pressure, suggesting that there is a relaxation process taking place. This is difficult to resolve without making a thorough analysis of the events taking place in the threading. Subsequent to the isothermal holding is another retightening to 18 Nm. As the bolt is rotating during simulation it was evident that relaxation had taken place despite the fact that the contact pressure is higher than during the first tightening. This also must be a result of conditions in the threads. If it only were due to the contact between the bolt head and the mating surface, then it would not have been possible to rotate the bolt due to the frictions force required to turn the bolt as it would be more than three times that of the first tightening. It should also here be noted that the contact pressure at 125°C after tightening is in the same range as the tensile strength at 120°C from the tensile tests used to fit the parameters for the physically based material model for AZ91D. That the material still manages is due to the fact that there is a load distribution to a larger surface from the carburetor washer and so forth. This does stress the need for an analysis of the events in the threading.
The final step in the process is to cool down to RT. Due to the differences in thermal expansion, the expectation is a reduction of contact pressure as the AZ91D material should shrink more than the rest of the assembly making the screw relatively longer.
Threading Deformation and Validation of Simulation Results
As a first test, the predicted dislocation densities should be reasonably correct for the simulation of the screw fittings. This should provide a sound base for the model being accurate in the approach takes and a quasistatic approach. The point of validation is the first thread at which a slice was taken in the model, and a physical part is studied metallographically using a Scanning Electron Microscope and addressing the Kernel Average Misorientation (KAM) in order to calculate the dislocation density. In this way the Geometrically Necessary Dislocations can be approximated which corresponds to the currently calculated dislocation density in the current model, due to the fact that the mobile dislocations are assumed to have a short life span before immobilization and therefore should be the same in the model as what you see in the Geometrically Necessary Dislocations measurements.
The distribution of dislocations at the end of the assembly process, Figure 6A, clearly shows that there has been a significant increase from the initial value of 1.04⋅1013 m/m3. This is direct evidence that in the model the AZ91D material was plastically deformed in the threading. The Blue region is the screw pressing the threading upwards with tension at the corner below the screw and compression under a bending/shearing condition where a broader region with high dislocation density is seen. Plotting the distribution along the line and comparing to the measurements using the KAM values, the result is shown in Figure 6B. The overall trend is the same with a higher value at the tip of the threading than in the root region passing through a maximum. That this maximum occurs was visible from Figure 6A where a shear band I generated from the root corner under tension to the opposite side under compression. The discrepancy seen can partly be explained by the assumption of the initial conditions. In the model the dislocation density is 1.04⋅1013 m/m3 evenly distributed in the whole volume and thus also along the line used for comparison. In reality, the threading is cut resulting in plastic deformation. This was assessed through KAM analysis of the threading in the as-cut condition without having undergone assembly. This thread cutting process resulted in an increase of dislocation with nearly a factor 5 of an addition of 0.5 1014 m/m3 more dislocations at the top and a factor 2 or 0.1 1014 m/m3 at the root. This means that adding this initial state in the discrepancy should increase somewhat for the model and be more tiled if the process was purely additive. Now, this is not the case as the plastic deformation also will influence the yield point for the start of the plastic deformation resulting in that the tip has a higher yield point at the start of the process. Annihilation processes and recovery during cooling and holding would also be slightly different. The model is however relatively close and as such should also be acceptable as it catches the trend and is reasonable near the absolute values.
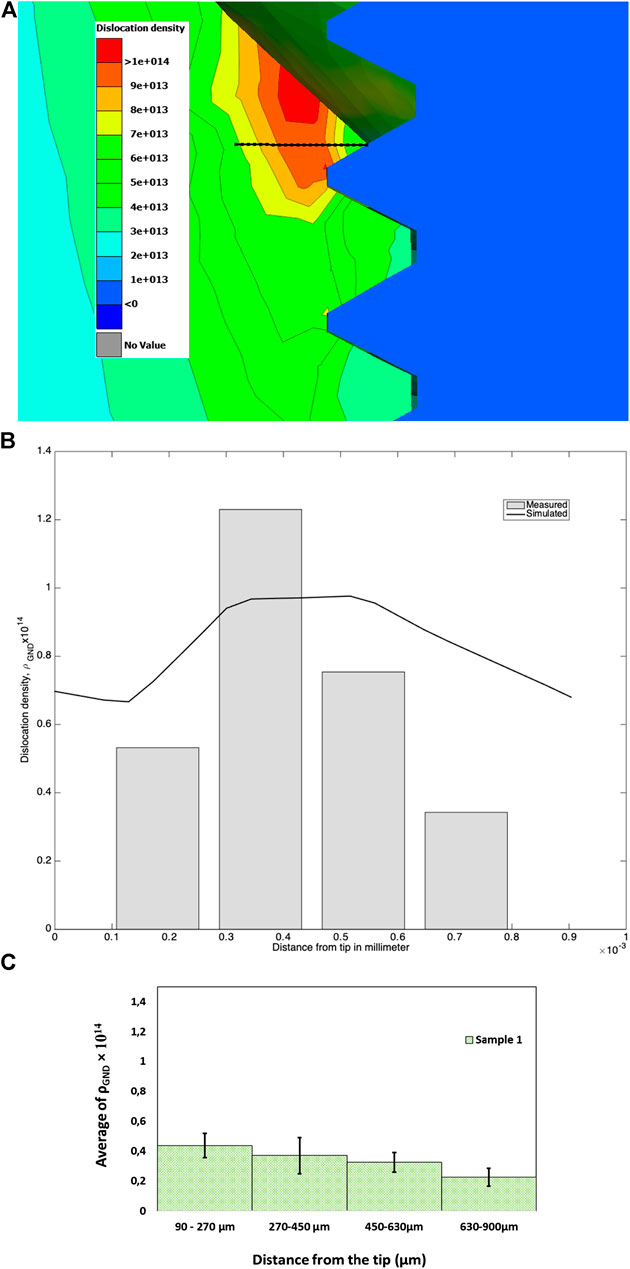
FIGURE 6. A cross-section of the attached screw in an attempt to illustrate the dislocation density (m/m3) in the top thread. The dislocation density is shown at the end of the assembly process. (A) Distribution of dislocations at the end also showing the center line along which the dislocation density was taken for comparison with measurements, (B) the simulated and measured dislocation density along the center line. The simulated average dislocation densities are given as function of the distance from the thread tip after the complete assembly process, (C) the initial distribution of dislocations used in the model and the measured distribution.
Making an analysis of the dislocation density in the top threading as the assembly process is performed reveals several essential events and observations. In Figure 7, the evolution of the dislocation density for five points along the black line in Figure 6A is shown. As the torque of 18 Nm is applied, the tip of the top threading is plastically deformed, and plastic deformation is just starting at the first point along the line 180 µm from the tip. In the real case this may not happen due to prior deformation from the thread cutting.
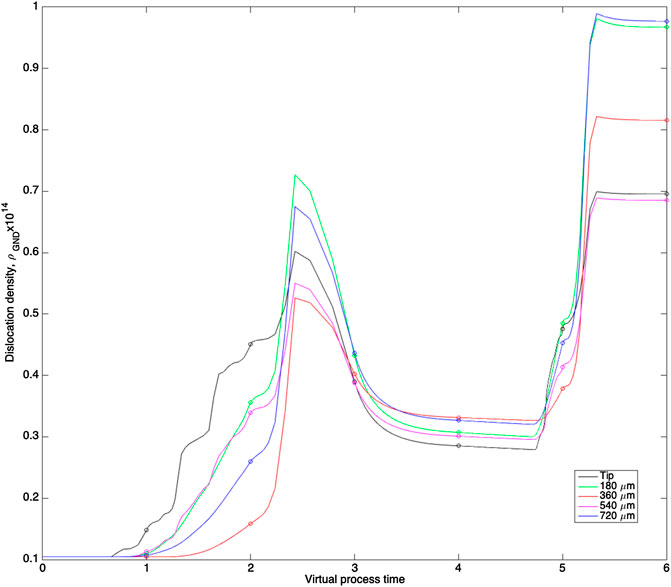
FIGURE 7. The dislocation density evolution at five (5) different locations along the black line shown in Figure 6A during the assembly process. The circles indicate the different steps in the assembly process. The values at virtual process time 6, end state, are also shown as simulated data in Figure 6B.
Subsequently, the engine is started and temperature increases. Thermal expansion in combination with the reduction of yield strength results in significant plastic deformation and also a strong deformation gradient from the thread tip and inwards. This also corroborates with the sharp increase in contact pressure as the threaded AZ91D material pulls the bolt downwards during heating.
During the third step as the engine is cooled to 125°C, the plastic deformation increases initially rapidly. It is also during this step that the dislocation density rapidly increases inside the threading as the point at 180 µm passes the tip and receives more deformation. Here, it should be noted that the deformation process is such that the deformation at the root is initially significant and the point at 720 µm away from the tip is the second most deformed point. This implies that the temperature of the AZ91D alloy is made even and all gradients are removed. As the temperature remains relatively high and the dislocation density is a peak recovery start and as the temperature is homogenized dislocation density was reduced. During the fourth isothermal holding state at 125°C, the recovery initially continued to reach a steady state at the end of the state. At the fifth step with retightening at 125°C there is little contact with the top thread as the weak recovery continues and the contact pressure was reduced until contact was made. Again contact pressure increased and plastic deformation was generated again. The current simulation was quasistatic, and the rate of recovery is hard to understand thoroughly under this mode. However, as the end result the dislocation density measurement has a reasonable agreement (see Figures 6b, 7) and it can be concluded that this recovery period is of great importance as the material recovers and allows retightening. Without this isothermal period threading fracture would be likely as AZ91D is a material with limited ductility and the recovery regains ductility and the materials soften.
The final cooling down to RT generates huge amounts of deformation and is as such the most dramatic event in the assembly process where the dislocation density is approximately doubled in the studied points. It should here be noted that Dini et al. (2015) showed that there is significant variability in the thermal expansion of AZ91D, brought on by the precipitation of Mg17Al12. This change occurs in the range of 8–11% Mg17Al12 as there is a change in the mode of precipitation from individual particles to a more continuous network. This network formation is driven by both the alloy composition and the grain size. The network is promoted by higher Zn contents and by reduced nucleation rates with increasing grain sizes.
Conclusion
In the current paper the assembly process of a carburetor was analyzed using a quasistatic finite element method. The complex five-step assembly process, involving tightening, heating, holding, and retightening, was difficult to analyze as it involved many steps and also a complex material behavior. To resolve this an advanced material model was also used based on a physically based principle with the dislocation density as an internal state variable.
The main conclusions were such that at the first stem with the torque at 18 Nm the upper threads were brought to the yield point of the material. For the subsequent heating to maximum use temperature onset of plastic deformation occurred primarily due to thermal gradients and thermal expansion and to a lesser extent due to reduction of the yield point with temperature. In this state any additional retightening would result in severe deformation and possible fracture of the threads.
The physically based modeling revealed that, at the peak temperature and during cooling to 125°C, a relaxation of the material took place with dislocation recovery/annihilation as a result despite the fact that the contact pressure initially increased. This recovery also hinders failure of the threads in the assembly process and is as such an essential element in a successful assembly process. The test run to maximum use temperature is also the step which is the most difficult to control accurately and to ensure that it is repeatable. In order to get some control holding under isothermal conditions at 125°C has been developed for the assembly sequence.
Retightening is a standard procedure for any process where vibrations and elevated temperature are involved, and hence this was also used. Retightening with the same peak torque ensures that the contact pressure for the bolt head reached the maximum value, but this did not result in the maximum deformation at the top thread. In the cooling to RT thermal stress results in significant deformation and dislocation generation despite the fact that the bolt pressure is reduced.
The fact that the first heating step results in a significant deformation, and the final cooling results in significant deformation, stresses the importance of thermal expansion of the AZ91D alloy. Dini et al. (2015) showed that there is a significant variability in the thermal expansion of AZ91D that was brought on by the precipitation of Mg17Al12. The root cause of this variability is that in the precipitation of Mg17Al12 range of 8–11% there is a change in precipitation mode from individual particles to a more continuous network. This is driven by both the alloy composition and the grain size. The skeleton is driven by higher Zn contents and by reduced nucleation rates with increasing grain sizes, stressing the need and importance of further research and development of inoculation of AZ91D.
Data Availability Statement
The original contributions presented in the study are included in the article/Supplementary Material; further inquiries can be directed to the corresponding author.
Author Contributions
AJ initiated the work and obtained the funding. KS made the models and analyzed the assembly process. AS performed the simulation. AJ analyzed the material and obtained the dislocation densities. KS, AS, AJ, and N-EA wrote the paper together and made the final approval to submit together.
Funding
The current work was funded by the Knowledge foundation, first under the project CompCAST contract no. 20100280 and later under the project CompCAST Plus contract no. 20170066.
Conflict of Interest
The authors declare that the research was conducted in the absence of any commercial or financial relationships that could be construed as a potential conflict of interest.
References
Bergström, Y. (1969). A dislocation model for the stress-strain behaviour of polycrystalline α-Fe with special emphasis on the variation of the densities of mobile and immobile dislocations. Mater. Sci. Eng. 5, 193–200. doi:10.1016/0025-5416(70)90081-9
Bergström, Y. (1983). The plastic deformation of metals - a dislocation model and its applicability. Rev. Powder Metall. Phys. Ceram. 2/3, 79–265.
Bogue, R. (2007). Design for disassembly: a critical twenty first century discipline. Assem. Autom. 27, 285–289. doi:10.1108/01445150710827069
Chen, Y., Gao, Q., and Guan, Z. (2017). Self-loosening failure analysis of bolt joints under vibration considering the tightening process. Shock Vib. 2017, 2038421. doi:10.1155/2017/2038421
Dini, H., Andersson, N.-E., Ghassemali, E., and Jarfors, A. E. W. (2015). Microstructural scale effects on thermal expansion behaviour of cast AZ91D. Magnes. Tech. 2015 361–365. doi:10.1007/978-3-319-48185-2_67
Dini, H., Svoboda, A., Andersson, N.-E., Ghassemali, E., Lindgren, L.-E., and Jarfors, A. E. W. (2017). “Modeling the deformation behavior of as-cast Az91D including the effect of the cast microstructure,” in Plasticity’17: the twenty third international conference on plasticity, Damage, and Fracture, Puerto Vallarta, Mexico, January 3–9, 2017, 37–39.
Dini, H., Svoboda, A., Andersson, N.-E., Ghassemali, E., Lindgren, L.-E., and Jarfors, A. E. W. (2018). Optimization and validation of a dislocation density based constitutive model for as-cast Mg-9%Al-1%Zn. Mater. Sci. Eng. A 710, 17–26. doi:10.1016/j.msea.2017.10.081
Estrin, Y. (1998). Dislocation theory based constitutive modelling: foundations and applications. J. Mater. Process. Technol. 80-81, 33–39. doi:10.1016/S0924-0136(98)00208-8
Guo, X., Zou, L. L., Lu, B., Zhang, S. L., Su, X. R., and Xu, H. (2012). Research on the connection performance of variable pitch of screw threaded casing based on 3d finite element simulation model. Appl. Mech. Mater. 215–216, 1105–1110. doi:10.4028/www.scientific.net/AMM.215-216.1105
Frost, H. J., and Ashby, M. F. (1982). Deformation mechanism maps - the plasticity and creep of metals and ceramics. Oxford, UK: Pergamon Press.
Holt, D. L. (1970). Dislocation cell formation in metals. J. Appl. Phys. 41, 3197–3201. doi:10.1063/1.1659399
Jarfors, A. E. W. (2018). “Grain size and secondary dendrite arm spacing; A priori discussion on the difference between FCC and HCP materials,” in MAGNESIUM 2018: proceedings of the 11th international conference on magnesium, 2018, 51–55. (ISBN 1908549378, 9781908549372).
Kocks, U. F., Argon, A. S., and Ashby, M. F. (1975). Thermodynamics and kinetics of slip. Prog. Mater. Sci. 19, 224.
Lindgren, L.-E., Domkin, K., and Hansson, S. (2008). Dislocations, vacancies and solute diffusion in physical based plasticity model for AISI 316L. Mech. Mater. 40, 907–919. doi:10.1016/j.mechmat.2008.05.005
Militzer, M., Sun, W. P., and Jonas, J. J. (1994). Modelling the effect of deformation-induced vacancies on segregation and precipitation. Acta Metall. Mater. 42, 133–141. doi:10.1016/0956-7151(94)90056-6
Orowan, E. (1948). Symposium on internal stresses in metals and alloys, London, UK: Institute of Metals, 451.
Reed-Hill, R. E., and Abbaschian, R. (1992). Physical metallurgy principles. Boston, MA: PWS Publishing Company.
Seeger, A. (1956). “Mechanics of glide and work hardening in FCC and HCP metals,” in Dislocations and mechanical properties of crystals. Ediots J. Fisher, W. G. Johnston, R. Thomson, and T. Vreland, 243–329.
Wedberg, D., Svoboda, A., and Lindgren, L.-E. (2012). Modelling high strain rate phenomena in metal cutting simulation. Model. Simul. Mater. Sci. Eng. 20, 085006. doi:10.1088/0965-0393/20/8/085006
Keywords: assembly, finite element analysis, physically based modeling, dislocation, thermal expansion, screw fitting
Citation: Salomonsson K, Svoboda A, Andersson N-E and Jarfors AEW (2020) Modeling and Analysis of a Screw Fitting Assembly Process Involving a Cast Magnesium Component. Front. Mater. 7:534385. doi: 10.3389/fmats.2020.534385
Received: 23 April 2020; Accepted: 09 November 2020;
Published: 21 December 2020.
Edited by:
Asa Barber, London South Bank University, United KingdomReviewed by:
Weilin Deng, Brown University, United StatesYongxing Shen, Shanghai Jiao Tong University, China
Copyright © 2020 Salomonsson, Svoboda, Andersson and Jarfors. This is an open-access article distributed under the terms of the Creative Commons Attribution License (CC BY). The use, distribution or reproduction in other forums is permitted, provided the original author(s) and the copyright owner(s) are credited and that the original publication in this journal is cited, in accordance with accepted academic practice. No use, distribution or reproduction is permitted which does not comply with these terms.
*Correspondence: Anders E. W. Jarfors, YW5kZXJzLmphcmZvcnNAanUuc2U=