- School of Materials and Architecture Engineering, Guizhou Normal University, Guiyang, China
The technology of 3D printing concrete has undergone rapid development in the last few years due to its lower environmental impact than that of conventional concrete. To investigate the fresh and the hardened behavior as well as the microstructure of 3D printing cementitious materials (3DPC) containing nano-CaCO3 (NC), four replacement ratios of NC to binder from 1 to 4% are investigated. 3DPC without NC was used as a control specimen. The workability, such as fluidity, extrudability, printability limit, and deformation under self-weight, and the flexural and compressive strength of 3DPC are tested. The strength development of 3DPC is compared with that of the cast specimens. The hydration products and the microstructure of specimens were also investigated by derivative thermogravimetry (DTG), thermogravimetry analysis (TGA), scanning electron microscopy (SEM), and backscattered electron (BSE) imaging. The results indicate that the fluidity, extrudability, printability limit, and deformation under self-weight demonstrate a decreasing tendency to increase the NC content. This is attributed to the large specific surface area of NC, which increases the mixtures’ consistency. Adding 2% of NC exhibited about 7.2, 39.1, and 22.5% higher compressive strength than that of the control mixture at 7, 28, and 90 days. The enhancement of strength of 3DPC with NC can be ascribed to the filler effects and the seeding effects of NC. Furthermore, NC refines the pore structure and improves the microstructure of 3DPC due to its filler effects and accelerating effects.
Introduction
Three-dimensional concrete printing is defined as an automated process based on 3D model data to realize objects from bottom to top layer by layer. This technology decreases the building procedure to a one-step process (Ma G.W. et al., 2018), and concrete is only deposited whereby it is necessary. Therefore, it may contribute to a sustainable environment (De Schutter et al., 2018). Besides that, it would be one of the emerging technology in the construction industry due to its advantages such as rapid construction speed, a higher degree of customization, low-cost production, material savings, and energy conservation (Kazemian et al., 2017; Long et al., 2019).
In the past few years, 3D concrete printing systems have developed very rapidly. Some 3D printing systems have been developed. Contour crafting, invented by Dr. Behrokh Khoshnevis of the University of Southern California, is commonly recognized as the first building-scale 3D concrete printing process (Feng et al., 2015), and it would be a feasible way for constructing infrastructure on the moon or Mars (Khoshnevis et al., 2016). Other two well-known building-scale 3D concrete printing processes are D-shape and “concrete printing,” developed by researchers in Italy and the United Kingdom, respectively (Feng et al., 2015).
The novel idea of 3D printing concrete has been an important research topic for several years (Gao et al., 2015; Labonnote et al., 2016; De Schutter et al., 2018; Ngo et al., 2018). The performance of 3D printing concrete is very different from that of traditional concrete (Feng et al., 2015; Ma and Wang, 2018). In particular, the fresh-state performance of 3D printing concrete must be compatible with 3D printers (Long et al., 2019). Therefore, understanding the workability and the mechanical performance of 3D printing concrete is an essential issue in achieving building-scale application. The most critical performance of 3DPC is in terms of extrudability and buildability, which are influenced to no small extent by mix proportions and admixtures, such as superplasticizer, accelerator, and polypropylene fibers (Le et al., 2012a). This was followed by studies on the hardened performance of high-performance concrete for the 3D printing process (Le et al., 2012b). Hambach and Volkmer (2017) developed 3D printing cementitious composite reinforced short fibers. The novel materials exhibited high flexural and compressive strength. Soltan and Li (2018) introduced a novel approach for 3D printing self-reinforced cementitious composites. The material was designed to reduce or eliminate the need for steel reinforcement in printed structures, providing more freedom and efficiency for building-scale 3D printing processes. The inclusion of a small number of fibers is an effective method to enhance the ductility of cementitious materials and reduce the dependence of structural members on steel reinforcement (Yang et al., 2007; Ruan et al., 2018; Yu et al., 2020). Asprone et al. (2018) proposed a method for preparing reinforced concrete members based on 3D printing technology. Wolfs et al. (2018) reported a model to analyze the early age mechanical performance of 3D printing concrete. Although past studies have carried out some of the desirable performance of 3DPC (Wangler et al., 2016; Khalil et al., 2017), extensive research and experimental data of 3DPC are still needed.
Globally, ordinary Portland cement (PC) is one of the most commonly used cementitious materials. It has already been established that cement production gives rise to the emission of CO2, which contributes significantly to global warming and air pollution (Mikulcic et al., 2016; Hossain et al., 2017). To reduce CO2 emissions, some researchers have tried to replace cement by alternative sustainable materials such as fly ash (FA) (Tang et al., 2016; Shaikh et al., 2017). However, the early age performance of cementitious materials with FA is inferior to cementitious materials without FA. It was found that concrete containing NC showed a significant improvement in mechanical strength and durability performances, which can be attributed to the improved microstructure of the concrete (Yesilmen et al., 2015; Shaikh et al., 2017; Yang and Che, 2018). Thus, the use of NC to improve the performance of concrete containing a large amount of FA has gained much attention in recent years (Hemalatha et al., 2016; Long et al., 2016; Korayem et al., 2017; Yang and Che, 2019). However, the application of NC in 3DPC is extremely insufficient, although some investigations have been made regarding adopting NC in cementitious materials.
Especially cementitious materials containing NC should meet specific vital parameters to be compatible with the current 3D printing systems. The main goals of this work are to investigate the influences of NC on the fresh and the hardened performance as well as the microstructure of cementitious materials for 3D printing. A series of tests for workability such as flowability, mini-slump, extrudability, printability limit, shape stability, and deformation under self-weight of 3DPC mixtures was conducted. The strength development of 3DPC containing NC was measured. Besides that, the influences of NC on the microstructure of 3D printing cementitious materials were also investigated by derivative thermogravimetry (DTG)–thermogravimetry analysis (TGA), scanning electron microscopy (SEM), and backscattered electron (BSE) image analysis.
Materials and Methods
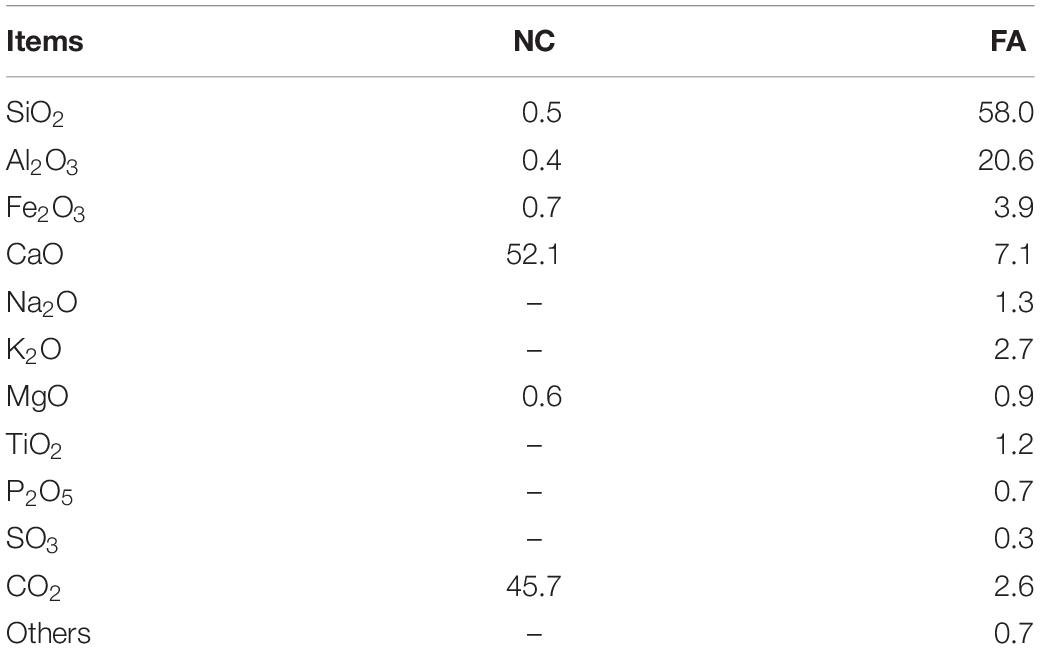
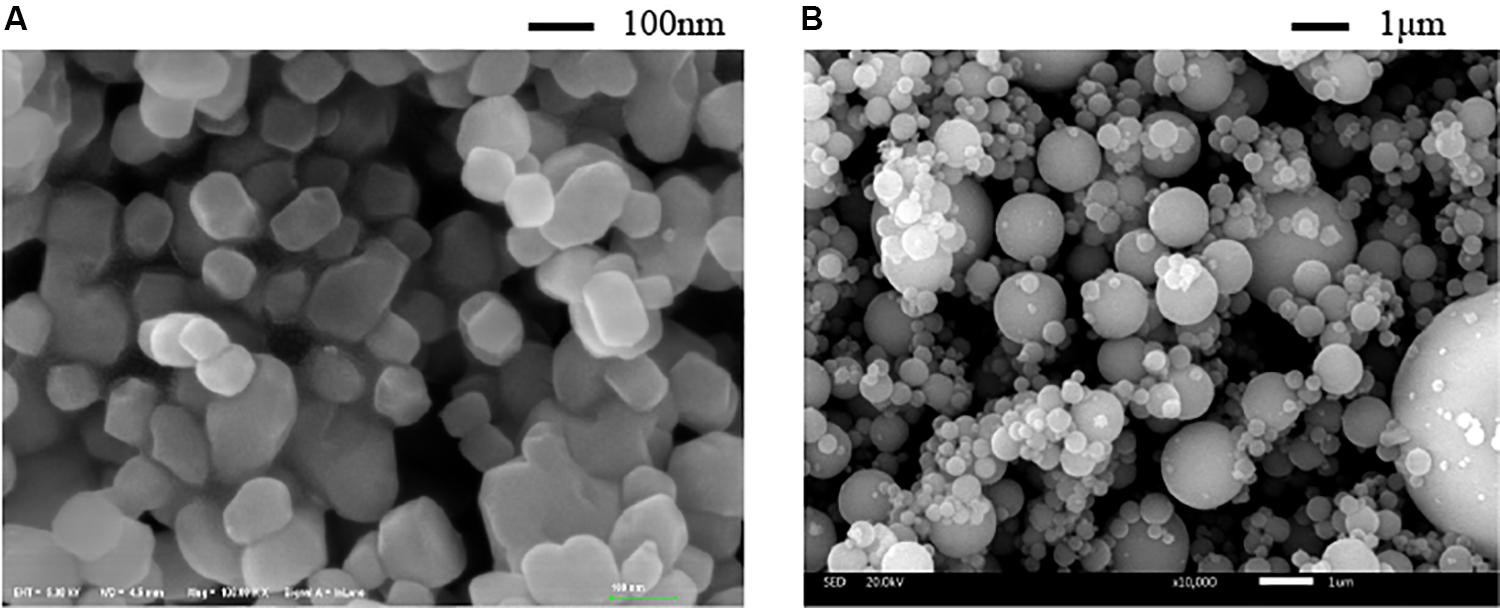
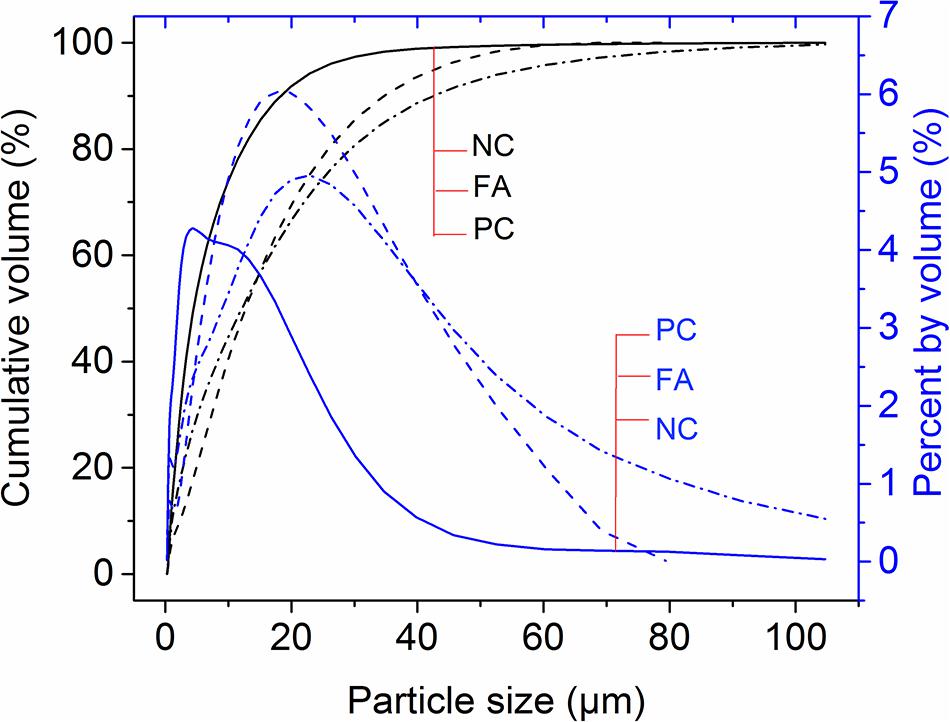
In this work, type I 42.5 Portland cement (PC), NC, and FA were used as binders. NC and FA are supplied by Nanjing XFNANO Materials Tech. Co., Ltd., of China and China West Construction Group Co., Ltd., respectively. The chemical compositions of NC and FA are provided in Table 1. Figures 1A, 2 show the morphology and the particle size distribution of NC, respectively. The PC and FA show a similar range of particle sizes. However, the NC curve is significantly shifted to the left (indicating smaller diameters) relative to the PC and the FA curves. Also, the particle size distribution of the NC shows slightly larger sizes due to the agglomeration of nanoparticles. FA is known to improve both the workability and the mechanical performance of concrete (Kou et al., 2007; Berndt, 2009). The morphology and the particle size distribution of FA are also shown in Figures 1B, 2, respectively. The nominal maximum aggregate size of silica sand is 5.0 mm for achieving building-scale 3D printing. Superplasticizer (HRWRA) and hydroxypropyl methylcellulose (HPMC) are also commercial products.
The mixture proportions of the samples are presented in Table 2. For comparison purposes, total cementitious material content, water-to-binder ratio, and sand-to-binder ratio were kept constant in all specimens. The mixtures are labeled according to the percentage of NC used. Four different percentages, 1, 2, 3, and 4% of NC within the cement mortar, were tested to study the influence of NC on the performance of 3DPC. Replacing FA with NC in the preparation process can affect the specific surface area of the binder. Due to the highly specific surface area of the NC, different HRWRA dosages were used to maintain the fluidity of the samples. NC0 is a reference sample. All solid ingredients were stirred by a mortar mixer at low speed for 30 s. Then, the water with HRWRA was added into the mixer, and mixing was continued for 60 s at low speed. After that, high-speed mixing was continued for 180 s.
A digitally controlled concrete printer, made by JianYanHuaCe Science & Technology (Hangzhou, China), with a 30-mm diameter nozzle was used to test the extrudability, printability limit, shape stability, and deformation under self-weight of 3DPC mixtures. The printer can print 3DPC mixtures at different printing parameters, such as speed and deposition rate. The fresh and the hardened performance of 3DPC are highly dependent on the printing speed. The printing speed is set based on the fresh performance of the 3DPC, the dimension of the nozzle, and its deposition rate. The extrusion rate of 0.19 L/min and the printing speed of 60 cm/min were selected in this paper.
The fluidity, mini-slump, extrudability, printability limit, shape stability, and strength of the mixture were measured and investigated. These factors are essential to 3DPC. The description of the test method is as follows.
Fluidity and mini-slump ensure the fresh-state concrete transport from the storage bin to the nozzle of the printer smoothly. The fluidity of each mixture was determined according to GB/T 2419-2005. The change in fluidity of a mixture was calculated as (Eq. 1):
where ΔD is the change in fluidity and D0 and Dt represent the fluidity at the initial time and at time t, respectively.
A mini-slump of each mixture was performed according to GB/T 10902-2012. The dimensions of the mini-slump cone were 100 mm at the base, 50 mm at the top, and 150 mm in height. The change of mini-slump of the mixture was calculated as (Eq. 2):
where ΔS is the change of mini-slump and S0 and St represent the mini-slump at the initial time and at time t, respectively.
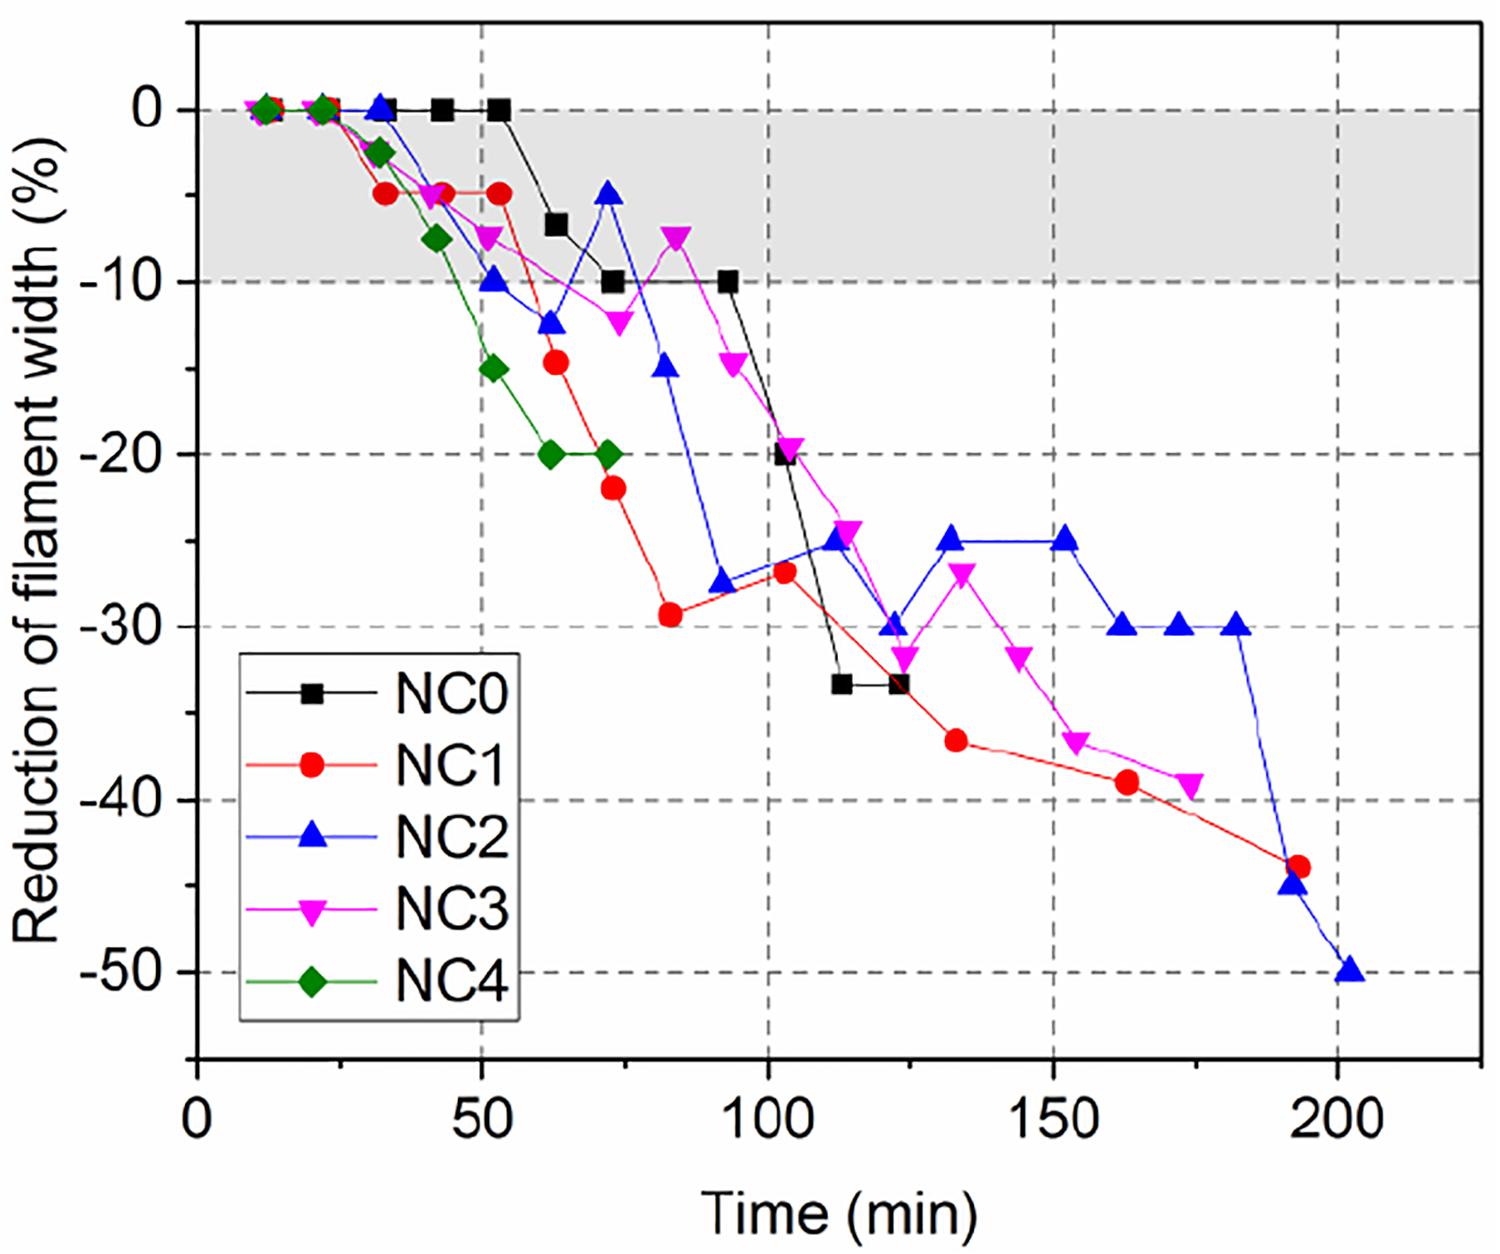
Printability limit is defined as the time interval during which concrete may be used in the 3D printing process (Buswell et al., 2018), beyond which concrete will lose its pumpability and extrudability. It has been related to an “operation window” where a specified volume of fresh-state 3DPC must be extruded through the nozzle with acceptable quality (Lim et al., 2012; Wangler et al., 2016). It is especially crucial in terms of the timing of mixture delivery to the nozzle and the operation of a building printer (Kazemian et al., 2017). In this work, the printability limit is evaluated based on the extrudability of 3DPC through the nozzle. As shown in Figure 3, each layer is printed every 10 min, starting from 10 min after the initial contact of water and cement. The time when the filament width is decreased to 90% of the initial width is recorded as the printability limit. When the reduction of the filament width is above 10%, the print quality is not acceptable.
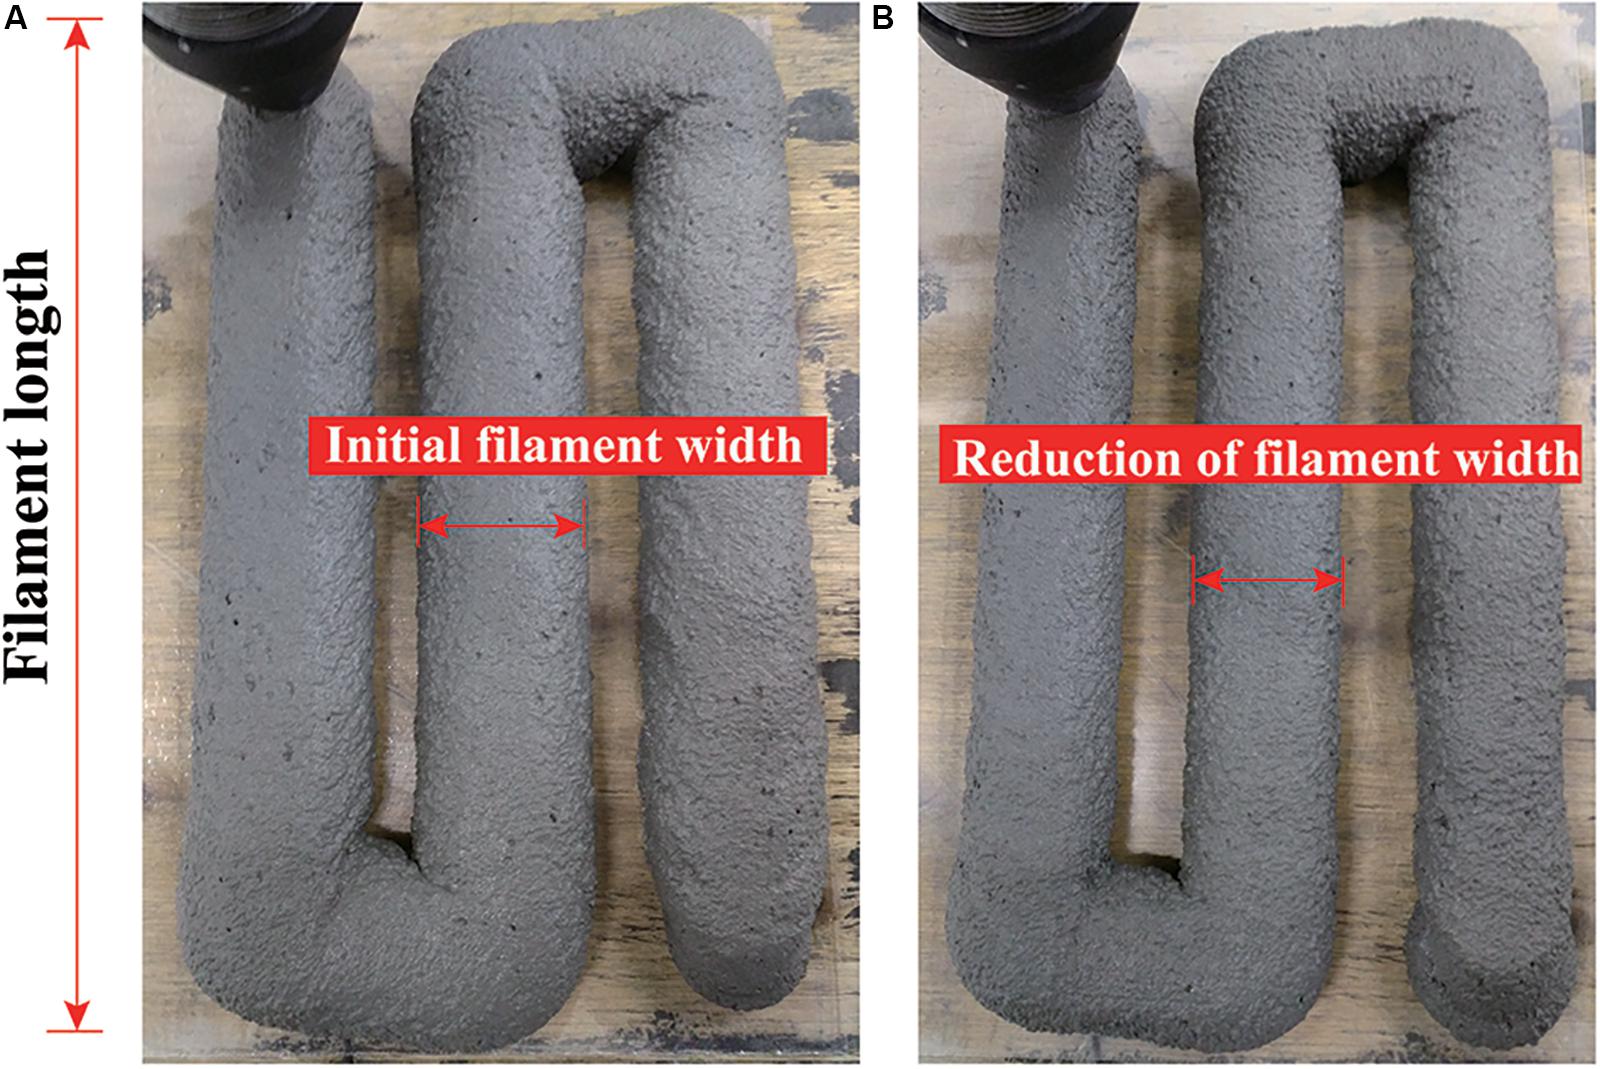
Figure 3. Extrusion with a 20-mm-diameter round nozzle: (A) initial filament width, (B) reduction of filament width.
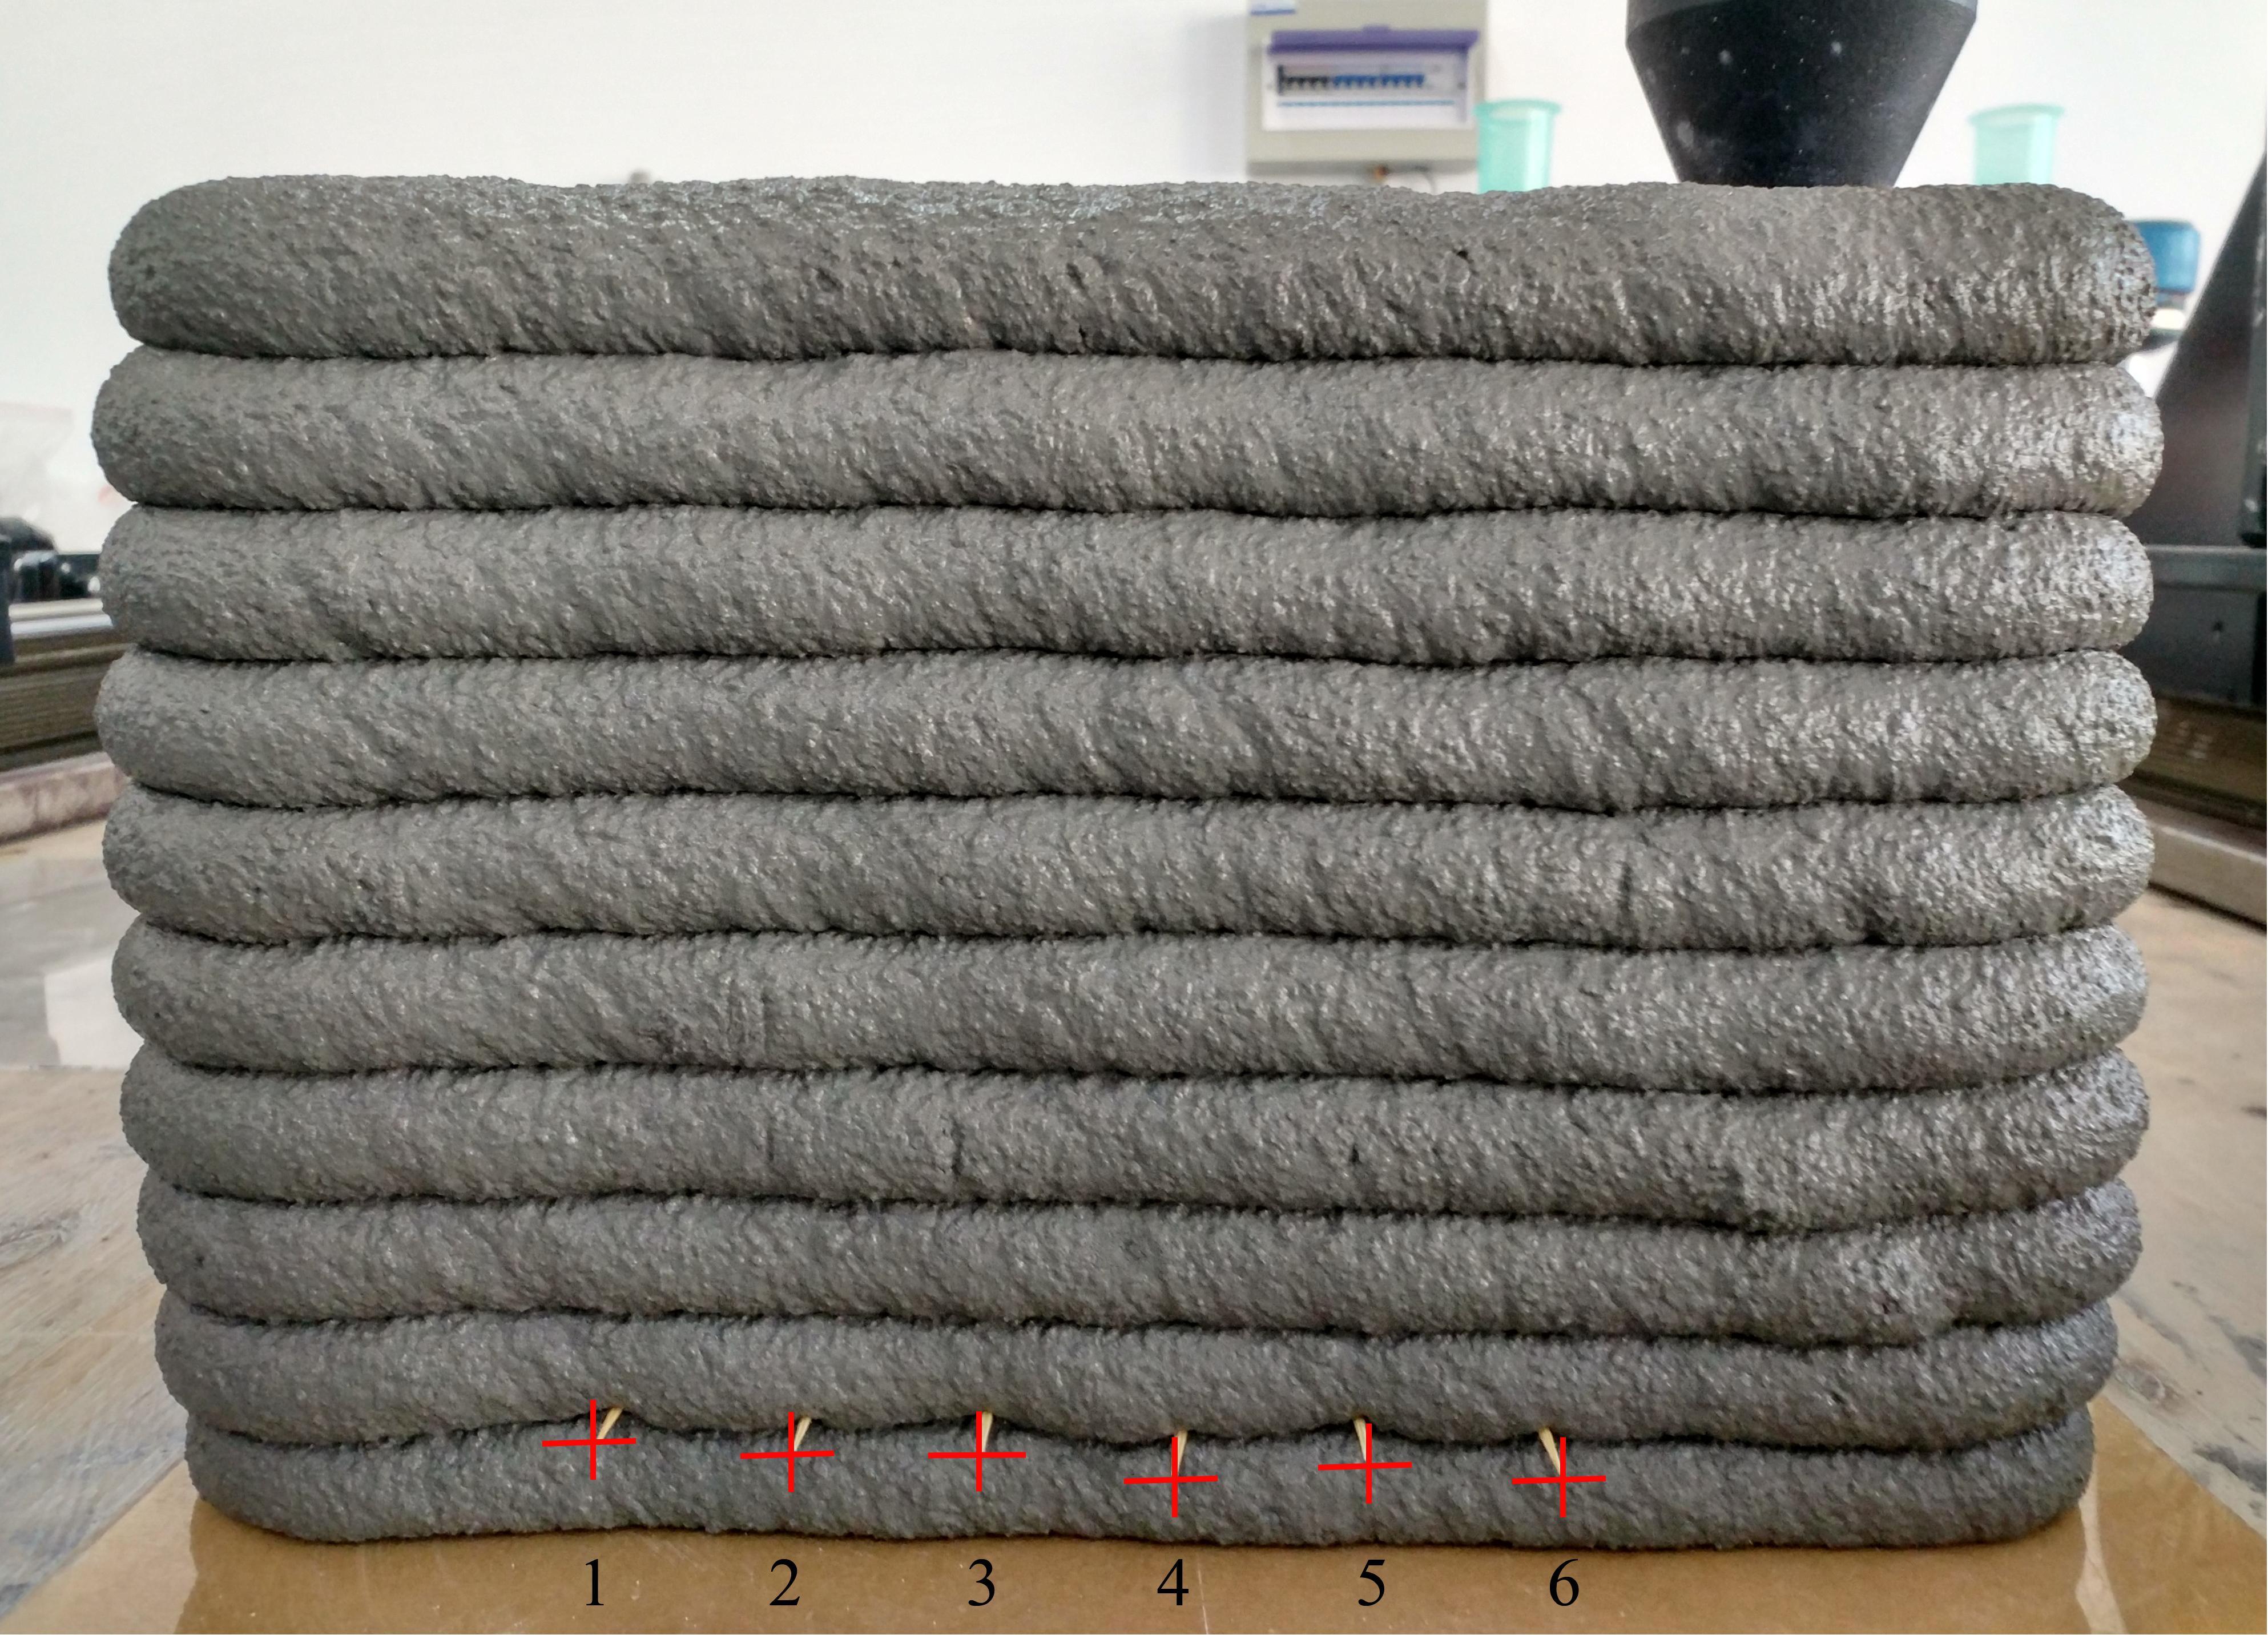
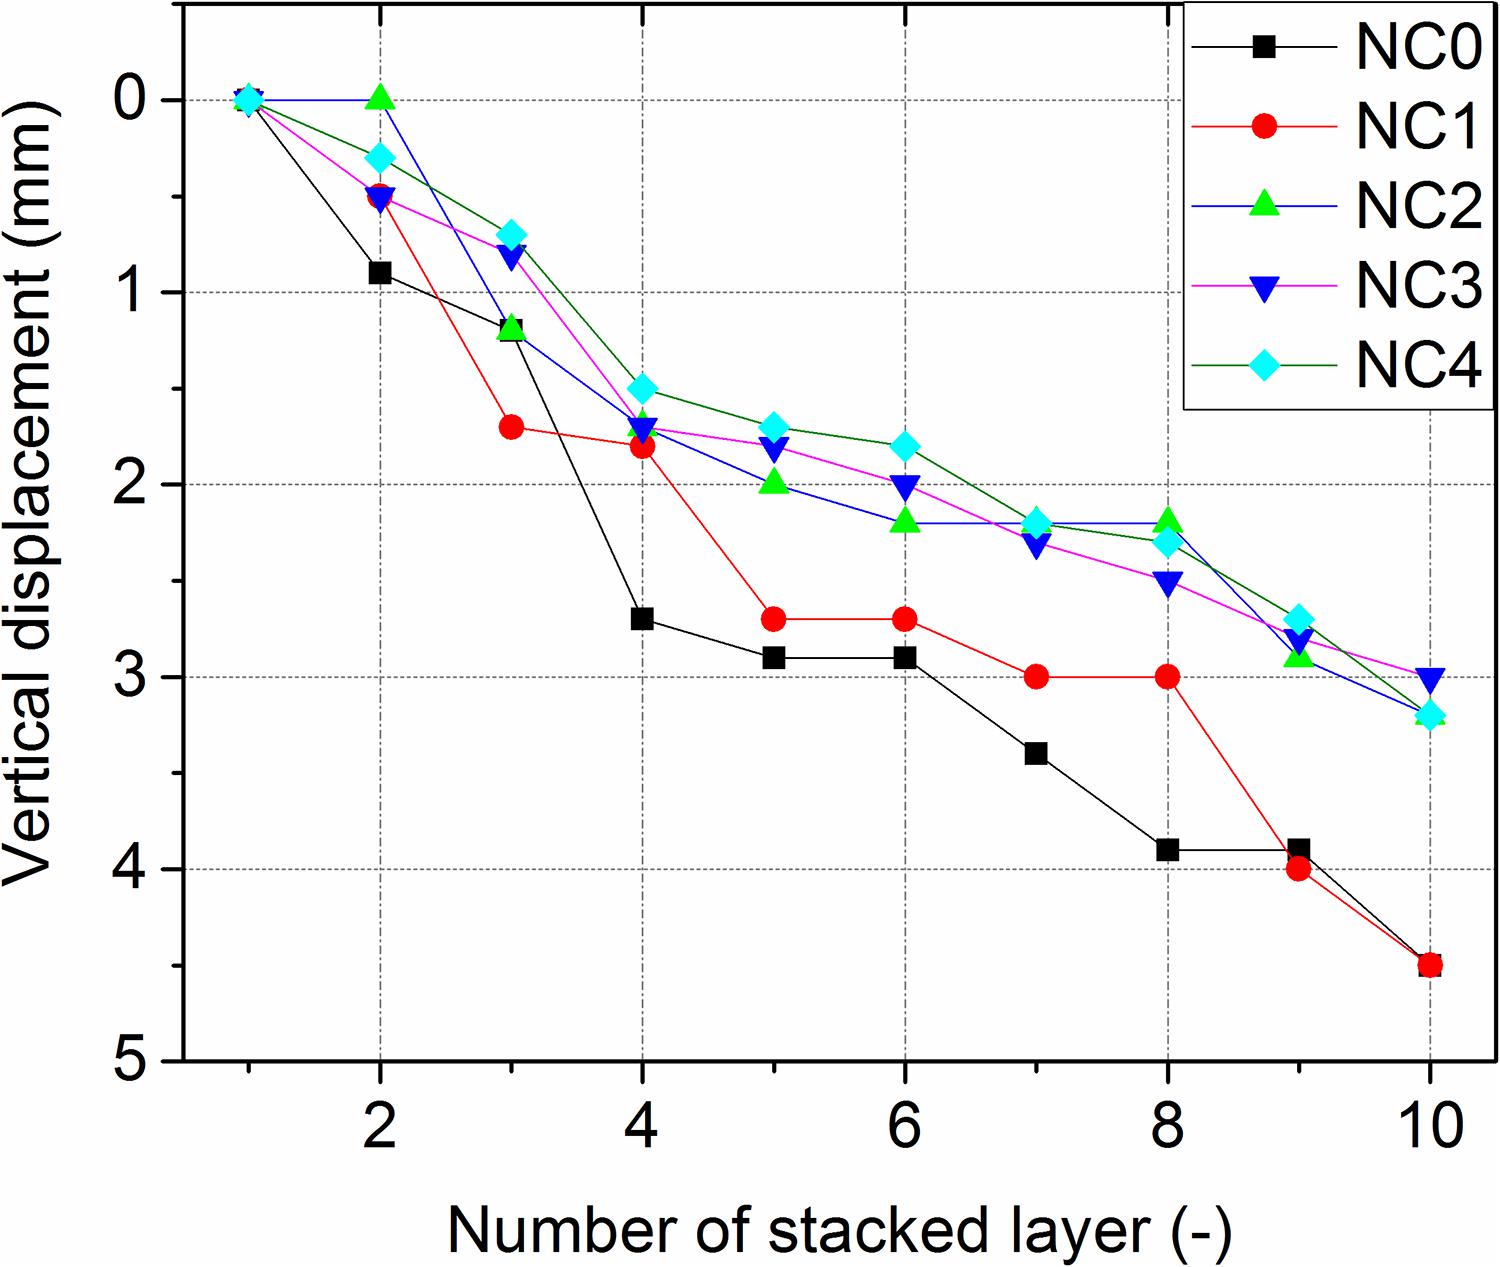
Shape stability is the ability to resist deformation during layer-by-layer concrete construction (Kazemian et al., 2017). The lowermost layer bears the largest load, and the weight of the following layers could lead to undesirable deformations. Lao et al. (2020) proposed an image processing method for the deformation analysis. To investigate the influence of NC on the shape stability of fresh-state 3DPC by improving flocs, which increase the yield stress and the viscosity of mixtures, deformation at the bottom layer was measured at six locations, as indicated in Figure 4. The vertical stack filaments are ten layers. The filament length is 300 mm, and the filament width is 30 mm. The average of six readings was reported as a test result.
Flexural and compressive strengths were determined for the printed samples sawn and polished from larger printed components a day before testing. The control samples were also cast in molds with a dimension of 40 mm × 40 mm × 160 mm. After 24 h, the samples were cured in water at 20 ± 2°C until testing. The strength was tested according to the Chinese specification GB/T 17671-1999. The loading speed of the flexural strength and the compressive strength was 50 and 2,400 N/s, respectively. The final flexural strength is the average of three samples. The final compressive strength is the average of six samples. Since the 3DPC is constructed layer upon layer, one of the main shortcomings is their anisotropic performance in direction. It has been reported that the printing direction could significantly influence the strength of 3DPC (Le et al., 2012b; Feng et al., 2015; Paul et al., 2018). As shown in Figures 5A,B, the application of flexural and compressive loads is in the Z direction in this work. Furthermore, it is evident to note that the bond performance between layers also has a significant influence on the mechanical performance of the printed objects (Paul et al., 2018; Nerella et al., 2019). In this work, the printed objects are two layers, with a dimension of 40 mm × 40 mm × 160 mm, as shown in Figure 5. The compressive strength ratio between 3DPC and cast concrete was calculated as fPrint/fCast, where fPrint and fCast represent the strength of 3DPC and cast concrete, respectively.

Figure 5. Loading in the Z direction. (A) Flexural load in printed objects. (B) Compressive load in printed objects.
The DTG and TGA curves were obtained using a thermogravimetric gravimetric analyzer (STA449 F3, NETZSCH, Germany). The DTG plot shows the thermal decompositions of different phases in a sample, while the TGA simultaneously reveals the weight loss due to the decomposition of phases. The samples were taken from 7- to 90-day-old compressive testing specimens. The samples were heated from room temperature to 1,000°C at a constant heating rate of 20°C per minute under a nitrogen atmosphere. The weight loss between 400 and 500°C was the decomposition of calcium hydroxide (CH). Thus, the CH content for each sample can be calculated (Eq. 3) (Jain and Neithalath, 2009):
where WL(CH) represents the weight loss during the dehydration of CH, MW(CH) is the molecular weight of CH, and MW(H) is the molecular weight of H2O.
The microstructure of the samples was observed by a JSM-IT300 scanning electron microscope equipped with a backscatter detector. The samples were taken from 7- to 90-day-old compressive testing samples.
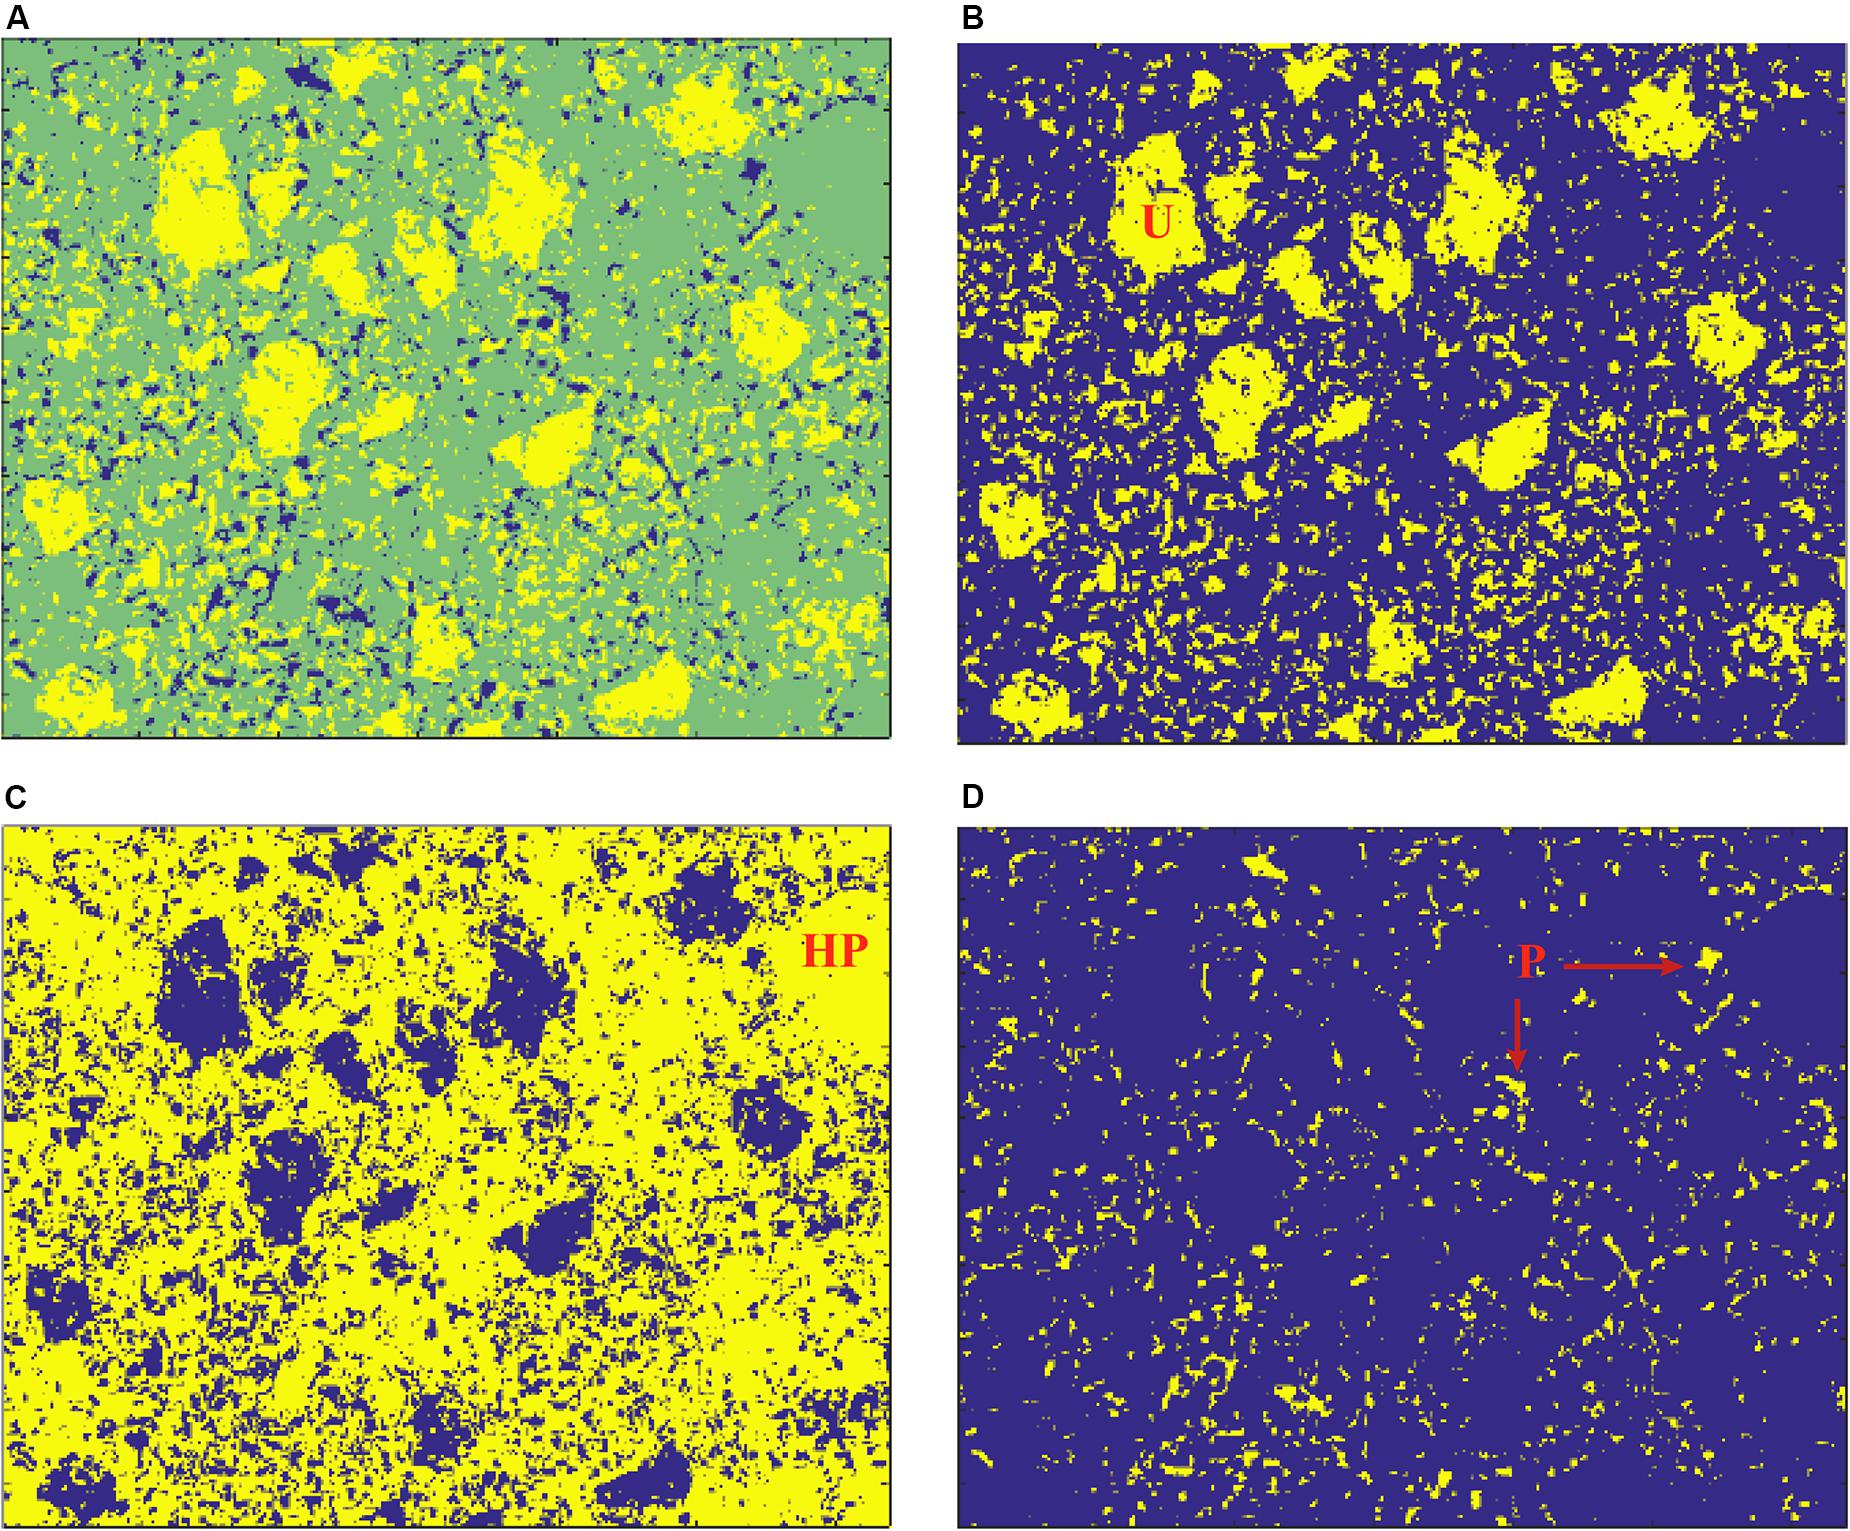
Slices with a thickness of ∼10 mm were cut from 7- to 90-day-old flexural testing samples for BSE image analysis. They were dried by ethanol replacement and finely polished by silicon carbide papers. The images were acquired randomly at ×500 magnification, and 10 fields were randomly chosen from each sample for analysis. A representative BSE image is shown in Figure 6. Its scale length is 50 μm, which consists of 250 pixels. Thus, the size of one pixel is about 0.2 μm. The brightness of the BSE image depends on the average atomic number of the sample’s local area (Scrivener, 2004). The hydration products have much lower average atomic numbers than that of the anhydrous. Thus, the anhydrous is significantly brighter than the hydration products. The dark areas are pores. As shown in Figure 7, the anhydrous, hydration products, and pores were distinguished using image analysis software. According to stereology principles, the area fractions on the random sections are equivalent to the volume fractions. Therefore, the area fraction of the anhydrous, hydration products, and pores could be estimated as the volume fraction (Igarashi et al., 2004). The hydration degree of cement was calculated by Eq. (4) (Scrivener, 2004).
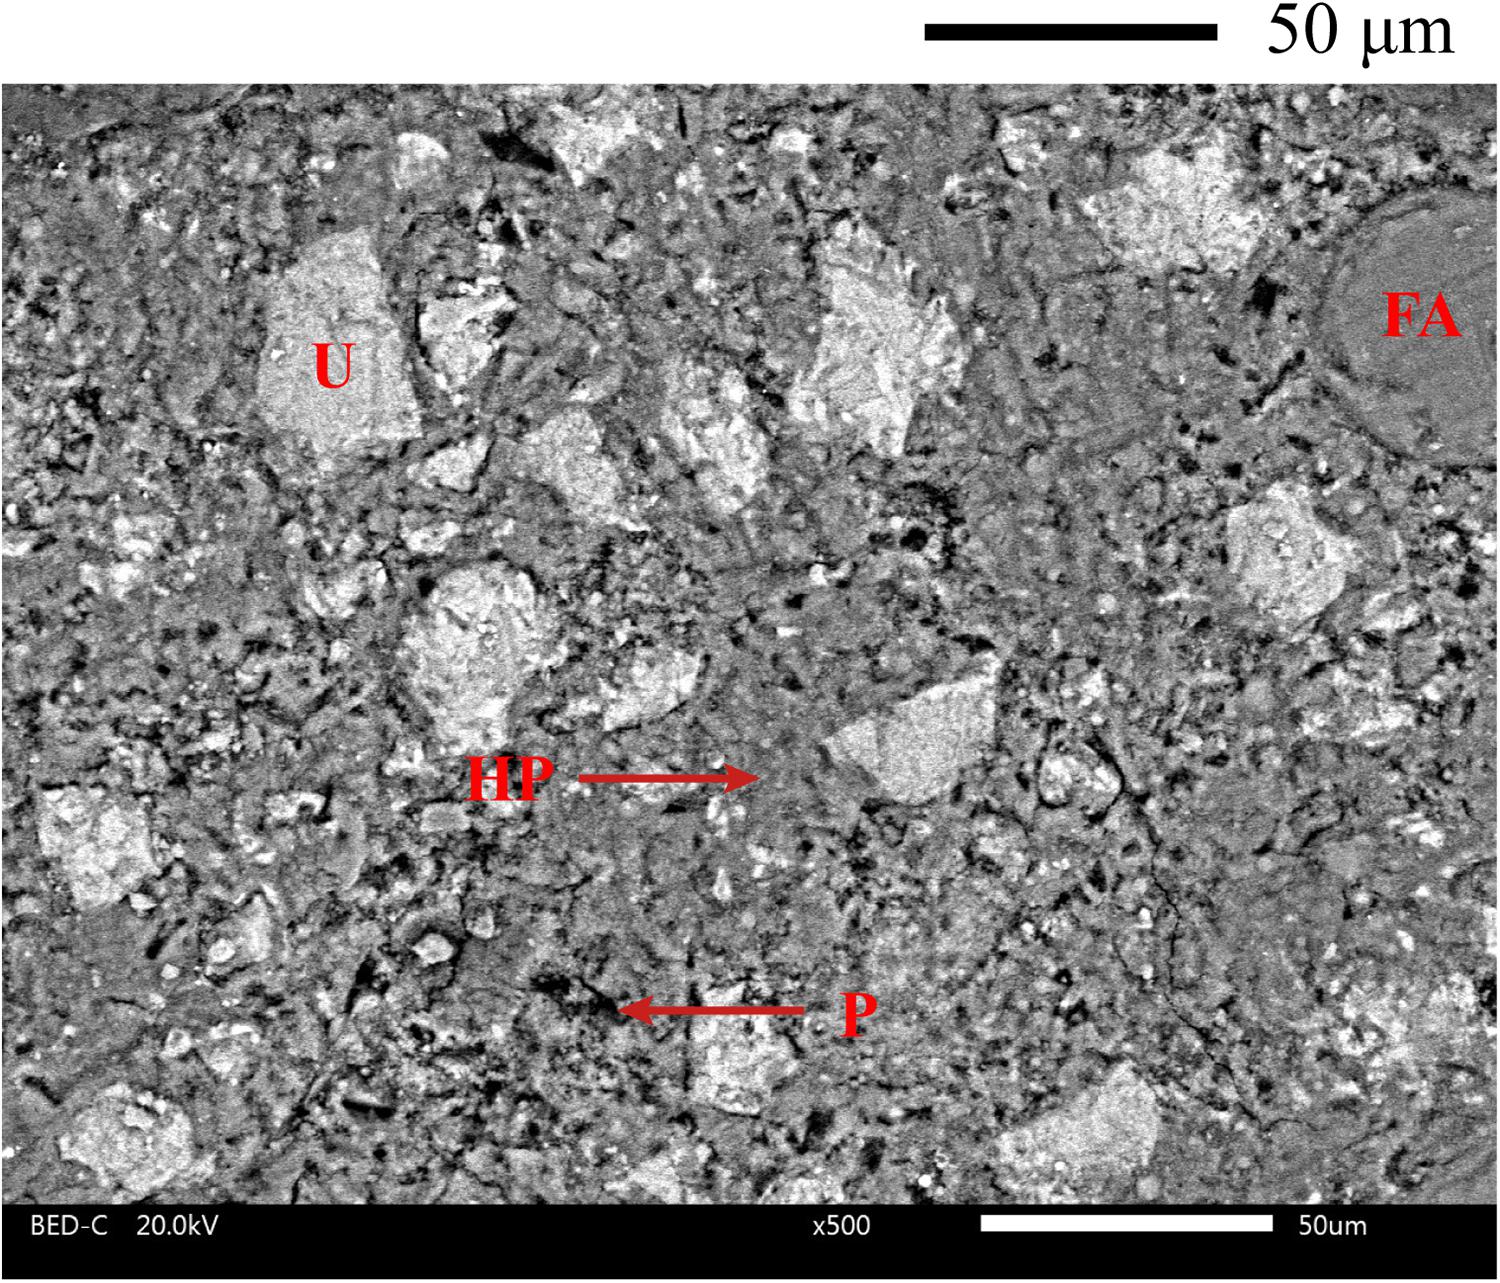
Figure 6. A representative backscattered electron image. U, anhydrous; HP, hydration products; FA, fly ash; P, pores.
UHi represents the area fraction of anhydrous at the age of ti, and UH0 represents the initial area fraction of anhydrous.
Results and Discussion
Fluidity Evolution
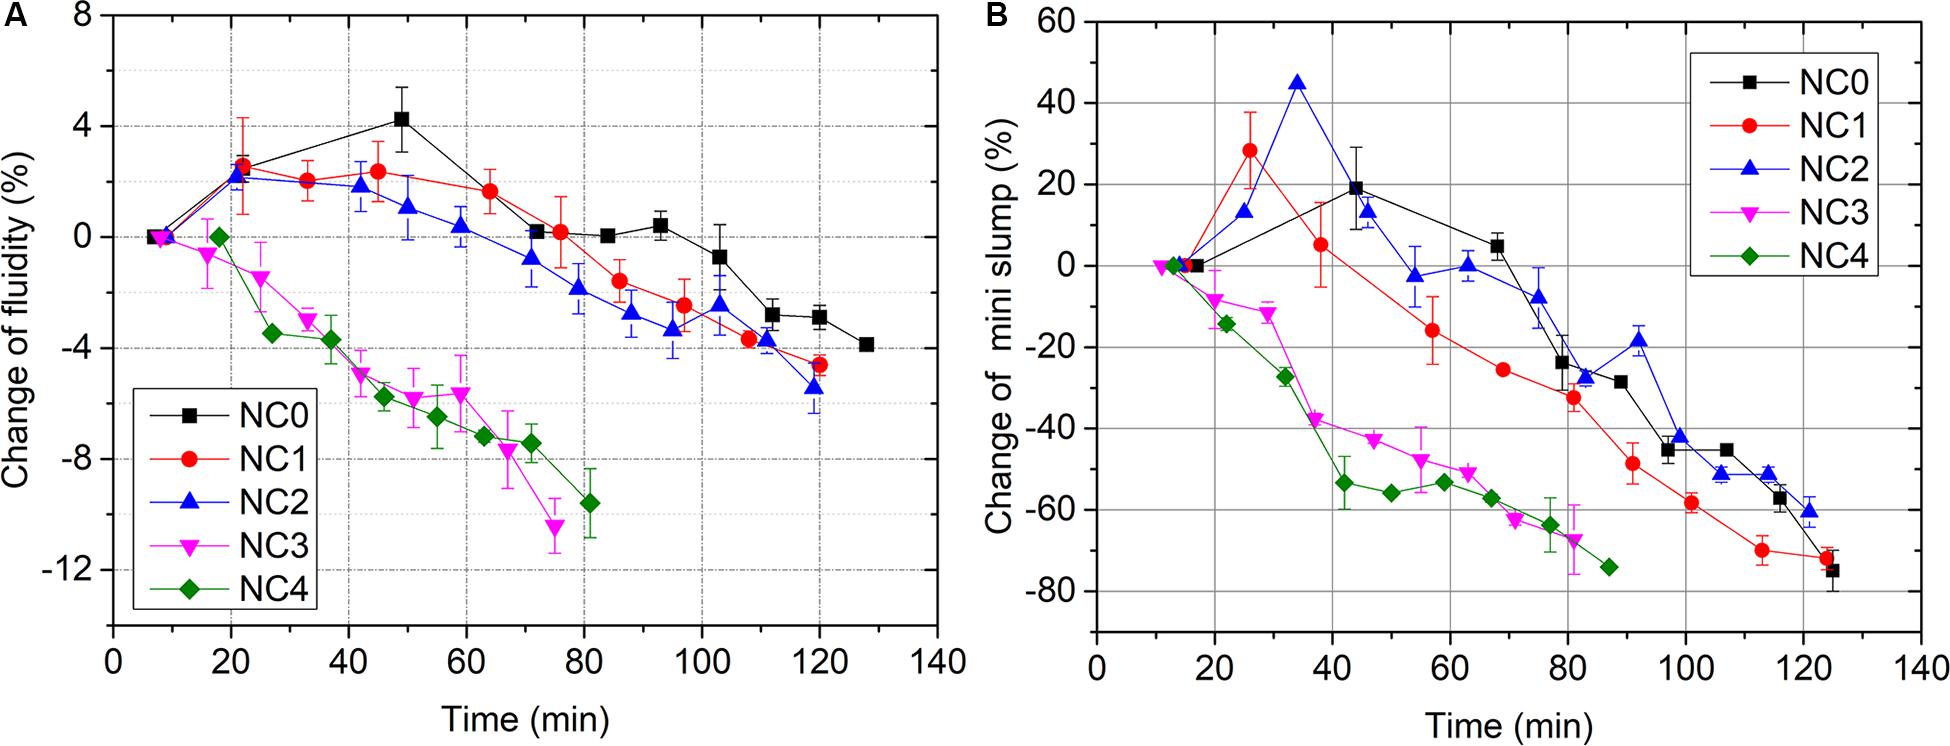
Figures 8A,B illustrate the fluidity changes and the mini-slump changes for 3DPC containing NC, respectively. As can be seen in Figure 8A, the fluidity changes of NC0, NC1, and NC2 show a parabolic growth tendency. For instance, the fluidity changes in NC2 gradually increases to about 2.2% at the age of 20 min. Afterward, this value decreases to about −5.4% at the age of 120 min. Furthermore, all mixtures incorporating NC exhibited lower fluidity compared with the control mixture without NC addition. The addition of 3 and 4% of NC has significantly reduced the fluidity changes. At all ages, the fluidity of 3DPC almost decreased as the content of NC increased. For instance, at the age of 30 min, the fluidity changes of NC0, NC1, NC2, NC3, and NC4 are 3.1, 2.2, 2.1, −2.1, and −3.5%, respectively. Therefore, a greater addition of NC caused a lower fluidity of 3DPC. The change in trend may be attributed to the highly specific surface area of NC (Supit and Shaikh, 2014; Yang and Che, 2019), which would generally increase the viscosity and the yield stress of mixtures. Furthermore, due to the accelerating effects of NC on cement, additional hydration products, such as C-S-H and CH, increase the formation of the flocculation structure of cement pastes (Roussel et al., 2012).
The mini-slump is also examined to evaluate the effects of NC on the fluidity of 3DPC. A more considerable mini-slump value corresponds to a greater fluidity and vice versa. From Figure 8B, it can be seen from this figure that NC1 and NC2 exhibited a similar behavior to that of the control mixture, which shows a parabolic growth tendency. Besides that, the mini-slump change of NC2 is lower than that of the control mixture after 40 min. The addition of 3 and 4% of NC has significantly reduced the mini-slump changes. These trends can also be ascribed to the increased yield stress and viscosity of the mixtures.
Preliminary tests showed that extrudability and shape stability are competing performances in that high fluidity and mini-slump promotes extrudability, while low fluidity and mini-slump promotes shape stability. Thus, there should be an appropriate range of fluidity or mini-slump, which must be balanced appropriately to allow printability. In our work, the change in fluidity between −2.0 and 2.0% is an appropriate target for extrusion, and the change of mini-slump between −20.0 and 20.0% is a suitable target for shape stability under self-weight. Therefore, the manipulation of viscosity via NC and other admixtures is successful in modifying the fluidity and the mini-slump to fall within this range.
Printability Limit
The printability limit was determined based on the extrudability of 3DPC through the nozzle. Figure 9 shows the reduction of filament width of 3DPC incorporating NC. It can be seen from this figure that the decrease of filament width of all mixtures shows a decreasing tendency with time. We found that when the reduction of filament width is above 10%, it is difficult to print a good-quality filament using the mixtures shown in Table 2. Kazemian et al. (2017) also believed that 10% of error is a reasonable target width for accepting or rejecting printed layers. As shown in Figure 9, the printability limit for NC0 and NC4 is about 90 and 45 min. The printability limit for NC1, NC2, and NC3 is about 50–90 min. It can be observed that, after these specified periods, the extruded filament hardly held its shape. Furthermore, the printability limit of mixtures containing NC is lower than that of the control mixture. The addition of 4% of NC has reduced the printability limit significantly. These phenomena can also be ascribed to the highly specific surface area and accelerating effects of NC.
Deformation Under Self-Weight
Preliminary testing showed that lower stiffness cementitious material (after being extruded from a nozzle) is not suitable for 3D printing due to its slower rate of hardening. Higher-stiffness cementitious material (after being extruded from a nozzle), due to its rapid hardening, has accommodated the weight of the deposited materials and facilitates rapid construction (Soltan and Li, 2018). The effect of NC dosage on deformation under self-weight of 3DPC is shown in Figure 10. As shown in this figure, NC is an effective admixture in manipulating the stiffness of 3DPC. All mixtures incorporating NC exhibited a lower vertical displacement tendency compared to the control mixture without NC addition. The displacement of NC2, NC3, and NC4 is lower than that of NC0 and NC1 after five layers. Therefore, a higher addition of NC caused the smaller vertical displacement of 3DPC. The higher stiffness of mixtures incorporating NC can be ascribed to the accelerating effects on cement hydration (Taijiro Sato and Diallo, 2010; Jayapalan et al., 2013; Shaikh et al., 2017). Thus, additional hydration products modify the flocculation structure of cement pastes (Zhang et al., 2018). Besides that, the large specific surface area of NC improves the absorption performance of the mixtures, which formed higher yield stress and viscosity of the cement paste.
Mechanical Strength
Figures 11A,B show the flexural and the compressive strength of 3DPC specimens with curing ages. The test results indicate that NC can improve the early age and later-age strength of 3DPC. With the increase of curing age, the strength of all mixtures increases remarkably. Additionally, it is worth noting from this figure that the growth rate of the strength of 3DPC after 28 days is larger than at 7 days. Moreover, the strength of 3DPC increases with the increase of NC content at all ages. For instance, adding 2% of NC exhibited about 21.0, 13.8, and 5.3% higher flexural strength than that of the control mixture at 7, 28, and 90 days. Adding 2% of NC exhibited about 7.2, 39.1, and 22.5% higher compressive strength than that of the control mixture at 7, 28, and 90 days. This can be attributed to the filler effects of NC (Li et al., 2004; Shaikh and Supit, 2014; Wang et al., 2016), which fill the pores in 3DPC, leading to a denser microstructure. Furthermore, NC acts as the crystallization nucleus for the precipitation of hydration products (Camiletti et al., 2013; Li et al., 2016), resulting in a higher strength of 3DPC.
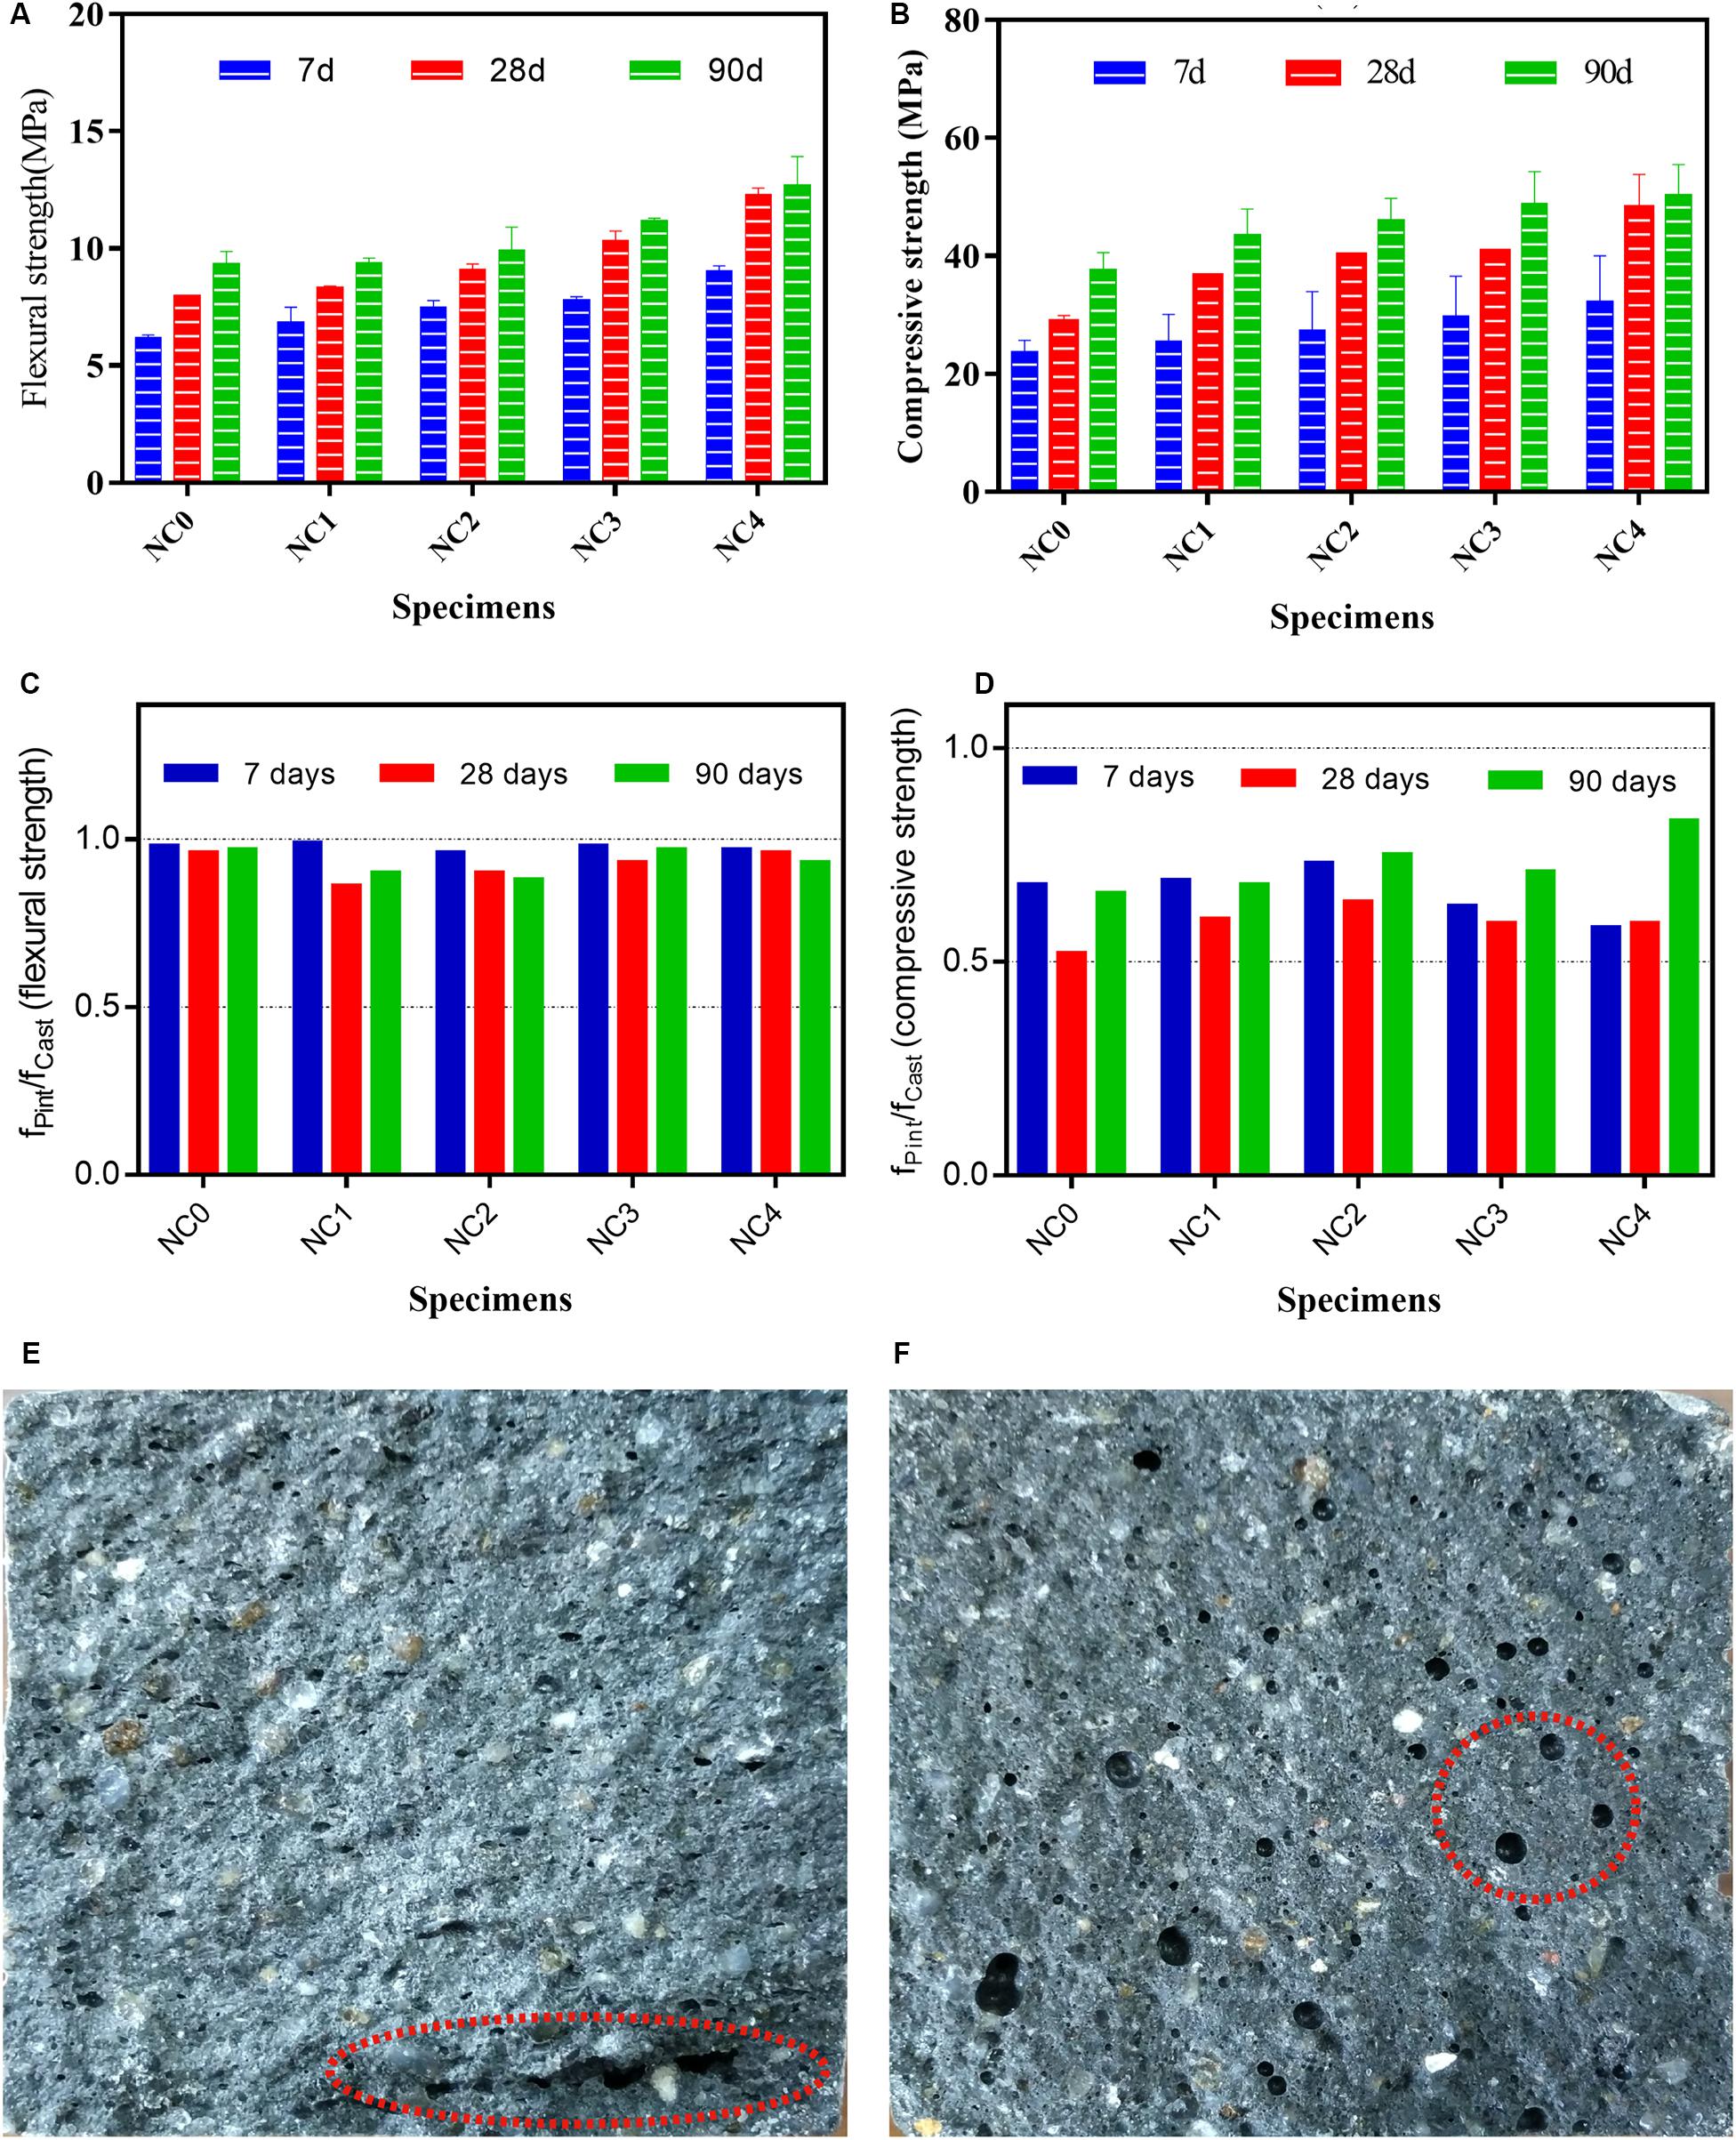
Figure 11. (A) Flexural strength, (B) compressive strength, (C) flexural strength ratio between 3DPC and cast concrete, (D) compressive strength ratio between 3DPC and mold cast samples, (E) typical section of 3D printing prismatic specimen, (F) typical section of mold cast prismatic specimen.
The development of fPrint-to-fCast ratios of different contents of NC-incorporated specimens is presented in Figures 11C,D, where fPrint is the strength of 3DPC and fCast is the strength of mold cast samples. As shown in this figure, the fPrint to fCast ratios of all mixtures are less than 1.0, which indicates that both the flexural strength and the compressive strength of 3DPC are lower than that of cast concrete. It was also found that the strength of 3DPC was lower than that of mold cast samples, depending on compression orientation concerning the printing direction (Le et al., 2012b; Ma G. et al., 2018). It can be attributed to the weakening interfaces between two layers (Le et al., 2012b; Wangler et al., 2016; Tay et al., 2019).
For the compressive strength, with increasing NC contents up to 2%, the fPrint-to-fCast ratios of mixtures increase, and the NC content of more than 2% leads to a reduction trend in this strength ratio. The fPrint-to-fCast ratios (compressive strength) of NC2 at 7, 28, and 90 days are 0.73, 0.64, and 0.75, respectively, compared to that of the mold cast samples. This phenomenon implies that the optimum NC content for the improvement of fPrint-to-fCast ratio (compressive strength) is around 2%, compared to the other NC contents.
As discussed above, the flexural and the compressive strengths of 3DPC are lower than that of the cast ones. This is because the concrete 3D printing process is fundamentally different from the cast concrete process, which results in a significant difference in the pore structure of the two concrete materials. It can be seen from Figures 11E,F that the morphology of the large voids in 3DPC is quite different from that of the mold cast samples. The voids of the latter are mostly circular or elliptical, while the voids of the former are mostly irregularly elongated strips with sharp ends. It was reported that the sharp edges often result in stress concentrations, thereby decreasing the mechanical properties of the concrete (Diamond, 1996). Furthermore, the structure of the former is looser than that of the latter. Therefore, the strip voids and the looser structure of 3DPC are the main reasons for the lower flexural and compressive strengths than those of mold cast samples.
DTG-TGA Analysis
Figures 12A,B present the DTG–TGA curves of 3DPC with and without NC at the age of 7 and 90 days, respectively. As can be seen in this figure, the dehydration of CH occurs between 400 and 500°C. Thus, the CH contents of the samples were estimated from this figure. At the age of 7 days, the CH content of NC4 is higher by 18.0% than that of NC0, indicating that NC accelerates the hydration reaction of cement at early ages. At the age of 90 days, the CH content of NC4 is higher by 46.1% than that of NC0, indicating that the hydration reaction of cement was also accelerated at later ages. It was reported that NC also accelerates the hydration of C3S, which increases CH production (Pera et al., 1999; Kakali et al., 2000). Furthermore, the CH content of 3DPC with and without NC at 90 days is lower than that at 7 days since FA consumes CH due to its pozzolanic nature. On the other hand, NC reacts with aluminate in cement, which also depletes CH (Bonavetti et al., 2001).
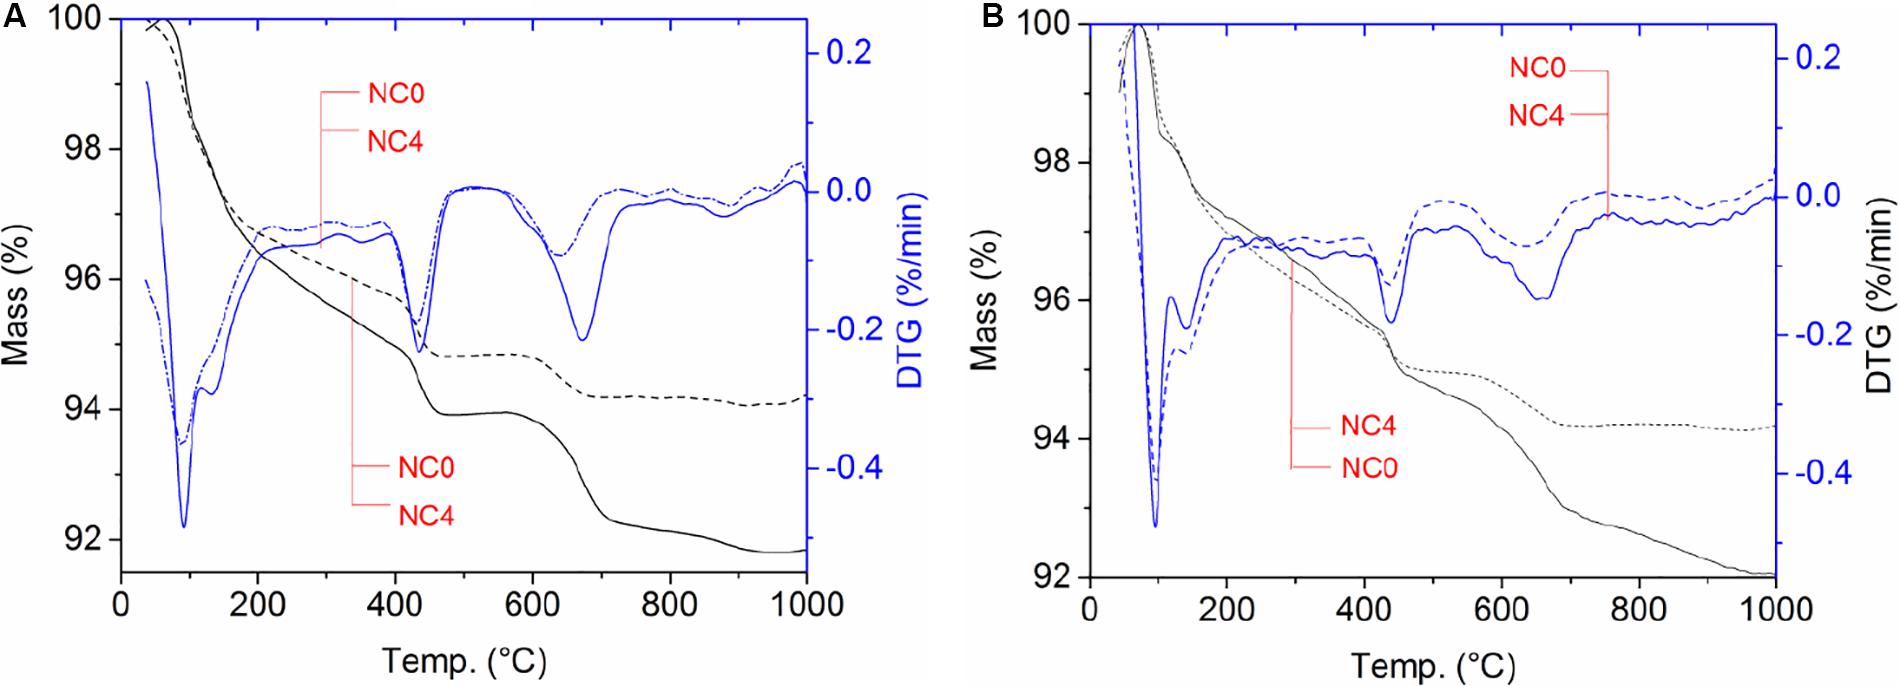
Figure 12. Derivative thermogravimetry–thermogravimetry analysis of specimens at 7 and 90 days: (A) 7 days, (B) 90 days.
SEM Analysis
Figures 13A–D present the SEM images of 3DPC at 7 and 90 days, respectively. A more considerable amount of porous area and CH can be observed in Figures 14A,C, which implies that the hardened 3DPC without NC has a relatively high porosity, and the CH has enough space to grow in. However, as shown in Figures 13B,D, the 3DPC incorporated 4.0% NC, showing a very dense microstructure, which can be attributed to the filler effect of NC, and a few relatively small CH can be found. Moreover, the accelerating effects of NC can promote cement hydration as it provides an additional substrate for the rate of nucleation and the growth of hydration products (Li et al., 2015). The NC also seems to reduce the formation of AFt in 3DPC incorporated with 4.0% NC. Such microstructure agrees well with the corresponding 44.1% compressive strength enhancement, as shown in Figure 11. The mechanism by which the NC could improve the microstructure of cementitious materials can be attributed to the filler effects and the accelerating effects.
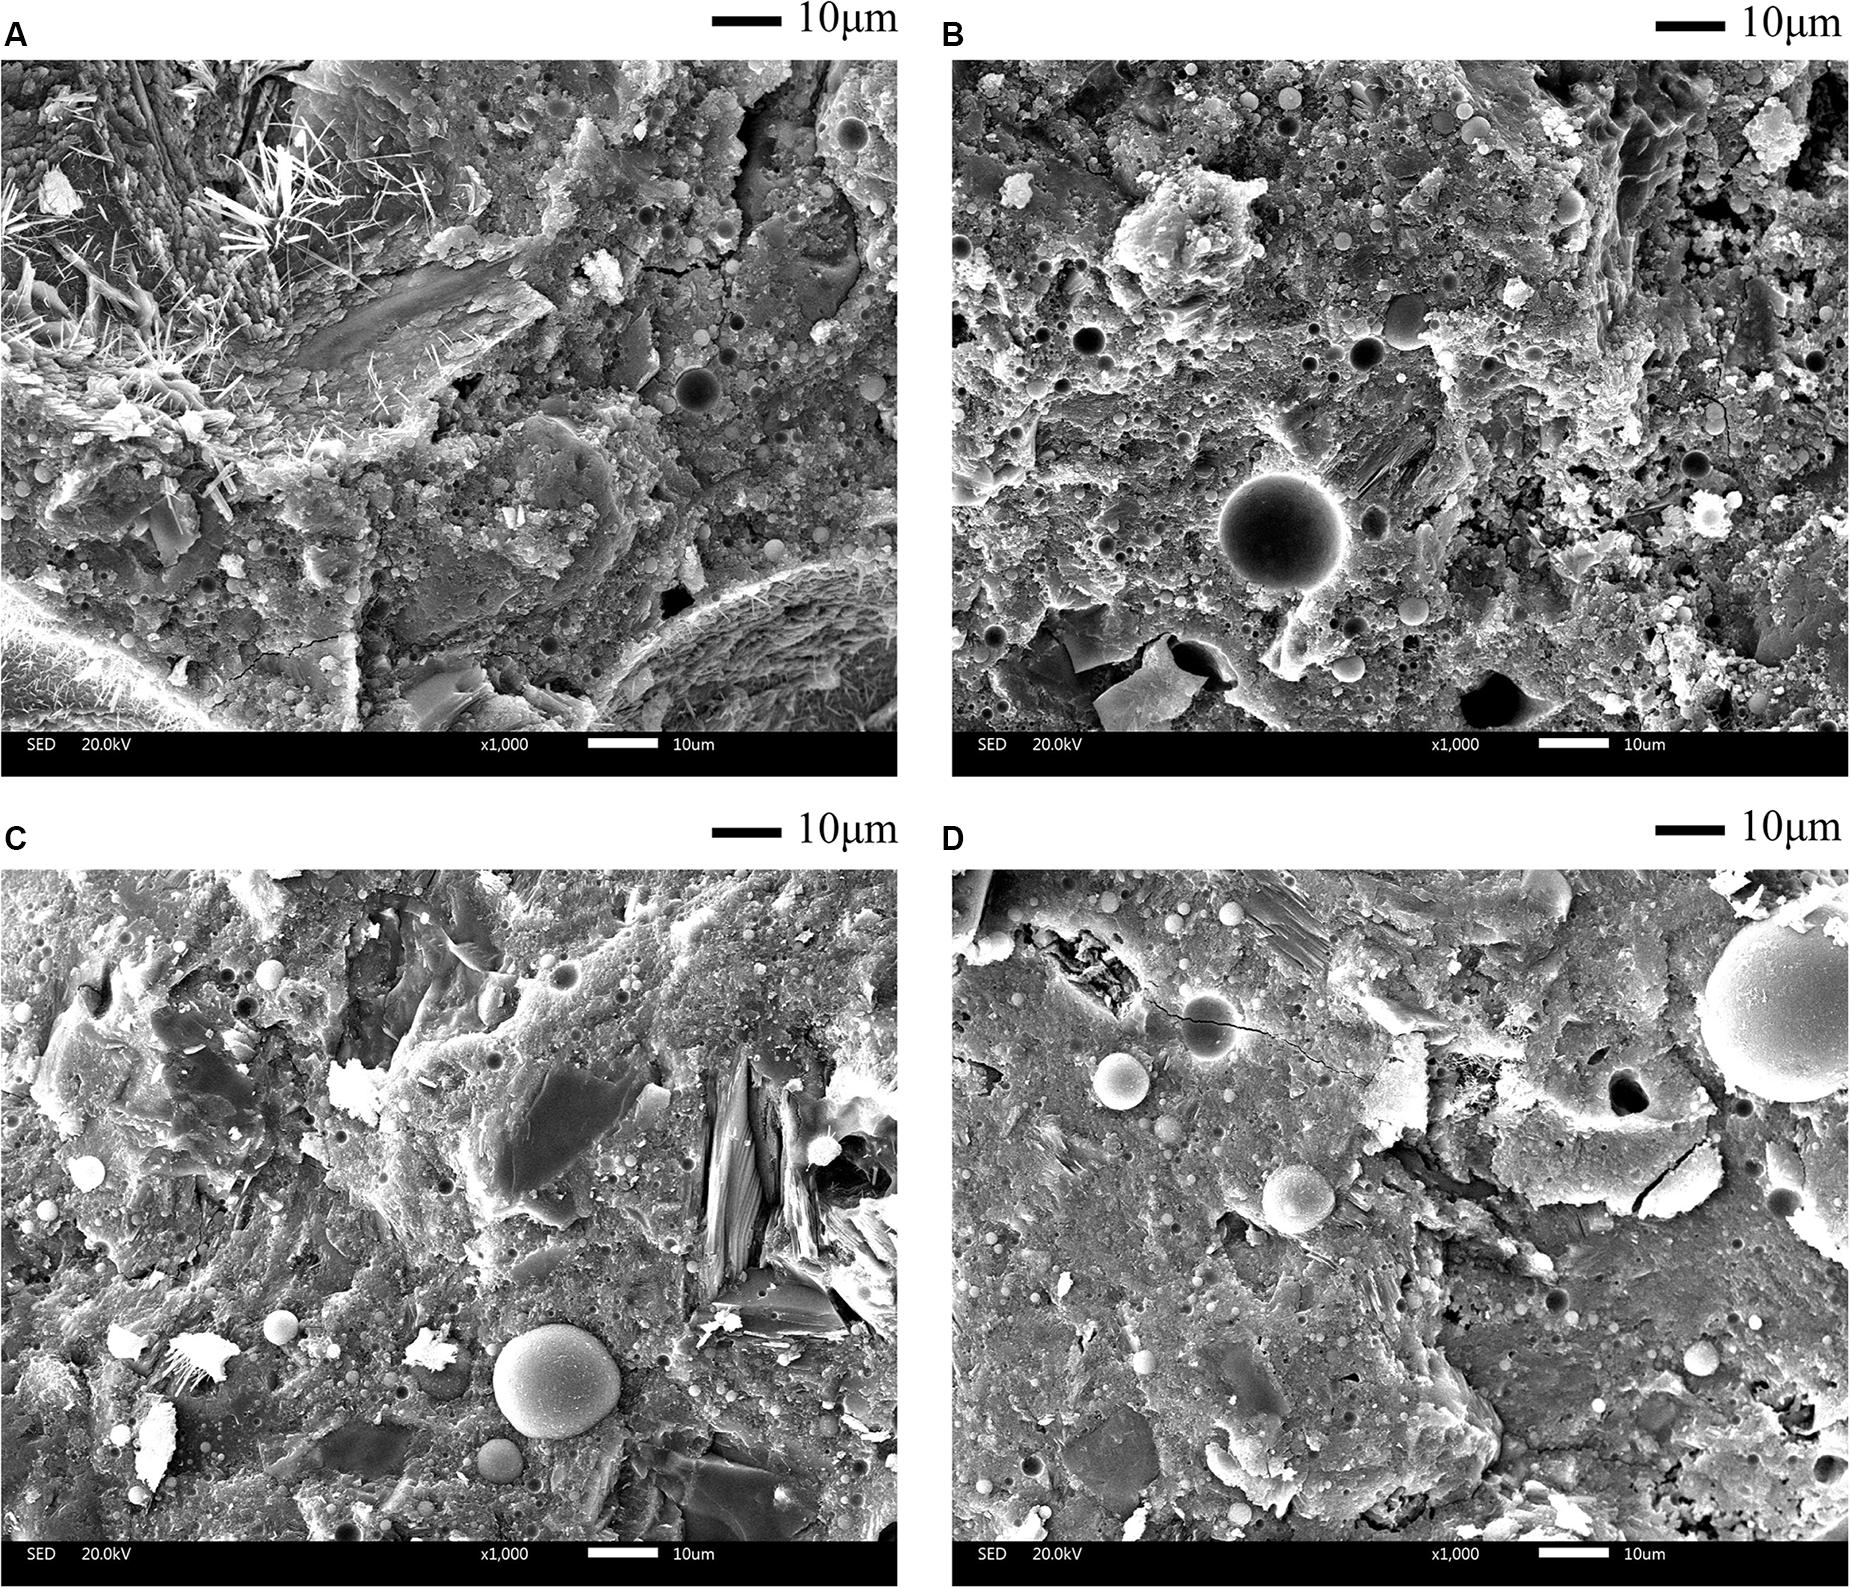
Figure 13. Scanning electron microscopy of 3DPC: (A) NC0 at 7 days, (B) NC4 at 7 days, (C) NC0 at 90 days, (D) NC4 at 90 days.

Figure 14. (A) Measured volume fractions of constituent phases in specimens. U, anhydrous; HP, hydration products; P, pores. (B) Degree of cement hydration. (C) The pore size distribution of 3DPC with and without NC.
Volume Fractions of Constituent Phases, Hydration Degree, and Pore Size Distribution
Figure 14A presents the measured volume fractions of the constituent phases in 3DPC after 7 and 90 days of curing at 100% relative humidity. The anhydrous volume fraction, hydration product volume fraction, and pore volume fraction are plotted for 3DPC with and without NC. It can be seen from this figure that NC0-90 days (3DPC without NC at 90 days) exhibited a higher volume fraction of hydration products but a lower volume fraction of anhydrous and pores than that of NC0-7 days (3DPC without NC at 7 days), which can be due to the hydration of cement particles with curing time. Compared to NC0-90 days, NC4-90 days (3DPC with 4% of NC at 90 days) showed a higher hydration product volume fraction but a lower anhydrous volume fraction and pore volume fraction. The hydration product volume fraction in NC4-90 days increased by 4.3% than that of NC0-90 days. However, the hydration product volume fraction and the pore volume fraction in NC4-90 days decreased by 1.8 and 16.2% than that of NC0-90 days, respectively. This could indicate that the addition of NC, which has a highly specific surface area, accelerates the hydration of cement even at later ages. A similar phenomenon was observed by Meng et al. (2017) and Catinaud et al. (2000) when NC was added to cementitious materials. The highly specific surface area of NC could also be contributing to the decrease in pore volume fraction.
Figure 14B shows the calculated hydration degree of 3DPC with and without NC at 7 and 90 days. As shown in this figure, the degree of hydration of NC0-90 days is higher by 3.9% than that of NC0-7 days, which is in agreement with the decrease of the anhydrous volume fraction shown in Figure 14A. The degree of hydration of NC4-90 days is higher by 0.9% than that of NC0-90 days, which could also indicate that the addition of NC promotes the cement hydration reaction at 90 days.
Figure 14C presents the pore size distribution of 3DPC with and without NC. It can be seen that NC0-90 days had a higher volume of small-sized pores (0.2–1 μm) and a lower volume of medium-sized (1–2 μm) and larger-sized pores (>2 μm) than that of NC0-7 days. Compared to NC0-90 days, NC4-90 days had a higher volume of medium-sized pores and a lower volume of larger-sized pores. The pore volume of the small-sized pores of NC4-90 days is equivalent to that of NC0-90 days. Thus, in the case of NC4-90 days, there is a refinement of the larger pores since the volume of the medium-sized pores increases. These results indicate that the use of NC could decrease the larger pores in 3DPC. The refinement of larger pores implies that the pores could become disconnected, and hence the permeability could decrease (Jayapalan et al., 2013).
Conclusion
The influence of NC on the workability, strength, and microstructure of 3D printing cementitious materials containing NC was investigated. The main conclusions could be drawn as follows:
(1) Due to the highly specific surface areas of NC, greater addition of NC caused the lower fluidity of fresh 3DPC. The large specific surface area of NC increases the consistency of the mixtures, thus increasing the stiffness of fresh mixtures and decreasing the vertical displacement of the filament.
(2) The printability of fresh mixtures can be determined by curves of reduction of filament width with time. After these specified periods, the extruded filaments hardly held their shape.
(3) The enhancement of strength of 3DPC with NC can be ascribed to the filler effects and the seeding effects of NC, which improve the microstructure of 3DPC.
(4) A pore size distribution analysis conducted on 3DPC with NC shows that medium-sized pores increase and larger-sized pores decrease when compared to 3DPC without NC at 90 days, which indicates pore refinement due to the addition of NC.
Data Availability Statement
The raw data supporting the conclusions of this article will be made available by the authors, without undue reservation.
Author Contributions
HY wrote the manuscript. WL contributed to the discussion part. HY and YC designed and performed the experiments. All authors contributed to the article and approved the submitted version.
Funding
This research was funded by the National Natural Science Foundation of China, grant number 51669004 and the Guizhou Science and Technology Department, grant number [2017]5726.
Conflict of Interest
The authors declare that the research was conducted in the absence of any commercial or financial relationships that could be construed as a potential conflict of interest.
References
Asprone, D., Auricchio, F., Menna, C., and Mercuri, V. (2018). 3D printing of reinforced concrete elements: technology and design approach. Constr. Build. Mater. 165, 218–231. doi: 10.1016/j.conbuildmat.2018.01.018
Berndt, M. L. (2009). Properties of sustainable concrete containing fly ash, slag and recycled concrete aggregate. Constr. Build. Mater. 23, 2606–2613. doi: 10.1016/j.conbuildmat.2009.02.011
Bonavetti, V. L., Rahhal, V. F., and Irasser, E. F. (2001). Studies on the carboaluminate formation in limestone filler-blended cements. Cem. Concr. Res. 31, 853–859. doi: 10.1016/S0008-8846(01)00491-4
Buswell, R. A., De Silva, W. R. L., Jones, S. Z., and Dirrenberger, J. (2018). 3D printing using concrete extrusion: a roadmap for research. Cem. Concr. Res. 112, 37–49. doi: 10.1016/j.cemconres.2018.05.006
Camiletti, J., Soliman, A. M., and Nehdi, M. L. (2013). Effects of nano- and micro-limestone addition on early-age properties of ultra-high-performance concrete. Mater. Struct. 46, 881–898. doi: 10.1617/s11527-012-9940-0
Catinaud, S., Beaudoin, J. J., and Marchand, J. (2000). Influence of limestone addition on calcium leaching mechanisms in cement-based materials. Cem. Concr. Res. 30, 1961–1968. doi: 10.1016/S0008-8846(00)00385-9
De Schutter, G., Lesage, K., Mechtcherine, V., Nerella, V. N., Habert, G., and Agusti-Juan, I. (2018). Vision of 3D printing with concrete—Technical, economic and environmental potentials. Cem. Concr. Res. 112, 25–36. doi: 10.1016/j.cemconres.2018.06.001
Diamond, S. (1996). Delayed ettringite formation - processes and problems. Cem. Concr. Compos. 18, 205–215. doi: 10.1016/0958-9465(96)00017-0
Feng, P., Meng, X., Chen, J.-F., and Ye, L. (2015). Mechanical properties of structures 3D printed with cementitious powders. Constr. Build. Mater. 93, 486–497. doi: 10.1016/j.conbuildmat.2015.05.132
Gao, W., Zhang, Y., Ramanujan, D., Ramani, K., Chen, Y., Williams, C. B., et al. (2015). The status, challenges, and future of additive manufacturing in engineering. Comput. Aided Design 69, 65–89. doi: 10.1016/j.cad.2015.04.001
Hambach, M., and Volkmer, D. (2017). Properties of 3D-printed fiber-reinforced Portland cement paste. Cem. Concr. Compos. 79, 62–70. doi: 10.1016/j.cemconcomp.2017.02.001
Hemalatha, T., Mapa, M., George, N., and Sasmal, S. (2016). Physico-chemical and mechanical characterization of high volume fly ash incorporated and engineered cement system towards developing greener cement. J. Clean. Prod. 125, 268–281. doi: 10.1016/j.jclepro.2016.03.118
Hossain, M. U., Poon, C. S., Lo, I. M. C., and Cheng, J. C. P. (2017). Comparative LCA on using waste materials in the cement industry: a Hong Kong case study. Resour. Conserv. Recycl. 120, 199–208. doi: 10.1016/j.resconrec.2016.12.012
Igarashi, S., Kawamura, V., and Watanabe, A. (2004). Analysis of cement pastes and mortars by a combination of backscatter-based SEM image analysis and calculations based on the Powers model. Cem. Concr. Compos. 26, 977–985. doi: 10.1016/j.cemconcomp.2004.02.031
Jain, J., and Neithalath, N. (2009). Analysis of calcium leaching behavior of plain and modified cement pastes in pure water. Cem. Concr. Compos. 31, 176–185. doi: 10.1016/j.cemconcomp.2009.01.003
Jayapalan, A. R., Lee, B. Y., and Kurtis, K. E. (2013). Can nanotechnology be ‘green’? Comparing efficacy of nano and microparticles in cementitious materials. Cem. Concr. Compos. 36, 16–24. doi: 10.1016/j.cemconcomp.2012.11.002
Kakali, G., Tsivilis, S., Aggeli, E., and Bati, M. (2000). Hydration products of C3A, C3S and Portland cement in the presence of CaCO3. Cem. Concr. Res. 30, 1073–1077. doi: 10.1016/S0008-8846(00)00292-1
Kazemian, A., Yuan, X., Cochran, E., and Khoshnevis, B. (2017). Cementitious materials for construction-scale 3D printing: laboratory testing of fresh printing mixture. Constr. Build. Mater. 145, 639–647. doi: 10.1016/j.conbuildmat.2017.04.015
Khalil, N., Aouad, G., El Cheikh, K., and Remond, S. (2017). Use of calcium sulfoaluminate cements for setting control of 3D-printing mortars. Constr. Build. Mater. 157, 382–391. doi: 10.1016/j.conbuildmat.2017.09.109
Khoshnevis, B., Yuan, X., Zahiri, B., Zhang, J., and Xia, B. (2016). Construction by Contour Crafting using sulfur concrete with planetary applications. Rapid Prototyping J. 22, 848–856. doi: 10.1108/RPJ-11-2015-0165
Korayem, A. H., Tourani, N., Zakertabrizi, M., Sabziparvar, A. M., and Duan, W. H. (2017). A review of dispersion of nanoparticles in cementitious matrices: nanoparticle geometry perspective. Constr. Build. Mater. 153, 346–357. doi: 10.1016/j.conbuildmat.2017.06.164
Kou, S. C., Poon, C. S., and Chan, D. (2007). Influence of fly ash as cement replacement on the properties of recycled aggregate concrete. J. Mater. Civil Eng. 19, 709–717. doi: 10.1061/(ASCE)0899-1561200719:9(709)
Labonnote, N., Ronnquist, A., Manum, B., and Ruther, P. (2016). Additive construction: state-of-the-art, challenges and opportunities. Autom. Constr. 72, 347–366. doi: 10.1016/j.autcon.2016.08.026
Lao, W. X., Li, M. Y., Wong, T. N., Tan, M. J., and Tjahjowidodo, T. (2020). Improving surface finish quality in extrusion-based 3D concrete printing using machine learning-based extrudate geometry control. Virtual Phys. Prototyp. 15, 178–193. doi: 10.1080/17452759.2020.1713580
Le, T. T., Austin, S. A., Lim, S., Buswell, R. A., Gibb, A. G., and Thorpe, T. (2012a). Mix design and fresh properties for high-performance printing concrete. Mater. Struct. 45, 1221–1232. doi: 10.1617/s11527-012-9828-z
Le, T. T., Austin, S. A., Lim, S., Buswell, R. A., Law, R., Gibb, A. G., et al. (2012b). Hardened properties of high-performance printing concrete. Cem. Concr. Res. 42, 558–566. doi: 10.1016/j.cemconres.2011.12.003
Li, H., Xiao, H.-G., Yuan, J., and Ou, J. (2004). Microstructure of cement mortar with nano-particles. Compos. Pt. B Eng. 35, 185–189. doi: 10.1016/S1359-8368(03)00052-0
Li, W. G., Huang, Z. Y., Cao, F. L., Sun, Z. H., and Shah, S. P. (2015). Effects of nano-silica and nano-limestone on flowability and mechanical properties of ultra-high-performance concrete matrix. Constr. Build. Mater. 95, 366–374. doi: 10.1016/j.conbuildmat.2015.05.137
Li, W. G., Huang, Z. Y., Zu, T. Y., Shi, C. J., Duan, W. H., and Shah, S. P. (2016). Influence of Nanolimestone on the hydration, mechanical strength, and autogenous shrinkage of ultrahigh-performance concrete. J. Mater. Civ. Eng. 28:04015068. doi: 10.1061/(ASCE)MT.1943-5533.0001327
Lim, S., Buswell, R. A., Le, T. T., Austin, S. A., Gibb, A. G., and Thorpe, T. (2012). Developments in construction-scale additive manufacturing processes. Autom. Constr. 21, 262–268. doi: 10.1016/j.autcon.2011.06.010
Long, G. C., Shi, Y., Ma, K. L., and Xie, Y. J. (2016). Reactive powder concrete reinforced by nanoparticles. Adv. Cem. Res. 28, 99–109. doi: 10.1680/jadcr.15.00058
Long, W. J., Tao, J. L., Lin, C., Gu, Y. C., Mei, L., Duan, H. B., et al. (2019). Rheology and buildability of sustainable cement-based composites containing micro-crystalline cellulose for 3D-printing. J. Clean. Prod. 239:118054. doi: 10.1016/j.jclepro.2019.118054
Ma, G., Li, Z., and Wang, L. (2018). Printable properties of cementitious material containing copper tailings for extrusion based 3D printing. Constr. Build. Mater. 162, 613–627. doi: 10.1016/j.conbuildmat.2017.12.051
Ma, G.W., Wang, L., and Ju, Y. (2018). State-of-the-art of 3D printing technology of cementitious material-An emerging technique for construction. Sci. China-Technol. Sci. 61, 475–495. doi: 10.1007/s11431-016-9077-7
Ma, G. W., and Wang, L. (2018). A critical review of preparation design and workability measurement of concrete material for largescale 3D printing. Front. Struct. Civ. Eng. 12:382–400. doi: 10.1007/s11709-017-0430-x
Meng, T., Yu, Y., and Wang, Z. (2017). Effect of nano-CaCO3 slurry on the mechanical properties and micro-structure of concrete with and without fly ash. Compos. Pt. B-Eng. 117, 124–129. doi: 10.1016/j.compositesb.2017.02.030
Mikulcic, H., Klemes, J. J., Vujanovic, M., Urbaniec, K., and Duic, N. (2016). Reducing greenhouse gasses emissions by fostering the deployment of alternative raw materials and energy sources in the cleaner cement manufacturing process. J. Clean. Prod. 136, 119–132. doi: 10.1016/j.jclepro.2016.04.145
Nerella, V. N., Hempel, S., and Mechtcherine, V. (2019). Effects of layer-interface properties on mechanical performance of concrete elements produced by extrusion-based 3D-printing. Constr. Build. Mater. 205, 586–601. doi: 10.1016/j.conbuildmat.2019.01.235
Ngo, T. D., Kashani, A., Imbalzano, G., Nguyen, K. T. Q., and Hui, D. (2018). Additive manufacturing (3D printing): a review of materials, methods, applications and challenges. Compos. Pt. B Eng. 143, 172–196. doi: 10.1016/j.compositesb.2018.02.012
Paul, S. C., Tay, Y. W. D., Panda, B., and Tan, M. J. (2018). Fresh and hardened properties of 3D printable cementitious materials for building and construction. Arch. Civ. Mech. Eng. 18, 311–319. doi: 10.1016/j.acme.2017.02.008
Pera, J., Husson, S., and Guilhot, B. (1999). Influence of finely ground limestone on cement hydration. Cem. Concr. Compos. 21, 99–105. doi: 10.1016/S0958-9465(98)00020-1
Roussel, N., Ovarlez, G., Garrault, S., and Brumaud, C. (2012). The origins of thixotropy of fresh cement pastes. Cem. Concr. Res. 42, 148–157. doi: 10.1016/j.cemconres.2011.09.004
Ruan, S. Q., Qiu, J. S., Yang, E. H., and Unluer, C. (2018). Fiber-reinforced reactive magnesia-based tensile strain-hardening composites. Cem. Concr. Compos. 89, 52–61. doi: 10.1016/j.cemconcomp.2018.03.002
Scrivener, K. L. (2004). Backscattered electron imaging of cementitious microstructures: understanding and quantification. Cem. Concr. Compos. 26, 935–945. doi: 10.1016/j.cemconcomp.2004.02.029
Shaikh, F. U. A., and Supit, S. W. M. (2014). Mechanical and durability properties of high volume fly ash (HVFA) concrete containing calcium carbonate (CaCO3) nanoparticles. Constr. Build. Mater. 70, 309–321. doi: 10.1016/j.conbuildmat.2014.07.099
Shaikh, F. U. A., Supit, S. W. M., and Barbhuiya, S. (2017). Microstructure and nanoscaled characterization of HVFA cement paste containing nano-SiO2 and nano-CaCO3. J. Mater. Civ. Eng. 29, 1–10. doi: 10.1061/(ASCE)MT.1943-5533.0001898
Soltan, D. G., and Li, V. C. (2018). A self-reinforced cementitious composite for building-scale 3D printing. Cem. Concr. Compos. 90, 1–13. doi: 10.1016/j.cemconcomp.2018.03.017
Supit, S. W. M., and Shaikh, F. U. A. (2014). Effect of nano-CaCO3 on compressive strength development of high volume fly ash mortars and concretes. J. Adv. Concr. Technol. 12, 178–186. doi: 10.3151/jact.12.178
Taijiro Sato, F. D., and Diallo, F. (2010). Seeding effect of nano-CaCO3 on the hydration of tricalcium silicate. Transportat. Res. Rec. 2141, 61–67. doi: 10.3141/2141-11
Tang, S., Cai, X., He, Z., Shao, H., Li, Z., and Chen, E. (2016). Hydration process of fly ash blended cement pastes by impedance measurement. Constr. Build. Mater. 113, 939–950. doi: 10.1016/j.conbuildmat.2016.03.141
Tay, Y. W. D., Ting, G. H. A., Qian, Y., Panda, B., He, L. W., and Tan, M. J. (2019). Time gap effect on bond strength of 3D-printed concrete. Virtual Phys. Prototyp. 14, 104–113. doi: 10.1080/17452759.2018.1500420
Wang, D. H., Shi, C. J., Wu, Z. M., Wu, L. M., Xiang, S. C., and Pan, X. Y. (2016). Effects of nanomaterials on hardening of cement-silica fume-fly ash-based ultra-high-strength concrete. Adv. Cem. Res. 28, 555–566. doi: 10.1680/jadcr.15.00080
Wangler, T., Lloret, E., Reiter, L., Hack, N., Gramazio, F., Kohler, M., et al. (2016). Digital concrete: opportunities and challenges. RILEM Tech. Lett. 1, 67–75.
Wolfs, R. J. M., Bos, F. P., and Salet, T. A. M. (2018). Early age mechanical behaviour of 3D printed concrete: numerical modelling and experimental testing. Cem. Concr. Res. 106, 103–116. doi: 10.1016/j.cemconres.2018.02.001
Yang, E.-H., Yang, Y., and Li, V. C. (2007). Use of high volumes of fly ash to improve ECC mechanical properties and material greenness. ACI mater. J. 104, 620–628.
Yang, H., and Che, Y. (2018). Effects of nano-CaCO3/limestone composite particles on the hydration products and pore structure of cementitious materials. Adv. Mater. Sci. Eng. 2018, 1–8. doi: 10.1155/2018/5732352
Yang, H., and Che, Y. (2019). Research of mortar containing phosphorous slag and calcium carbonate nanoparticles. Adv. Mater. Sci. Eng. 2019:5830201. doi: 10.1155/2019/5830201
Yesilmen, S., Al-Najjar, Y., Balav, M. H., Sahmaran, M., Yildirim, G., and Lachemi, M. (2015). Nano-modification to improve the ductility of cementitious composites. Cem. Concr. Res. 76, 170–179. doi: 10.1016/j.cemconres.2015.05.026
Yu, K.-Q., Lu, Z.-D., Dai, J.-G., and Shah, S. P. (2020). Direct tensile properties and stress–strain model of UHP-ECC. J. Mater. Civil Eng. 32, 04019334. doi: 10.1061/(asce)mt.1943-5533.0002975
Keywords: 3D printing cementitious materials, nano-CaCO3, workability, strength, hydration products
Citation: Yang H, Li W and Che Y (2020) 3D Printing Cementitious Materials Containing Nano-CaCO3: Workability, Strength, and Microstructure. Front. Mater. 7:260. doi: 10.3389/fmats.2020.00260
Received: 16 May 2020; Accepted: 16 July 2020;
Published: 07 August 2020.
Edited by:
Shengwen Tang, Wuhan University, ChinaReviewed by:
Yiwei Weng, Nanyang Technological University, SingaporeKequan Yu, University of Michigan, United States
Copyright © 2020 Yang, Li and Che. This is an open-access article distributed under the terms of the Creative Commons Attribution License (CC BY). The use, distribution or reproduction in other forums is permitted, provided the original author(s) and the copyright owner(s) are credited and that the original publication in this journal is cited, in accordance with accepted academic practice. No use, distribution or reproduction is permitted which does not comply with these terms.
*Correspondence: Huashan Yang, MjAxNTEwMDAzQGd6bnUuZWR1LmNu
 Huashan Yang
 Weiwei Li