
94% of researchers rate our articles as excellent or good
Learn more about the work of our research integrity team to safeguard the quality of each article we publish.
Find out more
ORIGINAL RESEARCH article
Front. Mater., 12 May 2020
Sec. Ceramics and Glass
Volume 7 - 2020 | https://doi.org/10.3389/fmats.2020.00115
This article is part of the Research TopicProceedings of PP1594: Topological Engineering of Ultrastrong GlassesView all 13 articles
 Thilo Grammes1
 René Limbach1
 Sebastian Bruns2
 Leo van Wüllen3
 Dominique de Ligny4
 Efstratios I. Kamitsos5Karsten Durst2
 Lothar Wondraczek1
 Delia S. Brauer1*
The characterization of aluminosilicate glasses is highly relevant in geosciences and for engineering applications such as reinforcement fibers or touchscreen covers. The incorporation of phosphate as a third network-forming species into these glasses offers unique opportunities for fine-tuning glass properties via changes in glass structure and polymerization. In this work, we studied melt-quenched aluminosilicate glasses within the system SiO2-Al2O3-Na2O-P2O5 with 50–70 mol% SiO2 and up to 7.5 mol% P2O5. All glasses were metaluminous (Al:Na = 1) in order to maximize the degree of polymerization. Increasing the phosphate content at the expense of NaAlO2 led to reduced glass polymerization and density, resulting in a decrease in elastic moduli and hardness and an increase in strain-rate sensitivity. When increasing the silica content by substituting SiO4 for AlO4 tetrahedra, network polymerization remained mostly unchanged, as confirmed by nearly constant hardness. Densification upon indentation was analyzed by Raman spectroscopy and finite element analysis. We find that the elastic properties and hardness of metaluminous phospho-aluminosilicate glasses are governed by changes in density and network polymerization. Other mechanical properties underlie more complex changes in glass structure.
The mechanical properties of aluminosilicate glasses have been valued by humans since ancient times, as obsidian, a natural aluminosilicate glass vitrified from lava, found use in the fabrication of tools (Cann and Renfrew, 1964; Ericson et al., 1975; Bellot-Gurlet et al., 2004). In the early days of fracture mechanics, the high intrinsic strength of aluminosilicate glasses was demonstrated (Griffith, 1920), paving the way for their use as reinforcement fibers in composites (Botev et al., 1999; Dibenedetto, 2001; Nkurunziza et al., 2005; Sathishkumar et al., 2014). More recently, damage resistant aluminosilicate glasses have been evolving (Bechgaard et al., 2016; Zeng et al., 2016). Understanding the underlying structural origin of their response to mechanical load provides tools for tailoring glass properties (Wondraczek et al., 2011). As an ultimate objective, introducing microscopic ductility as a route to dissipate mechanical energy would enable glasses with unprecedented practical strength (Wondraczek, 2019).
Metaluminous aluminosilicate glasses are highly polymerized as aluminum is present in the form of network-forming AlO4 tetrahedra, charge-balanced by alkali metal cations such as sodium (Al:Na = 1). While the high degree of polymerization already yields favorable mechanical properties, small amounts of additional glass components may allow for fine-tuning.
The use of P2O5 as a third network-forming oxide besides SiO2 and Al2O3 is such an option. Phosphate forms tetrahedral structural units similar to those of SiO4 and AlO4. However, phosphate tetrahedra are connected to the surrounding network structure by less than four bridging oxygen bonds (Dupree et al., 1988; Kosinski et al., 1988; Gan and Hess, 1992; Toplis and Schaller, 1998) and may thus reduce glass polymerization. On the other hand, a preferential association of phosphate with Al3+ and Na+ (Ryerson and Hess, 1980; Gan and Hess, 1992; Mysen, 1998) may additionally affect glass structure and properties.
Up to now, few studies have been reported on the effects of phosphate on the mechanical properties of aluminosilicate glasses (Lönnroth and Yue, 2009; Zeng et al., 2016; Tarragó et al., 2018a,b). These studies concerned only with an excess of alkaline ions over aluminum rather than highly polymerized metaluminous glasses. Furthermore, while all of these studies investigated glass hardness, none of them reported on the elastic properties.
The aim of this work was therefore to provide a comprehensive mechanical characterization of phosphate-containing metaluminous aluminosilicate glasses and to identify the structural origin of these data. For this purpose, the model glass system of SiO2-Al2O3-Na2O-P2O5 was investigated. Three glass series were compared: one series with increasing P2O5 content from 0 to 7.5 mol% and constant 60 mol% SiO2 and two series with increasing SiO2 content from 50 to 70 mol% and constant P2O5 content of either 0 or 7.5 mol%. The study focused on elastic properties and hardness, complemented by investigations of density, densification upon indentation, strain-rate sensitivity and crack resistance.
Three series of metaluminous (Al:Na = 1) aluminosilicate glasses of the system xSiO2-yP2O5-0.5(100-x-y)Al2O3-0.5(100-x-y)Na2O were prepared by melt-quenching: (i) x = 60 mol%, y = 0, 2.5, 5, 6.25 and 7.5 mol%, (ii) x = 50, 60 and 70 mol%, y = 0 mol%, (iii) x = 50, 55.5, 60 and 70 mol%, y = 7.5 mol%. Table 1 provides an overview of nominal and analyzed glass compositions. Raw materials for synthesis were high purity powders of SiO2 (Carl Roth, Karlsruhe, Germany), Al(OH)3 (Merck, Darmstadt, Germany), Na2CO3 (Carl Roth), and NaPO3 (Carl Roth). After thorough mixing, the batches were heated up to 1,650°C at a rate of 5 K/min in alumina crucibles using an electrically heated furnace (HTK 16/17 FL, Thermconcept Dr. Fischer GmbH & Co. KG, Bremen, Germany). The melts were maintained at this temperature for 1 h before transferring the melt inside the crucible to an annealing furnace preheated to temperatures 20 K above the respective glass transition temperature, Tg, to reduce residual stresses. At 1 h at this temperature, the crucibles were slowly cooled down to room temperature by switching off the furnace. Glass monoliths were retrieved by breaking the alumina crucible walls: glasses were not cast from platinum crucibles and quenched because of high melt viscosity. From the monoliths, coplanar glass samples were cut and polished on both sides.
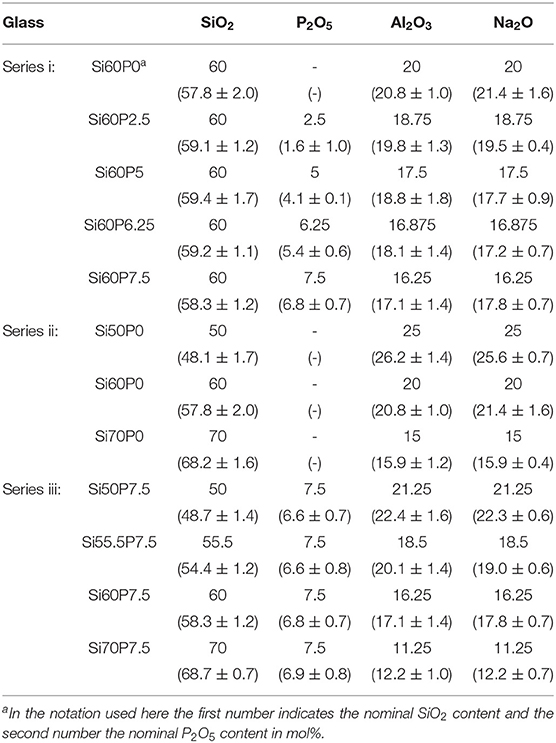
Table 1. Nominal and (in brackets) analyzed glass compositions (mol%).
As leaching of alumina from the crucibles could not be excluded, longer melting times were avoided and sections close to the crucible walls were omitted during sample cutting. The protocol described here allowed for comparable synthesis conditions for all glasses except Si50P0. For this glass, owing to its high Na2O content of 25 mol%, crystallization could only be prevented by reducing the annealing temperature to Tg-40 K. However, tests with various annealing temperatures showed that even such reduced cooling temperature had no significant effect on glass properties (results not shown).
Actual chemical compositions of all glasses were analyzed by energy-dispersive X-ray spectroscopy (EDX). For each glass the composition was calculated as mean value of four EDX measurements. Errors represent standard deviations. Using different specimens, three of these four measurements were performed with the same scanning electron microscope (Phenom pro X, Phenomworld, Eindhoven, NL). The fourth EDX measurement was performed with a different instrument (Neon 60, Zeiss, Jena, Germany, combined with X-Max X-Ray Detector 80 mm2, Oxford Instruments, High Wycombe, UK) at a different laboratory.
Glass density, ρ, was determined as the arithmetic mean out of ten measurements on a single specimen, using a helium pycnometer (AccuPyc 1330, Micromeritics GmbH, Mönchengladbach, Germany). Powder samples with a particle size of 125–250 μm were used to minimize the influence of bubbles. The experimental error is ±0.01 g/cm3. Molar volume, Vm, was calculated from density and molar weight, Mi, of each glass component weighted by its nominal molar fraction, fi.
All calculations presented here were based on nominal glass compositions, justified by a good agreement with the analyzed compositions (Table 1).
Atomic packing density, Cg, was estimated using the following equation (Makishima and Mackenzie, 1973):
Here, represents the molar volume occupied by an oxide AxBy. N is Avogadro's number and rA as well as rB are the ionic radii of the corresponding cations and anions, respectively. Effective ionic radii were employed (Shannon, 1976), considering Si4+ (rSi = 26 pm), Al3+ (rAl = 39 pm), and P5+ (rP = 17 pm) species in tetrahedral coordination, Na2+ (rNa = 102 pm) in octahedral coordination and O2− (rO = 135 pm) in two-fold coordination. It is noted that the radius of oxygen ions may vary depending on the coordinated cations and may be determined by the cation-oxygen bond lengths (Duffy, 1990; Zeidler et al., 2014). However, in the absence of quantitative data on the amount of bridging and non-bridging oxygen species and the connectivity between different polyhedral species, a constant ionic radius of oxygen was chosen for the sake of simplicity. Consequences of this assumption will be addressed in the discussion.
Oxygen packing density, ρox, was calculated as the molar amount of oxygen per unit volume of glass (Ray, 1974; Fredholm et al., 2010).
Nox,i is the stoichiometric number of oxygen atoms provided by each glass component, i.e., 2 for SiO2, 5 for P2O5, 3 for Al2O3 and 1 for Na2O. Errors of molar volume, packing density and oxygen packing density were estimated by error propagation calculation.
The longitudinal and transversal sound velocities, vL and vT, were measured by ultrasonic echometry and Brillouin spectroscopy. On that basis, elastic properties were calculated, including shear modulus, G, Young's modulus, E, bulk modulus, K, and Poisson's ratio, ν, under the assumption of isotropic symmetry in the glasses (Rouxel, 2007). Experimental uncertainties were estimated by error propagation.
Ultrasonic echometry was performed on coplanar, optically-polished samples of ~2 mm thickness using an echometer (Echometer 1077, Karl Deutsch GmbH & Co. KG, Wuppertal, Germany) equipped with piezoelectric transducers operating at frequencies of 8–12 MHz. Values of vT and vT were derived from sound propagation times, which were recorded with an accuracy of ±1 ns, and from the exact thickness of the 2 mm thick coplanar, optically-polished specimen, as measured with an accuracy of ±2 μm using a micrometer screw.
Brillouin spectroscopy was performed at room temperature on coplanar, optically-polished samples of 200–300 μm thickness using a custom-built optical setup as described previously (Veber et al., 2018). Brillouin shifts were averaged between the Stokes and anti-Stokes signals to account for instrumental non-zero position of the Rayleigh line. Experiments were performed in backscattering geometry (through a microscope, 50x magnification, 0.42 numerical aperture) as well as platelet geometry (45° incidence angle).
In backscattering geometry, vL was determined as vL = f·λ/(2n) (Rabia et al., 2016), where λ (488 nm) is the wavelength of the continuous wave sapphire laser used, and f is the Brillouin shift of the longitudinal acoustic mode, which was determined with an accuracy of ±0.012 GHz. The glasses' refractive index, n, at 488 nm was deduced by linear interpolation between refractive indices at 480 and 546.1 nm as determined by Pulfrich refractometry (PR2, Carl Zeiss, Jena, Germany) with an experimental uncertainty of ±0.001.
In platelet geometry, vL and vT were determined from the Brillouin shifts of the longitudinal and transversal acoustic modes, fL and fT, as vL/T = fL/T·λ/(√2) (Whitfield et al., 1976). Although the platelet geometry delivered both vL and vT, the vL value from backscattering geometry is normally more precise because of sample surfaces not being perfectly coplanar and because of precision on the 45° angle in platelet geometry. The values of vL from backscattering geometry were therefore preferred and further used to correct vT from platelet geometry (vT,corrected = vT × vL,backscatter/vL,platelet).
In addition to experimental results, we employed the model of Makishima and Mackenzie (1973) to predict the compositional dependence of Young's modulus. Following this approach, Young's modulus of a glass is determined from the atomic packing density and volume density of bonding energy, < U0/Vm>.
Note that < U0/Vm> was calculated by means of the actual glass density rather than the density of the individual components in their crystalline state (Limbach et al., 2017). The average bond energy, U0 = ∑fiΔHai, was calculated from molar dissociation enthalpies, ΔHai, of the glass components, weighted by their nominal molar fractions, fi. Values of ΔHai were determined from molar heats of formation, ΔHf, of each oxide component AxBy in its crystalline state and the constituent atoms in gaseous state (Inaba et al., 1999).
Values of ΔHf were taken from Lide (2006), except for ΔHf(P2O5) = −306.4 kJ/mol, which was calculated from the dissociation energy of P2O5, ΔHai/Vm = 62.8 kJ/cm3, available from literature (Inaba et al., 1999) and using Equations (1) and (9). The error of the calculated modulus was estimated by error propagation.
Instrumented indentation experiments were carried out using a nanoindenter (Nano Indenter G200, Schaefer Technology GmbH, Langen, Germany) equipped with a three-sided Berkovich diamond tip (Synton-MDP, Port, Switzerland) and operating in continuous stiffness measurement (CSM) mode (applying an oscillation of amplitude Δh = 2 nm and frequency f = 45 Hz). Values of Young's modulus and hardness, H, were determined from indentations with a depth limit, h, of 2 μm created at constant strain-rate, , of 0.05 s−1, following the method proposed by Oliver and Pharr (1992). For statistical relevance, the values of E and H were averaged over at least 15 individual indentation experiments.
Time-dependent indentation deformation was analyzed in a nanoindentation strain-rate jump test, as described in detail elsewhere (Maier et al., 2011; Limbach et al., 2014). This test initially comprises a first segment, where the Berkovich indenter tip penetrates the glass surface to a depth of 500 nm at a constant strain-rate of 0.05 s−1. Afterwards, with further increasing indenter displacement, the strain-rate is changed in intervals of 250 nm while monitoring the accompanied changes in hardness using the CSM equipment of the nanoindentation setup (Δh = 5 nm, f = 45 Hz). In this study, a total number of at least eight strain-rate jump tests were evaluated on each sample with strain-rates of 0.05, 0.007, and 0.001 s−1 (in descending order). The strain-rate sensitivity, m, was calculated from the slope of the logarithmic plot of the hardness, lnH, over the indentation strain-rate, , where, is equal to for materials with a depth-independent hardness value (Maier et al., 2011, 2013; Limbach et al., 2014; Zehnder et al., 2017).
Error bars show standard deviations from averaging over all evaluated indentation experiments.
Vickers hardness, Hv, was determined using a Vickers microhardness tester (Duramin-1, Struers GmbH, Willich, Germany). On each sample, 25 indentations with a load, P, of 981 mN were created. Loading duration and dwell time were set to 15 and 10 s, respectively. Hv was calculated from the load in N and the length of the projected indentation diagonals, d, in μm according to Hv = 1.8544(P/d2) (Tabor, 1970). Error bars show standard deviations.
Crack resistance was analyzed by Vickers indentation. Indents with stepwise increasing loads from 981 mN up to 19.6 N were created in air under ambient conditions using a constant loading duration of 15 s and dwell time of 10 s. After unloading, the number of median-radial cracks occurring at the corners (illustrated by inset in Figure 1) of the residual Vickers hardness imprints was counted. On each sample, 25 indentations were performed per load applied and the probability of crack initiation, PCI, was calculated from the number of corners with cracks divided by the total number of corners.
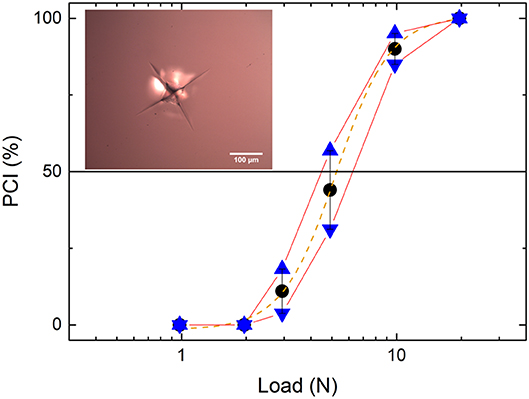
Figure 1. Probability of crack initiation (PCI) as a function of the applied Vickers indentation load for glass Si60P7.5. The inset shows the typical crack pattern observed after Vickers indentation (load 19.6 N). The orange dashed line illustrates the sigmoidal fit used to determine crack resistance (defined as the load at PCI = 50%). Connecting the end points of the PCI error bars creates an approximated error envelope. The intersections of this error envelope with the 50% PCI line were used to estimate the experimental uncertainty in crack resistance.
The load dependence of PCI is exemplarily shown for glass Si60P7.5 in Figure 1. The experimental data follows the typical sigmoidal trend (orange dashed line) as reported previously (Limbach et al., 2015b). The load value of the fitted sigmoidal curve at 50% PCI was taken as crack resistance, CR, i.e. the load at which on average two cracks were formed. A detailed description of the procedure used for assessing the experimental uncertainty of this method is given in the Discussion.
To characterize glass densification, the low frequency region of Raman spectra was analyzed using the method presented by Deschamps et al. (2011, 2013). After indentation, the low frequency Raman region (blue line in Figure 2), including its center of gravity, COG (dash-dotted gray line in Figure 2), was shifted (illustrated by arrow in Figure 2) toward higher wavenumbers. This COG shift upon indentation was used to quantify densification.

Figure 2. Raman spectra of a glass before (black) and after (orange) densification by Vickers indentation. The blue spectrum shows the low frequency region after subtraction of a baseline (dashed black line) and was used to calculate that region's center of gravity (COG, gray dash-dotted line). The densification shifted intensities in the low frequency region. This was quantified by determining the shift of the COG (arrow, not to scale).
The low frequency envelopes of Raman spectra measured before (black spectrum in Figure 2) and after indentation (orange spectrum in Figure 2) were integrated to obtain their respective COG using the following equation.
Here, the COG is the wavenumber which divides the integrated region into two parts of equal area. I(ω) is the Raman intensity and ω the Raman shift in cm−1. The lower and upper integration limits are low and up, respectively. The limits were chosen at the positions of the intensity minima which confined the low frequency Raman region.
Following the procedure by Deschamps et al. (2011), a linear baseline as illustrated in Figure 2 was subtracted from the low frequency Raman region prior to COG calculation. Furthermore, the use of this baseline was compared to another post-processing routine involving a linear baseline fitted to the signal-free high frequency end of the Raman spectra to remove luminescence, followed by a data reduction by the Long equation (Long, 1977, 2002).
Here, ω0 is the wavenumber of the excitation laser, ℏ is the reduced Planck constant, kB the Boltzmann constant and T the absolute temperature. The Long reduction required a change of the lower integration limit because it shifted the corresponding intensity minimum to the lowest measured frequency. This enlarged the integrated range for datasets that underwent the Long reduction. However, the impact of the changed integration limits on the COG calculation was considered low as Raman intensities in the affected wavenumber regime dropped significantly during Long reduction.
Raman spectra were measured in the centers of each of five residual Vickers hardness imprints (load 981 mN) per sample, as well as five reference spectra of the pristine glasses. Obtained COG shifts were averaged, error bars show standard deviations. Raman measurements were carried out using a Raman microscope (invia Raman Microscope, Renishaw, Wotton-under-Edge, UK). Measurements were performed at room temperature using the 488 nm line of an argon ion laser and a microscope objective lens with 50× magnification and a 0.50 numerical aperture. Spectra were measured in the range from 150 to 1,550 cm−1. The acquisition time per spectrum was 225 s, summarized over several scans.
Finite Element Analysis (FEA) was performed using the software package ABAQUS, similar to earlier studies (Bruns et al., 2017, 2020). The indentation process was modeled in a two-dimensional (2D) axisymmetric way using the Berkovich equivalent cone, which exhibits an opening angle of 70.3°. The indenter/material contact was assumed to be frictionless. All material properties were presumed to represent rate insensitive room temperature values. The series with constant 60 mol% SiO2 content (Si60Px) was selected as model system, whose corresponding elastic properties (isotropy assumed) can be found in the Results section.
The yield surface of this series was mapped with Drucker-Prager-Cap plasticity according to Bruns et al. (2020). The yield strength under hydrostatic pressure relied on densification hardening curves usually recorded in diamond anvil cell (DAC) experiments. Since corresponding data are not available for the system studied here, the densification capacity was estimated according to Rouxel's model predictions based on Poisson's ratio (Rouxel et al., 2008). For ν = 0.22 (constant value found for the entire Si60Px series) a densification capacity of 8.6 ± 2.5% can be estimated. The experimental densification hardening curve of fused silica (Rouxel et al., 2008; Sonneville et al., 2012; Deschamps et al., 2013) was then compressed to the saturation level determined earlier (8.6%, Figure 3A) and serves as input for cap hardening along hydrostatic axis.
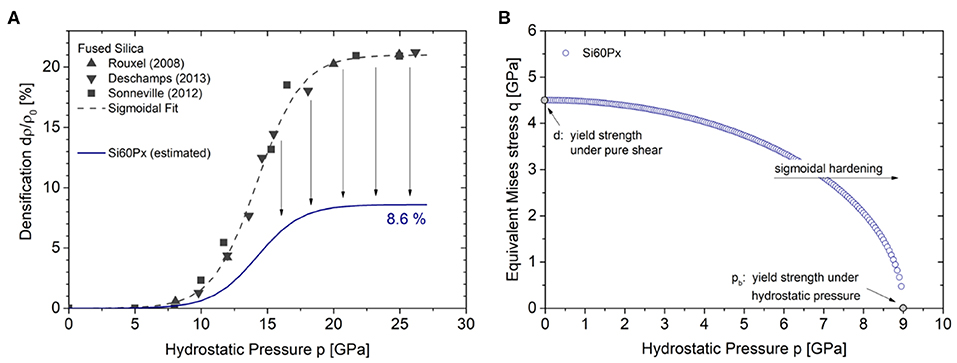
Figure 3. (A) Densification hardening curve for the series with constant 60 mol% SiO2 (Si60Px, dark blue) based on model predictions and experimental data on fused silica (open symbols). It serves as input for determination of the yield surface. The yield surface, shown in (B), was used for FEA analysis of the Si60Px series (applies to all x values from 0 to 7.5 mol% P2O5 because all glasses had similar Poisson's ratio, see text).
The yield strength under pure shear was fitted based on experimental nanoindentation load-displacement curves using the extrema of the Si60Px series with 0 and 7.5 mol% P2O5. Since the densification prediction does not exhibit the sensitivity to account for those chemical variations, only one representative yield surface for this series was constructed (Figure 3B).
Deviations from the nominal compositions are listed in Table 1. Almost all values measured are similar to the nominal compositions within error limit. It can be noticed however that SiO2 and P2O5 content were systematically lower and Al2O3 and Na2O content higher than nominal composition. The overall good agreement justifies the utilization of the nominal compositions for the theoretical considerations on packing efficiency or bond energy density.
Density (ρ) and atomic packing density (Cg) decreased, while molar volume (Vm) and oxygen packing density (ρox) increased for glasses with increasing P2O5 content and constant SiO2 content (Figures 4A,C,E,G). For increasing SiO2 content and constant P2O5 content of either 0 or 7.5 mol% density and atomic packing density decreased, and oxygen packing density increased (Figures 4B,F,H). For phosphate-free glasses the decrease of packing density was within the error limit at lower silica contents (Figure 4F). At 50 mol% SiO2, the incorporation of P2O5 did not notably change packing density. The molar volume only slightly decreased for increasing SiO2 content and remained almost constant for glasses with 7.5 mol% P2O5 (Figure 4D).
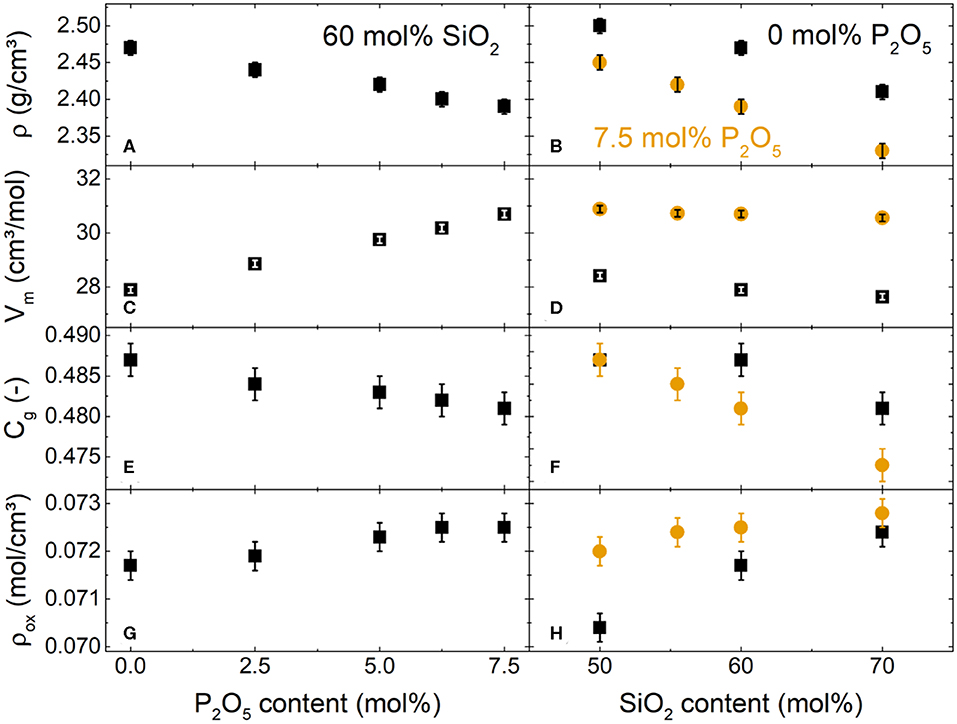
Figure 4. Density (A,B), molar volume (C,D), packing density (E,F), and oxygen packing density (G,H) of the glasses with (A,C,E,G) 60 mol% SiO2, (B,D,F,H) 0 mol% P2O5 (black squares) or 7.5 mol% P2O5 (orange circles).
Compositional variations in elastic properties, including shear (G), bulk (K) and Young's moduli (E) as well as Poisson's ratio (ν), as obtained from the different experimental methods are illustrated in Figures 5–7. Trends described in the following apply to all methods employed.
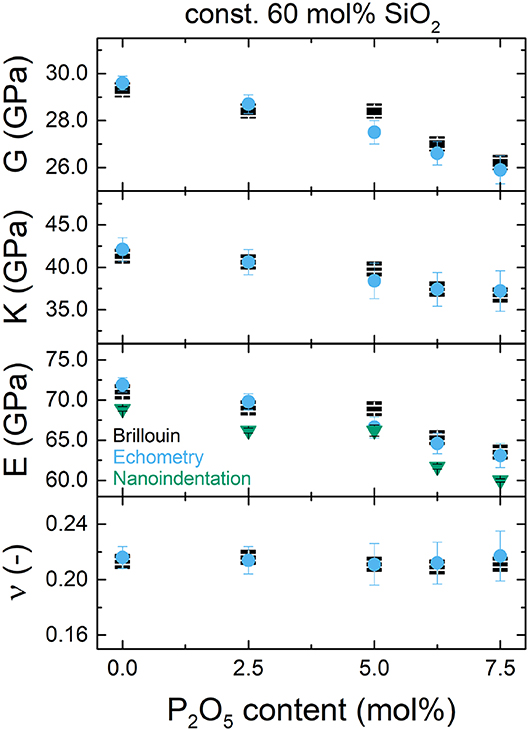
Figure 5. Elastic properties obtained by Brillouin spectroscopy (black squares), ultrasonic echometry (blue circles) and nanoindentation (green triangles, only E) for glasses with 60 mol% SiO2 and varying phosphate content: (from top to bottom) shear modulus (G), bulk modulus (K), Young's modulus (E) and Poisson's ratio (ν).
For glasses with constant 60 mol% SiO2 and increasing phosphate content (Figure 5), the values of G, K and E decreased while ν remained constant within error limits.
For increasing silica content in phosphate-free glasses (Figure 6) as well as glasses with 7.5 mol% P2O5 (Figure 7), the trends were less clear. G remained roughly constant while K and E decreased with increasing silica content, regardless of the phosphate content. The decrease in E was weak, but K showed a decrease of a similar magnitude as the one observed with increasing phosphate content. Poisson's ratio appeared to decrease with increasing silica content.
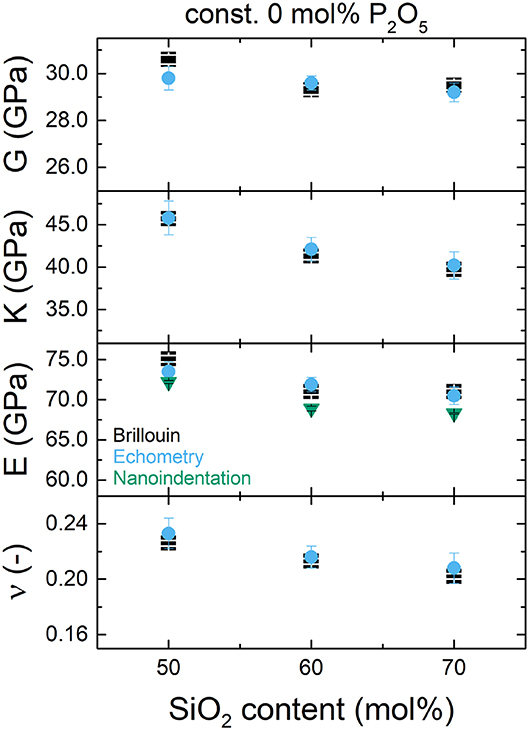
Figure 6. Elastic properties obtained by Brillouin spectroscopy (black squares), ultrasonic echometry (blue circles) and nanoindentation (green triangles, only E) for glasses with 0 mol% P2O5 and varying silica content: (from top to bottom) shear modulus (G), bulk modulus (K), Young's modulus (E) and Poisson's ratio (ν).
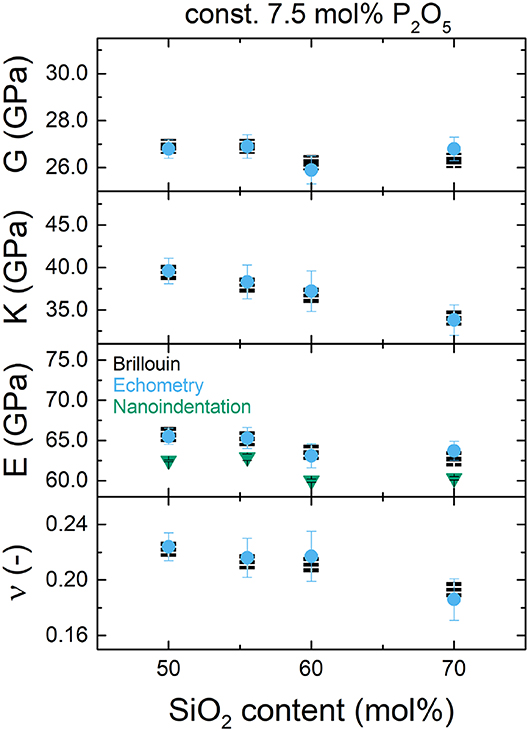
Figure 7. Elastic properties obtained by Brillouin spectroscopy (black squares), ultrasonic echometry (blue circles) and nanoindentation (green triangles, only E) for glasses with 7.5 mol% P2O5 and varying silica content: (from top to bottom) shear modulus (G), bulk modulus (K), Young's modulus (E) and Poisson's ratio (ν).
Elastic properties obtained by ultrasonic echometry and Brillouin spectroscopy were in good agreement (Figures 5–7), reflecting the fact that both methods rely on the propagation of sound waves. The only exception was glass Si60P5 (5 mol% P2O5, Figure 5), where slightly higher values of G, K and E were probed by Brillouin spectroscopy as compared to ultrasonic echometry.
The trends for E obtained by nanoindentation (green triangles in Figures 5–7) agreed well with the trends determined by ultrasonic echometry and Brillouin spectroscopy. Here again, the sample with 5 mol% P2O5 was slightly off the trend, indicating an outlier. Values for E obtained by nanoindentation were systematically lower by up to 5 GPa than those obtained by the other two methods. This small discrepancy results from differences in testing conditions and may originate from sink-in effects or a piling-up of material at the periphery of the indenter (Limbach et al., 2015a, 2017).
Young's modulus as calculated by the model of Makishima-Mackenzie (EM+M) was relatively close to the values measured by echometry (Figure 8); however, the model systematically underestimated the experimentally determined values by about 2–8 GPa.
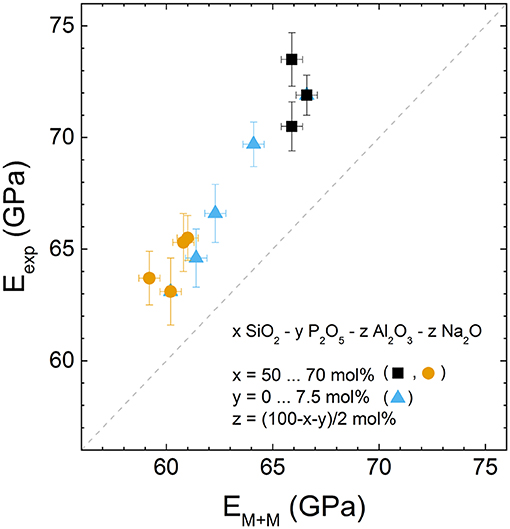
Figure 8. Comparison of Young's moduli determined by ultrasonic echometry (Eexp) and by the Makishima-Mackenzie model (EM+M). The dashed line marks the ideal case of complete agreement. The Makishima-Mackenzie model slightly underestimates the measured values.
Compositional trends in the hardness as obtained from micro- and nanoindentation agreed well, yielding decreasing hardness values with increasing phosphate content (Figures 9A,C). With increasing silica content (Figures 9B,D), hardness remained roughly constant for both methods, regardless of the phosphate content. However, Vickers hardness (Hv) showed a slight decrease for increasing silica content in phosphate-free glasses. The hardness values measured by nanoindentation (H) were systematically higher than the corresponding Vickers hardness by ~1 GPa. This may be attributed to differences between the two methods: Vickers microindentation probes plastic deformation only, while nanoindentation probes the combined elastic-plastic response of a material, yielding higher hardness values for materials with a pronounced elastic contribution to the indentation deformation (Oliver and Pharr, 1992).
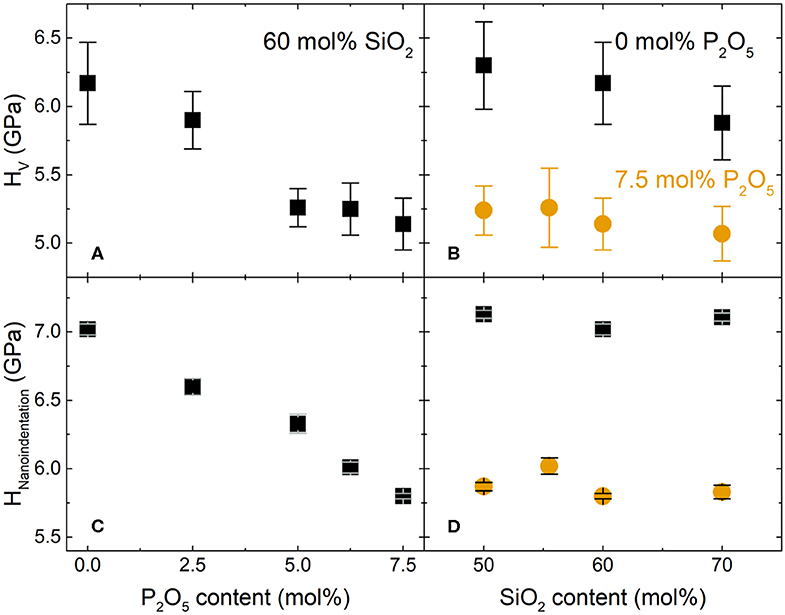
Figure 9. Compositional dependence of (A,B) Vickers hardness, Hv, and (C,D) hardness as determined by nanoindentation, H: (A,C) increasing P2O5 content and constant 60 mol% SiO2, (B,D) increasing SiO2 content and constant P2O5 contents of 0 (black squares) or 7.5 mol% (orange circles).
Crack resistance did not show any trend for increasing phosphate content (Figure 10A). Data scattered between values of 4 and 8 N. By contrast, two different trends were found for the glasses with 0 and 7.5 mol% P2O5, respectively, when increasing the silica content (Figure 10B). The crack resistance of glasses with 0 mol% P2O5 slightly increased for increasing silica content. For the glasses with 7.5 mol% P2O5, crack resistance decreased markedly from 50 to 55.5 mol% SiO2 and then remained constant within error limit for further increasing silica content.
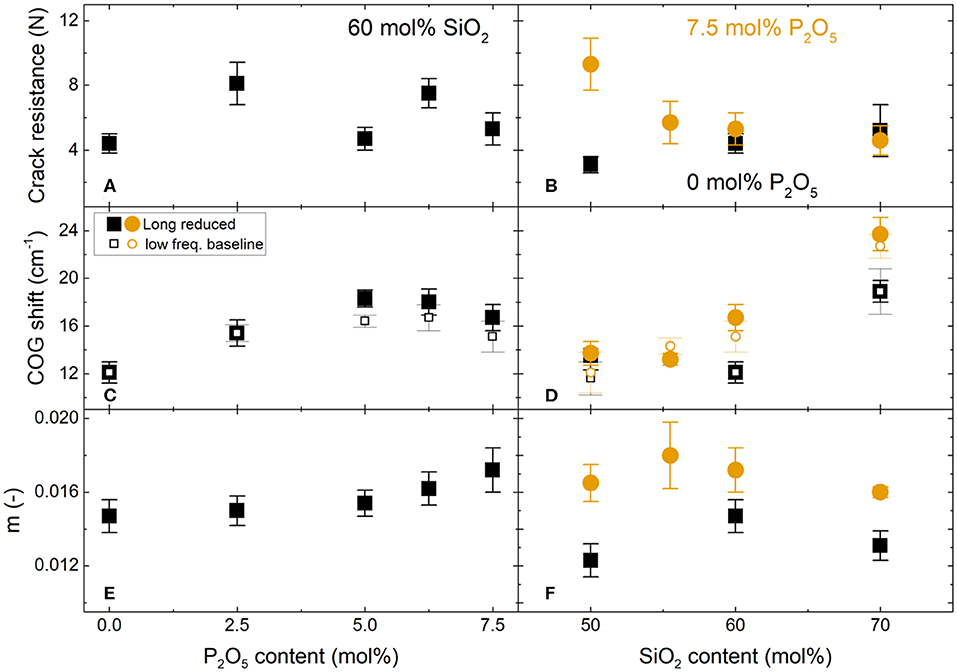
Figure 10. Compositional dependence of (A,B) crack resistance, (C,D) indentation-induced (981 mN) shift in the low frequency Raman center of gravity (COG) and (E,F) strain-rate sensitivity (m): (A,C,E) increasing P2O5 content and constant 60 mol% SiO2, (B,D,F) increasing SiO2 content and constant P2O5 contents of 0 (black squares) or 7.5 mol% (orange circles). Only for (C,D): Filled symbols show COG shift after data reduction by the Long equation, preceded by a baseline correction at the high frequency end of the spectra. Open symbols show COG shift after subtraction of a linear baseline from the low frequency spectral region.
Densification upon indentation resulted in a COG shift by 12–24 cm−1 of the low frequency Raman region in the considered spectral range of 200–650 cm−1 (exemplified in Figure 2, black spectrum before indentation, orange spectrum after indentation). For the two post-processing routes used, i.e., Long data reduction and baseline subtraction (filled and open symbols in Figures 10C,D), the COG shifts upon indentation showed little variation (<2 cm−1). For increasing phosphate content (Figure 10C) the COG shift increased to a maximum value and then slightly decreased toward 7.5 mol% P2O5, independent of the data processing. For increasing silica content (Figure 10D), the COG shift increased for both glass series. This increase appeared to be linear within the error range for the series with 7.5 mol% P2O5 (Figure 10D, orange circles), while it was non-linear for the series with 0 mol% P2O5 (Figure 10D, black squares).
As an additional observation, an increase in phosphate content did not significantly affect the COG shift for the glasses with 50 mol% SiO2 (Figure 10D), regardless of the data processing.
Previous studies indicate that densification saturation cannot be achieved using indentation testing (Bruns et al., 2020). The predicted saturation densification of 8.6% (see section Finite Element Analysis in the Materials and Methods section) will likely not be achieved in the indentation center. An experimental determination of densification based on the COG shift upon indentation requires correlation factors, usually determined in DAC experiments accompanied by Raman spectroscopy. Those factors are rarely available for glasses, except for fused silica (Sonneville et al., 2012; Deschamps et al., 2013), and it remains unclear if they are applicable to other glasses, such as the aluminosilicate glasses investigated here. In the absence of such data an alternative strategy needs to be proposed.
FEA offers the opportunity to fill this gap and to provide information on the densification field for a glass from the Si60Px series having a Poisson's ratio of 0.22 (Figure 11). Densification is exported from ABAQUS using the parameter PEQC4, a measure for the total volumetric inelastic strain. In this manner, a maximum densification of 5.88 ± 1.39% can be observed in the indentation center.
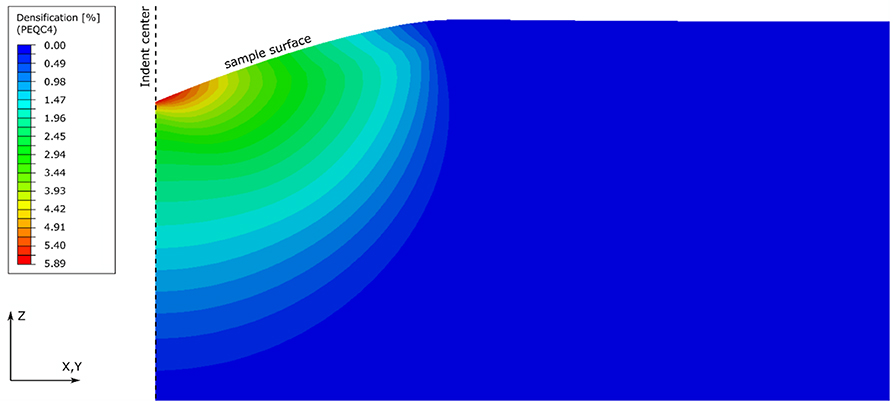
Figure 11. FEA densification field for the system with constant 60 mol% SiO2, beneath the residual impression of a Berkovich equivalent conical indentation. As the indenter shape is self-similar, the shape of the densification field is independent from indentation depth. Therefore, no scale is required for the axes X,Y,Z. Densification is exported from ABAQUS using the PEQC4 parameter.
For increasing phosphate content (Figure 10E) the strain-rate sensitivity slightly increased. For increasing silica content (Figure 10F) the strain-rate sensitivity appears to increase first up to a maximum value in the range between 50 and 60 mol% SiO2, followed by a slight decrease with further increasing SiO2 content for both glass series.
The observed slight increase in Al2O3 content and decrease in SiO2 content compared to the nominal composition (Table 1) can be attributed to Al2O3 crucible corrosion (Barz et al., 1996; Smith et al., 2014; Palles et al., 2016). The amount of Al2O3 incorporation found here is less than for (silico-)phosphate and tellurite glasses, which have been found to incorporate about 3–9 mol% Al2O3 during melting (Palles et al., 2016; Tagiara et al., 2017; Griebenow et al., 2018; Sawangboon et al., 2020). This difference may be explained by the high melt viscosity of the present glasses.
The lower P2O5 content may originate from P2O5 evaporation during melting (Griebenow et al., 2018; Sawangboon et al., 2020), but P2O5 losses are small considering the high melting temperature. This confirms a previous finding that P2O5 is not likely to leave metaluminous melts (London et al., 1993).
The decreasing density and atomic packing density as well as the increasing molar volume with increasing phosphate content (Figure 4) may be explained by the fact that phosphate was incorporated by substituting P2O5 for NaAlO2, i.e., substituting two phosphate tetrahedra for one aluminate tetrahedron charge-balanced by sodium. We note that all aluminate tetrahedra are supposed to have four bridging oxygen atoms (BO) because of the metaluminous composition (Al:Na = 1). Phosphate tetrahedra, on the other hand, may bear fewer BO. Phosphate groups have been reported to partially assume state by forming Al-O-P bonds (Ryerson and Hess, 1980; Gan and Hess, 1992; Kirkpatrick and Brow, 1995). Such bonds between tetrahedral aluminate and phosphate groups have been shown by a bond valence approach to be stable in the absence of an alkaline charge-compensator. In this approach, the Al3+ provides 0.75 valence units (cation oxidation number / coordination number) to the bridging oxygen, while the P5+ provides 1.25 valence units. Therefore, the nominal −2 charge of the bridging oxygen is compensated (Brow et al., 1993; Bertmer et al., 2000). Al-O-P bond formation was supported also by heteronuclear dipolar solid state NMR experiments (Nizamutdinova et al., 2020). Formation of these bonds should liberate Na+ ions to create new non-bridging oxygen atoms (NBO) rather than charge-balancing aluminate tetrahedra. As a consequence, the progressive substitution of P2O5 for NaAlO2 introduces more tetrahedral units per mole and simultaneously reduces the average number of BO per tetrahedron. An increase in phosphate content therefore involves a decreasing network polymerization. This depolymerisation was supported by recent results derived from a solid-state 31P MAS NMR spectroscopic analysis (Nizamutdinova et al., 2020). A glass network with fewer cross-links and a higher number of tetrahedra per mole is likely to be less compact. The observed decrease in density and atomic packing density as well as the increase in molar volume may be attributed to this decreased network polymerization, but also to the decreasing amount of interstitial sodium ions with increasing P2O5 content and, with regard to the molar volume, to a higher number of tetrahedral species per mole. A similar decrease in density has been observed in basaltic glasses (Tarragó et al., 2018b).
For increasing silica content, silica tetrahedra (SiO4) were substituted for aluminate tetrahedra charge-balanced by sodium (Na+[AlO4]−). As both tetrahedral units bear four BO each, the overall network polymerization is assumed to remain unchanged. This appears to correlate with the nearly constant molar volume, but the latter may also be explained by the constant number of tetrahedral groups, regardless of their degree of polymerization. The decrease in density and atomic packing density for increasing silica content is caused by the requirement for charge-balancing Na+ ions in the vicinity of [AlO4]− tetrahedra. Considering the similar ionic radii of Si4+ (rSi = 26 pm) and Al3+ (rAl = 39 pm) (Shannon, 1976), their corresponding tetrahedra will also be of comparable size, but a network with more aluminate tetrahedra is likely to occupy more inter-tetrahedral space for the accommodation of the charge-balancing sodium ions. Therefore, both density (ρ) and atomic packing density (Cg) changed, even though the molar volume remained roughly constant.
The invariance of Cg within the error limits for all glasses with 50 mol% SiO2 and for the phosphate-free glass with 60 mol% SiO2, even though ρ changed, is attributed to the Cg model assumption of densely packed spheres. This model is strongly affected by the selected ionic radii and does not take into account directional bonds and NBO which may be present.
The trend observed for oxygen packing density (ρox) was opposite to that for density (Figure 4). This is counter intuitive for oxide glasses with oxygen as the most abundant element. The concept of oxygen packing density, i.e., the amount of oxygen atoms per defined volume of glass, has been introduced by Ray (1974), who emphasized its usefulness for weakly polymerized alkali silicate glasses with alkaline ions acting as network modifier. The glasses studied here, however, are highly polymerized, and sodium ions take a charge-balancing role rather than a modifying one. Equivalent to Cg, the calculation of ρox is based on the assumption of densely packed spheres and does not take the directional, covalent character of the oxygen bridging bonding into account. The dependence of oxygen packing density on stoichiometric numbers appears to be a disadvantage in the presence of three different network-forming oxides, all of them with different stoichiometric numbers of oxygen. Oxygen packing density is most useful for glass series with constant numbers of oxygen atoms per formula unit (Tylkowski and Brauer, 2013; Mandlule et al., 2014). Oxygen packing density has been found to depend on the coordination number of the cations (Zeidler et al., 2014; Salmon and Zeidler, 2015). However, recent solid-state MAS NMR spectroscopic investigations indicated that Si, Al and P remained in four-fold coordination in all studied glasses (Grammes et al., in preparation; Nizamutdinova et al., 2020).
Results for packing density and oxygen packing density may additionally be affected by the assumption of a constant ionic radius for oxygen (rO = 135 pm). The ionic radius of oxygen is known to vary depending on the adjacent cationic species (Duffy, 1990; Zeidler et al., 2014). Therefore, values found here could be erroneous. In general, a lower oxygen radius should enable a higher packing density and oxygen packing density. However, once the oxygen is surrounded by cations from more than one species, determination of an exact ionic radius becomes difficult if no quantitative data are available from bond-length measurements. We note that the calculation of oxygen packing density according to Equation (3) does not involve the ionic radius of oxygen [in contrast to the equation used by Zeidler et al. (2014) which requires an a-priori knowledge of the exact bond-lengths] while the packing density calculation via Equation (2) does require the oxygen radius. This may also be a reason for the opposing trends between those two properties. As stated above, the trend in packing density appears more valid as it correlates with the measured density. Therefore, the oxygen packing density will not be taken into account in further analyses here.
The elastic properties determined for phosphate-free metaluminous glasses agreed well with available literature data on similar compositions. For Si50P0 and Si60P0 glasses, values of Young's modulus ranging from 72 to 74 GPa have been reported (here: 71–75 GPa for Brillouin spectroscopy and ultrasonic echometry) as well as Poisson's ratios from 0.200 to 0.228 (here: 0.213–0.233) (Tiegel et al., 2015; Weigel et al., 2016). To our knowledge, elastic properties have not yet been reported on comparable phospho-aluminosilicate glass compositions. Only peralkaline basaltic glasses with negligible phosphate contents of 0.2 mol% have been investigated (Lönnroth and Yue, 2009). The decrease in E, G and K for increasing phosphate content (Figure 5) may indicate a decrease in network polymerization. This trend may also be related to a decrease in atomic packing density upon phosphate incorporation, as suggested by Makishima and Mackenzie (1973). According to Rouxel, the packing density shows a non-linear correlation with elastic properties for a wide range of glass types (Rouxel, 2006, 2007).
For increasing silica content here, polymerization should remain unchanged, at least in the phosphate-free glasses. For the phosphate-containing glasses, interactions between Na, P and Al may slightly influence polymerization. If little to no change in polymerization is assumed, the elastic properties should remain largely constant. This assumption is well confirmed by the results for G and possibly for E (Figures 6, 7). Results show a clear difference in the trends for G and E with increasing silica content, showing minor changes only, and much more pronounced changes for increasing phosphate content. Despite constant network polymerization with increasing silica content, a clear decrease of K is observed in addition to the very minor decreases of G and E. These decreasing moduli may possibly be explained by the decrease in packing density (Figure 4). The decrease in packing density with increasing silica content indicates an increase in free volume. A glass with more free volume will be more compliant toward elastic deformation as indicated by the trend observed for K (and, possibly, G and E). To conclude, both network polymerization and atomic packing density appear to contribute to modulus changes, but only the change in packing density may explain all measured trends.
Poisson's ratio remained practically constant for increasing P2O5 content (Figure 5) and decreasing polymerization, even though Rouxel (2006) indicated an increase of ν for glasses with lower degree of cross-linking. However, his data showed large scattering for highly polymerized glasses. Rouxel's observations also include a decrease in Poisson's ratio with decreasing packing density. The results shown here do not confirm this observation, however, as the packing density showed a clear decrease with increasing phosphate content, while Poisson's ratio remained constant. By contrast, the slight decrease of ν for increasing SiO2 content (Figures 6, 7) matches the relationship found by Rouxel (2006). There is actually a simple mathematical explanation for the constant values observed for ν, as it was calculated by dividing E by G. As E and G showed comparable changes with composition, no change in ν is observed. One additional observation may be noted, though. Rouxel's observation of a correlation between ν and packing density (Rouxel, 2006) was confirmed here when substituting SiO4 for Na+[AlO4]− i.e., when the overall amount of network-forming units did not change. With increasing phosphate content, by contrast, this correlation was not observed, most likely because the overall amount of network-forming units increased, as NaAlO2 was replaced by P2O5. However, to really test whether the overall ratio of network formers to network modifiers correlates with ν, one would need to test over a much wider range of glass compositions.
Young's moduli calculated using the Makishima-Mackenzie model showed a comparable trend to the experimental values (Figure 8), although the calculated values were lower than the experimental ones. The relatively good agreement in trend highlights that, despite its simplicity, the model provides a useful estimate of elastic properties. This is in agreement with an earlier study of the model on simple silicate, borate and phosphate glasses (Inaba et al., 1999). The deviation between experimental and model values may be caused by various factors.
First of all, the Makishima-Mackenzie model assumes that all elements in the glass have the same coordination as in their corresponding oxide components. This is not true for aluminum which should be present mainly in fourfold coordination in the studied metaluminous glasses, while the Makishima-Mackenzie calculation is based on the dissociation energy of Al2O3, in which aluminum is exclusively sixfold coordinated. The cation packing fraction of aluminum in fourfold and sixfold coordination is similar, yet the charge of Al3+ is shared among fewer oxygens in fourfold coordination (She et al., 2019). This is in agreement with early work by Sun (1947) suggesting that the dissociation energy of Al-O bonds is higher when Al is in fourfold coordination compared to sixfold coordination. Therefore, an adjustment of the model taking into account Al coordination may potentially yield larger calculated values of E, leading to better agreement with experimental data.
Secondly, the Makishima-Mackenzie model presents a mean-field approximation. Using quantitative data on the work of deformation and its comparison to predicted bulk modulus, it has recently been shown for a wide range of glassy materials that this is overly simplified (Sawamura and Wondraczek, 2018). Instead, the mechanical response of glasses is strongly dependent on their respective structural heterogeneity (Benzine et al., 2018).
Another shortcoming of the Makishima-Mackenzie model is its implicit assumption that all bonds are bridging oxygen bonds. Neither non-bridging oxygen nor terminal oxygen are taken into account. Inaba et al. (1999) found this to affect the model values for phosphate glasses and successfully adjusted the model to take non-bridging oxygen atoms into account. However, in the present study the model underestimated the experimental values. An adjustment of the model to include non-bridging oxygens connected to phosphate groups would further decrease the calculated moduli, leading to even higher deviation from experimental values.
A further factor influencing the moduli may be bonds between mixed network-forming units, such as Al-O-P bonds, which are not taken into account by the Makishima-Mackenzie model either. A comparison between the molar heats of formation of AlPO4 (−1733.8 kJ/mol, only Al-O-P bonds) and Al2O3 (−1675.7 kJ/mol, only Al-O-Al bonds) (Lide, 2006) suggests that mixed bonds are stronger than non-mixed ones. This may partially explain why experimental moduli are higher than the calculated ones. An adjustment of the model to take mixed bonds into account would require detailed knowledge of the glass structure, however, to determine the relative amount of each type of bond.
A minor contribution to the deviation between model and experimental data may also result from actual glass composition slightly deviating from the nominal values used in the model. Furthermore, ionic radii used for the calculation of packing density were found to have a major influence on the results of the Makishima-Mackenzie model. For example, the two different sets of “effective ionic radii” and “crystal radii” provided by Shannon (1976) led to differences of more than 10 GPa in the calculated moduli. For this reason, the effective ionic radii used here were chosen as they yielded the best agreement with experimental data.
The decrease in hardness with increasing phosphate content can be explained by lower network polymerization, caused by P2O5 incorporation. The constant hardness for increasing silica content may be explained by constant network polymerization upon substitution of SiO4 for Na+[AlO4]− tetrahedra.
Lönnroth and Yue (2009) have noted a weak correlation between hardness and density in peralkaline aluminosilicate glasses. Results here showed a correlation of hardness with packing density (Makishima and Mackenzie, 1973) with increasing P2O5 content but not with increasing SiO2 content. Instead, the constant hardness with increasing silica content could be related to the constant molar volume (Figures 4D, 9B,D). The decreasing hardness with increasing P2O5 content (Figures 9A,C) was accompanied by increasing molar volume, indicating a relationship between large molar volume and low hardness for the present system. A similar decrease in hardness with increasing phosphate content up to more than 8 mol% has been reported for basaltic glasses (Tarragó et al., 2018b). Zeng et al. (2016) found hardness values between 5 and 5.5 GPa for peralkaline glasses with 5 mol% P2O5. This range agrees with the Vickers hardness of most phosphate-containing glasses presented here. The hardness values found for the phosphate-free glasses (6 to 6.3 GPa for microindentation) are in good agreement with a value of about 6 GPa reported by Tiegel et al. (2015) for a glass of the Si60P0 composition. Other literature hardness values of metaluminous glasses with various alkaline constituents ranged from 5.6 to 7.4 GPa (Smedskjaer et al., 2013; Tiegel et al., 2015; Bechgaard et al., 2016).
To estimate the error of the crack resistance, a method was developed here based on the PCI error bars. In Figure 1, PCI error bars represent the 95% confidence interval after evaluation of 25 indentations (up to 100 potential median-radial cracks) per load. The error of the crack resistance has to be found in the load dimension (horizontal axis). Therefore, the end points of the PCI error bars (blue triangles) were connected by linear segments to create an estimated error envelope of the PCI (red lines in Figure 1). This error envelope intersects the 50% PCI line at two loads above and below the crack resistance, generating two horizontal error bars (not shown) of different length (because of logarithmic axis). The larger error bar out of the two was chosen as the estimated error of the crack resistance.
The slight increase in crack resistance with increasing silica content in phosphate-free glasses (Figure 10B) confirms previous findings available in the literature (Gross et al., 2009; Hermansen et al., 2013). Bechgaard et al. (2016) have recently reported crack resistances between 1 and 3 N for a glass of Si50P0 composition. This agrees with the value found here (3.1 ± 0.5 N). For metaluminous calcium aluminosilicate glasses with SiO2 content increasing from 60 to 80 mol%, Gross et al. found an increase in crack resistance with values comparable to those obtained in this study (Gross et al., 2009). However, for >80 mol% SiO2, this trend is reverted as cracking changed to silica-like anomalous behavior with different crack systems becoming active. Up to now, there is no literature data available on the crack resistance of phospho-aluminosilicate glasses.
Higher crack resistances have previously been linked to higher silica content in the case of soda-lime silicate glasses (Hermansen et al., 2013), indicating the influence of network polymerization. For phosphate-free sodium aluminosilicate glasses, on the other hand, crack resistance was reported to decrease when increasing the Al/Na ratio from 0 to 1 (Bechgaard et al., 2016), even though this means approaching metaluminous composition and thus increasing polymerisation.
The range of data scattering observed for increasing phosphate content (Figure 10A) is similar to the range spanned by the crack resistance trends for increasing silica content (Figure 10B). Therefore, the apparent trends in Figure 10B may be coincidental and will not be discussed further.
To increase reliability of crack resistance measurements, an even higher number of indentations would be needed to improve statistics. Also, atmospheric humidity may affect the measurements and should be avoided by measuring under protective atmosphere or in vacuum.
Changes in the low frequency Raman region have been correlated with bond angle changes and thus with density changes (Galeener, 1979; Rouxel et al., 2008; Deschamps et al., 2011; Cornet et al., 2017). In case of densification, this region shifts toward higher wavenumbers; however, the theoretical basis for this correlation has only been strictly defined for one-component glasses such as vitreous silica (Sen and Thorpe, 1977; Galeener, 1979). The phospho-aluminosilicate glasses studied here carry three different network formers, all of them possessing different Raman scattering cross-sections. This may influence the spectral shifts to a currently unpredictable degree. Even so, in the past the analysis of densification with Raman spectroscopy has not only been exercised on vitreous silica (Kailer et al., 1999; Hehlen, 2010; Cornet et al., 2017), but also on soda-lime silicate glasses (Deschamps et al., 2011; Kassir-Bodon et al., 2012), borosilicate glasses (Winterstein-Beckmann et al., 2014) and aluminosilicate glasses (Poe et al., 2001; Bechgaard et al., 2016). All of these studies correlated changes of the low frequency Raman region with densification. Even the studies on borosilicate and aluminosilicate glasses have not tackled the issue of having more than one network former. Instead, a phenomenological approach has been chosen for these glass systems. As long as silica remained the main network former, the shape of the low frequency Raman envelope was close enough to that of vitreous silica to assume similar behavior. The same assumption will be considered valid for the phospho-aluminosilicate glasses studied here, because of their high degree of polymerisation and the clearly observable changes of the low frequency Raman region upon indentation.
Changes in the medium frequency region [Raman band at 700 cm−1 in Figure 2, assigned to [AlO4]− stretching (Iwamoto et al., 1978; McMillan and Piriou, 1982; Kamitsos et al., 1994)] were not taken into account here. This band would be affected by a change of Al coordination, but there was no reason to assume such a coordination change in the present metaluminous glasses. The formation of higher-coordinated aluminum upon compression is likely for peralkaline compositions but not for metaluminous ones (Hochella and Brown, 1985; Bechgaard et al., 2016). Instead, a weak intensity increase in the medium frequency region upon densification is assumed to be caused by partial overlap with the low frequency bands.
When analyzing densification by Raman spectroscopy, a comparison between the baseline method by Deschamps et al. (2011) and the Long data reduction seemed worthwhile since the use of the Long data reduction is popular in Raman analysis of glasses, yet changes markedly the shape of the low frequency Raman region (Seifert et al., 1982; Neuville and Mysen, 1996; Mysen, 1999; Mysen and Toplis, 2007; Le Losq and Neuville, 2013; Neuville et al., 2014; Rabia et al., 2016). Thus, the comparison allowed to test whether the Long data reduction affected the densification analysis. Concluding from the good agreement between the two tested post-processing routes (open and filled symbols in Figures 10C,D), different ways of determining the COG shift may still lead to comparable results regarding densification. Both tested post-processing routes may be regarded as equally applicable.
Raman spectroscopy allowed to track differences in densification between the different compositions, based on different COG shifts. The increasing COG shift upon phosphate incorporation in glasses with 60 mol% SiO2 (Figure 10C) indicates higher densification upon indentation. This may be explained by the lower density of the phosphate-containing glasses (Figure 4). When equally loaded, a less densely packed glass should be more readily densified than a densely packed one. The maximum trend of the COG shift with increasing P2O5 content (Figure 10C) may be related to increasing glass depolymerisation upon increasing P2O5 content. As shown by Bechgaard et al. (2016), the degree of polymerisation may affect the deformation mechanism of aluminosilicate glasses.
The increasing COG shift with increasing silica content (Figure 10D) may be explained by the lower packing density of the high-silica glasses. The apparent non-linearity of this trend may potentially be caused by underlying changes of the deformation mechanism. The slightly higher values of Poisson's ratio for the glasses with lower silica content (Figures 6, 7) support a lower degree of densification and a higher degree of shearing for the low-silica glasses, following Sellappan et al. (2013).
The transformation of COG shifts into absolute values of densification is established for vitreous silica (Deschamps et al., 2013) and soda-lime silicate glass (Deschamps et al., 2011) only. For more complex glass systems such as the given phospho-aluminosilicate glass series no direct correlation is available in the literature. In the present study the degree of densification was estimated using FEA for the 60 mol% SiO2 glass series and a maximum indentation densification of 5.88 ± 1.39% was observed (Figure 11). The FEA input is strongly linked to Poisson's ratio, which is almost constant around 0.22 for the 60 mol% SiO2 glass series (Figure 5). Therefore, the FEA approach does not exhibit the precision to reproduce the compositional influences as they have been found for the COG shift in the given test series. Both approaches should be considered together. The sensitive COG shifts provide insight into how compositional changes lead to relative differences in densification upon indentation. FEA provides a rough idea of the absolute level of indentation densification on which those changes take place.
Raman signal is gathered not only from the sample surface but also from below, where densification is lower (Figure 11) (Bruns et al., 2020). COG shifts therefore correspond to a densification averaged over signal depth. Compositional trends of COG shift should not be affected by this because indent size, load, and Raman depth of field were roughly equal for all samples.
All strain-rate sensitivities found here fit well within the relationship between strain-rate sensitivity and Poisson's ratio for glasses shown by Limbach et al. (2014). The strain-rate sensitivities ranged from 0.012 to 0.018 for values of ν between 0.20 and 0.24, agreeing with similar values for soda-lime silicate glasses (Limbach et al., 2014, 2017). These strain-rate sensitivities are rather low, yet common over many different glass systems (Limbach et al., 2014). The slightly increasing strain-rate sensitivity for increasing phosphate content (Figure 10E) may potentially be explained by the decreasing packing density and network polymerisation upon phosphate incorporation. Both trends should account for more free volume within the glass. This additional free volume together with the lower degree of cross-linking may facilitate local structural rearrangements when subjected to sudden changes in strain-rate. Nevertheless, a complete structural explanation of the increased strain-rate sensitivity has to be more complex. For increasing silica content, the results show no correlation between strain-rate sensitivity and density. Here, the non-linearity of strain-rate sensitivity correlates with no other property. A tentative structural hint may be obtained from metaluminous minerals of stoichiometry comparable to that of the phosphate-free glasses. Glass Si50P0 has the same stoichiometric composition as the mineral nepheline (NaAlSiO4). The composition of glass Si60P0 lies between nepheline and jadeite (NaAlSi2O6), the latter corresponding to 66.67 mol% SiO2. The composition of glass Si70P0 lies between jadeite and albite (NaAlSi3O8), with albite corresponding to 75 mol% SiO2. The crystal structures of nepheline, jadeite and albite are hexagonal, monoclinic and triclinic, respectively, see e.g., the RRUFF mineral database, entries R040025.1, R050220 and R040068.1 (Lafuente et al., 2015). Potentially, the maximum in strain-rate sensitivity upon increasing silica content may correspond to an underlying change within the glasses' medium-range structure which bears similarities to the change of the corresponding crystal structure. However, this is a mere hypothesis and requires further study.
This work has reported the synthesis and study of mechanical properties of glasses in the metaluminous (Al:Na = 1) system SiO2-Al2O3-Na2O-P2O5. The incorporation of phosphate into such aluminosilicate glasses by substituting P2O5 for NaAlO2 resulted in decreasing packing density. A simultaneous decrease in hardness and elastic moduli and increase in strain-rate sensitivity could be attributed to this packing density decrease, and to depolymerisation of the glass network.
Regarding glass densification upon indentation, glasses with lower initial density showed higher shifts of the correlated Raman spectral region, indicating higher densification. The results were non-linear over glass composition, which was tentatively attributed to a change in deformation mechanism.
Variation of the silica content by substituting SiO4 for Na+[AlO4]− tetrahedra was assumed to maintain nearly constant network polymerisation. This was supported by constant hardness. Simultaneous changes in elastic moduli correlated with packing density, while changes in Poisson's ratio were small. Only in case of increasing SiO2 content they could be correlated with packing density changes.
Taken together, the findings of this first comprehensive mechanical analysis of metaluminous phospho-aluminosilicate glasses provides a basis for tailoring mechanical properties by simply varying the P2O5 or SiO2 content. Non-linearities found in densification and strain-rate sensitivity hint toward more complex changes in glass structure, opening up possibilities for further study of the interplay between the three network formers.
The datasets generated for this study are available on request to the corresponding author.
TG, DB, LvW, and DL designed the glass series and the experiments. TG synthesized the samples, performed density, microindentation and Raman spectroscopy experiments, contributed to Makishima-Mackenzie calculations, analyzed and interpreted the results, and wrote the manuscript. RL performed nanoindentation and ultrasonic echometry measurements and contributed to Makishima-Mackenzie calculations, interpretation of mechanical properties, and writing of the manuscript. SB performed the FEA analysis and contributed to the interpretation of glass densification and to writing the corresponding part of the manuscript. LvW, DL, EK, KD, LW, and DB contributed to the interpretation of the results and writing of the manuscript.
Financial support by the German Research Foundation (DFG project SPP 1594) is gratefully acknowledged. We also acknowledge financial support for open access publishing by the German Research Foundation and the Publication Fund of the Thueringer Universitaets- und Landesbibliothek Jena (project number 433052568).
The authors declare that the research was conducted in the absence of any commercial or financial relationships that could be construed as a potential conflict of interest.
We would like to thank Alexander Veber (formerly Friedrich Alexander University Erlangen-Nürnberg) for Brillouin measurements, Johannes Buchheim (Institute of Technical and Environmental Chemistry, Friedrich Schiller University Jena) as well as Detlef Schelle (Institute of Applied Physics, Friedrich Schiller University Jena) for EDX measurements, Timothy Oshiobughie Imogore (Friedrich Schiller University Jena) for implementing the center of gravity calculation into MATLAB, Tadiyos Tarekegn Alemayehu (formerly Friedrich Schiller University Jena) for assistance with crack resistance measurements and two reviewers for their valuable comments. The majority of data shown here, with exception of the Makishima-Mackenzie calculations and the FEA simulation of densification, was published in TG's Ph.D. thesis (Grammes, 2020).
Barz, A., Haase, T., Meyer, K., and Stachel, D. (1996). Corrosion of crucible materials and their influence on structure of phosphate glasses. Phosphorus Res. Bull. 6, 331–336. doi: 10.3363/prb1992.6.0_331
Bechgaard, T., Goel, A., Youngman, R., Mauro, J., Rzoska, S., Bockowski, M., et al. (2016). Structure and mechanical properties of compressed sodium aluminosilicate glasses: role of non-bridging oxygens. J. Non Crystal. Solids 441, 49–57. doi: 10.1016/j.jnoncrysol.2016.03.011
Bellot-Gurlet, L., Le Bourdonnec, F.-X., Poupeau, G., and Dubernet, S. (2004). Raman micro-spectroscopy of western Mediterranean obsidian glass: one step towards provenance studies? J. Raman Spectr. 35, 671–677. doi: 10.1002/jrs.1195
Benzine, O., Bruns, S., Pan, Z., Durst, K., and Wondraczek, L. (2018). Local deformation of glasses is mediated by rigidity fluctuation on nanometer scale. Adv. Sci. 5:1800916. doi: 10.1002/advs.201800916
Bertmer, M., Züchner, L., Chan, J., and Eckert, H. (2000). Short and medium range order in sodium aluminoborate glasses. 2. site connectivities and cation distributions studied by rotational echo double resonance NMR spectroscopy. J. Phys. Chem. B 104, 6541–6553. doi: 10.1021/jp9941918
Botev, M., Betchev, H., Bikiaris, D., and Panayiotou, C. (1999). Mechanical properties and viscoelastic behavior of basalt fiber-reinforced polypropylene. J. Appl. Polymer Sci. 74, 523–531. doi: 10.1002/(SICI)1097-4628(19991017)74:3<523::AID-APP7>3.0.CO
Brow, R., Kirkpatrick, R., and Turner, G. (1993). Nature of alumina in phosphate glass: ii, structure of sodium aluminophosphate glass. J. Am. Ceramic Soc. 76, 919–928. doi: 10.1111/j.1151-2916.1993.tb05316.x
Bruns, S., Johanns, K., Rehman, H., Pharr, G., and Durst, K. (2017). Constitutive modeling of indentation cracking in fused silica. J. Am. Ceramic Soc. 100, 1928–1940. doi: 10.1111/jace.14734
Bruns, S., Uesbeck, T., Fuhrmann, S., Tarragó, M., Wondraczek, L., De Ligny, D., et al. (2020). Indentation densification of fused silica assessed by Raman spectroscopy and constitutive finite element analysis. J. Am. Ceramic Soc. 103, 3076–3088. doi: 10.1111/jace.17024
Cann, J., and Renfrew, C. (1964). The Characterization of Obsidian and its application to the Mediterranean region. Proceedings of the Prehistoric Society 30, 111–133. doi: 10.1017/S0079497X00015097
Cornet, A., Martinez, V., De Ligny, D., Champagnon, B., and Martinet, C. (2017). Relaxation of densified silica glass. J. Chem. Phys. 146, 094504. doi: 10.1063/1.4977036
Deschamps, T., Kassir-Bodon, A., Sonneville, C., Margueritat, J., Martinet, C., De Ligny, D., et al. (2013). Permanent densification of compressed silica glass: a Raman-density calibration curve. J. Phys. Cond. Matter. 25:025402. doi: 10.1088/0953-8984/25/2/025402
Deschamps, T., Martinet, C., Bruneel, J. L., and Champagnon, B. (2011). Soda-lime silicate glass under hydrostatic pressure and indentation: a micro-Raman study. J. Phys. Cond. Matter. 23:035402. doi: 10.1088/0953-8984/23/3/035402
Dibenedetto, A. (2001). Tailoring of interfaces in glass fiber reinforced polymer and composites: a review. Mater. Sci. Eng. A 302, 74–82. doi: 10.1016/S0921-5093(00)01357-5
Duffy, J. A. (1990). Bonding, Energy Levels & Bands in inorganic Solids. London, UK: Longman Scientific & Technical.
Dupree, R., Holland, D., and Mortuza, M. (1988). The role of small amounts of P2O5 in the structure of alkali disilicate glasses. Phys. Chem. Glass. 29, 18–21.
Ericson, J., Makishima, A., Mackenzie, J., and Berger, R. (1975). Chemical and Physical Properties of Obsidian: A Naturally Occurring Glass. J. Non Crystal. Solids 17, 129–142. doi: 10.1016/0022-3093(75)90120-9
Fredholm, Y., Karpukhina, N., Law, R., and Hill, R. (2010). Strontium containing bioactive glasses: Glass structure and physical properties. J. Non Crystal. Solids 356, 2546–2551. doi: 10.1016/j.jnoncrysol.2010.06.078
Galeener, F. (1979). Band limits and the vibrational spectra of tetrahedral glasses. Phys. Rev. B 19, 4292–4297. doi: 10.1103/PhysRevB.19.4292
Gan, H., and Hess, P. C. (1992). Phosphate speciation in potassium aluminosilicate glasses. Am. Mineral. 77, 495–506.
Grammes, T. (2020). Structure and mechanical properties of aluminosilicate glasses (Dissertation), Friedrich Schiller University Jena, Jena, Germany.
Griebenow, K., Bragatto, C., Kamitsos, E., and Wondraczek, L. (2018). Mixed-modifier effect in alkaline earth metaphosphate glasses. J. Non Crystal. Solids 481, 447–456. doi: 10.1016/j.jnoncrysol.2017.11.041
Griffith, A. (1920). The Phenomena of rupture and flow in solids. Phil. Trans. Roy. Soc. London A 221, 163–198. doi: 10.1098/rsta.1921.0006
Gross, T., Tomozawa, M., and Koike, A. (2009). A glass with high crack initiation load: Role of fictive temperature-independent mechanical properties. J. Non Crystal. Solids 355, 563–568. doi: 10.1016/j.jnoncrysol.2009.01.022
Hehlen, B. (2010). Inter-tetrahedra bond angle of permanently densified silicas extracted from their Raman spectra. J. Phys. Cond. Matter. 22:025401. doi: 10.1088/0953-8984/22/2/025401
Hermansen, C., Matsuoka, J., Yoshida, S., Yamazaki, H., Kato, Y., and Yue, Y. (2013). Densification and plastic deformation under microindentation in silicate glasses and the relation to hardness and crack resistance. J. Non Crystal. Solids 364, 40–43. doi: 10.1016/j.jnoncrysol.2012.12.047
Hochella, M., and Brown, Jr., G. (1985). The structures of albite and jadeite composition glasses quenched from high pressure. Geochimica et Cosmochimica Acta 49, 1137–1142. doi: 10.1016/0016-7037(85)90004-3
Inaba, S., Fujino, S., and Morigana, K. (1999). Young's Modulus and Compositional Parameters of Oxide Glasses. J. Am. Ceramic Soc. 82, 3501–3507. doi: 10.1111/j.1151-2916.1999.tb02272.x
Iwamoto, N., Tsunawaki, Y., Hattori, T., and Mitsuishi, A. (1978). Raman spectra of Na2O-SiO2-Al2O3 and K2O-SiO2-AI2O3 glasses. Phys. Chem. Glass. 19, 141–143.
Kailer, A., Nickel, K. G., and Gogotsi, Y. G. (1999). Raman microspectroscopy of nanocrystalline and amorphous phases in hardness indentations. J. Raman Spectr. 30, 939–946. doi: 10.1002/(SICI)1097-4555(199910)30:10<939::AID-JRS460>3.0.CO
Kamitsos, E., Kapoutsis, J., Jain, H., and Hsieh, C. (1994). Vibrational study of the role of trivalent ions in sodium trisilicate glass. J. Non Crystal. Solids 171, 31–45. doi: 10.1016/0022-3093(94)90030-2
Kassir-Bodon, A., Deschamps, T., Martinet, C., Champagnon, B., Teisseire, J., and Kermouche, G. (2012). Raman mapping of the indentation-induced densification of a soda-lime-silicate glass. Int. J. Appl. Glass Sci. 3, 29–35. doi: 10.1111/j.2041-1294.2012.00078.x
Kirkpatrick, R., and Brow, R. (1995). Nuclear magnetic resonance investigation of the structures of phosphate and phosphate-containing glasses: a review. Solid State Nuclear Magn. Reson. 5, 9–21. doi: 10.1016/0926-2040(95)00042-O
Kosinski, S., Krol, D., Duncan, T., Douglass, D., Macchesney, J., and Simpson, J. (1988). Raman and NMR Spectroscopy of SiO2 Glasses Co-Doped with Al2O3 and P2O5. J. Non Crystal. Solids 105, 45–52. doi: 10.1016/0022-3093(88)90336-5
Lafuente, B., Downs, R. T., Yang, H., and Stone, N. (2015). “The power of databases: the RRUFF project,” in Highlights in Mineralogical Crystallography, eds. T. Armbruster and R. M. Danisi (Berlin, DE: Walter De Gruyter GmbH), 1–30. doi: 10.1515/9783110417104-003
Le Losq, C., and Neuville, D. (2013). Effect of the Na/K mixing on the structure and the rheology of tectosilicate silica-rich melts. Chem. Geol. 346, 57–71. doi: 10.1016/j.chemgeo.2012.09.009
Limbach, R., Karlsson, S., Scannell, G., Mathew, R., Edén, M., and Wondraczek, L. (2017). The effect of TiO2 on the structure of Na2O-CaO-SiO2 glasses and its implications for thermal and mechanical properties. J. Non Crystal. Solids 471, 6–18. doi: 10.1016/j.jnoncrysol.2017.04.013
Limbach, R., Rodrigues, B., Möncke, D., and Wondraczek, L. (2015a). Elasticity, deformation and fracture of mixed fluoride-phosphate glasses. J. Non Crystal. Solids 430, 99–107. doi: 10.1016/j.jnoncrysol.2015.09.025
Limbach, R., Rodrigues, B., and Wondraczek, L. (2014). Strain-rate sensitivity of glasses. J. Non Crystal. Solids 404, 124–134. doi: 10.1016/j.jnoncrysol.2014.08.023
Limbach, R., Winterstein-Beckmann, A., Dellith, J., Möncke, D., and Wondraczek, L. (2015b). Plasticity, crack initiation and defect resistance in alkali-borosilicate glasses: from normal to anomalous behavior. J. Non Crystal. Solids 417–418, 15–27. doi: 10.1016/j.jnoncrysol.2015.02.019
London, D., Morgan Vi, G., Babb, H., and Loomis, J. (1993). Behavior and effects of phosphorus in the system Na2O-K2O-Al2O3-SiO2-P2O5-H2O at 200 MPa (H2O). Contrib. Mineral. Petrol. 113, 450–465. doi: 10.1007/BF00698315
Long, D. A. (2002). The Raman Effect: A Unified Treatment of the Theory of Raman Scattering by Molecules. West Sussex, UK: John Wiley & Sons Ltd. doi: 10.1002/0470845767
Lönnroth, N., and Yue, Y. (2009). Influence of chemical composition on the physical properties of basaltic glasses. Glass Technol. 50, 165–173.
Maier, V., Durst, K., Mueller, J., Backes, B., Höppel, H., and Göken, M. (2011). Nanoindentation strain-rate jump tests for determining the local strain-rate sensitivity in nanocrystalline Ni and ultrafine-grained Al. J. Mater. Res. 26, 1421–1430. doi: 10.1557/jmr.2011.156
Maier, V., Merle, B., Göken, M., and Durst, K. (2013). An improved long-term nanoindentation creep testing approach for studying the local deformation processes in nanocrystalline metals at room and elevated temperatures. J. Mater. Res. 28, 1177–1177. doi: 10.1557/jmr.2013.39
Makishima, A., and Mackenzie, J. (1973). Direct calculation of young's modulus of glass. J. Non Crystal. Solids 12, 35–45. doi: 10.1016/0022-3093(73)90053-7
Mandlule, A., Döhler, F., Van Wüllen, L., Kasuga, T., and Brauer, D. (2014). Changes in structure and thermal properties with phosphate content of ternary calcium sodium phosphate glasses. J. Non Crystal. Solids 392–393, 31–38. doi: 10.1016/j.jnoncrysol.2014.04.002
McMillan, P., and Piriou, B. (1982). The structures and vibrational spectra of crystals and glasses in the silica-alumina system. J. Non Crystal. Solids 53, 279–298. doi: 10.1016/0022-3093(82)90086-2
Mysen, B. (1998). Phosphorus solubility mechanisms in haplogranitic aluminosilicate glass and melt: Effect of temperature and aluminum content. Contrib. Mineral. Petrol. 133, 38–50. doi: 10.1007/s004100050435
Mysen, B. (1999). Structure and properties of magmatic liquids: From haplobasalt to haploandesite. Geochimica et Cosmochimica Acta 63, 95–112. doi: 10.1016/S0016-7037(98)00273-7
Mysen, B., and Toplis, M. (2007). Structural behavior of Al3+ in peralkaline, metaluminous, and peraluminous silicate melts and glasses at ambient pressure. Am. Mineral. 92, 933–946. doi: 10.2138/am.2007.2334
Neuville, D., De Ligny, D., and Henderson, G. (2014). Advances in Raman SPECTROSCOPY APPLIED TO EARTH AND MATERIAL SCIENCES. Rev. Mineral. Geochem. 78, 509–541. doi: 10.2138/rmg.2013.78.13
Neuville, D., and Mysen, B. (1996). Role of aluminium in the silicate network: in situ, high-temperature study of glasses and melts on the join SiO2-NaAlO2. Geochimica et Cosmochimica Acta 60, 1727–1737. doi: 10.1016/0016-7037(96)00049-X
Nizamutdinova, A., Uesbeck, T., Grammes, T., Brauer, D.S., and Van Wüllen, L. (2020). Structural role of phosphate in metaluminous sodium aluminosilicate glasses as studied by solid state NMR spectroscopy. J. Phys. Chem. B 124, 2691–2701. doi: 10.1021/acs.jpcb.9b11403
Nkurunziza, G., Debaiky, A., Cousin, P., and Benmokrane, B. (2005). Durability of GFRP bars: a critical review of the literature. Prog. Struc. Eng. Mater. 7, 194–209. doi: 10.1002/pse.205
Oliver, W., and Pharr, G. (1992). An improved technique for determining hardness and elastic modulus using load and displacement sensing indentation experiments. J. Mater. Res. 7, 1564–1583. doi: 10.1557/JMR.1992.1564
Palles, D., Konidakis, I., Varsamis, C., and Kamitsos, E. (2016). Vibrational spectroscopic and bond valence study of structure and bonding in Al2O3-containing AgI - AgPO3 glasses. RSC Adv. 6, 16697–16710. doi: 10.1039/C6RA00162A
Poe, B., Romano, C., Zotov, N., Cibin, G., and Marcelli, A. (2001). Compression mechanisms in aluminosilicate melts: Raman and XANES spectroscopy of glasses quenched from pressures up to 10 GPa. Chem. Geol. 174, 21–31. doi: 10.1016/S0009-2541(00)00304-1
Rabia, M., Degioanni, S., Martinet, C., Le Brusq, J., Champagnon, B., and Vouagner, D. (2016). A-thermal elastic behavior of silicate glasses. J. Phys. Cond. Matter. 28:075402. doi: 10.1088/0953-8984/28/7/075402
Ray, N. (1974). Composition-property relationships in inorganic oxide glasses. J. Non Crystal. Solids 15, 423–434. doi: 10.1016/0022-3093(74)90148-3
Rouxel, T. (2006). Elastic properties of glasses: a multiscale approach. Comptes Rendus Mécanique 334, 743–753. doi: 10.1016/j.crme.2006.08.001
Rouxel, T. (2007). Elastic properties and short-to medium-range order in glasses. J. Am. Ceramic Soc. 90, 3019–3039. doi: 10.1111/j.1551-2916.2007.01945.x
Rouxel, T., Ji, H., Hammouda, T., and Moréac, A. (2008). Poisson's ratio and the densification of glass under high pressure. Phys. Rev. Lett. 100:225501. doi: 10.1103/PhysRevLett.100.225501
Ryerson, F., and Hess, P. (1980). The role of P2O5 in silicate melts. Geochimica et Cosmochimica Acta 44, 611–624. doi: 10.1016/0016-7037(80)90253-7
Salmon, P., and Zeidler, A. (2015). Networks under pressure: the development of in situ high-pressure neutron diffraction for glassy and liquid materials. J. Phys. Cond. Matter. 27:133201. doi: 10.1088/0953-8984/27/13/133201
Sathishkumar, T., Satheeshkumar, S., and Naveen, J. (2014). Glass fiber-reinforced polymer composites - a review. J. Reinforced Plastics Composites 33, 1258–1275. doi: 10.1177/0731684414530790
Sawamura, S., and Wondraczek, L. (2018). Scratch hardness of glass. Phys. Rev. Mater. 2:092601. doi: 10.1103/PhysRevMaterials.2.092601
Sawangboon, N., Nizamutdinova, A., Uesbeck, T., Limbach, R., Meechoowas, E., Tapasa, K., et al. (2020). Modification of silicophosphate glass composition, structure and properties via crucible material and melting conditions. Int. J. Appl. Glass Sci. 11, 46–57. doi: 10.1111/ijag.13958
Seifert, F., Mysen, B., and Virgo, D. (1982). Three-dimensional network structure of quenched melts (glass) in the systems SiO2-NaAlO2, SiO2-CaAl2O4 and SiO2-MgAl2O4. Am. Mineral. 67, 696–717.
Sellappan, P., Rouxel, T., Celarie, F., Becker, E., Houizot, P., and Conradt, R. (2013). Composition dependence of indentation deformation and indentation cracking in glass. Acta Materialia 61, 5949–5965. doi: 10.1016/j.actamat.2013.06.034
Sen, P., and Thorpe, M. (1977). Phonons in AX2 glasses: From molecular to band-like modes. Phys. Rev. B 15, 4030–4038. doi: 10.1103/PhysRevB.15.4030
Shannon, R. (1976). Revised effective ionic radii and systematic studies of interatomic distances in halides and chalcogenides. Acta Crystallographica A 32, 751–767. doi: 10.1107/S0567739476001551
She, J., Sawamura, S., and Wondraczek, L. (2019). Scratch hardness of rare-earth substituted calcium aluminosilicate glasses. J. Non Crystal. Solids X 1:100010. doi: 10.1016/j.nocx.2019.100010
Smedskjaer, M., Mauro, J., Kjeldsen, J., and Yue, Y. (2013). Microscopic origins of compositional trends in aluminosilicate glass properties. J. Am. Ceramic Soc. 96, 1436–1443. doi: 10.1111/jace.12298
Smith, C., Brow, R., Montagne, L., and Revel, B. (2014). The structure and properties of zinc aluminophosphate glasses. J. Non Crystal. Solids 386, 105–114. doi: 10.1016/j.jnoncrysol.2013.11.042
Sonneville, C., Mermet, A., Champagnon, B., Martinet, C., Margueritat, J., De Ligny, D., Deschamps, T., and Balima, F. (2012). Progressive transformations of silica glass upon densification. J. Chem. Phys. 137, 124505. doi: 10.1063/1.4754601
Sun, K.-H. (1947). Fundamental Condition of Glass Formation. J. Am. Ceramic Soc. 30, 277–281. doi: 10.1111/j.1151-2916.1947.tb19654.x
Tabor, D. (1970). The hardness of solids. Rev. Phys. Technol. 1, 145–179. doi: 10.1088/0034-6683/1/3/I01
Tagiara, N., Palles, D., Simandiras, E., Psycharis, V., Kyritsis, A., and Kamitsos, E. (2017). Synthesis, thermal and structural properties of pure TeO2 glass and zinc-tellurite glasses. J. Non Crystal. Solids 457, 116–125. doi: 10.1016/j.jnoncrysol.2016.11.033
Tarragó, M., Esteves, H., Garcia-Valles, M., Martínez, S., and Neuville, D. (2018a). Effect of Ca in P-doped basaltic glass-ceramics: application to waste inertization. Mater. Lett. 220, 266–268. doi: 10.1016/j.matlet.2018.03.020
Tarragó, M., Garcia-Valles, M., Martínez, S., and Neuville, D. (2018b). Phosphorus solubility in basaltic glass: limitations for phosphorus immobilization in glass and glass-ceramics. J. Environ. Manag. 220, 54–64. doi: 10.1016/j.jenvman.2018.04.079
Tiegel, M., Hosseinabadi, R., Kuhn, S., Herrmann, A., and Rüssel, C. (2015). Young's modulus, vickers hardness and indentation fracture toughness of alumino silicate glasses. Ceramics Int. 41, 7267–7275. doi: 10.1016/j.ceramint.2015.01.144
Toplis, M., and Schaller, T. (1998). A MAS NMR study of glasses in the system xNa2O-(1-x)Al2O3-2SiO2-yP2O5. J. Non Crystal. Solids 224, 57–68. doi: 10.1016/S0022-3093(97)00458-4
Tylkowski, M., and Brauer, D. (2013). Mixed alkali effects in Bioglass® 45S5. J. Non Crystal. Solids 376, 175–181. doi: 10.1016/j.jnoncrysol.2013.05.039
Veber, A., Cicconi, M. R., Reinfelder, H., and De Ligny, D. (2018). Combined differential scanning calorimetry, Raman and brillouin spectroscopies: a multiscale approach for materials investigation. Analytica Chimica Acta 998, 37–44. doi: 10.1016/j.aca.2017.09.045
Weigel, C., Le Losq, C., Vialla, R., Dupas, C., Clément, S., Neuville, D. R., et al. (2016). Elastic moduli of XAlSiO4 aluminosilicate glasses: effects of charge-balancing cations. J. Non Crystal. Solids 447, 267–272. doi: 10.1016/j.jnoncrysol.2016.06.023
Whitfield, C., Brody, E., and Bassett, W. (1976). Elastic moduli of NaCl by Brillouin scattering at high pressure in a diamond anvil cell. Rev. Sci. Inst. 47, 942–947. doi: 10.1063/1.1134778
Winterstein-Beckmann, A., Möncke, D., Palles, D., Kamitsos, E., and Wondraczek, L. (2014). Raman spectroscopic study of structural changes induced by micro-indentation in low alkali borosilicate glasses. J. Non Crystal. Solids 401, 110–114. doi: 10.1016/j.jnoncrysol.2013.12.038
Wondraczek, L. (2019). Overcoming glass brittleness. Science 366, 804–805. doi: 10.1126/science.aaz2127
Wondraczek, L., Mauro, J., Eckert, J., Kühn, U., Horbach, J., Deubener, J., et al. (2011). Towards ultrastrong glasses. Adv. Mater. 23, 4578–4586. doi: 10.1002/adma.201102795
Zehnder, C., Bruns, S., Peltzer, J.-N., Durst, K., Korte-Kerzel, S., and Möncke, D. (2017). Influence of cooling rate on cracking and plastic deformation during impact and indentation of borosilicate glasses. Front. Mater. 4:5. doi: 10.3389/fmats.2017.00005
Zeidler, A., Salmon, P., and Skinner, L. (2014). Packing and the structural transformations in liquid and amorphous oxides from ambient to extreme conditions. Proceedings of the National Academy of Sciences of the United States of America 111, 10045–10048. doi: 10.1073/pnas.1405660111
Keywords: glass, mechanical properties, density, aluminosilicate, phosphate, elastic properties, hardness, densification
Citation: Grammes T, Limbach R, Bruns S, van Wüllen L, de Ligny D, Kamitsos EI, Durst K, Wondraczek L and Brauer DS (2020) Tailoring the Mechanical Properties of Metaluminous Aluminosilicate Glasses by Phosphate Incorporation. Front. Mater. 7:115. doi: 10.3389/fmats.2020.00115
Received: 10 January 2020; Accepted: 15 April 2020;
Published: 12 May 2020.
Edited by:
Ashutosh Goel, Rutgers, The State University of New Jersey, United StatesReviewed by:
Timothy Michael Gross, Corning Inc., United StatesCopyright © 2020 Grammes, Limbach, Bruns, van Wüllen, de Ligny, Kamitsos, Durst, Wondraczek and Brauer. This is an open-access article distributed under the terms of the Creative Commons Attribution License (CC BY). The use, distribution or reproduction in other forums is permitted, provided the original author(s) and the copyright owner(s) are credited and that the original publication in this journal is cited, in accordance with accepted academic practice. No use, distribution or reproduction is permitted which does not comply with these terms.
*Correspondence: Delia S. Brauer, ZGVsaWEuYnJhdWVyQHVuaS1qZW5hLmRl
Disclaimer: All claims expressed in this article are solely those of the authors and do not necessarily represent those of their affiliated organizations, or those of the publisher, the editors and the reviewers. Any product that may be evaluated in this article or claim that may be made by its manufacturer is not guaranteed or endorsed by the publisher.
Research integrity at Frontiers
Learn more about the work of our research integrity team to safeguard the quality of each article we publish.