
95% of researchers rate our articles as excellent or good
Learn more about the work of our research integrity team to safeguard the quality of each article we publish.
Find out more
ORIGINAL RESEARCH article
Front. Mater. , 31 March 2020
Sec. Smart Materials
Volume 7 - 2020 | https://doi.org/10.3389/fmats.2020.00068
This article is part of the Research Topic Smart Materials for Energy Conversion and Sensor Based Technologies View all 6 articles
 Theeazen AL-Gahouari1,2
 Gajanan Bodkhe1
 Pasha Sayyad1
 Nikesh Ingle1
 Manasi Mahadik1Sumedh M. Shirsat3Megha Deshmukh1Nadeem Musahwar2
 Mehendra Shirsat1*
The selectivity improvement of Electrochemically reduced Graphene Oxide–Multiwalled Carbon Nanotubes–L-cysteine (ErGO–MWNTs–L-cys) nanocomposite modified Glassy Carbon Electrode (GCE) using drop casting method for electrochemical detection of lead (Pb2+) ions was investigated. Initially, the graphene oxide–Multiwalled Carbon Nanotubes–L-cysteine (GO–MWNTs–L-cys) nanocomposite was synthesized by a facile and cost-effective method at room temperature. The as-prepared, GO–MWNTs–L-cys exhibited good stable aqueous dispersions due to high hydrophilic nature of GO components which led to inhibiting the hydrophobicity of MWNTs. Then, the electrochemical conductivity of ErGO–MWNTs–L-cys nanocomposite modified GCE (ErGO–MWNTs–L-cys/GCE) was improved by the direct electrochemical reduction of GO–MWNTs–L-cys nanocomposite. The GO–MWNTs–L-cys nanocomposites and its individual components were characterized by Attenuated Total Reflection Infrared (ATR-IR), Ultraviolet–visible spectroscopy, Raman spectroscopy, Atomic Force Microscopy, and X-ray diffraction (XRD). The synergistic effect of ErGO–MWNTs–L-cys nanocomposite was confirmed by Cyclic Voltammetry (CV) and Electric Impedance Spectroscopy (EIS) measurements in [Fe(CN)6]3−/4− redox. Experimental parameters, such as pH, accumulation time and electrochemical reduction degrees, were optimized. Under optimal conditions, the electrochemical performance of modified electrodes toward Pb2+ ions was examined and it exhibited appreciable improvement at the ErGO–MWNTs–L-cys/GCE. In terms of applications, Differential Pulse Anodic Stripping Voltammetry (DPASV) was employed for the determination of Pb2+ ions on ErGO–MWNTs–L-cys/GCE. The calibration plots between anodic current and Pb2+ ions exhibited linear relationship in the range of 0.2–40 μgL−1 with the detection limit calculated to be 0.1 μgL−1 (S/N = 3). Finally, the ErGO–MWNTs–L-cys/GCE showed satisfied selectivity and stable results, and the Relative Standard Deviation (RSD) was calculated to be (RSD = 2.15%).
Over the recent decade, the Heavy Metal Ions (HMIs) have been noticeably diffused into the environment from industrial activities such as electroplating, batteries, and geochemical mechanisms (Tinsley, 2004; Liu et al., 2011; Tiwari et al., 2011; Tongesayi et al., 2013; Adarakatti et al., 2017). Among the (HMIs), Pb2+ is of a great concern because of its severe risks to human health such as damaging human immune system, reproductive toxicity, respiratory disorders, negative effects on metabolism, and liver damage (Lee et al., 2007; Wang et al., 2007; Quang and Kim, 2010; Wan et al., 2010; Deshmukh et al., 2017a,b; Deshmukh et al., 2018a,b,c). Therefore, it is indigence to detect Pb2+ ions from aqueous media including excellent sensitive and simple detection method; with the aim of achieving the on-site, real-time and on-line determination of trace amounts of heavy metals.
There have been many sensitive and selective metal ion detection techniques used for detecting heavy metal ions, such as inductively coupled plasma atomic emission spectrometry, inductively coupled plasma mass spectrometry, atomic absorption spectrometry, atomic fluorescence spectrometry, surface enhanced Raman spectrometry, and electrochemical analysis technology (Grasso et al., 2009; Sanchez-Rodas et al., 2010; Koelmel and Amarasiriwardena, 2012; Siraj and Kitte, 2013; Massadeh et al., 2016; Lu et al., 2018). Although these techniques offer good sensitivity and selectivity toward metal ions, most of them require complicated procedures, expensive equipment, and specialized training. However, the electrochemical analysis has been referred to as an effective technique for the determination of HMIs due to its low operating cost high sensitivity, fast response, portable instrumentation, and low maintenance cost. Among the different electrochemical methods anodic stripping voltammetry (ASV) is considered the most suitable method for tracing metal analysis due to its short analysis time, high sensitivity, good selectivity, easy operation, etc. (de Souza et al., 2015).
Traditional hanging mercury drop (HMD) electrodes are considered most promising electrodes for the sensitive and selective detection of metal ions. Despite of its toxicity (HMD), electrodes have opened a door to the research community for new working electrodes achieving the friendly environment “green materials.” Usually, the problem of electrochemical analysis is associated with a small surface area of working electrodes. Therefore, the aim lies in choosing such material which overcomes this drawback. In fact, the nanostructure materials have been proposed as an efficient solution to overcome this problem due to its ability to enlarge the surface area for working electrodes. Currently, carbon nanomaterials have been regarded as the ideal materials for modifying working electrodes due to their improved electrical conductivity, low cost and high readily accessible surface area (Zhang et al., 2015). Especially, from carbon nanostructures, graphene and carbon nanotubes (CNTs) have been considered as excited allotropy materials in the electrochemical detection of (HMIs) due to reasonable porous structure, environmental safety, excellent conductivity, fast electron transfer rate, and physico-chemical properties (Kong et al., 2001; Zhao et al., 2002, 2012; Novoselov and Geim, 2007; Fowler et al., 2009; Dua et al., 2010). Ceren Göde et al. studied an incorporated calixarene and reduced graphene oxide composite for simultaneous determination of Fe3+, Cd2+, and Pb2+ ions with detection limit of 2.0 × 10⁻¹¹ and linear range of 1.0 × 10⁻¹⁰-1.0 × 10⁻⁸ M (Göde et al., 2017). Hwang et al. employed bismuth-modified carbon nanotubes electrode for the simultaneous detection of Zn2+, Cd2+, Pb2+ ions, with linear range of 2–100 μgL−1. The LOD was 1.3 μgL−1 for lead (Hwang et al., 2008). T. Priya et al. prepared nanocomposite of graphene oxide/K-carrageenan/L-cysteine for the simultaneous detection of Cd2+ and Pb2+, in the range from 5–50 nM for both Cd2+ and Pb2+ with the detection limits as 0.58 and 1.08 nM, respectively (Priya et al., 2018). Wang et al. applied amination-based GO for detection lead ions in aqueous media, with the limit down to 0.1 pM; however, the negativity lies in the toxicity of Hg that used in the enrichment step of heavy metal ions (Wang et al., 2011). Nadtinan Promphet et al. developed electrochemical sensor based on graphene/polyaniline/polystyrene nanoporous fiber modified screen-printed carbon electrode for simultaneous determination of Pb2+ and Cd2+ in the presence of bismuth (Bi3+). They suggested that the nanoporous fiber significantly improve the electrochemical sensitivity and graphene sheets improved the conductivity (Promphet et al., 2015). Xiaoyan Yuan et al. reported three-dimensional activated graphene networks-sulfonate-terminated polymer nanocomposite modified glassy carbon electrode (GCE) for the simultaneous determination of Cd2+ and Pb2+ in the presence of bismuth film. The result revealed linear response ranges of 1–70 μgL−1 for Cd2+ and 1–80 μgL−1 for Pb2+ with 0.1 μgL−1 and 0.2 μgL−1 LOD, respectively (Yuan et al., 2015). Jeffrey Morton et al. studied the trace of (HMIs) using CNTs functionalized covalently by cysteine. The detection limits were determined to be 1 and 15 ppb for Pb2+ and Cu2+, respectively (Morton et al., 2009).
In the wide synthesis range of graphene, the raw material is graphene oxide (GO) which bears a lot of electroactive oxygen containing functional groups with disorder on its basal planes and edges that decrease its conductivity. This causes significant effects on the graphene properties, resulting in lower values as compared to theoretical values (Zhao et al., 2011). CNTs also have drawbacks as its hydrophobic and surfactant dependent properties make it much complicated processing in composites. The inherent insolubility, thus greatly limits its integration in potential applications (O'connell et al., 2002; Dieckmann et al., 2003; Richard et al., 2003; Zheng et al., 2003). In fact, nanohybrid can often exhibit enhanced properties via combining the advantages of each component (Zhang and Wang, 2007; Xiao and Li, 2008; Yang et al., 2009). In order to overcome these problems, combining one-dimensional CNTs with two-dimensional graphene is worthwhile, which would provide a synergistic effect. Because GO sheets will act as best catalyst to disperse CNTs in water due to its hydrophilic property and CNTs will inhibit aggregation of GO sheets as a spacer due to its intimate reaction in sp2 hybridization of inherent material action (Zhang et al., 2010).
To the best of our knowledge there are few papers reported on the combination of CNTs and graphene for supper capacitors and biosensors, and very few papers that reported on the application of this combination for detection of Heavy Metal Ions (HMIs). One of them done by Hui Huang et al., where this hybrid was constructed with nafion film to enhance the stability for simultaneously detection of Pb2+ and Cd2+ in aqueous media in the presence of bismuth with linear range from 0.5 to 30 μgL−1 and low detection limit 0.2, 0.1 μgL−1 for Pb2+ and Cd2+, respectively, in the case of a deposition time of 180 s (Huang et al., 2014). However, adding of bismuth and nafion to this composite hid the real effect of the nanocomposite.
In this present work, we aimed to study the effect of L-cysteine on the novel nanocomposite of three-dimensional graphene oxide/carbon nanotubes hybrid to improve its selectivity toward the detection of Pb2+ ions in aqueous media. The L-cysteine has been chosen for this purpose due to its role as an amino acid which contains a thiol group with electroactive mercapto groups which provide affinity to many HMIs. Moreover, L-cysteine considered as antioxidant which easily bridges the GO sheets through the rich oxygen-containing functional groups in the GO–MWNTs–L-cysteine nanocomposite.
Graphite powder (60 mesh), MWNTs (purity: >95 wt.%; O.D.: 20–30 nm; length: 0.5–2 mm) and L-cysteine were purchased from Sigma–Aldrich. Working solutions containing Zn2+, Cd2+, Pb2+, Na+, K+, Mg2+, Fe3+, Co2+, Ca2+, , and Cu2+ ions were prepared from respective metal salts. A 0.1 M acetate buffer (HAc-NaAc) solution was prepared by mixing appropriate amount of CH3COOH and CH3COONa for adjusting pH = 3, 4.5, 6, 7.5, and 9 which served as a supporting electrolyte during the analysis of metal ions. DI water was used throughout the experiments. All other chemicals used were of analytical reagent grade, and were used without further purification.
A CHI660C electrochemical workstation was used to perform differential pulse anodic stripping voltammetry (DPASV), Cyclic Voltammetry (CV), and Electric Impedance Spectroscopy (EIS) in a three-electrode cell made of glass beaker. All potentials presented in this work were measured with respect to the SCE. High-purity nitrogen was used to remove the oxygen molecule from the solutions prior to each experiment. Non-Contact mode Atomic Force Microscopy (AFM; Park Systems; XE-7) was performed to examine a surface morphology of synthesized composite on the Si/SiO2 substrates. Raman spectrum was obtained with an AIRIX corp STR150 Raman, Japan (an argon ion laser λ = 532 nm). The spectroscopic study of the synthesized composite was carried out by using Fourier Attenuated Total Reflection Infrared (ATR-IR; Bruker ALPHA-T), Ultraviolet–visible (UV-vis) spectroscopy (JASCO V-750, Japan) and X-Ray Diffractometer (XRD; BRUKER D8 Advance).
Graphite oxide was synthesized by the improved Hummers' method (Marcano et al., 2010). In a typical process, a mixture of 120 mL of concentrated H2SO4 and 13.3 mL of concentrated H3PO4 (9:1 volume ratio) was prepared. The mixture of these acids was poured slowly into the mixture of 1 g graphite powder and 8 g potassium permanganate (1:8) in a circular bottom beaker under constant stirring by using a magnetic stirrer. The reaction was then heated to 40°C controlled by water bath and stirred for 12 h, vigorously. Then, the mixture was added into 400 mL of DI water to stop the reaction. After that 25 mL of H2O2 was added to the mixture to terminate the reaction. The addition of H2O2 resulted in yellow color, indicating high level of oxidation. The solution was further filtered to remove metal ions from the solution resulting in yellow color slurry. The yellow colored slurry was washed with 5% HCl solution using centrifuge until was removed completely which was tested by reagents such as barium chloride BaCl2. The supernatant was decanted away and the remaining solid material was collected. Then the mixture was purified multiple times with de-ionized water using centrifuge until the pH of the supernatant became neutral. Finally, the material was dried at 50°C for 24 h and a brown black material was obtained.
The segmentation and carboxylation of MWCNTs prepared by mixing it in concentrated acids media containing of HNO3 and H2SO4 with volume ratio of (1:3), respectively, for 4 h continuously, followed by filtering, rinsing with water, and drying in proper order (Jeykumari et al., 2007).
Prior to use, 0.5 mgmL−1 of MWNTs dispersed in DI water was prepared by ultrasonication for 2 h. Even so, the obtained dispersion was not stable since most of MWNTs were hydrophobic. 1.0 mgmL−1 of GO nanosheets was obtained by exfoliation of graphite oxides by using ultrasonication bath in DI water for 2 h (Kovtyukhova et al., 1999; Li et al., 2008). Afterwards, 10 mL of the prepared MWNTs were dispersed in 10 mL of the prepared GO hydrosol and mixed together ultrasonically for 2 h to obtain a 2:1 concentration ratio of GO: MWNTs hydrosol, respectively. The obtained mixture was further treated by using centrifugation for 30 min at 8,000 rpm to remove the unstabilized MWNTs. The obtained supernatant was consisting of the GO–MWNTs hybrid and the excess GO sheets. In order to remove the excess GO sheets, the centrifugation for 20 min at 14,000 rpm was used. Finally, the obtained sediment was washed by DI water twice and dried in vacuum oven at 50°C for 12 h to get stable nanocomposite.
For functionalizing GO–MWNTs hybrid by L-cysteine (L-cys), an 1 h ultrasonication was used to disperse 10 mg of the GO–MWNTs hybrid nanocomposites into a 5 M of HCl solution containing 0.1 M L-cys to produce 4:1 weight ratio of (GO–MWNTs:L-cys). Then, the mixture was stirred constantly for 1 h at 80°C. Once again, the GO–MWNTs–L-cys nanocomposites were centrifuged for 30 min at 14,000 rpm and the solution phase was discarded. The sediment has been repeatedly washed with DI by using centrifugation until the solution phase became neutral. Finally, the obtained GO–MWNTs–L-cys nanocomposites were dried in vacuum 80°C for 12 h.
Prior, a 10 mL suspension of GO–MWNTs–L-cys nanocomposites dispersed in DI water was sonicated for 1.5 h to produce 0.2 mgmL−1 of GO-MWNTs–L-cys colloids. A bare glassy carbon electrode (GCE) was smoothed with 1.0, 0.3, and 0.05 mm alumina slurry, respectively. Then, it was ultrasonicated by DI water, ethanol, and ultrapure water and dried by nitrogen stream in desiccator. An aliquot of 6 μL of the colloid was cast on the GCE surface, and then the solvent was dried in vacuum at room temperature with nitrogen ambient. In this way, the GO–MWNTs–L-cys/GCE was prepared. Similarly, for comparison, the GCEs modified by GO, MWNTs, and GO–MWNTs hybrid were prepared to get GO/GCE, MWNTs/GCE, and GO–MWNTs/GCE, respectively.
A three-electrode configuration was employed, consisting of GO–MWNTs–L-cys/GCE as a working electrode, Ag/AgCl containing 4 M KCl as a reference electrode and platinum wire as a counter electrode which were immersed in 50 mL of 0.1 M acetate buffer solution (pH 4.5) as a supporting electrolyte. All the solutions used for electrochemical experiments were deoxygenated by purging with pure nitrogen (99.99%) for 5 min prior to analysis. For (DPASV) test, a modified electrode (GO–MWNTs–L-cys/GCE) was immersed into the electrolyte containing metal ions under strong stirring to give a great chance of HMIs to concentrate at the modified electrode. The deposition potential was chosen as −1.2 V and the pre-accumulation time was 180 s. Prior to the next analysis, a preconditioning step with 60 s time period at 0.4 V in stirred solution was carried out to remove adsorbed residual metal ions from the surface of modified electrode. For the practical samples analysis, a 45 mL of electroplating effluent and 5 mL of 0.1 M acetate buffer (pH 4.5) were gently mixed and considered as the electrolytic solution (Huang et al., 2014).
ATR-IR analysis was used to investigate the functional groups and chemical bonding among the components in nanocomposite. Figure 1 shows ATR-IR spectra of functional MWNTs, GO, GO–MWNTs hybrid, and GO–MWNTs–L-cys nanocomposite. In this spectra, the common absorption band in all spectra are observed at 2,360 and 1,615 cm−1 which are related to CO2 stretch and aromatic C=C stretch groups, respectively. The aromatic group represents the skeletal vibrations of graphitic domains and CO2 stretch assigns to atmosphere conditions. The broad absorption band in the range between 3,000 and 3,600 cm−1 of GO spectra represents the bending vibration and stretching of –OH groups of water molecules which has been adsorbed on GO surface through synthesis procedures. This absorption band is totally absent in the MWNTs spectra, whereas it appears again in GO–MWNTs and GO–MWNTs–L-cys spectra, with relative decrease in its magnitude, respectively, due to the non-covalent reaction in the GO–MWNTs hybrid and the reduction process by L-cysteine. The absorption bands at 1,720, 1,360 and 1,050 cm−1 represent the stretching and vibration of carbonyl C=O, epoxy C–O stretch and alkoxy C–O stretch groups, respectively. In the same manner with –OH group, these groups decrease in the GO–MWNTs hybrid and GO–MWNTs–L-cys nanocomposite spectra due to the same reason. The FTIR results have provided additional information for the successful synthesis of GO–MWNTs–L-cys nanocomposite structure by confirming the existence of MWNTs in GO-MWNTs composite and reduction process in the presence of L-cysteine as reductant agent (Wang et al., 2007; Guo et al., 2009; Pham et al., 2011).
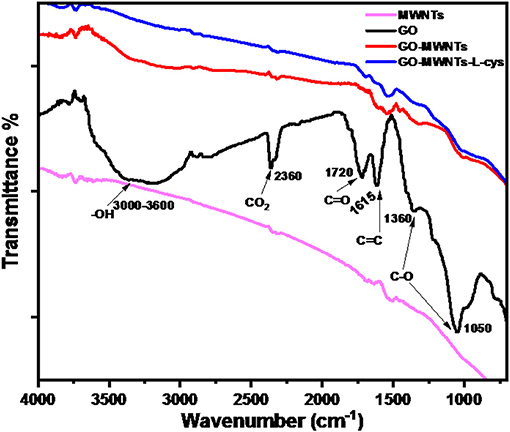
Figure 1. FTIR spectra of functional MWNTs, GO, GO–MWNTs, and GO–MWNTs–L-cys from down to up, respectively.
The UV–visible samples were prepared by dispersion of the same concentrations of GO, MWNTs, GO–MWNTs, and GO–MWNTs–L-cys in ethylene glycol with ratio of 0.2 mgmL−1, then ultrasonicated for 1 h and then the large particles were removed by centrifugation for 10 min at 800 rpm. Figure 2 shows the UV–visible absorption spectra of as-prepared GO, MWNTs, GO–MWNTs, and GO–MWNTs–L-cys dispersions. UV–vis spectroscopic measurements of GO dispersion display an strong absorption peak at 232 nm attributed to π → π* transition bonding of C=C aromatic rings, shoulder peak at 302 nm arising from n → π* transition of C-O bonds (Li et al., 2008; Marcano et al., 2010). The absorption peak of π → π* transition bonding of C=C in MWNTs spectra is at 252 nm due to the easy transitions of electrons within π-conjugation network on sidewalls of the MWNTs. This peak was shifted into the moderate path at GO–MWNTs spectra confirms the formation of the hybrid between the sidewalls of the MWNTs and multiple aromatic regions of GO sheets via the π-stacking non-covalent interactions (Zhang et al., 2010; Huang et al., 2014). While this hybrid functionalized by L-cysteine, the absorption peak of π → π* red-shifted to ~249 nm as shown in UV–vis spectra GO–MWNTs–L-cys. It implies that the aromatic structure of GO inside the GO–MWNTs–L-cys composite might be restored due to the L-cysteine (amino acid) which uses as a reductant agent for the preparation of reduced graphene oxide (Chen et al., 2011a).
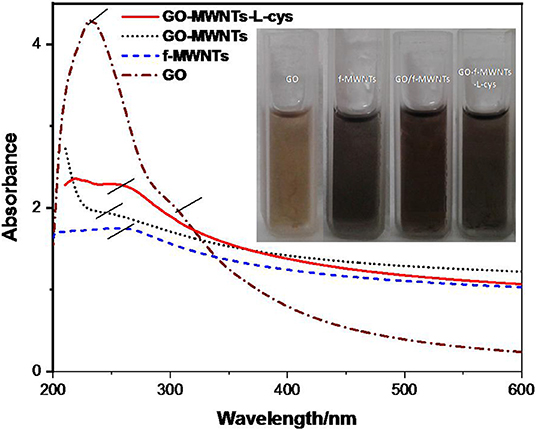
Figure 2. UV-vis spectra of GO, MWNTs, GO–MWNTs, and GO–MWNTs–L-cys. Inset represents the digital photo of these samples.
The changes in the color of these dispersions are a good indicator for incorporation and reduction processes of the composite. As shown in Figure 2 (inset), the yellow-brown and black colors of GO and MWNTs dispersion, respectively, gently mixed to make a dark brown color as in the GO–MWNTs dispersion. Finally, the color changed to black color at GO–MWNTs–L-cys dispersion due to the removal of oxygen from the GO–MWNTs when L-cysteine has been added.
Raman spectroscopy is an efficient tool to identify ordered and disordered crystal structure of a carbon. Here, we concerned about two important bands; those of G-band and D-band within sp2 hybridization in 2D carbon material. Figure 3 shows the characteristic peaks at 1,591 and 1,346 cm−1 corresponding to G- and D-band, respectively (Dong et al., 2011). The intensity ratios of characteristics peaks (ID/IG) are used to determine the degrees of disorder and the average size of sp2 domains. In this work, the intensity ratios of characteristics peaks (ID/IG) of GO, GO–MWNTs, and GO–MWNTs–L-cys films have been calculated to become (0.964, 0.980, and 0.975), respectively. The (ID/IG) of GO confirms the disordered in-plane sp2 due to presence of oxygen-containing functional groups, However, this disorder increase in GO–MWNTs hybrid indicated that, the MWNTs are effective as a spacer between the GO sheets which increase the average size of in-plane sp2 domains. Again, the (ID/IG) decreased markedly of the GO–MWNTs–L-cys nanocomposite indicated that the average size of in-plane sp2 decreased with relative less disordered, which could be explained that the partially removal of oxygen-containing functional groups results in a decrease in the average size of in-plane sp2 domain after L-cysteine treatments have been considered as a reductant agent (Tuinstra and Koenig, 1970).

Figure 3. Raman spectra of GO, GO–MWNTs, and GO–MWNTs–L-cys.
AFM is currently one of the foremost methods to identify the morphology of carbon nanomaterial structure. Figure 4 shows the AFM topography images of GO, functionalize MWNTs, and GO–MWNTs hybrid nanostructures. It can be seen that, the layers of GO and MWNTs films exhibit aggregations and accumulations led to a decrease in its conductivity as shown in Figures 4A,B, respectively. Though AFM topography image of GO–MWNTs hybrid nanostructure showed regulated and uniform distribution, as shown in Figure 4C, the result confirmed that the GO plays an important role in dispersing MWNTs which act as a good surfactant, in addition, the MWNTs act as a spacer between the GO sheets led to prevent the aggregations.
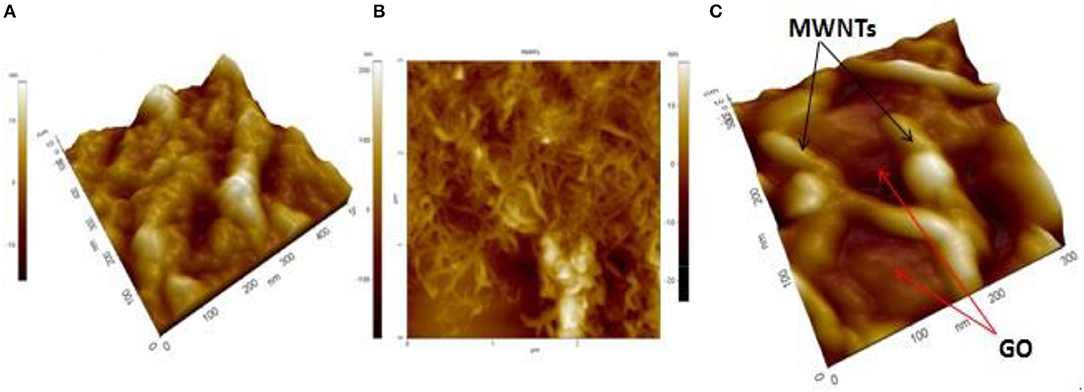
Figure 4. Non-contact mode AFM images of: (A) exfoliated GO, (B) functionalize MWNTs, and (C) GO–MWNTs hybrid deposit by drop casting on Si/SiO2 substrates.
The Powder XRD patterns of Pristine Graphite (P-Graphite), Pristine MWNTs (P-MWNTs), GO, functional MWNTs, GO–MWNTs, and GO–MWNTs–L-cys nanocomposite are displayed in Figure 5. As observed from this figure, the XRD patterns of P-Graphite and P-MWNTs showed a character diffraction peaks at 2θ = 26.57 and 26.16°, respectively, indexed to the (002) crystal plane with d-spacing of 0.335 and 0.341 nm, respectively. The small increasing in the d-spacing of P-MWNTs returns to the bending effect of the graphite sheets. However, in XRD pattern of GO, this diffraction peak of Graphite material has been shifted to 2θ = 10.80°, with extension in d-spacing of 0.819 nm due to the insertion of various oxygen-containing functional groups in the graphite structure. After Functionalization of MWNTs by acids treatments for cleaning and insolubility proposes, its XRD patterns show diffraction peak same that in the P-MWNTs pattern with a little decreasing in a grain size by considering (Scherrer equation) indicating that, the segmentation and carboxylation processes have taken place. The XRD patterns of GO–MWNTs hybrid showed a conservation of its individual diffraction peaks at 2θ = 9.77 and 26.16° for GO and MWNTs, respectively. A little extension in d-spacing of 0.905 nm of GO after mixing with MWNTs indicating that, the non-covalent interaction between functionalized MWNTs and GO sheets was affected through interlayer of the basal plane of GO sheets. The XRD patterns of GO–MWNTs–L-cys nanocomposite showed character diffraction peaks at 2θ = 10.78 and 26.01°, with d-spacing of 0.820 and 0.342 nm for GO and MWNTs, respectively. However, there were a little compression and extension in d-spacing of GO and MWNTS, respectively, in the GO–MWNTs–L-cys nanocomposite comparing with that in GO–MWNTs. This compression in d-spacing after adding L-cysteine to the composite is due to the effect of L-cysteine as reductant agent which removed the oxygen-containing functional groups partially from the edges of GO sheets. The extension in the d-spacing of MWNTs is also due to the strong interaction between thiol groups inside the L-cysteine and outer side of MWNTs which might lead to a little extension between the outer and inner sides of MWNTs.
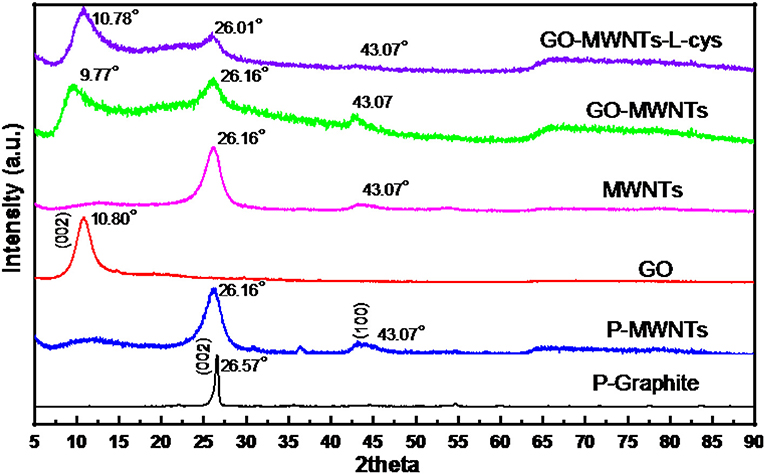
Figure 5. Powder XRD patterns of P-Graphite, P-MWNTs, functionalized MWNTs, GO, GO–MWNTs, and GO–MWNTs–L-cys (from down to up), respectively.
As prepared, GO–MWNTs–L-cys/GCE was reduced by carrying out repeated potential cycling within potential range between 0 and −1.7 V in the deoxygenized acetate (pH 4.5) buffer solution to produce the ErGO–MWNTs–L-cys (Jeykumari et al., 2007). The cyclic voltammetry (CV) of ErGO–MWNTs–L-cys showed a large reduction peak in the first potential scan at −1.2 V, as shown in Figure 6A. Moreover, for further subsegment cycles the reduction peak has been shifted toward more negative potentials indicating that the most of oxygen functional groups on the GO surface were removed during the first cycle. For comparison, a similar experiment has been performed by using a GO/GCE as shown in Figure 6B. However, the CV of GO/GCE showed a larger reduction peak in the first potential scan at −1.3 V and with less relatively reduction potential peaks difference comparing with that in ErGO–MWNTs–L-cys/GCE, which indicated that the Electrochemical reduction process of GO sheets needs relatively longer time compared with ErGO–MWNTs–L-cys nanocomposite, which almost achieved in the first cycle. A little remaining strong contact of oxygen-containing functional groups on the edge of graphene basal plan was reduced at drastically more negative potential. The results could be explained by saying that the CNTs don't only act as spacer between GO sheets to inhibit aggregation, but it also acts as conducting wires passed throw GO sheets which facilitate the reduction process of GO sheets.
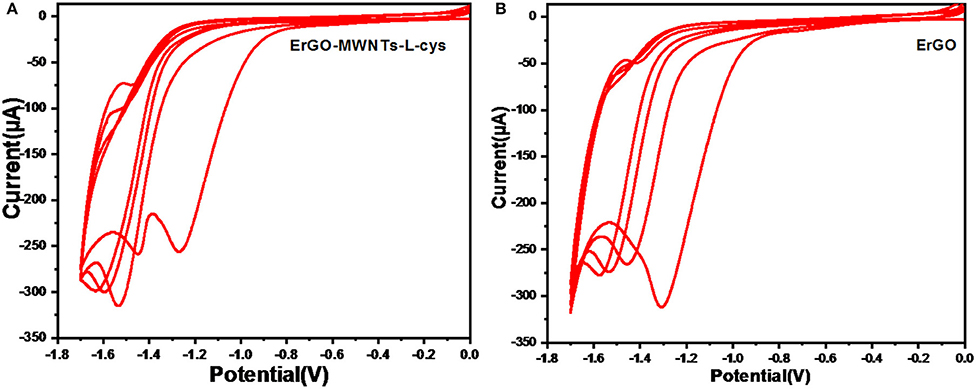
Figure 6. Cyclic Voltammograms (CVs) with 0.05 Vs−1 scan rate for the electrochemical reduction of GCE modified with: (A) GO–MWNTs–L-cys nanocomposite and (B) GO sheets; in 0.1 M acetate buffer solution (pH 4.5) saturated with nitrogen gas. The range is between 0 and −1.7 V.
The behavior of charge-transfer rate at the electrode/solution interface was explained by CV and Electric Impedance Spectroscopy EIS (Tang et al., 2009). In this work we compared the charge-transfer behavior of the bare GCE, GO/GCE, MWCNTs/GCE, GO–MWNTs/GCE, GO–MWNTs–L-cys/GCE, and ErGO-MWNTs-cys/GCE in 0.1 M KCl solution using a [Fe(CN)6]3−/4− couple as a redox probe system. Cyclic Voltammograms (CVs) of modified and bare GCE are shown in Figure 7A. Initially, the CV of the bare GCE showed a peak potential difference (ΔEP) 90 mV with ratio of 1:1 between anodic and cathodic peak currents. It can be considered as a quasi-reversible redox process. The CV of GO showed the decrease peak currents to a very low value because of the bad conductivity of GO. However, increase in the peak currents was observed with MWNTs/GCE due to the good conductivity of CNTs, but it does not exceed the peak currents of the bare GCE because of its aggregation nature. It also shows a broad redox peaks potential difference due to the binding of the analytes with its curvature surface led to a slow charge-transfer rate at the electrode/solution interface. The CV of GO–MWNTs/GCE showed quasi-reversible redox processes and fast charge-transfer rate which indicated that the enhancements took place when both of GO and MWNTs were mixed. Moreover, the GO–MWNTs hybrid showed the peak redox currents larger than that of GO/GCE and MWNTs/GCE CVs which indicated that the individually disadvantages treated led to large surface area. The CV of GO–MWNTs–L-cys/GCE showed little enhancements in terms of the charge-transfer rate and peak redox currents due to the removal of oxygen- containing functional groups from GO–MWNTs hybrid when L-cysteine was added. Finally, the CV of ErGO–MWNTs–L-cys/GCE showed extremely large redox peak currents and lower peak potential difference (ΔEP) as compared to others due to electrochemical reduction of the nanocomposite which was synergized. The reduction processes enhances the conductivity and surface area of the hybrid. These results showed excellent agreements with other characterizations.
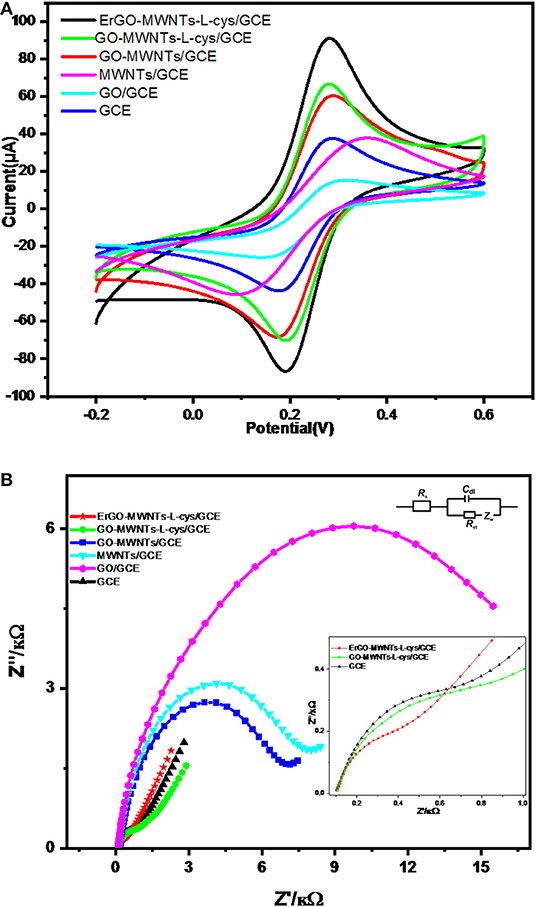
Figure 7. (A) CV and (B) EIS characterizations of bare GCE, GO/GCE, MWCNTs/GCE, GO–MWNTs/GCE, GO–MWNTs–L-cys/GCE, and ErGO-MWNTs-cys/GCE in 0.1 M KCl solution containing 5 mM [Fe(CN)6]3−/4− couple as a redox probe system. The parameters of CV and EIS are 0.5 Vs−1 scan rate repeated in the range between −0.2 and 0.6 V and frequency range from 0.1 to 105 Hz while applying 0.2 V AC amplitude, respectively. Inset: magnification plot of higher frequencies and equivalent electrical circuit used for fitting the impedance spectra.
EIS was used to monitor the electron transfer properties of these electrodes. The diameter of the semicircle in the EIS Nyquist plot represents the electron-transfer resistance Rct of the electrode/electrolyte (Chen et al., 2011b). Figure 7B shows the Nyquist plot obtained for the bare GCE, GO/GCE, MWCNTs/GCE, GO–MWNTs/GCE, GO–MWNTs–L-cys/GCE, and ErGO–MWNTs–L-cys/GCE at AC amplitude 0.2 V within the frequency range from 0.1 to 105 Hz. For fitting of impedance spectra data, A Randles circuit model [Rs+Cdl/(Rct+ZW)] was used. As shown in Figure 7B, the Rct values of the bare GCE, GO/GCE, MWCNTs/GCE, GO–MWNTs/GCE, GO–MWNTs–L-cys/GCE, and ErGO-MWNTs-cys/GCE are 0.77, 9.95, 7.47, 6.90, 1.46, and 0.41 kΩ, respectively. These results exhibited totally agreement with the CV characterizations in terms of charge transfer rate.
The influence of pH of acetate buffer solutions on the stripping signal was studied of the pH range from 3 to 9 by DPASV technique as shown in Figure 8A. It showed a significant impact of pH on current peaks and the maximum value of stripping signal was observed at pH = 4.5.
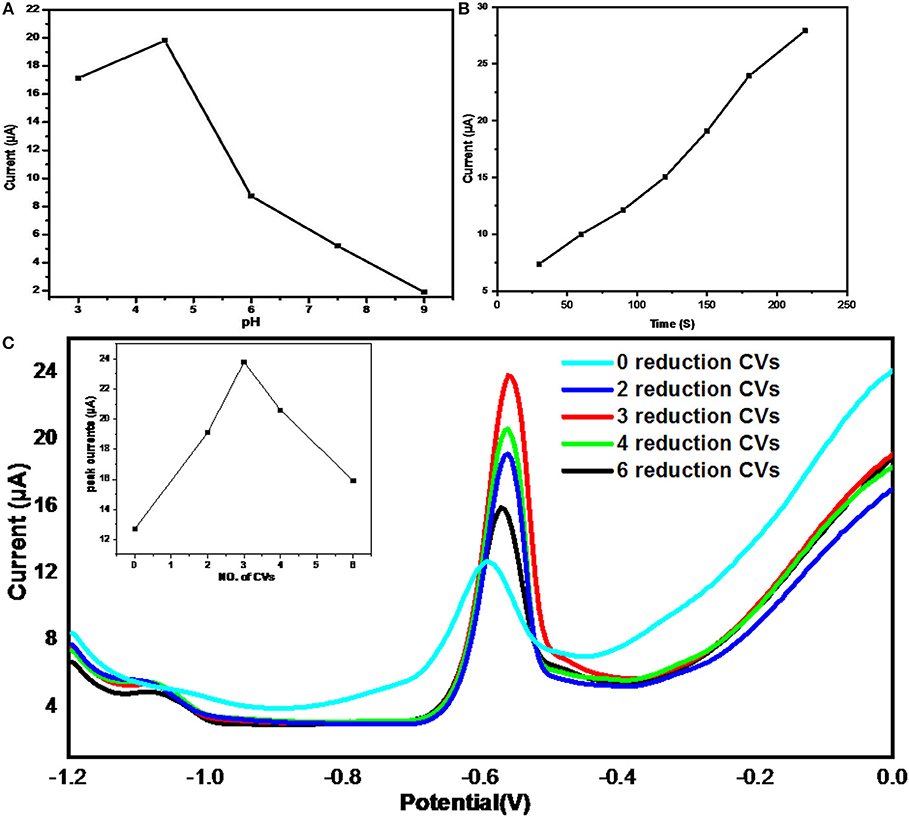
Figure 8. The effects of (A) solution pH, (B) accumulation time, and (C) Electrochemical reduction degrees; (inset shows the peak currents vs. No. of CVs); on the stripping currents of Pb2+ ions from ErGO–MWNTs–L-cys/GCEs in 0.1 M HAc-NaAc buffer solution containing 40 μgL−1 of Pb2+ saturated with nitrogen gas under optimal conditions.
The range of accumulation time was from 30 to 220 s which showed direct proportional effect with the current peaks as shown in Figure 8B. However, its slope started decreasing beyond 180 s, therefore, 180 s was chosen as accumulation time due to efficiency considerations.
The amount of oxygen-containing functional groups on the reduced graphene oxide sheets play important roles on its band gab, leading to controlling its properties like conductivity, insolubility, stability, and its ability of HMIs adsorption (Raj and John, 2013; Promphet et al., 2015).
The effect of electrochemical reduction degrees of GO–MWNTs–L-cys nanocomposites on the stripping signal were achieved by two steps. First step, four identical GCEs modified by GO–MWNTs–L-cys nanocomposite were electrochemically reduced by applying CV technique with 0, 3, 4, and 6 number of cycles in acetate buffer solution bubbled by pure NO2, respectively. Second step, the DPASVs of Four electrodes were performed in acetate buffer solution containing 40 μgL−1 of Pb2+ ions under the optimized conditions. The Figure 8C showed the stripping signals of Pb2+ ions from ErGO–MWNTs–L-cys/GCEs with different reduction degrees of (0, 3, 4, and 6 CVs). As observed in the Figure 7C, there were different stripping signal peak currents, it can be ordered from highest to lowest at ErGO–MWNTs–L-cys/GCEs have 3, 4, 2, 6, and 0 reduction CVs, respectively. Despite of the ErGO–MWNTs–L-cys/GCEs with 3 reduction CVs exhibited highest stripping signal, the ErGO–MWNTs–L-cys/GCEs with 4 reduction CVs has been selected for optimization conditions due to its short recovery time. A Reduction potential for Pb2+ ions has been directly selected as −1.2 V (Huang et al., 2014).
Here we have studied the stripping signal responses toward Pb2+ ions at the bare GCE (dot line), GO/GCE (red line), GO–MWNTs/GCE (green line), GO–MWNTs–L-cys/GCE (blue line), and ErGO–MWNTs–L-cys/GCE (brown line) in acetate buffer solution containing 50 μgL−1 Pb2+ ions by DPASV technique under optimal conditions, as shown in Figure 9. It can be seen that the voltammograms of ErGO–MWNTs–L-cys/GCE exhibited anodic peak current of Pb2+ ions higher than the one measured on the GO–MWNTs–L-cys/GCE (blue line), GO–MWNTs/GCE (green line), GO/GCE (red line) and bare GCE (dot line) by 1.4, 1.9, 3.2, and 2.7-fold, respectively, with well-defined peak shapes centered at −0.555 V. This data could be explained in similar manner of CV for the [Fe(CN)6]3−/4− standard redox couple shown in Figure 7A. This data confirm that the large surface area and excellent electrochemical conductivity of the ErGO–MWNTs–L-cys nanocomposite modified GCE lead to enhanced electrochemical sensitivity.
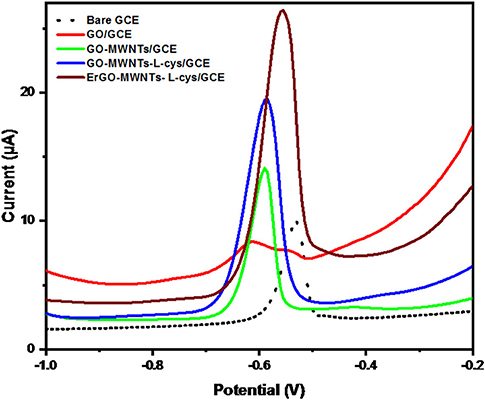
Figure 9. The DPASVs for 50 μgL−1 Pb2+ at the bare GCE (dot line), GO/GCE (red line), GO–MWNTs/GCE (green line), GO–MWNTs–L-cys/GCE (blue line), and ErGO–MWNTs–L-cys/GCE (brown line) under optimal conditions.
The sensing study of the ErGO–MWNTs–L-cys/GCE for determination of Pb2+ ions under optimal conditions has been evaluated. Figure 10, showed the voltammograms of DPASVs for Pb2+ ions with various concentrations in acetate buffer solutions. As shown in Figure 10 (inset) It can be seen that the anodic peak currents are direct proportional to the Pb2+ ions concentrations in the range from 40 μgL−1 to 0.2 μgL−1 represented in the regression equation of Ip = 0.422 C + 2.396 (IP: peak currents/μA, C: concentration/μgL−1) with the correlation coefficient of R = 0.990. The limit of detection (LOD) was calculated to be 0.1 μgL−1 by using [LOD = 3 sc/x] formula; where s is the standard deviation of the peak currents of the sample (10 times), c is the concentration of the sample here (0.2 μgL−1) was taken and x is the average value of the sample; which is lower than (10 μgL−1) that has recommended by World Health Organization for Pb2+ ions in drinking water (WHO, 2011).
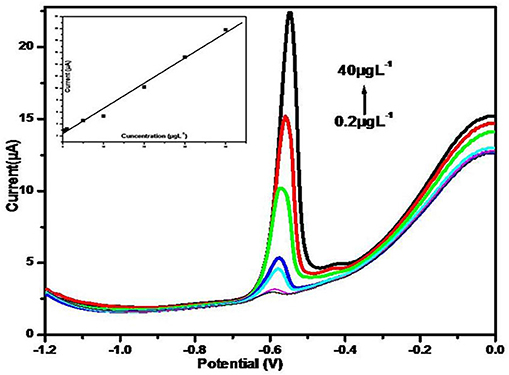
Figure 10. The DPASVs for various concentrations (0.2, 0.5, 1, 5, 10, 20, 30, and 40 μgL−1 from bottom to top) of Pb2+ ions on the ErGO–MWNTs–L-cys/GCE. Inset shows the calibration curve of the Pb2+ ions. Supporting electrolyte: 0.1 M acetate buffer (pH = 4.5) under optimal conditions.
In fact, the nafion enhances the stability of G/MWNTs hybrid as mentioned in literature (Huang et al., 2014), but it influences the sensitivity of composite due to diffusion limitations imposed by Nafion (Gouveia-Caridade et al., 2006). In this work, we avoided the effect of nafion film by choosing L-cysteine as computable legend and reductant agent leading to improved selectivity, stability, and electrochemical conductivity.
The study of the reproducibility and stability of ErGO–MWNTs–L-cys/GCEs was carried out in acetate buffer containing 40 μgL−1 of Pb2+ ions under optimized conditions. To investigate the reproducibility, four ErGO–MWNTs–L-cys nanocomposite modified GCEs were prepared with identical procedures. The relative standard deviations (RSD) for these electrodes were calculated to be 2.15% as shown in Figure 11A. Moreover, the modified electrode was kept for 17 days at room temperature for stability study and there was no significant change observed in the stripping signals when they were compared with fresh electrode. These results showed that the ErGO–MWNTs–L-cys nanocomposites modified electrodes have excellent life time with good stability which could be explained by the affect of L-cysteine and Electrochemical reduction which removed the weak oxygen-containing functional groups from the basal plane and only the strong functional groups and amino groups on its edges remained.
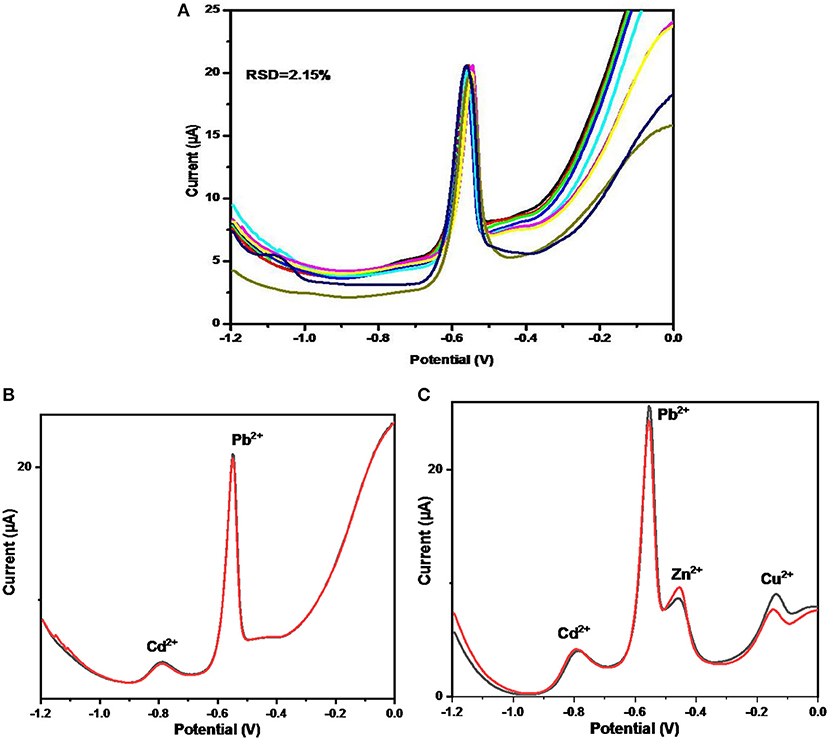
Figure 11. The DPASV stripping signals on ErGO–MWNTs–L-cys modified GCEs for: (A) 9 times measurements with four identical modified GCEs toward 40 μgL−1 of Pb2+ ions (B), 50 μgL−1of (Pb2+, Cd2+, Na+, K+, Mg2+, Fe3+, Co2+, Ca2+, & NO32−) ions, and (C) 50 μgL−1of (Pb2+, Cd2+, Na+, K+, Mg2+, Fe3+, Co2+, Ca2+, & ) ions in acetate buffer solution under optimal conditions.
The interference effect on the ErGO–MWNTs-L-cys/GCE toward Pb2+ ions was studied by testing the DPASV in presence of 50 μgL−1 Pb2+ acetate buffer solution containing other ions. They were divided into two groups. In the first group, the DPASVs have been performed in acetate buffer solution containing 50 μgL−1 of (Pb2+, Cd2+, Na+, K+, Mg2+, Fe3+, Co2+, Ca2+, and ) ions under optimized conditions as shown in Figure 11B. Similarly, the second step was performed in presence of (Pb2+, Cd2+, Zn2+, and Cu2+) ions as shown in Figure 11C. However, it can be seen that, there were no significant effect on the stripping signal of Pb2+ ions from most interference ions except that of Cd2+, Zn2+, and Cu2+ ions which showed considerably stripping signals due to the hexagonal activated surface of GO–MWNTs hybrid and the affinity of L-cysteine toward HMIs. The results showed that a 5.8-fold mass ratio of Cd2+, 2.5-fold mass ratio of Zn2+, and 3.2-fold mass ratio of Cu2+ were found as the tolerance ratios for the detection of Pb2+ ions at 50 μgL−1. However, this influence for real sample containing high levels of Cd2+, Zn2+, and Cu2+ can be neglected by diluting to a level that is less than their tolerance (Hynek et al., 2012; Lezi et al., 2012).
The electrochemical selectivity toward Pb2+ ions at three-dimensional of ErGO–MWNTs hybrid based electrode was successfully enhanced by adding L-cysteine. The large surface area, electrical conductivity, and rich amino-groups of the ErGO–MWNTs–L-cys significantly improved the sensitivity and selectivity in the determination of Pb2+ ions. By modifying GCE with the ErGO–MWNTs–L-cys nanocomposite along with DPASV, a linear range of 0.2–40 μgL−1 for Pb2+ ions was obtained. The limit of detection (LOD) was calculated to be 0.1 μgL−1. The results of stability and reproducibility study do not change appreciably for several days, so it may be used for the stable sensors fabrication.
The datasets generated for this study are available on request to the corresponding author.
The improvement of large surface area by nanocomposite of carbon nanomaterial has avoided the distinguish problem associated with electrochemical sensors particularly in a small surface area of working electrode. Herein, we have chosen a particular reductant agent for reduction of GO in rGO/MWNTs hybrid that is L-cysteine which can employ also for detection of lead ions owing its structure with rich of amino and thiol groups. Therefore, we achieved main impact factors for construction of electrochemical sensor in terms of its sensitivity and selectivity.
TA-G performed the experimental work, analyzed the characterized part, and justified all the results. GB, PS, NI, MM, and SS guided for instrumentation technique. MD and NM checked the article grammar. MS was the guide and responsible of this work.
The authors declare that the research was conducted in the absence of any commercial or financial relationships that could be construed as a potential conflict of interest.
The authors extend their sincere thanks to DST—SERB, New Delhi (Project No. EEQ/2017/000645), UGC—DAE CSR (RRCAT), Indore (Project No. CSR-IC-BL66/CRS- 183/2016-17/847), Inter University Accelerator Center (IUAC), New Delhi, India (UFR no. 62320), Rashtria Uchachatar Shiksha Abhiyan (RUSA), Government of Maharashtra, UGC-SAP Programme (F.530/16/DRS-I/2016(SAP-II) Dt.16-04-2016) and DST-FIST (Project No. No. SR/FST/PSI-210/2016(C) dtd. 16/12/2016) for providing financial support.
Adarakatti, P. S., Foster, C. W., Banks, C. E., Arun Kumar, N. S., and Malingappa, P. (2017). Calixarene bulk modified screen-printed electrodes (SPCCEs) as a one-shot disposable sensor for the simultaneous detection of lead (II), copper (II) and mercury (II) ions: application to environmental samples. Sens. Actuators A Phys. 267, 517–525. doi: 10.1016/j.sna.2017.10.059
Chen, D., Li, L., and Guo, L. (2011a). An environment-friendly preparation of reduced graphene oxide nanosheets via amino acid. Nanotechnology 22:325601. doi: 10.1088/0957-4484/22/32/325601
Chen, W., Rakhi, R., Hu, L., Xie, X., Cui, Y., and Alshareef, H. N. (2011b). High-performance nanostructured supercapacitors on a sponge. Nano Lett. 11, 5165–5172. doi: 10.1021/nl2023433
de Souza, A. P. R., Foster, C. W., Kolliopoulos, A. V., Bertotti, M., and Banks, C. E. (2015). Screen-printed back-to-back electroanalytical sensors: heavy metal ion sensing. Analyst 140, 4130–4136. doi: 10.1039/C5AN00381D
Deshmukh, M. A., Celiesiute, R., Ramanaviciene, A., Shirsat, M. D., and Ramanavicius, A. (2018a). EDTA_PANI/SWCNTs nanocomposite modified electrode for electrochemical determination of copper (II), lead (II) and mercury (II) ions. Electrochim. Acta 259, 930–938. doi: 10.1016/j.electacta.2017.10.131
Deshmukh, M. A., Gicevicius, M., Ramanaviciene, A., Shirsat, M. D., Viter, R., and Ramanavicius, A. (2017b). Hybrid electrochemical/electrochromic Cu (II) ion sensor prototype based on PANI/ITO-electrode. Sens. Actuators B Chem. 248, 527–535. doi: 10.1016/j.snb.2017.03.167
Deshmukh, M. A., Patil, H., Shirsat, M., and Ramanavicius, A. (2017a). “Electrochemical detection of Hg (II) ions using EDTA-PANI/SWNTs nanocomposite modified SS electrode,” in AIP Conference Proceedings (Aurangabad: AIP Publishing), 050084.
Deshmukh, M. A., Patil, H. K., Bodkhe, G. A., Yasuzawa, M., Koinkar, P., Ramanaviciene, A., et al. (2018b). EDTA-modified PANI/SWNTs nanocomposite for differential pulse voltammetry based determination of Cu (II) ions. Sens. Actuators B Chem. 260, 331–338. doi: 10.1016/j.snb.2017.12.160
Deshmukh, M. A., Shirsat, M. D., Ramanaviciene, A., and Ramanavicius, A. (2018c). Composites based on conducting polymers and carbon nanomaterials for heavy metal ion sensing. Crit. Rev. Anal. Chem. 48, 293–304. doi: 10.1080/10408347.2017.1422966
Dieckmann, G. R., Dalton, A. B., Johnson, P. A., Razal, J., Chen, J., Giordano, G. M., et al. (2003). Controlled assembly of carbon nanotubes by designed amphiphilic peptide helices. J. Am. Chem. Soc. 125, 1770–1777. doi: 10.1021/ja029084x
Dong, X., Wang, P., Fang, W., Su, C.-Y., Chen, Y.-H., Li, L.-J., et al. (2011). Growth of large-sized graphene thin-films by liquid precursor-based chemical vapor deposition under atmospheric pressure. Carbon 49, 3672–3678. doi: 10.1016/j.carbon.2011.04.069
Dua, V., Surwade, S. P., Ammu, S., Agnihotra, S. R., Jain, S., Roberts, K. E., et al. (2010). All-organic vapor sensor using inkjet-printed reduced graphene oxide. Angew. Chem. Int. Ed. Engl. 49, 2154–2157. doi: 10.1002/anie.200905089
Fowler, J., Allen, M., Tung, V., Yang, Y., Kaner, R., and Weiller, B. (2009). Practical chemical sensors from chemically derived graphene. ACS Nano. 3, 301–306. doi: 10.1021/nn800593m
Göde, C., Yola, M. L., Yilmaz, A., Atar, N., and Wang, S. (2017). A novel electrochemical sensor based on calixarene functionalized reduced graphene oxide: application to simultaneous determination of Fe (III), Cd (II) and Pb (II) ions. J. Colloid Interface Sci. 508, 525–531. doi: 10.1016/j.jcis.2017.08.086
Gouveia-Caridade, C., Pauliukaite, R., and Brett, C. M. (2006). Influence of nafion coatings and surfactant on the stripping voltammetry of heavy metals at bismuth-film modified carbon film electrodes. Electroanalysis 18, 854–861. doi: 10.1002/elan.200603482
Grasso, G., D'Urso, L., Messina, E., Cataldo, F., Puglisi, O., Spoto, G., et al. (2009). A mass spectrometry and surface enhanced raman spectroscopy study of the interaction between linear carbon chains and noble metals. Carbon 47, 2611–2619. doi: 10.1016/j.carbon.2009.05.013
Guo, H.-L., Wang, X.-F., Qian, Q.-Y., Wang, F.-B., and Xia, X.-H. (2009). A green approach to the synthesis of graphene nanosheets. ACS Nano 3, 2653–2659. doi: 10.1021/nn900227d
Huang, H., Chen, T., Liu, X., and Ma, H. (2014). Ultrasensitive and simultaneous detection of heavy metal ions based on three-dimensional graphene-carbon nanotubes hybrid electrode materials. Anal. Chim. Acta 852, 45–54. doi: 10.1016/j.aca.2014.09.010
Hwang, G. H., Han, W. K., Park, J. S., and Kang, S. G. (2008). Determination of trace metals by anodic stripping voltammetry using a bismuth-modified carbon nanotube electrode. Talanta 76, 301–308. doi: 10.1016/j.talanta.2008.02.039
Hynek, D., Krejcova, L., Sochor, J., Cernei, N., Kynicky, J., Adam, V., et al. (2012). Study of interactions between cysteine and cadmium (II) ions using automatic pipetting system off-line coupled with electrochemical analyser. Int. J. Electrochem. Sci. 7, 1802–1819.
Jeykumari, D. S., Ramaprabhu, S., and Narayanan, S. S. (2007). A thionine functionalized multiwalled carbon nanotube modified electrode for the determination of hydrogen peroxide. Carbon 45, 1340–1353. doi: 10.1016/j.carbon.2007.01.006
Koelmel, J., and Amarasiriwardena, D. (2012). Imaging of metal bioaccumulation in Hay-scented fern (Dennstaedtia punctilobula) rhizomes growing on contaminated soils by laser ablation ICP-MS. Environ. Pollut. 168, 62–70. doi: 10.1016/j.envpol.2012.03.035
Kong, J., Chapline, M. G., and Dai, H. (2001). Functionalized carbon nanotubes for molecular hydrogen sensors. Adv. Mater. 13, 1384–1386. doi: 10.1002/1521-4095(200109)13:18<1384::AID-ADMA1384>3.0.CO;2-8
Kovtyukhova, N. I., Ollivier, P. J., Martin, B. R., Mallouk, T. E., Chizhik, S. A., Buzaneva, E. V., et al. (1999). Layer-by-layer assembly of ultrathin composite films from micron-sized graphite oxide sheets and polycations. Chem. Mater. 11, 771–778. doi: 10.1021/cm981085u
Lee, G.-J., Lee, H.-M., and Rhee, C.-K. (2007). Bismuth nano-powder electrode for trace analysis of heavy metals using anodic stripping voltammetry. Electrochem. Commun. 9, 2514–2518. doi: 10.1016/j.elecom.2007.07.030
Lezi, N., Economou, A., Dimovasilis, P. A., Trikalitis, P. N., and Prodromidis, M. I. (2012). Disposable screen-printed sensors modified with bismuth precursor compounds for the rapid voltammetric screening of trace Pb (II) and Cd (II). Anal. Chim. Acta 728, 1–8. doi: 10.1016/j.aca.2012.03.036
Li, D., Müller, M. B., Gilje, S., Kaner, R. B., and Wallace, G. G. (2008). Processable aqueous dispersions of graphene nanosheets. Nat. Nanotechnol. 3, 101–105. doi: 10.1038/nnano.2007.451
Liu, J., Zhang, X.-H., Tran, H., Wang, D.-Q., and Zhu, Y.-N. (2011). Heavy metal contamination and risk assessment in water, paddy soil, and rice around an electroplating plant. Environ. Sci. Pollut. Res. Int. 18, 1623–1632. doi: 10.1007/s11356-011-0523-3
Lu, Y., Liang, X., Niyungeko, C., Zhou, J., Xu, J., and Tian, G. (2018). A review of the identification and detection of heavy metal ions in the environment by voltammetry. Talanta 178, 324–338. doi: 10.1016/j.talanta.2017.08.033
Marcano, D. C., Kosynkin, D. V., Berlin, J. M., Sinitskii, A., Sun, Z., Slesarev, A., et al. (2010). Improved synthesis of graphene oxide. ACS Nano 4, 4806–4814. doi: 10.1021/nn1006368
Massadeh, A. M., Alomary, A. A., Mir, S., Momani, F. A., Haddad, H. I., and Hadad, Y. A. (2016). Analysis of Zn, Cd, As, Cu, Pb, and Fe in snails as bioindicators and soil samples near traffic road by ICP-OES. Environ. Sci. Pollut. Res. 23, 13424–13431. doi: 10.1007/s11356-016-6499-2
Morton, J., Havens, N., Mugweru, A., and Wanekaya, A. K. (2009). Detection of trace heavy metal ions using carbon nanotube-modified electrodes. Electroanalysis 21, 1597–1603. doi: 10.1002/elan.200904588
Novoselov, K. S., and Geim, A. (2007). The rise of graphene. Nat. Mater. 6, 183–191. doi: 10.1038/nmat1849
O'connell, M. J., Bachilo, S. M., Huffman, C. B., Moore, V. C., Strano, M. S., Haroz, E. H., et al. (2002). Band gap fluorescence from individual single-walled carbon nanotubes. Science 297, 593–596. doi: 10.1126/science.1072631
Pham, V. H., Cuong, T. V., Hur, S. H., Oh, E., Kim, E. J., Shin, E. W., et al. (2011). Chemical functionalization of graphene sheets by solvothermal reduction of a graphene oxide suspension in N-methyl-2-pyrrolidone. J. Mater. Chem. 21, 3371–3377. doi: 10.1039/C0JM02790A
Priya, T., Dhanalakshmi, N., Thennarasu, S., and Thinakaran, N. (2018). A novel voltammetric sensor for the simultaneous detection of Cd2+ and Pb2+ using graphene oxide/κ-carrageenan/l-cysteine nanocomposite. Carbohydr. Polym. 182, 199–206. doi: 10.1016/j.carbpol.2017.11.017
Promphet, N., Rattanarat, P., Rangkupan, R., Chailapakul, O., and Rodthongkum, N. (2015). An electrochemical sensor based on graphene/polyaniline/polystyrene nanoporous fibers modified electrode for simultaneous determination of lead and cadmium. Sens. Actuators B Chem. 207, 526–534. doi: 10.1016/j.snb.2014.10.126
Quang, D. T., and Kim, J. S. (2010). Fluoro-and chromogenic chemodosimeters for heavy metal ion detection in solution and biospecimens. Chem. Rev. 110, 6280–6301. doi: 10.1021/cr100154p
Raj, M. A., and John, S. A. (2013). Fabrication of electrochemically reduced graphene oxide films on glassy carbon electrode by self-assembly method and their electrocatalytic application. J. Phys. Chem. C 117, 4326–4335. doi: 10.1021/jp400066z
Richard, C., Balavoine, F., Schultz, P., Ebbesen, T. W., and Mioskowski, C. (2003). Supramolecular self-assembly of lipid derivatives on carbon nanotubes. Science 300, 775–778. doi: 10.1126/science.1080848
Sanchez-Rodas, D., Corns, W., Chen, B., and Stockwell, P. (2010). Atomic fluorescence spectrometry: a suitable detection technique in speciation studies for arsenic, selenium, antimony and mercury. J. Anal. At. Spectrom. 25, 933–946. doi: 10.1039/b917755h
Siraj, K., and Kitte, S. A. (2013). Analysis of copper, zinc and lead using atomic absorption spectrophotometer in ground water of Jimma town of Southwestern Ethiopia. Int. J. Anal. Chem. 4, 201–204. doi: 10.1016/j.ijcas.2013.07.006
Tang, L., Wang, Y., Li, Y., Feng, H., Lu, J., and Li, J. (2009). Preparation, structure, and electrochemical properties of reduced graphene sheet films. Adv. Funct. Mater. 19, 2782–2789. doi: 10.1002/adfm.200900377
Tiwari, K., Singh, N., Patel, M., Tiwari, M., and Rai, U. (2011). Metal contamination of soil and translocation in vegetables growing under industrial wastewater irrigated agricultural field of Vadodara, Gujarat, India. Ecotoxicol. Environ. Saf. 74, 1670–1677. doi: 10.1016/j.ecoenv.2011.04.029
Tongesayi, T., Fedick, P., Lechner, L., Brock, C., Le Beau, A., and Bray, C. (2013). Daily bioaccessible levels of selected essential but toxic heavy metals from the consumption of non-dietary food sources. Food Chem. Toxicol. 62, 142–147. doi: 10.1016/j.fct.2013.08.052
Tuinstra, F., and Koenig, J. L. (1970). Raman spectrum of graphite. J. Chem. Phys. 53, 1126–1130. doi: 10.1063/1.1674108
Wan, M.-W., Kan, C.-C., Rogel, B. D., and Dalida, M. L. P. (2010). Adsorption of copper (II) and lead (II) ions from aqueous solution on chitosan-coated sand. Carbohydr. Polym. 80, 891–899. doi: 10.1016/j.carbpol.2009.12.048
Wang, B., Luo, B., Liang, M., Wang, A., Wang, J., Fang, Y., et al. (2011). Chemical amination of graphene oxides and their extraordinary properties in the detection of lead ions. Nanoscale 3, 5059–5066. doi: 10.1039/c1nr10901d
Wang, S., Forzani, E. S., and Tao, N. (2007). Detection of heavy metal ions in water by high-resolution surface plasmon resonance spectroscopy combined with anodic stripping voltammetry. Anal. Chem. 79, 4427–4432. doi: 10.1021/ac0621773
Xiao, Y., and Li, C. M. (2008). Nanocomposites: from fabrications to electrochemical bioapplications. Electroanalysis 20, 648–662. doi: 10.1002/elan.200704125
Yang, T., Zhou, N., Zhang, Y., Zhang, W., Jiao, K., and Li, G. (2009). Synergistically improved sensitivity for the detection of specific DNA sequences using polyaniline nanofibers and multi-walled carbon nanotubes composites. Biosens. Bioelectron. 24, 2165–2170. doi: 10.1016/j.bios.2008.11.011
Yuan, X., Zhang, Y., Yang, L., Deng, W., Tan, Y., Ma, M., et al. (2015). Three-dimensional activated graphene network–sulfonate-terminated polymer nanocomposite as a new electrode material for the sensitive determination of dopamine and heavy metal ions. Analyst 140, 1647–1654. doi: 10.1039/C4AN02263G
Zhang, C., Ren, L., Wang, X., and Liu, T. (2010). Graphene oxide-assisted dispersion of pristine multiwalled carbon nanotubes in aqueous media. J. Phys. Chem. C 114, 11435–11440. doi: 10.1021/jp103745g
Zhang, L., Huang, Y., Zhang, Y., Fan, W., and Liu, T. (2015). Three-dimensional nanoporous graphene-carbon nanotube hybrid frameworks for confinement of SnS2 nanosheets: flexible and binder-free papers with highly reversible lithium storage. ACS Appl. Mater. Interfaces 7, 27823–27830. doi: 10.1021/acsami.5b09115
Zhang, R., and Wang, X. (2007). One step synthesis of multiwalled carbon nanotube/gold nanocomposites for enhancing electrochemical response. Chem. Mater. 19, 976–978. doi: 10.1021/cm062791v
Zhao, F., Wang, F., Zhao, W., Zhou, J., Liu, Y., Zou, L., et al. (2011). Voltammetric sensor for caffeine based on a glassy carbon electrode modified with nafion and graphene oxide. Microchim. Acta 174, 383–390. doi: 10.1007/s00604-011-0635-y
Zhao, Q., Gan, Z., and Zhuang, Q. (2002). Electrochemical sensors based on carbon nanotubes. Electroanalysis 14, 1609–1613. doi: 10.1002/elan.200290000
Zhao, Z.-Q., Chen, X., Yang, Q., Liu, J.-H., and Huang, X.-J. (2012). Selective adsorption toward toxic metal ions results in selective response: electrochemical studies on a polypyrrole/reduced graphene oxide nanocomposite. Chem. Commun. 48, 2180–2182. doi: 10.1039/C1CC16735A
Keywords: electrochemical reduction, graphene oxide, multiwalled carbon nanotubes, L-cysteine, nanocomposite, electrochemical conductivity, differential pulse anodic stripping voltammetry, Pb2+ ions detection
Citation: AL-Gahouari T, Bodkhe G, Sayyad P, Ingle N, Mahadik M, Shirsat SM, Deshmukh M, Musahwar N and Shirsat M (2020) Electrochemical Sensor: L-Cysteine Induced Selectivity Enhancement of Electrochemically Reduced Graphene Oxide–Multiwalled Carbon Nanotubes Hybrid for Detection of Lead (Pb2+) Ions. Front. Mater. 7:68. doi: 10.3389/fmats.2020.00068
Received: 10 December 2019; Accepted: 04 March 2020;
Published: 31 March 2020.
Edited by:
Xun Yu, New York Institute of Technology, United StatesReviewed by:
Zhaohong Su, Hunan Agricultural University, ChinaCopyright © 2020 AL-Gahouari, Bodkhe, Sayyad, Ingle, Mahadik, Shirsat, Deshmukh, Musahwar and Shirsat. This is an open-access article distributed under the terms of the Creative Commons Attribution License (CC BY). The use, distribution or reproduction in other forums is permitted, provided the original author(s) and the copyright owner(s) are credited and that the original publication in this journal is cited, in accordance with accepted academic practice. No use, distribution or reproduction is permitted which does not comply with these terms.
*Correspondence: Mehendra Shirsat, bWRzaGlyc2F0LnBoeUBiYW11LmFjLmlu
Disclaimer: All claims expressed in this article are solely those of the authors and do not necessarily represent those of their affiliated organizations, or those of the publisher, the editors and the reviewers. Any product that may be evaluated in this article or claim that may be made by its manufacturer is not guaranteed or endorsed by the publisher.
Research integrity at Frontiers
Learn more about the work of our research integrity team to safeguard the quality of each article we publish.