
95% of researchers rate our articles as excellent or good
Learn more about the work of our research integrity team to safeguard the quality of each article we publish.
Find out more
ORIGINAL RESEARCH article
Front. Mater. , 25 March 2020
Sec. Ceramics and Glass
Volume 7 - 2020 | https://doi.org/10.3389/fmats.2020.00066
This article is part of the Research Topic Proceedings of PP1594: Topological Engineering of Ultrastrong Glasses View all 13 articles
 Tina Waurischk1
 Ralf Müller1*
 Stefan Reinsch1
 Philipe Kiefer2
 Joachim Deubener2
 Robert Balzer3
 Harald Behrens3
Stable crack growth was measured for nominal dry and water-bearing (6 wt%) soda-lime silicate glasses in double cantilever beam geometry and combined with DMA studies on the effects of dissolved water on internal friction and glass transition, respectively. In vacuum, a decreased slope of logarithmic crack growth velocity versus stress intensity factor is evident for the hydrous glass in line with an increase of β-relaxation intensity indicating more energy dissipation during fracture. Further, inert crack growth in hydrous glass is found to be divided into sections of different slope, which indicates different water related crack propagation mechanism. In ambient air, a largely extended region II is observed for the hydrous glass, which indicates that crack growth is more sensitive to ambient water.
Glass strength and fatigue are controlled by the presence and propagation of surface microcracks (Ciccotti, 2009; Wiederhorn et al., 2013a). Focusing mainly on commercial glasses, crack velocity was studied in liquids (Wiederhorn and Bolz, 1970; Simmons and Freiman, 1981; Gehrke et al., 1987a; Gehrke et al., 1990; Gehrke et al., 1991; Dunning et al., 1994), humid air (Wiederhorn, 1967; Richter, 1983; Evans and Johnson, 1975; Gehrke et al., 1987b; Muraoka and Abe, 1996; Freiman et al., 2009), and vacuum (Pukh et al., 2009; Wiederhorn et al., 1974), where ambient water proved to be the key accelerant for slow crack propagation (Wiederhorn, 1967). Stress corrosion is therefore widely accepted as the underlying mechanism, assuming that water molecules break strained Si-O-Si network bonds at the crack tip into silanol groups (Charles, 1958; Hilling and Charles, 1965; Michalske and Freiman, 1982).
However, more recent studies indicate that crack propagation is affected by other phenomena and that a simple ≡ Si-O-Si ≡ + H2O reaction (Michalske and Freiman, 1982) is unlikely to be the stress corrosion reaction (Ito and Tomozawa, 1981; Tomozawa, 2007; Ciccotti, 2009; Wiederhorn et al., 2013c). In contrast to Michalske and Freiman (1982) it was found that compressive instead of tensile stress promote glass dissolution at the crack tip (Ito and Tomozawa, 1981). Further, glass dissolution and reprecipitation at different curvature can cause crack tip blunting (Ito and Tomozawa, 1982a). Sodium can be enriched at the fractured glass surface (Langford et al., 1991; Celarie et al., 2007), dissolve into the narrow water film at the crack tip (Wiederhorn, 1967) and cause ion exchange related swelling and compressive stress (Lanford et al., 1979). In fused silica, swelling at the crack tip was also found and attributed to stress-induced water diffusion into the glass surface (Tomozawa, 1996; Fett et al., 2005; Wiederhorn et al., 2013a) as it was previously stated (Nogami and Tomozawa, 1984; Han and Tomozawa, 1991). Water penetration and swelling were later described in Wiederhorn et al. (2013a) explaining why the strength of fused silica fibers is increased by soaking in water as reported in Ito and Tomozawa (1982a).
Alternatively, water-induced toughening can be explained by water induced stress relaxation as found for fused silica, E-glass and soda-lime silicate glass fibers (Lezzi and Tomozawa, 2015; Seaman et al., 2015). These experiments on bend fused silica fibers, held under subcritical tensile stress at low water pressure below Tg, indicate that molecular water can cause stress relaxation as a very mobile species. This conclusion was derived from the surface profiles of the IR reflection peak position at ≈1120 cm–1, which indicates structural relaxation, and that of the Si-OH concentration. The latter profile was found to be 10 times less extended than the peak position profile (Lezzi and Tomozawa, 2015).
It is reasonable to assume that stress enhanced water diffusion into the strained silicate network (Nogami and Tomozawa, 1984; Han and Tomozawa, 1991; Wiederhorn et al., 2013b) can change local mechanical properties as well (Tomozawa, 2007). Thus, water is known to influence viscosity (Deubener et al., 2003), hardness (Marsh, 1964; Takata et al., 1982), and elastic moduli (Le Parc et al., 2006; Ito and Tomozawa, 1982b). Water was also proved to increase internal friction as e.g., shown for low water bearing (<0.3 wt%) phosphate (Day and Stevels, 1974), sodium silicate and borate glasses (Day, 1974). More recently, internal friction studies on high water bearing (<8 wt%) soda-lime silicate glasses (Reinsch et al., 2013) and sodium borosilicate glasses (Behrens et al., 2018) demonstrated that water strongly affects the temperature range and the intensity of sub-Tg relaxation.
These water-related effects, however, are difficult to be measured directly at the crack tip as the water influenced region is very limited in size (Wiederhorn et al., 2011). Even for slow crack growth in fused silica, the D2O penetration depth at half-height was found to be ≈6–8 nm at an average crack velocity of 4⋅10–6 m s–1 (Lechenault et al., 2011). These values are slightly larger than those for water in fused silica more previously measured with resonant nuclear reaction analysis at 10–7 m s–1 (Han and Tomozawa, 1991).
With this in mind, we tried to mimic the effect of water on mechanical properties and crack propagation by studying high water-bearing glass samples. For this purpose, oxide glasses containing up to 8 wt% water were synthesized by melting at high pressure according to Behrens and Stuke (2003). In this way, water speciation and its influence on glass network structure could be investigated for numerous hydrous glasses including soda-lime-borate, sodium borosilicate (Bauer et al., 2017; Behrens et al., 2018), silicoborate (Balzer et al., 2019a), phosphate (Balzer et al., 2019b), and microscope slide glasses (Kiefer et al., 2019). Analogous studies on other soda-lime glasses have been published previously (Behrens and Stuke, 2003).
Recently, measurements of density, molar volume of water, water speciation, elastic moduli, and hardness of water-bearing microscope slide glasses were reported (Kiefer et al., 2019). The present paper focuses on stable crack growth in ambient air and vacuum as well as on internal friction in these glasses.
Commercial microscope slide glass (VEB, Ilmenau, Germany) of a previous study (Kiefer et al., 2019) was used. In particular, the sample 0W-MSG0 is the nominal dry glass (water content = 0.039 wt%), whereas the samples 3W-MSG500 and 6W-MSG500 are hydrous glasses, which has been, respectively mixed with nominal 3 and 6 wt% water and remelted in a internal pressure vessel at 500 MPa. Synthesis conditions, determination of the water content and the resulted water speciation are reported in Kiefer et al. (2019). The glass transition temperatures (Tg) are 812 K (0W-MSG0), 598 K (3W-MSG500), and 517 K (6W-MSG500) as measured by means of DTA (±5 K, TAG 24, Setaram, Caluire, France) and following the protocol given in Bauer et al. (2015).
Crack growth measurements were made at room temperature in a self-built double cantilever beam device in ambient air at 20% rh (5600 ppmv), 24% rh (6750 ppmv), 40% rh (11300 ppmv), and in a vacuum of 2.8⋅10–3 mbar (10–5 ppmv). Samples had been prepared with a diamond saw. A narrow groove, 600 μm broad and half of the sample thickness in depth, was cutted along the center line of the top surface to guide the crack. Samples of 60 mm × 22 mm × 1 mm and 30 mm × 17 mm × 2 mm in size were used for nominally dry and hydrous glasses, respectively. The stress intensity factor, KI, was estimated according to Wiederhorn and Bolz (1970):
with P = applied load, L = crack length, 2b = width of the glass slide, w = its thickness, and a is the remaining thickness of the glass slide beneath the groove. Eq. 1 is valid for L/b > 1.5. To ensure a sharp crack tip for DCB measurements, a pre-crack was thermally initiated. Afterward, the load was slightly increased until the crack length has reached 1.5⋅b. For measurements in vacuum, crack initiation and minimum growth were performed in air. Maintaining a small load preventing crack recombination, the DCB chamber was then evacuated. The maximum uncertainty of KI obtained from repeated experiments on different samples of the same glass was ± 0.05 MPa⋅m0.5.
The crack length, L, was measured with a digital microscope (DinoLite, Digital Microscope) using the software DinoCapture2.0. Below 10–4 m s–1, the crack velocity, v, was calculated from the time required for certain crack elongation steps. These steps were set to 0.1 and 0.3 mm for v < and > 10–7 m s–1, respectively. Based on the accuracy of crack length (ΔL = 9 μm) and time measurement (Δt = 1 s), the uncertainty of v was estimated to Δv ≈ 3⋅10–6 and 9⋅10–9 m s–1 for v = 10–4 and 10–7 m s–1, respectively, and error bars would not exceed the symbol size.
Above 10–4 m s–1, v was measured by high frequency (f = 5 kHz) modulation during crack growth according to Kerkhof (1970); Ullner and Gehrke (1990). When crack propagation is affected by superimposed periodic stress, fracture surfaces exhibit a certain waviness and v can be concluded from f and the distance between neighbored wave peaks. This distance was measured with light microscopy using the software LEXT OLS (Olympus corporation, Tokyo, Japan) within 2 μm accuracy. For comparison, v > 10–4 m s–1 was recorded with a Bonito high speed camera CL-400 (Allied Vision Technologies GmbH, Stadtroda, Germany) using the software Epix® Pixci® E8, XCAP V 3.8 (Epix Inc., Buffalo Groove, IL, United States) with a frame rate of up to 13000 fps. Applying these different techniques, v could be measured within 10 orders of magnitude.
Crack growth velocity data as a function of the stress intensity were analyzed using the empirical relation (Gehrke et al., 1987b).
where the limiting velocity v0 and the crack growth exponent n (also called fatigue parameter) are adjustable parameters, which depend on the environmental condition of the DCB experiment and the chemical resistance of the glass, respectively.
Internal friction was measured with dynamic mechanical analysis (Eplexor 150N and Eplexor 25N, Gabo, Ahlden, Germany) in asymmetric three point bending mode on polished 25 mm × 5 mm × 2 mm samples. 3 N static and 1.5 N dynamic force components were applied and measured with a 25 N force detector with 0.1% accuracy. Displacement was recorded with an inductive displacement transducer. Force, displacement and phase shift, δ, were recorded in temperature-frequency sweep mode switching between 0.2, 2 and 20 Hz before stepping up by 5 K at ≈1.5 K min–1. One frequency cycle took ≈13 min and the average heating rate was ≈0.3 K min–1. Results are presented in terms of tanδ versus temperature in 5 K accuracy. OriginPro2015 (OriginLab, 2019) was used for data analysis. Spectra were smoothed averaging over 15 data points. This procedure reduced the scatter of tanδ to <5⋅10–4. For clarity, spectra were set zero at their minimum.
In order to test the applied experimental procedure, Figure 1 compares crack velocity data of the dry microscope slide (red symbols) with literature data on similar glasses (gray symbols). Glass compositions and crack growth exponents n (Eq. 2), which represent the slope of log v versus log KI, are listed in Table 1 for regions I (stress corrosion regime) and III (inert growth) (Ciccotti, 2009).
Figure 1. Crack velocity, v, versus stress intensity factor, KI, of the nominal dry microscope slide glass (red) compared to literature data on similar glasses (gray, Table 1). Red lines are best fits of Eq. 2. Full red circles: 24% rh, open red circles: 40% rh, full red diamonds: 10–3 mbar. Gray open circles: Microscope slide glass at 0.017% rh (Wiederhorn, 1967), gray triangles: Microscope slide glass at 10–3 mbar (Wiederhorn et al., 1974), solid gray lines: (Wiederhorn, 1967), gray dash-dot curve: Float glass in liquid water (e.g. Gehrke et al., 1987b).
Table 1. Glass composition in mol% and crack growth exponents for regions I and III. nI and nIII are best fits of the data in Figures 1, 2 with Eq. 2.
In region I, v strongly depends on humidity. Thus, log v(KI) shifts to lower KI by approx. 0.05 MPa m0.5 with increasing humidity from 24% rh (full red circles) to 40% rh (red open circles). This shift and the slope of the log v(KI)-curve well confirm previous literature. Crack arrest at KI0 ≈ 0.32 MPa m0.5 is indicated for 40% rh.
In region II, the transition from region I to inert crack growth (region III) appears within a narrow range of KI exhibiting large data scatter. Nevertheless, a slope is difficult to estimate in sufficent accuracy for this region.
In region III, crack growth is too fast to be affected by ambient water or occurs in vacuum. In both cases, inert crack growth is expected. Actually, fast crack growth data measured in air (full red circles, v > 10–4 m s–1) of this study coincide well with those measured under vacuum at 10–3 mbar (full red diamonds). The slope in region III is very steep (nIII/nI ≈ 9) and substantial crack extension proceeds in a narrow range of KI. Although the slope appears slightly larger, measured values of fast crack propagation well confirm previous literature. Summing up, Figure 1 provides confidence in the applied DCB protocol within 10 orders of magnitude of v.
Figure 2 compares crack propagation in the nominal dry microscope slide glass measured in air (red circles) and in vacuum (red diamonds) with that in the hydrous microscope slide glass containing 6 wt% water measured in air (blue circles) and in vacuum (blue diamonds). Table 1 lists slopes n, for different regions of crack propagation.
Figure 2. Crack growth velocity, v, versus stress intensity factor, KI, for nominal dry (red) and hydrous microscope slide glass (6 wt% water, blue). Dashed blue line: guide for the eye. Red symbols and gray dash-dot curve (e.g. Gehrke et al., 1987b) are taken from Figure 1. Blue pentagons: 20% rh, blue hexagons: 10–3 mbar (≈ 0.00002% rh).
In region I (humid air), crack growth in the hydrous glass occurs at lower KI than those observed for the dry glass. For instance, v ≈ 10–7 m s–1 measured in air of similar humidity occurs at KI ≈ 0.50 and 0.40 MPa m0.5 for the dry and the hydrous glass, respectively. Eventhough, the slope of log v(KI) for the hydrous glass is rather similar to that of the dry glass. It is interesting to note that humidity much stronger promotes the crack growth in the hydrous glass. This effect causes a much broader KI range of region II, which is shown by the shift of KI at v ≈ 10–7 ms–1 down to ≈0.40 MPa m0.5, as low as measured for float glass in liquid water [gray dash-dot line (Gehrke et al., 1987b)].
In region III (vacuum), crack growth in the hydrous glass (blue hexagons) considerably differs from that observed for the dry glass (red diamonds). Most notably, the slope of log v(KI) is significantly decreased and, since slow crack growth (10–7ms–1) occurs at similar KI for both glasses, crack growth in the hydrous glass mostly occurs at higher stress intensity. This effect indicates that dissolved water acts as a toughening agent, at least for v > 10–7 m s–1. Moreover, the graph of log v(KI) can be devided into sections of different slope. Thus, nIII ≈ 16, 26 and 55 occurs for v ≈ 10–7–10–5 m s–1, v ≈ 10–5–10–3 m s–1 and > 3⋅10–3 m s–1, respectively (Table 1). The maximum slope at v > 10–3 m s–1 is slightly lower than that observed in Gehrke et al. (1987b) for float glass in liquid water. The kink at v ≈ 3⋅10–3 m s–1, however, coincides with that reported in Gehrke et al. (1987b) (gray dash-dot curve), where inert crack growth is reached. This similarity and different slopes, which might indicate different crack growth mechanisms, make it questionable to assign all sections to the inert crack growth (region III).
Mechanical loss spectra for different water-bearing glasses obtained by dynamic mechanical analysis are shown in Figure 3. Fitted curve parameters are given in Table 2. According to Brueckner (1964), three different relaxation peaks can appear. α-relaxation at high temperature (long dashed curves) is caused by network relaxation phenomena, e.g., related to viscosity. Its maximum temperature reflects the frequency dependency of glass transition and can not be approached closer than 20 K during the DMA experiment in order to avoid a change of sample geometry. β-relaxation peaks at medium temperature (short dashed curves) are caused by complex regional co-operative movements of alkali and alkaline earth or water ions whereas γ-relaxation peaks at low temperature (arrow) relate to local alkali movements, i.e., Na+ jumps.
Figure 3. Mechanical loss spectra in dry and water-bearing microscope slide glass samples for f = 2 Hz. Red circles: nominal dry glass (0W-MSG0), gray circles: 3 wt% water (3W-MSG500), blue circles: 6 wt% water (6W-MSG500). Dashed curves: deconvoluted Gaussian fits for γ-, βH2O-, βOH-, and α-relaxation.
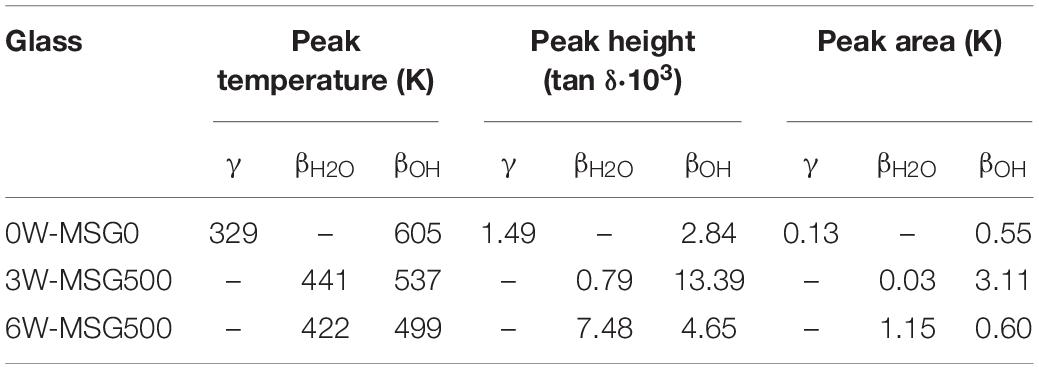
Table 2. Parameters of DMA peak analysis.
For the dry glass, a weak γ-relaxation peak at 329 K (γd, arrow) and a weak β-relaxation at 605 K (βdOH) are evident. Above 700 K, α-relaxation dominates.
For the glass containing 3 wt% water, a strong temperature decrease of α-relaxation is evident. This effect resembles the decrease in Tg measured with DTA. Further, a pronounced β-relaxation peak, shifted to 537 K, occurs (β3OH). A closer look also reveals a small secondary β-relaxation peak at 441 K (β3H2O, arrow). The explanation of this effect can be based on similar findings reported in Reinsch et al. (2013) on soda-lime silicate glass, where two β-relaxation peaks have been attributed to molecular (βH2O) and dissociated (βOH) water. In fact, as a ratio of dissociated to molecular water [OH]/[H2O] ≈ 1:1 was detected for the microscope slide glass containing 3 wt% water (Kiefer et al., 2019), a significant amount of molecular water is present. In this sense, the β-relaxation peaks at 537 K and 441 K can be attributed to βOH- and βH2O-relaxation peaks, respectively. As expected for samples with increased β-relaxation (Brueckner, 1964), the γ-relaxation peak disappeared. The relaxation peak near 273 K is probably caused by ice formation at the sample holder.
For the glass containing 6 wt% water, the ratio of dissociated to molecular water [OH]/[H2O] further decreases to 1:2 (Kiefer et al., 2019). Confirming the strong shift of Tg measured by DTA, α-relaxation further shifts to lower T. The βOH-relaxation peak also shifts to lower T (≈ 500 K) and decreases in intensity. βH2O-relaxation, however, strongly increases in intensity while shifting to 422 K.
Figure 2 reveals largely different crack propagation behavior of the nominal dry and the hydrous microscope slide glass in vacuum. Most strikingly, a much smaller crack growth exponent nIII < 55 is evident for the hydrous glass (blue diamonds), wheras nIII ≈ 150 occurs for the dry glass. nIII of the hydrous glass is also smaller than those obtained from literature data in region III in other nominal dry silicate glasses ranging between 88 and 130 (Table 1).
The significantly lowered value of nIII for the hydrous glass indicates more energy dissipation during fracture. Thus, for ideal brittle fracture, linear elastic fracture mechanics predicts a steep curve of log v(KI) at KI = KIC depending on tensile stress, σ, Young’s modulus, E, and the surface energy, γS (Griffith, 1921):
If crack propagation is complicated by subsidiary energy dissipation, E and γS must be treated as a function of time in terms of Eq. 3 since energy dissipation is always related to relaxation phenomena (Ciccotti, 2009). Following this concept, different approaches in literature could show that energy dissipation results in a decrease of n.
(i) Liang and Zhou (1997), introduced a time depending compliance to model crack growth in viscoelastic solids:
where τ and t denominate relaxation time and the time required for passing the plastic zone length for a given v, respectively. In this approach, which assumes energy dissipation throughout the whole sample body, E(t) ≈ E1⋅ (E2/(E1 + E2)) for slow crack growth or fast relaxation (τ « t). It increases to E(t) ≈ E1 for fast crack growth or slow relaxation (τ » t). As KI for a certain value of v increases with E according to Eq. 3, this increase of E with v will reduce n.
Alternatively, (ii) Maugis (1985) proposed Eq. 5 as the stability criterium for crack growth in viscoelastic solids,
where α is a constant depending on temperature, and Φ depends on v. In his approach, Maugis assumes that kinetic energy terms are negligible, viscous drag is proportional to the surface energy, γS, and energy dissipation is restricted to the vicinity of the crack tip. With Φ = vm and 2EγS « KI2, Eq. 5 gives the empirical power law of slow crack growth (Maugis, 1985):
where 2/m equals n in Eq. 2. For larger m, Φ (and hence γS in Eq. 3) more strongly increases with v, which, in turn, decreases n.
The above discussion makes it reasonable to assume that the low values of nIII in the hydrous glass seen in Figure 2 indicate that dissolved water promotes energy dissipation during fracture. Such effect would match the well-known influence of water on viscosity (Deubener et al., 2003) and stress relaxation (Lezzi and Tomozawa, 2015). Similarly, static fatigue studies on differently annealed silica samples show that n, which is also a fatigue parameter, decreases with increasing water content (Han and Tomozawa, 1991; cited in Tomozawa, 2007). Furthermore, the decrease of Knoop hardness of binary soda silicate glasses with increasing water content indicates that dissolved water promotes deformation by plastic flow (Takata et al., 1982).
Confirmingly, Figure 3 could indicate increased internal friction during fracture in the hydrous glass. Thus, increased mechanical loss at room temperature can be expected from the temperature decrease of α- and β-relaxation and from the intensity increase of β-relaxation. Note that β-relaxation in the 6 wt% water-bearing glass is dominated by water molecules due to the given water speciation ratio [OH]/[H2O] ≈ 1:2 (Kiefer et al., 2019). Water molecules have been discussed in Lezzi and Tomozawa (2015) as a very mobile species causing structure relaxation more rapidly than silanol formation. The large mobility of molecular water is already known from diffusion studies in fused silica (Tomozawa et al., 1994). A large mobility of molecular water in the 6 wt% water-bearing glass is also indicated by the low βH2O-relaxation maximum temperature at ≈422 K, not far above of the γ-relaxation of sodium at 329 K measured in the dry glass and the increased peak area (Table 2).
Figure 3 further indicates that internal friction in the hydrous glass would largely increase if the crack tip temperature increases during fracture. However, Weichert and Schönert (1973) estimated a moderate tip temperature increase of less than 300 K even assuming rapid crack propagation (soda-lime silicate glass, v = 103 m s–1, heat production 2⋅10–3 J m–2). Also, Figure 3 merely reflects the global viscoelastic response of the sample whereas energy dissipation is widely assumed to mainly occur in the vicinity of the crack tip. The latter assumption is supported by AFM studies revealing large fluctuations in v and a strong scatter in crack surface curvature in a nanometer scale (Marliere et al., 2003), whereas beyond 10 nm from the crack tip, the material appears fully elastic (Wiederhorn et al., 2011). Since internal friction and energy dissipation during fracture should be based on similar structural relaxation phenomena, however, internal friction and crack propagation data may be compared with each other at least qualitatively.
It is also worth noting that in contrast to the dry sample, log v(KI) for crack growth in vacuum in the hydrous sample reveals sections of different slopes (Table 1). In terms of section “Crack Growth Exponent in Vacuum,” this effect is plausible due to the kinetic nature of energy dissipation. When its relaxation time becomes large compared to the time required for fast crack propagation, log v(KI) becomes steeper possibly causing a kink. This effect is inherently involved in Eq. 4 and also discussed by Maugis (1985) in terms of limiting crack speeds for certain slope segments. Therefore, n generally tends to increase with v (or KI) as it is shown in Figure 2.
The first slope section, exhibiting the lowest slope of log v(KI) in Figure 2 (n = 16), is limited by a shoulder at v ≈ 10–5 m s–1 beyond which the slope increases to n = 26. The crack velocity range of this shoulder seems to resemble that of region II for the nominal dry glass in ambient air, where it indicates the kinetic transition between water affected and water-independent crack propagation. Since this transition is even caused by trace amounts of water (Ciccotti, 2009), the similarity between the shoulders for the dry and hydrous glass seen in Figure 2 might indicate similar underlying mechanisms. However, the shoulder at 10–3 mbar should occur at lower v. This is indicated by Figure 1, where region II for the dry glass shifts to much lower v with decreasing humidity (e.g., shifting down to v = 10–7 m s–1 for crack growth in 0.017% rh) (Wiederhorn, 1967). At 10–3 mbar, this shoulder might fall below the range of v measured in this study. On the other hand, the high concentration of water in the hydrous glass [17 mol% (Kiefer et al., 2019)] makes it reasonable to assume that water readily escapes from the freshly fractured surface increasing the local vapor pressure at the crack tip. This effect might resemble the stress-induced emission of sodium during the fracture of soda-lime silicate glass (Lanford et al., 1979). The resulting micro climate might promote stress corrosion related crack propagation as for the dry glass in ambient air. The resulting shoulder in the hydrous glass would thus represent the kinetic limit of the this effect. The similar slopes nI for region I in the dry and nIII for the first slope section in the hydrous glass in vacuum of 16 (Table 1), may also indicate a similar stress corrosion based mechanism. In this case, it would be difficult to apply the term “inert crack growth” or “region III” for this slope section.
The second slope section, exhibiting a slope of n = 26 (Figure 2), is limited by a kink at v ≈ 3⋅10–3 m s–1 beyond which the slope increases to 55. It is interesting to note that this kink resembles the one found by Gehrke et al. (1987b) for crack growth in float glass measured in liquid water. In this case, the limiting effect of (ambient) water transport to the crack tip can be assumed to reach its minimum influence. For crack propagation in the hydrous glass measured in vacuum, however, this explanation seems questionable. Remaining traces of ambient water should cause a shoulder at much lower v and, assuming this effect is promoted by the micro climate at the crack tip, would contradict the above given explanation for the shoulder at v ≈ 10–5 m s–1. Instead, the kink could be assumed to reflect the kinetic limit of Si-OH formation at the crack tip according to Michalske and Freiman (1982). This assumption would explain the kink at v ≈ 3⋅10–3 m s–1 for the dry glass in liquid water as well as why dissolved water can not further promote crack propagation even though 17 mol% (Kiefer et al., 2019) of dissolved water is present in the hydrous glass. This hypothesis would allow to assume that water molecules might still diffuse toward the crack tip causing energy dissipation. This might also explain the fact that the slope of log v(KI) above v ≈ 10–3 m s–1 is smaller for the hydrous glass than for the dry glass.
As an alternative hypothesis, the shoulder at v ≈ 10–5 m s–1 might be explained as discussed above being related to a micro climate at the crack tip whereas the kink at v ≈ 10–3 m s–1 could reflect the kinetic limit of the diffusion of dissolved water toward the crack tip. This latter mechanism resembles the penetration of ambient water molecules into the glass as discussed for crack propagation in air (Tomozawa, 1996; Fett et al., 2005; Wiederhorn et al., 2013a). This effect seems plausible due to the high concentration of water given in the hydrous glass as well as due to the known effect of tensile stress on water diffusivity (Nogami and Tomozawa, 1984; Han and Tomozawa, 1991; Lechenault et al., 2011; Larché and Voorhees, 1996; Mehrer, 1996; Lechenault et al., 2011).
As a further hypothesis, the shoulder at v ≈ 10–5 m s–1 and the kink at 10–3 m s–1 could, respectively indicate the kinetic limit of diffusion of dissolved molecular water to the crack tip and the Si-OH formation. This interpretation implies that molecular water diffusion to the crack tip is slower than Si-OH-formation. At first glance, this assumption seems to contradict findings reported in Lezzi and Tomozawa (2015). This study shows that molecular water in fused silica can cause stress relaxation more rapidly than Si-OH-formation. A large mobility of molecular water is also indicated by the low peak temperature of βH2O in Figure 3. It seems possible, however, that Si-OH formation could be largely promoted by high tensile stresses at the crack tip. Furthermore, the low temperature mobility of molecular water in soda-lime silicate glass is expected to be less than that in fused silica as demonstrated in Muller et al. (2005).
In any case, all hypotheses discussed above need more detailed studies to get better understanding of the underlying mechanism. In particular, the crack growth measurement of the hydrous glass shown here are based on two DCB samples of sufficient size and homogeneity to ensure straight and smooth crack growth along the groove. As the slope of log v(KI) for the hydrous glass (n = 55) is still smaller than that of the dry glass (n = 148, see Table 1), even at v ≈ 1 m s–1, fractographic studies on fast crack growth might be helpful to reveal the kinetic limit of the related energy dissipation mechanism. Such studies would also be very interesting inasmuch other dissipating mechanism could be expected for rapid crack growth. Thus, Kerkhof (1970) found that high humidity can dalay fast crack growth in soda-lime silicate glass above v = 10 ms–1 due to the adhesion between the fractured surfaces of sufficiantly narrow cracks. On the other hand, it would be interesting to study slow crack growth for v < 10–8 m s–1 in the hydrous glass. In this case, however, the applicability of Eq. 1 has to be carefully considered with respect to a possible crack tip blunting promoted by the large amount of dissolved water.
As seen from Eq. 3, log v(KI) will shift right or left along the KI axis if E and γS increases or decreases, respectively. If the change in E and γS is not kinetically affected during fracture, KI equally shifts for any v.
Dissolved water and the resulting decrease of E near the crack tip is discussed as a possible mechanism of stress corrosion (Tomozawa, 2007; Wiederhorn et al., 2013a). In this sense, significant amounts of water dissolved in the hydrous glass during melting should shift log v(KI) for the inert crack growth to the left. However, the opposite is shown in Figure 2, at least for v > 10–7 m s–1, where dissolved water obiously acts as a toughening agent. Furthermore, the effect of dissolved water in the hydrous glass on E, seems not enough to explain any strong shift of log v(KI) in Figure 2. Thus, Eq. 3 includes a rather moderate effect (KI ∼ E0.5) and almost similar values E ≈ 71 GPa and 68 GPa were measured for the dry and the hydrous glass in Kiefer et al. (2019), respectively. Confirming this slight decrease in E, log v(KI) of the hydrous glass is slightly shifted to the left with respect to the dry glass for the slowest crack propagation rates in vacuum.
According to Eq. 3, log v(KI) can also shift to the left if γS is decreased by the presence of water. Such a shift is clearly caused by ambient water. Thus, v = 10–7 m s–1 occurs at KI ≈ 0.40 and 0.67 MPa m0.5 for the hydrous glass in ambient and vacuum conditions, respectively. This shift is stronger than that observed for the dry glass measured in similar conditions. This effect is most vividly seen in Figure 2 by the strongly extended KI range of region II for the hydrous glass. This behavior indicates that ambient water is far more effective than water dissolved in the glass bulk during pressure melting. This way, the toughening effect of dissolved water was overcompensated. One possible reason might be an even higher water concentration near the surface as proved in Han and Tomozawa (1991) for the outermost layer of fractured fused silica glass surfaces. Also, more molecular water is expected since water speciation equilibrium cannot be reached at the low temperature and short times available for ambient water to dissolve to the crack near glass region. Nevertheless, dissolved water may further decrease γS since slow crack growth in the hydrous glass in air occurs at lower KI as in the dry glass.
Crack propagation in nominal dry and hydrous microscope slide glasses containing 6 wt% water was studied in double cantilever beam geometry and was backed up with dynamic mechanical analysis and DTA. Water enrichment of hydrous glass has been achieved by high-pressure melting of glass powder - water mixtures at 500 MPa.
For crack growth in vacuum, dissolved water strongly decreases the slope of log v(KI) indicating more energy dissipation during fracture. Thus, although slow crack growth (v = 10–7 m s–1) is not strongly affected by dissolved water occurring at KI ≈ 0.7 MPa m0.5 as for the dry glass, fast crack growth (v = 101 m s–1) occurs at KI ≈ 1.4 MPa m0.5. Consequently, crack growth in hydrous glass occurs at larger stress intensity factor and dissolved water may be regarded as a toughening agent.
However, in ambient air slow crack growth in the hydrous glass was found to occur at lower stress intensity than in the dry one. v = 10–7 ms–1, e.g., is, respectively reached at KI ≈ 0.4 and 0.5 MPa m0.5 for the hydrous and the dry glass. Consequently, region II is much more extended for the hydrous glass. This effect gives clear evidence that ambient water acts as a strong weakening agent overriding the toughening effect of dissolved water.
The raw data supporting the conclusions of this article will be made available by the authors, without undue reservation, to any qualified researcher upon request.
TW and RM wrote the first draft of the manuscript. SR and TW did the experiments and analysis. TW, RM, RB, HB, JD, and PK contributed to the conception and to critical interpretation of data for the work. All authors contributed to manuscript revision, read and approved the submitted version.
Financial support by the Deutsche Forschungsgemeinschaft (DFG) through its priority program SPP 1594 - Topological Engineering of Ultrastrong Glasses (MU 963/14-2, DE598/22-2, and Be1720/31-2) is gratefully acknowledged.
The authors declare that the research was conducted in the absence of any commercial or financial relationships that could be construed as a potential conflict of interest.
The authors wish to thank all colleagues at division 5.6 Glass at BAM, in particular A. Marek for sample preparation. Additionally, R. Falkenberg is greatfully acknowledged for fruitfull discussions.
Balzer, R., Behrens, H., Reinsch, S., and Fechtelkord, M. (2019a). Structural investigation of hydrous phosphate glasses. Phys. Chem. Glass. Eur. J. Glass Sci. Technol. B 60, 49–61. doi: 10.13036/17533562.60.2.041
Balzer, R., Behrens, H., Schuth, S., Waurischk, T., Reinsch, S., and Muller, R. (2019b). The influence of H2O and SiO2 on the structure of silicoborate glasses. J. Non Cryst. Solids 519, 38–51.
Bauer, U., Behrens, H., Fechtelkord, M., Reinsch, S., and Deubener, J. (2015). Water- and boron speciation in hydrous soda-lime-borate glasses. J. Non Cryst. Solids 423, 58–67. doi: 10.1016/j.jnoncrysol.2015.05.004
Bauer, U., Behrens, H., Reinsch, S., Morin, E. I., and Stebbins, J. F. (2017). Structural investigation of hydrous sodium borosilicate glasses. J. Non Cryst. Solids 465, 39–48. doi: 10.1016/j.jnoncrysol.2017.03.023
Behrens, H., Bauer, U., Reinsch, S., Kiefer, P., Muller, R., and Deubener, J. (2018). Structural relaxation mechanisms in hydrous sodium borosilicate glasses. J. Non Cryst. Solids 497, 30–39. doi: 10.1016/j.jnoncrysol.2018.05.025
Behrens, H., and Stuke, A. (2003). Quantification of H2O contents in silicate glasses using IR spectroscopy - a calibration based on hydrous glasses analyzed by Karl-Fischer titration. Glass Sci. Technol. 76, 176–189.
Brueckner, R. (1964). Charakteristische physikalische Eigenschaften der oxydischen Hauptglasbildner und ihre Beziehung zur Struktur der Gläser. Teil IV: deutung und strukturelle Schlußfolgerungen. Glastechnol. Ber. 37, 536–548.
Celarie, F., Ciccotti, M., and Marliere, C. (2007). Stress-enhanced ion diffusion at the vicinity of a crack tip as evidenced by atomic force microscopy in silicate glasses. J. Non Cryst. Solids 353, 51–68. doi: 10.1016/j.jnoncrysol.2006.09.034
Day, D. E. (1974). The Internal Friction of Glasses Containing Water. Wiss. Zeitschr. Friedrich Schiller Univ. Jena Math. Nat. R. 23, 293–305.
Day, D. E., and Stevels, J. M. (1974). Effect of dissolved water on internal-friction of glass. J. Non Cryst. Solids 14, 165–177. doi: 10.1016/0022-3093(74)90027-1
Deubener, J., Bruckner, R., and Hessenkemper, H. (1992). Nucleation and crystallization kinetics on float glass surfaces. Glastechn. Ber. Glass Sci. Technol. 65, 256–266.
Deubener, J., Muller, R., Behrens, H., and Heide, G. (2003). Water and the glass transition temperature of silicate melts. J. Non Cryst. Solids 330, 268–273. doi: 10.1016/s0022-3093(03)00472-1
Dunning, J., Douglas, B., Miller, M., and Mcdonald, S. (1994). The role of the chemical environment in frictional deformation - stress-corrosion cracking and comminution. Pure Appl. Geophys. 143, 151–178. doi: 10.1007/bf00874327
Evans, A. G., and Johnson, H. (1975). Fracture stress and its dependence on slow crack growth. J. Mater. Sci. 10, 214–222. doi: 10.1007/bf00540345
Fett, T., Guin, J. P., and Wiederhorn, S. M. (2005). Interpretation of effects at the static fatigue limit of soda-lime-silicate glass. Eng. Fract. Mech. 72, 2774–2791. doi: 10.1016/j.engfracmech.2005.07.002
Freiman, S. W., Wiederhorn, S. M., and Mecholsky, J. J. (2009). Environmentally enhanced fracture of glass: a historical perspective. J. Am. Ceram. Soc. 92, 1371–1382. doi: 10.1111/j.1551-2916.2009.03097.x
Gehrke, E., Hahnert, M., and Ullner, C. (1987a). Influence of dissolution rate on crack-growth and fatique of Na2O-Al2O3-B2O3-SiO2 glasses. J. Mater. Sci. 22, 1682–1686. doi: 10.1007/bf01132392
Gehrke, E., Ullner, C., and Hahnert, M. (1987b). Correlation between multistage crack-growth and time-dependent strength in commercial silicate-glasses. 1. Influence of ambient media and types of initial cracks. Glastechn. Ber. Glass Sci. Technol. 60, 268–278.
Gehrke, E., Ullner, C., and Hahnert, M. (1990). Effect of corrosive media on crack-growth of model glasses and commercial silicate-glasses. Glastechn. Ber. Glass Sci. Technol. 63, 255–265.
Gehrke, E., Ullner, C., and Hahnert, M. (1991). Fatigue limit and crack arrest in alkali-containing silicate-glasses. J. Mater. Sci. 26, 5445–5455. doi: 10.1007/bf02403942
Griffith, A. A. (1921). The phenomena of rupture and flow in solids. Philos. Trans. R. Soc. Lond. Ser. A 221, 163–198.
Han, W. T., and Tomozawa, M. (1991). Effect of residual water in silica glass on static fatigue. J. Non Cryst. Solids 127, 97–104. doi: 10.1016/0022-3093(91)90405-u
Hilling, W. B., and Charles, R. J. (1965). “Surfaces, stress-dependent surface reactions, and strength,” in High Strength Materials, ed. V. F. Zackay (New York, NY: John Wiley and Sons).
Ito, S., and Tomozawa, M. (1981). Stress-corrosion of silica glass. J. Am. Ceram. Soc. 64, C160–C160.
Ito, S., and Tomozawa, M. (1982a). Crack blunting of high-silica glass. J. Am. Ceram. Soc. 65, 368–371. doi: 10.1111/j.1151-2916.1982.tb10486.x
Ito, S., and Tomozawa, M. (1982b). Dynamic fatigue of sodium-silicate glasses with high water-content. J. Phys. 43, 611–614.
Kerkhof, F. (1970). Bruchvorgänge in Gläsern. Frankfurth: Verlag der Deutschen Glastechnischen Gesellschaft.
Kiefer, P., Balzer, R., Deubener, J., Behrens, H., Waurischk, T., Reinsch, S., et al. (2019). Density, elastic constants and indentation hardness of hydrous soda-lime-silica glasses. J. Non Cryst. Solids 521:119480. doi: 10.1016/j.jnoncrysol.2019.119480
Lanford, W. A., Davis, K., Lamarche, P., Laursen, T., Groleau, R., and Doremus, R. H. (1979). Hydration of soda-lime glass. J. Non Cryst. Solids 33, 249–266. doi: 10.1016/j.scitotenv.2018.04.178
Langford, S. C., Jensen, L. C., Dickinson, J. T., and Pederson, L. R. (1991). Alkali emission accompanying fracture of sodium-silicate glasses. J. Mater. Res. 6, 1358–1368. doi: 10.1557/jmr.1991.1358
Larché, F. C., and Voorhees, P. W. (1996). Diffusion and stresses: basic thermodynamics. Defect Diffus. Forum 12, 31–36. doi: 10.4028/www.scientific.net/ddf.129-130.31
Le Parc, R., Levelut, C., Pelous, J., Martinez, V., and Champagnon, B. (2006). Influence of fictive temperature and composition of silica glass on anomalous elastic behaviour. J. Phys. Condens. Matter 18, 7507–7527. doi: 10.1088/0953-8984/18/32/001
Lechenault, F., Rountree, C. L., Cousin, F., Bouchaud, J. P., Ponson, L., and Bouchaud, E. (2011). Evidence of deep water penetration in silica during stress corrosion fracture. Phys. Rev. Lett. 106:165504.
Lezzi, P. J., and Tomozawa, M. (2015). An overview of the strengthening of glass fibers by surface stress relaxation. Int. J. Appl. Glass Sci. 6, 34–44. doi: 10.1111/ijag.12108
Liang, R. Y., and Zhou, J. (1997). Energy based approach for crack initiation and propagation in viscoelastic solid. Eng. Fract. Mech. 58, 71–85. doi: 10.1016/s0013-7944(97)00072-6
Marliere, C., Prades, S., Celarie, F., Dalmas, D., Bonamy, D., Guillot, C., et al. (2003). Crack fronts and damage in glass at the nanometre scale. J. Phys. Condens. Matter 15, S2377–S2386.
Marsh, D. M. (1964). Plastic flow in glass. Proc. R. Soc. Lond. Ser. A Math. Phys. Sci. 279, 420–474.
Maugis, D. (1985). Subcritical crack-growth, surface-energy, fracture-toughness, stick slip and embrittlement. J. Mater. Sci. 20, 3041–3073. doi: 10.1007/bf00545170
Mehrer, H. (1996). The effect of pressure on diffusion. Defect Diffus. Forum 12, 57–76. doi: 10.4028/www.scientific.net/ddf.129-130.57
Michalske, T. A., and Freiman, S. W. (1982). A molecular interpretation of stress-corrosion in silica. Nature 295, 511–512. doi: 10.1038/295511a0
Muller, R., Gottschling, P., and Gaber, M. (2005). Water concentration and diffusivity in silicates obtained by vacuum extraction. Glass Sci. Technol. 78, 76–89.
Muraoka, M., and Abe, H. (1996). Subcritical crack growth in silica optical fibers in a wide range of crack velocities. J. Am. Ceram. Soc. 79, 51–57. doi: 10.1111/j.1151-2916.1996.tb07879.x
Nogami, M., and Tomozawa, M. (1984). Effect of stress on water diffusion in silica glass. J. Am. Ceram. Soc. 67, 151–154. doi: 10.1111/j.1151-2916.1984.tb09634.x
OriginLab (2019). OriginLab Releases Origin 2015 Data Analysis and Graphing Software 2014. Available online at: https://www.originlab.com/index.aspx?go=Company/NewsAndEvents/PressRoom&pid=2141 (accessed September 30, 2019).
Pukh, V. P., Baikova, L. G., Kireenko, M. F., and Tikhonova, L. V. (2009). On the kinetics of crack growth in glass. Glass Phys. Chem. 35, 560–566. doi: 10.1134/s1087659609060029
Reinsch, S., Muller, R., Deubener, J., and Behrens, H. (2013). Internal friction of hydrated soda-lime-silicate glasses. J. Chem. Phys. 139:174506. doi: 10.1063/1.4828740
Richter, H. (1983). Zum Einfluß umgebender Medien auf die Rißausbreitung in Glas in einem Zwischenbereich von Bruchgeschwindigkeiten. Glastech. Ber. 56, 402–407.
Seaman, J. H., Lezzi, P. J., Blanchet, T. A., and Tomozawa, M. (2015). Modeling slow crack growth behavior of glass strengthened by a subcritical tensile stress using surface stress relaxation. J. Am. Ceram. Soc. 98, 3075–3086. doi: 10.1111/jace.13710
Simmons, C. J., and Freiman, S. W. (1981). Effect of corrosion processes on subcritical crack-growth in glass. J. Am. Ceram. Soc. 64, 683–686. doi: 10.1111/j.1151-2916.1981.tb15870.x
Takata, M., Tomozawa, M., and Watson, E. B. (1982). Effect of water content on mechanical properties of Na2O-SiO2 glasses. J. Am. Ceram. Soc. 65, C156–C157.
Tomozawa, M. (2007). “Role of water in fracture of glass,” in Proceedings of the 4th International Workshop on Fracture and Flow of Advanced Glasses FAAG, Troy, NY.
Tomozawa, M., Li, H., and Davis, K. M. (1994). Water diffusion, oxygen vacancy annihilation and structural relaxation in silica glasses. J. Non Cryst. Solids 179, 162–169. doi: 10.1016/0022-3093(94)90693-9
Ullner, C., and Gehrke, E. (1990). Mechanism of mechanical strength increase of soda lime glass by aging - comment. J. Am. Ceram. Soc. 73, 1461–1463. doi: 10.1111/j.1151-2916.1990.tb05229.x
Weichert, R., and Schönert, K. (1973). On the temperature rise at the tip of a fast running crack. J. Phys. Mech. Sol. 22, 127–133. doi: 10.1016/0022-5096(74)90018-0
Wiederhorn, S. M. (1967). Influence of water vapor on crack propagation in soda-lime glass. J. Am. Ceram. Soc. 50, 407–414. doi: 10.1111/j.1151-2916.1967.tb15145.x
Wiederhorn, S. M., and Bolz, L. H. (1970). Stress corrosion and static fatigue of glass. J. Am. Ceram. Soc. 53, 543–548. doi: 10.1111/j.1151-2916.1970.tb15962.x
Wiederhorn, S. M., Diness, A. M., and Heuer, A. H. (1974). Fracture of glass in vacuum. J. Am. Ceram. Soc. 57, 336–341.
Wiederhorn, S. M., Fett, T., Guin, J. P., and Ciccotti, M. (2013a). Griffith cracks at the nanoscale. Int. J. Appl. Glass Sci. 4, 76–86. doi: 10.1111/ijag.12025
Wiederhorn, S. M., Fett, T., Rizzi, G., Hoffmann, M. J., and Guin, J. P. (2013b). The effect of water penetration on crack growth in silica glass. Eng. Fract. Mech. 101, 3–16. doi: 10.1016/j.engfracmech.2012.04.026
Wiederhorn, S. M., Fett, T., Rizzi, G., Hoffmann, M. J., and Guin, J. P. (2013c). Water penetration-its effect on the strength and toughness of silica glass. Metall. Mater. Trans. A Phys. Metall. Mater. Sci. 44A, 1164–1174. doi: 10.1007/s11661-012-1333-z
Keywords: soda-lime silicate glass, water content, stable crack growth, DCB geometry, stress intensity factor, internal friction
Citation: Waurischk T, Müller R, Reinsch S, Kiefer P, Deubener J, Balzer R and Behrens H (2020) Crack Growth in Hydrous Soda-Lime Silicate Glass. Front. Mater. 7:66. doi: 10.3389/fmats.2020.00066
Received: 06 January 2020; Accepted: 03 March 2020;
Published: 25 March 2020.
Edited by:
Randall Youngman, Corning Inc., United StatesReviewed by:
Jared Seaman Aaldenberg, Corning Inc., United StatesCopyright © 2020 Waurischk, Müller, Reinsch, Kiefer, Deubener, Balzer and Behrens. This is an open-access article distributed under the terms of the Creative Commons Attribution License (CC BY). The use, distribution or reproduction in other forums is permitted, provided the original author(s) and the copyright owner(s) are credited and that the original publication in this journal is cited, in accordance with accepted academic practice. No use, distribution or reproduction is permitted which does not comply with these terms.
*Correspondence: Ralf Müller, cmFsZi5tdWVsbGVyQGJhbS5kZQ==
Disclaimer: All claims expressed in this article are solely those of the authors and do not necessarily represent those of their affiliated organizations, or those of the publisher, the editors and the reviewers. Any product that may be evaluated in this article or claim that may be made by its manufacturer is not guaranteed or endorsed by the publisher.
Research integrity at Frontiers
Learn more about the work of our research integrity team to safeguard the quality of each article we publish.