 R. Montoya
 V. Nagel
- 1Polo Universitario de Tecnología Avanzada (PUNTA), Facultad de Química, Departamento de Metalurgia, Universidad Nacional Autónoma de México (UNAM), Ciudad Apodaca, Mexico
- 2Centro de Investigaciones en Arquitectura, Urbanismo y Paisaje (CIAUP), Facultad de Arquitectura (FA), Universidad Nacional Autónoma de México (UNAM), Coyoacán, Mexico
In this work the Richard's equation with proper boundary conditions was solved by the Finite Element Method in order to simulate the capillary water entrance in mortar. On the boundaries subjected to free water, a constant Dirichlet boundary condition was imposed assuming permanent saturation water content, on the insulated boundaries a nil flux of water was fixed. Meanwhile on the boundaries in contact with a controlled external atmosphere, a physicochemical model was used in order to simulate the water evaporation process. Three special sample geometries, with and without cracks, were studied. Findings identified the initial water content as a very important parameter in the water uptake phenomenon. Once the model for the water entrance was tested with pure water, a governing equation for the chloride transport was coupled with the Richard's equation in order to simulate both the water and chloride transport into simulated mortar samples in contact with sea water. The borders were subjected to different physical conditions for the sake of a better understanding of the role of boundary conditions in the transport of chloride. The governing equation takes into account the convective effect of the water entrance, the diffusion process, and the chloride binding reaction.
1. Introduction
If there is a construction material to characterize the twentieth century it is, undoubtedly, reinforced concrete. Thousands of buildings all around the world were put up exploiting the material in a plurality of creative and innovative ways. Architects and engineers of the modern era pushed the material to the limit both structurally and architecturally. If, on the one hand, several exceptional structures prove the potential of reinforced concrete, on the other hand, the limited understanding of its durability has caused the decay of many other significant structures.
In the case of many modern constructions, the degradation comes from the mistaken belief that reinforced concrete was an exceptionally durable and maintenance-free material. Astonishingly, in our century, people have witnessed how even icons of the Modern Movement collapsed, as the Morandi Bridge in Genoa, Italy1. Certainly, we should bear in mind that some decades ago concepts such as lifespan of buildings or structures were not commonly discussed. And issues like the effects of pollutants and climate, particularly the salty sea air, on corrosion of reinforced structures were barely mentioned at the beginning of the last century. Therefore, the construction science have derived in new challenges: the conservation and restoration of the heritage concrete buildings of the twentieth century.
Therefore, mathematical models that simulate the impact of chlorides on concrete's reinforcement steel bars and the potential of these theoretical studies for the architectural heritage' evaluation of the twentieth century is a fundamental issue for the conservation of works of the Modern Movement.
It is noteworthy that the list of buildings made by reinforced concrete cataloged and protected by UNESCO increases every year. For instance, the recent statement of Frank Lloyd Wright's work (2019) which adds to the architectural oeuvre of Le Corbusier, declared as an outstanding contribution to the Modern Movement (2016), with works in a wide geography that includes Argentina, Belgium, France, Germany, India, Japan and Switzerland. Also, it is remarkable the set of buildings of the National Autonomous University of Mexico (UNAM) (2007), since they represent a unique example of the Modern Movement integrating urbanism, architecture, engineering, landscape design, and fine arts with references to local traditions. The previous examples are just to name a few emblematic sites, now world heritage.
Given this panorama, it is essential to have digital tools to provide a quick qualitative overview of the physical state of the buildings, including the state of corrosion of their reinforcement. The mathematical models applied to conservation of the architecture of the Modern Movement will not only complement the laboratory analysis, they represent essential means to perform an urgent, critical and effective evaluation of the representative works of the twentieth-century architectural heritage.
One of the most important, catastrophic, and common ways of degradation of reinforced concrete structures is the corrosion of the steel reinforcement due to the ingress of aggressive species. Hence it becomes essential to know the content and distribution of these agents inside the concrete in order to have a realistic idea about the state of both the steel rebar and the building, respectively.
Several studies, experimental, and theoretical, have been carried out in this area and most of them have focused on the content and distribution of chloride, oxygen, carbon dioxide, and water; since all of them are critical for the corrosion process of the steel rebar (Hall, 1989; Carpenter et al., 1993; Martys and Ferrariss, 1997; Martin-Perez, 1999; Goual et al., 2000; Baklouti et al., 2001; Isgor and Razaqpur, 2006; Ozbolt et al., 2010; Wang and Ueda, 2011; Van Belleghem et al., 2016).
Although the mechanism for the destruction of the passive layer, stable at high pH values, of the steel re-bar is well known in the presence of CO2, since this gas induces the carbonation phenomenon decreasing the global pH (Isgor, 2001; Isgor and Razaqpur, 2004), the mechanism for the destruction of this passive film, in the presence of chlorides, is still under discussion. Nevertheless, there is generally accepted that the chloride acts as a catalyst in the dissolution of the iron (Martin-Perez, 1999) (except in strong alkaline pore solutions with pH larger than approximately 13; Mammoliti et al., 1996; Glass and Buenfeld, 1997).
Since the entrance of dissolved species depends strongly on the water uptake, it becomes a mandatory task to know the ingress, and distribution, of water into concrete. Historically, the most common experimental method used to quantify the entrance of water has been the gravimetrical technique. This method is cheap and provides relatively good results. However, it has an important drawback: it lacks water spatial distribution. It was not until the use of the Magnetic Resonance Imagining (MRI) (Carpenter et al., 1993; Hall, 2007) in the concrete field when the transient spatial water distribution was finally experimentally measured. Once the MRI was applied to study the water uptake in building materials, results showed a strong analogy with the water filtration into soil. Water transport in porous media is classified into permeability and sorptivity. Permeability is related to the passage of a fluid through a saturated material under a differential pressure; sorptivity, on the other hand, characterizes the capacity of an unsaturated material to absorb and propagate water by capillary suction forces (Wang and Ueda, 2011). After these findings obtained by MRI, and working under non-saturated conditions, the Darcy's law and the Richard's equation were used to numerically simulate the capillary water uptake into mortars and concrete.
The aim of this work is to build and solve a mathematical model to study the coupled entrance of both water and chloride into concrete, taking into account realistic boundary conditions for the water evaporation process that is carried out on the non-insulated boundaries of the concrete.
The capillary water absorption was modeled using the Richard's equation and proper initial and boundary conditions. It was considered that all surfaces in contact with free water had a saturated water content, including the inner walls of cracks (Gardner, 2012; Van Belleghem et al., 2016). On the other hand, a thermodynamic model was implemented as a boundary condition, to take into account the outward flux of water, on borders where the water content was higher than the external room humidity. In the case of chloride ions both diffusion and convection, caused by water movement, were taken into account in the governing equations deduced from the mass transport theory in porous media (Bear and Bachmat, 1991). The binding process of Cl− was also included.
It is important to point out that in the fight against the physical deterioration that compromises the integrity of the modernist architecture legacy, this analysis is aimed not just at materials or corrosion specialists but also at scholars in the preservation of modern buildings looking for digital tools to visualize the global state of structures.
2. Modeling
To describe the distribution of water in saturated media it is well known that the Darcy's law can be applied (Bear and Bachmat, 1991; Goual et al., 2000). Nevertheless, for conditions where concrete is not fully immersed in water, the sorptivity (and not the permeability) characterizes the transport of water in porous materials by capillary suction forces and (since non-swelling soils are present) the general Darcy's law can be simplified to the Richard's equation taking into account the mass conservation equation (Bear and Bachmat, 1991; Goual et al., 2000).
So, the governing equation for water capillary absorption could be expressed as:
where D(θ) is called the water diffusivity and is defined as , being n a shape factor, the ratio , with θs, θi, and θ the saturated, initial, and instantaneous water content, respectively. D0 is a function of the sorptivity S, which is the water uptake rate in any porous material exposed to a free water source, and is defined as (Wang and Ueda, 2011; Van Belleghem et al., 2016):
Where s is related with i, the cumulative volume of absorbed water per unit area of the inflow surface at elapsed time t, as:
Using porosity values reported in Martys and Ferrariss (1997), Ozbolt et al. (2010), Wang and Ueda (2011) and Van Belleghem et al. (2016) (between 0.1 and 0.2) it is possible to assume values of D0 around 1.0 * 10−10 and n between 6 and 6.4.
With regard to the chloride, the mechanism of entrance and transport into mortars was described according to the theory of mass transport in porous media (particularly when just a species diffuses in a single fluid, which at the same time fills the void space of the solid porous material; Bear and Bachmat, 1991). Then, the governing equation is written as:
where C is the concentration of chloride in the water pore solution, Cbd the chloride adsorbed on the solid phase and Vf the water velocity inside the mortar. A second governing equation was required to solve for the above two variables:
kr being the binding rate coefficient and α a constant, related with the binding mechanism in hardened cement paste, which can take the value of 0.7 (Ozbolt et al., 2010). The absence of the variable θ in this latter equation means that the water content does not directly affect the bound chloride.
Regarding the chloride diffusion coefficient, DCl, it strongly depends on many parameters such as humidity, porosity, temperature, cement hydration time, etc., and its mathematical empirical relation is not indeed straightforward. It is used to be expressed as the product of three functions depending on the pore relative humidity, temperature and time of hydration (Martin-Perez, 1999):
DCl/ref being the reference value of DCl evaluated at standard conditions, and the three function - coefficients are defined as:
where Hc is the humidity when DCl raises half of its maximum value, U the activation energy of the chloride diffusion process, R the universal gas constant, T the operation temperature, Tref = 296K the temperature used to get DCl/ref, t the hydration time and tcrit the time when the diffusivity becomes constant.
However, under specific conditions (when the hydration time is bigger than 180 days) f3(t) can be approximated as 1 (Ozbolt et al., 2010).
With this in mind, it is important to point out that Equation (8) is H dependent, meanwhile Equation (5) depends on θ. So, it is mandatory to transform the pore relative humidity into water content values to use this system of equations. For the present paper such transformation was achieved using the adsorption isotherms from the model Brunauer-Skalny-Bodor and are described in detail in Martin-Perez (1999).
2.1. Boundary Conditions
The physical and geometrical configuration of a prism (160 · 40 · 40mm) with its faces being insulated but the bottom, which is in contact with free water, can be simplified to a 2D situation (Figure 1A). On the other hand, however, the case of Figure 1B, where evaporation takes place on some boundaries, can not be simplified into a 2D situation since the water evaporates through five sides (4 walls and the top boundary), while in the 2D simplification it can be considered just three sides. However, a 2D approximation is built up using a correction factor to consider the outward flux of water on the frontal and back sides of the domain. A Dirichlet condition (in this case θ = 9.35%) was fixed on the boundary exposed to free water. The saturation water content reported in Van Belleghem et al. (2016) was used in this work. On the other boundaries two kinds of Neumann conditions were used: insulated boundaries and those with an outward flux of water due to vaporization.
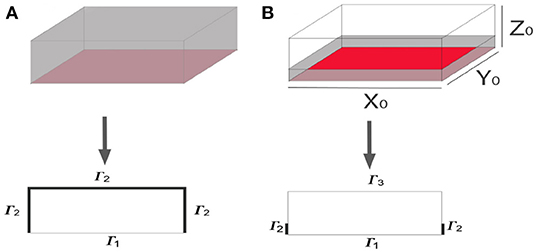
Figure 1. Dimensional reduction of 3D physical situations. (A) Physical situation with Γ1 in contact with free water and an insulated boundary Γ2. (B) System with three boundary conditions: a Dirichlet type on Γ1 describing the boundary in contact with free water, a no nil Neumann type on Γ2 describing the outward flux of water, and a nil Neumann type on Γ3 used to describe the insulated boundary.
For the latter case the mass flux of vaporization m was obtained from:
where w is the absolute moisture on the concrete boundary, w∞ the corresponding moisture in the humidity chamber and km the mass transference coefficient estimated from the heat transfer coefficient h using the Lewis dimensionless number Lc according to the Chilton-Colburn analogy (Baklouti et al., 2001):
Where, Cpair is the specific heat of air and CpH2O the specific heat of water. The above moistures can be approximated as
and
rh∞ being the relative humidity in the chamber, p the atmospheric pressure and ps the vapor pressure of water.
According to relations 13 and 14, the outward flux of water could take values from 0 to 6.85E-6 kg/sm2 for 100 and 0 % of relative humidity in the chamber, respectively. One of the simplifications of the model is the assumption that no condensation on the boundaries takes place under the conditions (20°C and 60% of relative humidity) fixed in the humidity chamber.
Figure 2A is the first simulated case in this work, the bottom border is exposed to free water (red boundary) meanwhile both insulated and open frontiers (where an evaporation process is being carried out) were considered as in the simplified case of Figure 1B. On the other hand, Figures 2B,C show variations of the original geometry that were also included in this work in order to consider cracks and no unidirectional water penetration. Due to the size of the cracks (Gardner, 2012), its position (in direct contact with free water) and the ideal porosity in this area (≈1) a saturated water content condition was assumed there since the beginning of the absorption process.
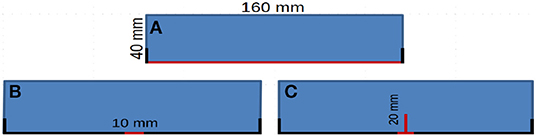
Figure 2. Simulated situations where the red boundaries indicate the borders in contact with free water and the thick bold lines represent insulated borders. On the leftover boundaries, an evaporation process takes place. (A) The complete bottom boundary exposed to free water. (B) Just a tiny section of the bottom boundary exposed to free water. (C) Sample with a crack exposed to water.
Regarding the Chloride, and according to Shafei et al. (2012), the boundary condition imposed on a concrete border, in permanent contact with free sea water, could be assumed as 17.7 kg/m3 (of pore solution). For this particular agent different hypothetical cases were solved in order to better understand the role of boundary conditions.
2.2. General Initial Boundary Value Problem
In short, according to the previous sections the general initial boundary value problem for the water content θ is written as:
where m* is provided by Equation (11) using proper units, was considered as 0.052 (Van Belleghem et al., 2016) and here n means the outward normal vector to the surface.
The correspondent initial boundary value problem for chloride transport is:
and for the bound chloride Cbd:
Where, Γ1 is a boundary in contact with free water, Γ2 an insulated boundary, and Γ3 a non-insulated boundary in contact with a controlled (temperature, humidity, and pressure) atmosphere. Once the initial boundary value problems were written, the weak formulation of each one was posed and the approximated solution was built up by the finite element method (FEM) using a home-made numerical code written in Python language.
The set of Equations (15), (16), and (17) were simultaneously solved in time. The mesh used depended on the geometrical configuration of the domain, being finer where Dirichlet conditions were imposed: on the cracks and the bottom boundaries exposed to free water, as shown in Figure 3.
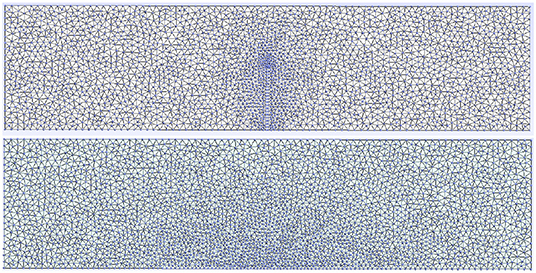
Figure 3. Meshing used when 1 crack and the central bottom boundary are exposed to free water. The mesh is finer where the Dirichlet conditions were imposed according to the physical situation described in Figure 2.
3. Results and Discussion
As Figure 4A shows, the influence of D0 on the water absorption is very important and could be the difference between good and poor numerical approximations. Because of this, selected information from literature, experimental data, and numerical simulations should be studied to properly estimate this parameter. Indeed, Case (a) of Figure 1 is a suitable situation to evaluate D0 since it is an uni-dimensional water absorption situation where relations 2, 3, and 4 are valid (Wang and Ueda, 2011). In this work D0 was approximated as 1·10−10 . Regarding θi, its reference value for the numerical simulations was 0.055 since it has been already reported for mortars (Van Belleghem et al., 2016). In Figure 4B is possible to see the influence of this last parameter in the uni-dimensional water absorption process case (a) of Figure 1. The effect of θi in other configurations (cases b and c of Figure 2) are presented in Figures 4C,D, respectively. From Figure 4, it is clear that if the mass of water entering into the sample is divided by the borders surface in contact with free water, then the situations with the larger area exposed to free water (cases a and b) have the smallest water absorption results.
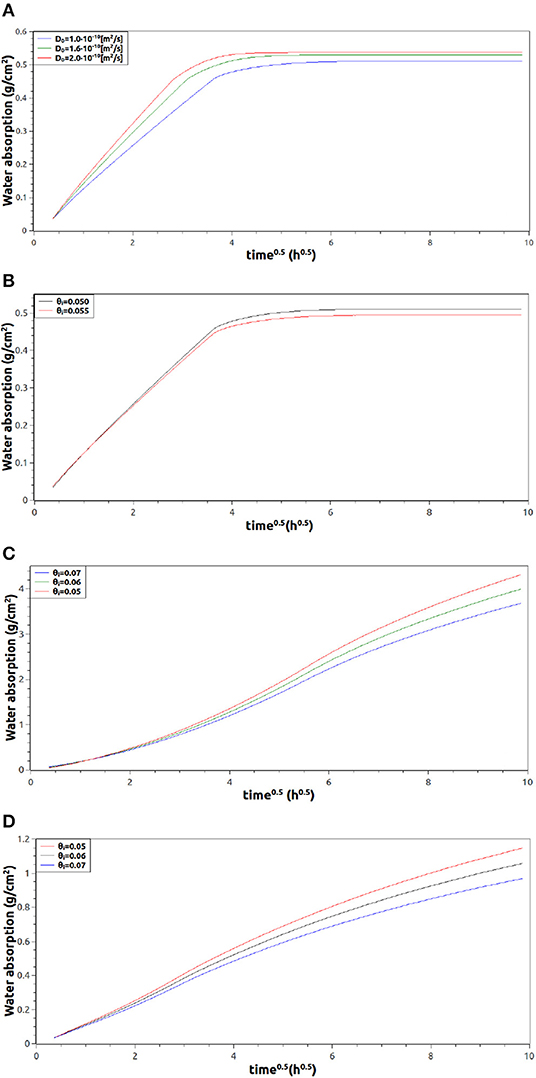
Figure 4. Numerical water absorption profiles, divided by the exposed area to free water, as a function of time in different geometrical configurations. (A,B) Profiles of case (a) in Figure 2 varying D0 and θi, respectively. (C,D) Profiles of water absorption varying θi corresponding to cases (b and c) in Figure 2, respectively.
Figure 5 shows the cross section view of the transient water content distribution predicted when both cases (a and c) in Figure 2 where numerically solved. The meniscus presented on the top corners of the water front of case (a), at 4 and 8 h, is induced by the evaporation process taking place on both the lateral and top borders.
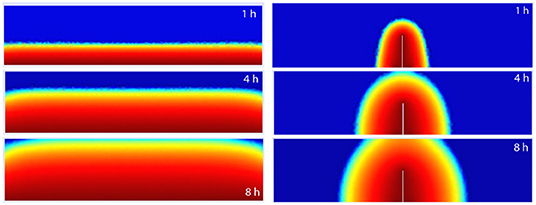
Figure 5. 2D time dependent water content distributions of cases (a and c) of Figure 2, respectively.
On the other hand, also from Figure 5, it is straightforward to observe that the larger the area in contact with free water, the more water enters into concrete at any moment.
As far as the agreement between numerical and experimental results is concerned, most of the simulated cases are in tune with experimental results (Van Belleghem et al., 2016; Van den Heede et al., 2016), and the small deviations could be explained in terms of θi. Nevertheless, case (c) in Figure 4, that with the fastest entrance of water, presented poor numerical results. Even the expected quasi-linear behavior was not obtained for the first part of the profiles.
This latter situation was fixed working in 3D, where no correction factors were required because all boundaries were included in the boundary value problem. Figure 6A shows the simulated water absorption profile with a quasi-linear behavior in its first stage. Such an improvement was achieved not only in the worst 2D approximation (with the fastest water uptake) but even in the simplest situation (the slowest) as can be seen in Figure 6B. Even when the results are very similar in 2D and 3D (compare Figure 4B and Figure 6B), the transition stage between the semi-linear behavior and the saturated zone is softer and more natural when the problem is solved in 3D.
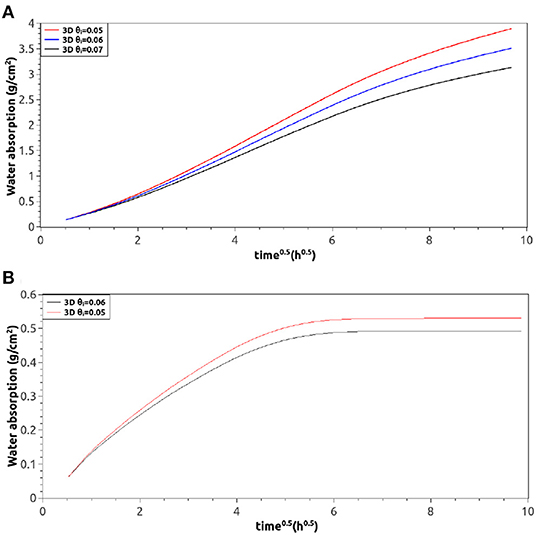
Figure 6. 3D numerical water absorption profiles. (A) Profiles of case (b) in Figure 2 using different θi, (B) profiles of case (a) in Figure 2 using different θi.
Once the water uptake model was tested, taking into account the vaporization boundary condition 11, the chloride corresponding equations were coupled and the complete set of equations was simultaneously solved for the domain shown in Figure 1A considering a sample thickness of 0.016 m.
Figure 7A shows some transient chloride profiles. Both the penetration distance and profile shapes are in agreement with literature even using new governing equations (Meijers, 2003). The influence of the convective term used in Equation (5) becomes clear when the boundary condition, applied on the bottom border, switches from a full immersion situation to a stage where water evaporation takes place (simulating the rise or fall of tide, for example). From a mathematical point of view this situation means, for the water content θ, a transition from a Dirichlet condition (water saturation) to a no nil Neumann type (Equation 11). Whilst for the chloride species it means switching from a Dirichlet condition (17.7 kg/m3) to a nil Neumann type (since no transference of chloride is possible on the border air/mortar-surface).
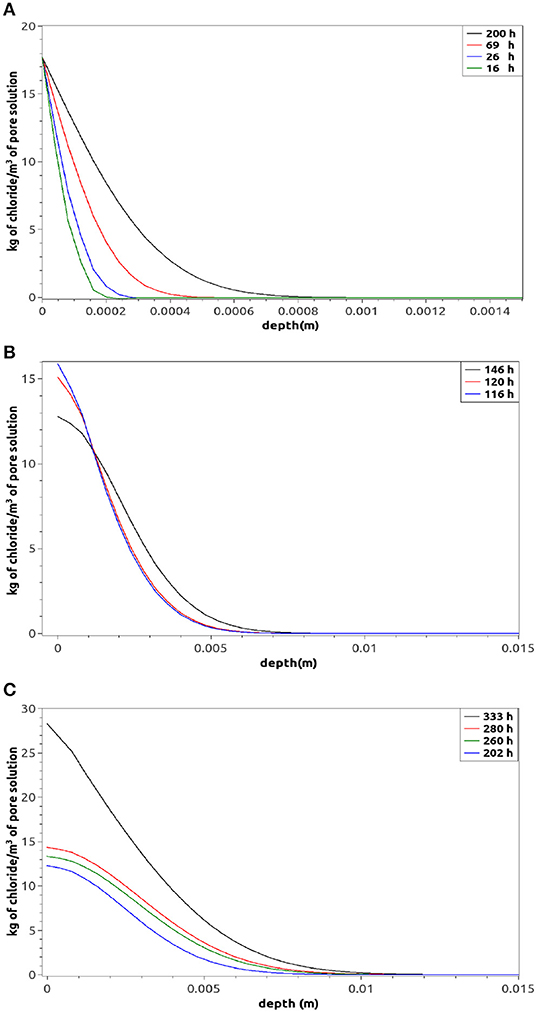
Figure 7. Numerical free chloride profiles for the case (a) in Figure 1 when (A) the bottom boundary is immersed in water, (B) the condition 11 is imposed at 115 min on the bottom boundary, and (C) the condition 11 is imposed at 115 min on the bottom boundary (longer periods after the change of condition).
Figure 7B shows that as soon as the sea water is not supplied anymore (116h) and the water starts to be evaporated on the border, the chloride concentration decreases and then two well defined zones are generated: where the convection is more important (close to the bottom border) and the diffusion, the dominant transport phenomenon almost everywhere inside the sample. Nevertheless, after a period of equilibrium between both mechanisms (almost 85 h, see Figure 7C) the concentration of chloride increases again on the surface. This consequence is expected to occur, since the less quantity of water the more concentrated the pore solution. Moreover, the constant movement of water from the bulk, toward the boundary, provokes an accumulation of chloride on the border.
The limit of this accumulating chloride on the border depends on the equilibrium of the internal (into mortar) and external (in the chamber) relative humidity.
This mechanism of wetting and drying explains why it has been reported (Shafei et al., 2012) that, for concrete structures in tidal or splash zones, the chloride concentration can be even 5 times bigger than the corresponding concentration reported under full immersion conditions. Nevertheless, as far as the authors are aware, still no experimental evidence support this.
Nevertheless, the above analysis does not explain why, even for situations under permanent immersion conditions, the chloride concentration on the surface increases in time. Figure 8A answers this question, as it shows how the concentration of bound chloride increases in time at the border in contact with free sea water (its value is not fixed on the boundary, as it is indeed the free chloride, see Equations 16 and 17). In short, when a mortar or concrete sample is permanently in contact with free sea water, the global quantity of chloride on an exposed border increases in time due to the bound chloride reactions.
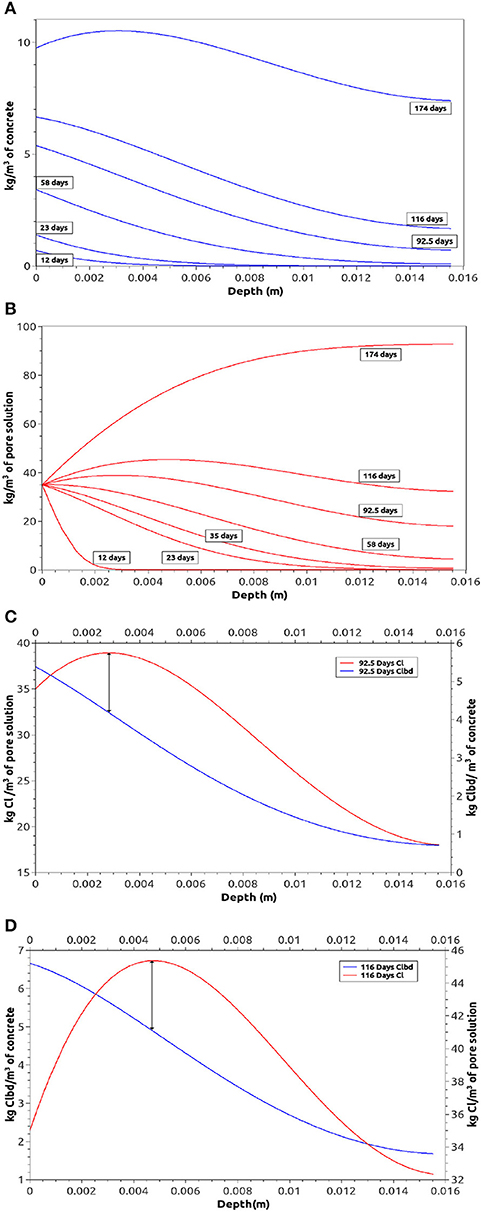
Figure 8. Numerical chloride profiles in thin samples. (A) Bound chloride profiles on time, (B) free Chloride profiles on time, (C) bound and free chloride profiles after 92 days, (D) bound and free chloride profiles after 116 days.
Moreover, for longer periods of permanent exposure to sea water, other important phenomenon takes place in the mortar sample: after a period of time the chloride concentration is higher inside the concrete than on the border, as shown in Figure 8B. This new front of diffusion has already been reported (Martin-Perez, 1999) when wet and dry cycles are taking place on the border. Nevertheless, in samples permanently immersed in sea water, this effect is explained as (a) the continuous entrance of chloride into concrete (mainly by diffusion in saturated samples), (b) the limited quantity of water inside the concrete (which increases the chloride concentration), and (c) the most important: the bound chloride, which has a strong influence in the maximum concentration of free chloride.
The propagation of a maximum chloride concentration inside the sample is also shown in Figure 8: meanwhile the maximum chloride concentration is inside the sample, there is a clear mathematical relation (Equation 17) that links both the free and bound chlorides. The maximum free chloride concentration corresponds to an inflection point in the bound chloride profiles as clearly indicated in Figures 8C,D.
At this point, it is important to remark that even if in the first stages of the chloride entrance process, the numerical trends are in tune with findings reported in literature. Due to the unusual thicknesses of samples taken into account in this work and the lack of experimental data reported by scholars, it has not been possible to corroborate trends for longer periods yet.
4. Concluding Remarks
Both Richard's equation and the vaporization process of water, used as natural boundary condition, properly describe the water uptake phenomenon in mortar samples with borders exposed to external controlled atmospheres. However, it was found that the model is strongly sensitive to the initial water content. The rate of water uptake does not depend on the area exposed to free water but on how the water source is surrounded by the mortar porosity structure which provokes either multi or uni-dimensional entrance of water.
Findings proved the relevance of the convection effects on the chloride distribution, especially when the boundary conditions include evaporation of water. Findings demonstrated that, in thin samples and under full immersion conditions, it is possible to have a maximum chloride concentration far from the borders. The roll of the bound chloride to explain such behavior could be essential. Nevertheless, more experimental investigation should be carried out.
This research provides an interesting frame of reference for the conservation and restoration of the heritage concrete buildings of the twentieth century. However, while this work only considers the chloride ions, a theoretical analysis that contemplates the pH drop by the entrance of Carbon Dioxide should indeed complement this study.
Data Availability Statement
The datasets generated for this study are available on request to the corresponding author.
Author Contributions
RM made the numerical simulations and the discussion of the result. VN contributed within all other sections in the document.
Conflict of Interest
The authors declare that the research was conducted in the absence of any commercial or financial relationships that could be construed as a potential conflict of interest.
Acknowledgments
Authors acknowledge the support provided by the UNAM-DGAPA-PAPIIT program (TA100318) and UNAM-DGAPA-Becas Posdoctorales program Fortalecimiento Académico.
Footnote
1. ^https://www.theguardian.com/cities/2019/feb/26/what-caused-the-genoa-morandi-bridge-collapse-and-the-end-of-an-italian-national-myth
References
Baklouti, M., Midoux, N., Mazaudier, F., and Feron, D. (2001). Estimation of the atmospheric corrosion on metal containers in industrial waste disposal. J Hazardous Mater B. 85, 273–290. doi: 10.1016/S0304-3894(01)00238-2
Bear, J, and Bachmat, Y. (1991). Introduction to Modelling of Transport Phenomena in Porous Media. Dordrecht: Kluwer Academic Publishers.
Carpenter, T. A., Davies, E. S., Hall, C., Hall, L. D., Hoff, W. D., and Wilson, M. A. (1993). Capillary water migration in rock: process and material properties examined by NMR imaging. Mater Struct. 26, 286–296.
Gardner, D. (2012). Investigation of capillary flow in discrete cracks in cementitious materials. Cement Concrete Res. 42:972–81. doi: 10.1016/j.cemconres.2012.03.017
Glass, G. K., and Buenfeld, N. R. (1997). The presentation of the chloride threshold level for corrosion of steel in concrete. Corrosion Sci. 39, 1001–1013.
Goual, M. S., de Barquin, F., Benmalek, M. L., Bali, A., and Queneudec, M. (2000). Estimation of the capillary transport coefficient of clayey aerated concrete using a gravimetric technique. Cement Concrete Res. 30, 1559–1563. doi: 10.1016/S0008-8846(00)00379-3
Hall, C. (1989). Water sorptivity of mortar and concretes: a review. Magazine Concrete Res. 41, 51–61.
Hall, C. (2007). Anomalous diffusion in unsaturated flow: fact or fiction? Cement Concrete Res. 37, 378–385. doi: 10.1016/j.cemconres.2006.10.004
Isgor, O. B. (2001). A durability model for chloride and carbonation induced steel corrosion in reinforced concrete members (Ph.D. dissertation). Carleton University, Ottawa, ON, Canada.
Isgor, O. B., and Razaqpur, A. G. (2004). Finite element modeling of coupled heat transfer, moisture transport and carbonation processes in concrete structures. Cement Concrete Composites 26, 57–73. doi: 10.1016/S0958-9465(02)00125-7
Isgor, O. B., and Razaqpur, A. G. (2006). Advanced modelling of concrete deterioration due to reinforcement corrosion. Can. J. Civ. Eng. 33, 707–718. doi: 10.1139/l06-007
Mammoliti, L. T., Brown, L. C., Hansson, C. M., and Hope, B. B. (1996). The influence of surface finish of reinforcing steel and pH of the test solution on the chloride threshold concentration for corrosion initiation in synthetic pore solutions. Cement Concrete Res. 26, 545–550.
Martin-Perez, B. (1999). Service life modeling of RC highway structures expose to chlorides (Ph.D. thesis). University of Toronto, Toronto, ON, Canada.
Martys, N. S., and Ferrariss, C. E. (1997). Capillary transport in mortars and concrete. Cement Concrete Res. 27, 747–760.
Meijers, S. J. H. (2003). Computational Modelling of Chloride Ingress in Concrete. Delft: Delft University Press.
Ozbolt, J., Balabanic, Y., Periskic, G., and Kuster, M. (2010). Modelling the effect of damage on transport processes in concrete. Construct Build Mater. 24, 1638–1648. doi: 10.1016/j.conbuildmat.2010.02.028
Shafei, B., Alipour, A., and Shinozuka, M. (2012). Prediction of corrosion initiation in reinforced concrete members subjected to environmental stressors: a finite-element framework. Cement Concrete Res. 42, 365—376. doi: 10.1016/j.cemconres.2011.11.001
Van Belleghem, B., Montoya, R., Dewanckele, J., Van den Steen, N., De Graeve, I., Deconinck, J., et al. (2016). Capillary water absorption in cracked and uncracked mortar-a comparison between experimental study and finite element analysis. Construct Build. Mater. 110, 154–162. doi: 10.1016/j.conbuildmat.2016.02.027
Van den Heede, P., Van Belleghem, B., Alderete, N., Van Tittelboom, K., and De Belie, N. (2016). Neutron radiography based visualization and profiling of water uptake in (un) cracked and autonomously healed cementitious materials. Materials 9:311. doi: 10.3390/ma9050311
Keywords: capillary water absorption, chloride, modeling, finite element analysis, mortars
Citation: Montoya R and Nagel V (2020) Capillary Water Absorption and Chloride Transport Into Mortar Samples: A Finite Element Analysis. Front. Mater. 7:28. doi: 10.3389/fmats.2020.00028
Received: 29 September 2019; Accepted: 22 January 2020;
Published: 14 February 2020.
Edited by:
David M. Bastidas, University of Akron, United StatesReviewed by:
Santiago Fajardo, Centro Nacional De Investigaciones Metalurgicas (CENIM), SpainEstibaliz Briz, University of the Basque Country, Spain
Copyright © 2020 Montoya and Nagel. This is an open-access article distributed under the terms of the Creative Commons Attribution License (CC BY). The use, distribution or reproduction in other forums is permitted, provided the original author(s) and the copyright owner(s) are credited and that the original publication in this journal is cited, in accordance with accepted academic practice. No use, distribution or reproduction is permitted which does not comply with these terms.
*Correspondence: R. Montoya, cm1vbnRveWFsQHVuYW0ubXg=