 Mateus G. Masteghin
 Denis R. M. Godoi
 Marcelo O. Orlandi
95% of researchers rate our articles as excellent or good
Learn more about the work of our research integrity team to safeguard the quality of each article we publish.
Find out more
ORIGINAL RESEARCH article
Front. Mater. , 16 July 2019
Sec. Ceramics and Glass
Volume 6 - 2019 | https://doi.org/10.3389/fmats.2019.00171
This article is part of the Research Topic Nano-Hetero-Structures for Chemical Sensing: Opportunities and Challenges View all 23 articles
There is an increasing concern about NOx emission, and many studies have been carried out using metal oxide semiconductors (MOS) aiming its detection. Among the MOS, the SnO micro-disks present a high sensor response and a great selectivity toward NO2. Nevertheless, sensor signal, limit of detection (LOD), and recovery time are related to the experimental setup used to carry on the measurements. Thus, two different heating methods (self-heating and external heating) have been carried out to understand in what manner they change the sensor properties of the SnO micro-disks onto interdigitated electrodes. The external heating method presented higher sensor signal, best LOD, and lower recovery time, mainly due to the lack of a temperature gradient between the SnO disks and the chamber atmosphere. On the other hand, response time was shown to be the same regardless of the method. Briefly, the authors used thermodynamic equations to better understand the temperature effect on the gas-solid interactions occurring between SnO disks and NO2 species.
Human activities such as the use of mobile sources and electric power plants are major contributors that generate NO2, which is one of the compounds in the NOx family (Nagase and Funatsu, 1990; Correa, 1993). In addition to the intrinsic toxicity of the NO2 (Azoulay-Dupuis et al., 1983) and its eutrophication aptitude (Glibert et al., 2005), the NO2 reacts with other molecules in the atmosphere giving rise to acid rain and O3 (likewise toxic in the troposphere) (Rietjens et al., 1986; Chang et al., 1988). Furthermore, among the NOx species, NO2 has the longest lifespan making it difficult to control as this causes spreading (Crutzen, 1979). In this context, there is a need to use highly sensitive and selective gas sensor devices for the detection of this pollutant.
Gas sensor devices based on chemo-resistive metal oxide semiconductors (MOSs), (Barsan and Weimar, 2001; Comini et al., 2002; Barsan et al., 2007; Lee, 2009; Wang et al., 2010; Jin et al., 2017) such as SnO2 (Batzill and Diebold, 2005; Ren et al., 2015; Xu et al., 2015; Cheng et al., 2016; Kida et al., 2016; Li et al., 2016), ZnO (Xu et al., 2000; Wan et al., 2004; Li et al., 2017; Morandi et al., 2017), In2O3 (Li et al., 2003; Zhang et al., 2004; Xiao et al., 2017), WO3 (Li et al., 2004; Yang and Guo, 2017), and CuO (Kim and Lee, 2014), are widely used for the detection of toxic and explosive gases (NO2, CO, CH4, H2S, and H2) as well as VOCs (C3H6O, and C2H5OH). The detection mechanism of these MOSs is based on the resistivity change after the interaction of the analyte gas with the surface of the material, either by direct (NO2) or indirect (H2, CO, CH4) mechanisms (Barsan and Weimar, 2001; Batzill and Diebold, 2005). Among the cited MOSs, SnO2 has been studied the most, due to its great performance and chemical stability (Batzill and Diebold, 2005). However, more attention has recently been given to other SnxOy stoichiometries with less stable oxidation states, such as SnO (Suman et al., 2013, 2015; Hien and Heo, 2016; Masteghin and Orlandi, 2018) and Sn3O4 (Suman et al., 2014, 2015; Li et al., 2015; Liu et al., 2016).
These unusual stoichiometries were reported as gas sensors, nevertheless, many studies with respect to their sensor mechanism must be performed in order to understand the causes of the high sensor signals, especially regarding NO2. Suman et al. (2013) reported a giant chemo-resistance of SnO disk-like structures when exposed to 100 ppm of NO2, achieving a sensor signal of 1,000 (with high selectivity toward H2, CO, and CH4), which was attributed to the existence of the lone pairs in the (0 0 1) surface planes (Le Bellac et al., 1995; Walsh and Watson, 2004). Considering the performance of the SnO micro-disks as a gas sensor, this study used the same material, aiming to further understand the gas-solid interactions using different experimental setups.
In summary, this work compares the gas sensor signal of the SnO micro-disks when subjected to distinct experimental arrangements, such as different types of heating. For example, when heated through power controlled external resistors in a horizontal tubular furnace or in a specially designed gas sensor chamber, or else when the measurements were performed through the self-heating method. The 1,000-fold increase in the SnO disks resistance is observed when the measurement is performed in the horizontal tubular furnace (Suman et al., 2013) and the lowest recorded sensor signal is observed through the self-heating method. The main contribution of this work is to correlate the gas sensor properties to the measurement setup.
In order to synthesize the SnO disks, SnO2 powder (Sigma-Aldrich, 99.9% purity), was mechanically mixed with carbon black (Union Carbide, >99% purity) in a molar ratio of 1.5:1 and submitted to the carbothermal reduction route (Suman et al., 2013; Masteghin and Orlandi, 2018). The procedure involved preparing 1 g of the SnO2:C mixture that was inserted in the central region of a horizontal tubular furnace, and held at 1,135°C for 75 min using heating and cooling rates of 10°C min−1. A nitrogen flow of 150 cm3 min−1 was used throughout the synthesis in order to maintain an inert atmosphere inside the tube. A dark-colored wool-like material was removed from the alumina tube (cold region) containing a mixture of SnO nanobelts and micro-disks. The mixture was submitted to a separation process in order to decant the SnO micro-disks, which were the subject of this study.
The morphological characteristics of materials were studied in a JEOL (model JSM-7500F) field emission scanning electron microscope (FEG-SEM) and a FEI Dual Beam Microscope (model Helios Nanolab 600i).
The phase and the crystallinity of the SnO disks were analyzed by X-ray diffraction (XRD) using Cu Kα radiation (λ = 15,406 Å) and a D/teX Ultra two linear detector in a Rigaku (model RINT2000) diffractometer. Raman spectroscopy was performed to study the surface structural variations and the presence of intermediate phases. Micro-Raman scattering spectroscopy was carried out using a 514 nm laser (Melles Griot) coupled to an iHR550 Horiba module with the microscope head adapted by Jobin Yvon (model M.F.O.).
Gas sensor measurements were performed after small drops (0.5 μL each) of a SnO micro-disks suspension were dropped onto the platinum interdigitated electrodes deposited over alumina substrates.
Meant for the self-heating measurements, a built-in-electrode consisting of an interdigitated electrode (IDE) and a heater circuit was used (Figure 1A). The heater circuit is made of platinum deposited by sputtering on the back of the substrate. Then, the built-in-electrode containing the SnO disks was inserted in the gas sensor chamber to carry out the measurements.
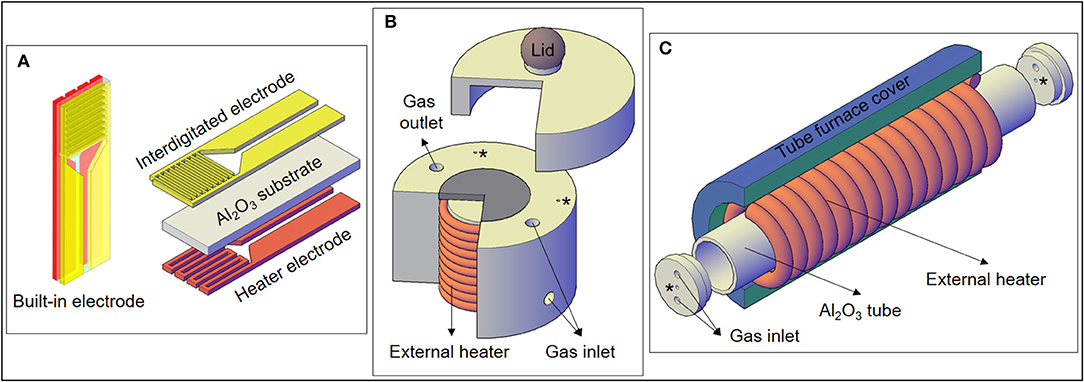
Figure 1. (A) Electrodes used for the experiments, including the heater electrode for the self-heating method. (B) Specially designed gas sensor chamber used for the external heating measurements of this work, with a cross-section showing the external heater. (C) Representation of the external heating setup used in a previous experiment with SnO micro-disks (Suman et al., 2013). The “*” correspond to wires feedthroughs.
In order to perform the gas sensor measurements using the external heating method, an external resistance present in the sensor chamber heats the SnO sample placed on the gray ceramic piece depicted in Figure 1B. Therefore, only the IDE part of the substrate (Figure 1A) was used during this kind of measurement. Moreover, the heater warms the whole test chamber (including the analyte) by means of both conduction and convection.
Figure 1C shows another experimental setup previously used to carry on gas sensor measurements heated by the external heating method. The details of the horizontal tubular furnace arrangement used to study the SnO micro-disks can be seen in the work of Suman et al. (2013), but a schematic draw is presented in Figure 1C. Comparing Figures 1B,C, it can be observed that the main difference between the two setups is the larger warm area provided by the external heater of the tubular furnace.
The gas sensor measurements were fixed at 200°C for the external heating (conventional heating), the temperature at which the SnO micro-disks presented higher sensor response (Suman et al., 2013). The self-heating mode measurements were carried out at 150, 200, and 250°C.
The measurements were carried out by monitoring changes in resistance using a stabilized voltage source (Agilent 34972A) during cyclic exposures to different concentrations of NO2 (1–50 ppm) diluted in synthetic dry air (baseline gas) using mass flow controllers (MKS). The sensor signal was evaluated by considering the RNO2/RBaseline ratio. The controlled release of the analyte gas (NO2) at its different concentrations was done after 12 h stabilization of device in dry synthetic air baseline; each NO2 concentration was released for 20 min at intervals of 1 h between successive releases. The flow remained constant and equal to 200 cm3 min−1 all over the measurements.
A dark brown material was removed from the alumina tube after synthesis. The desired SnO material was sited in a region where the temperature range was between 200 and 350°C.
Figures 2A,B show FEG-SEM images of the SnO micro-disks obtained after the decantation process, showing that the disks and nanobelts were well-separated. It is clearly visible in Figure 1B that many of the disks appear to be the result of two disks stuck together, being this morphological feature related to the vapor-solid (VS) growth mechanism (Dai et al., 2002; Orlandi et al., 2008).
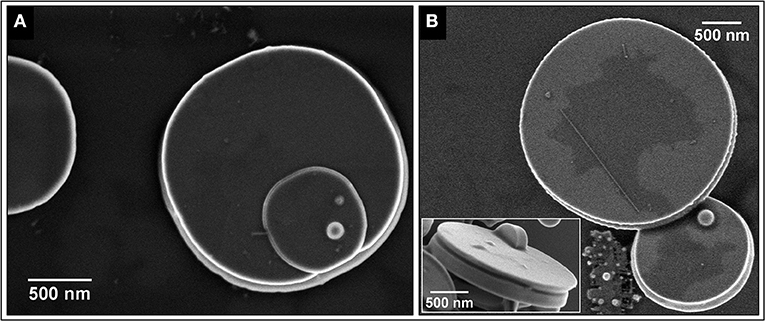
Figure 2. (A) SEM image of a typical SnO micro-disk. (B) Micro-disk with conical edge and a big one showing that it can appear flat and slim depending on the angle. The inset shows the side view of a SnO micro-disk displaying the middle-out growth mechanism even in a disk with a smooth surface.
The FEG-SEM images (Figure 2) show the existence of at least two phases–disk itself and the bright spheres. Further characterization by XRD (Figure 3A) indicates the predominance of the Romarchite phase of the SnO (Space group P4/nmm, Litharge-type Tetragonal structure, similar to α-PbO), nonetheless secondary phases corresponding to the metallic tin (Sn0) and cassiterite phase of the SnO2 (Rutile-type Tetragonal structure) were also indexed as minor amount. A small amount of Sn3O4 phase cannot be discarded from the XRD results. For TEM and XANES characterizations, one can refer to the work of Suman et al. (2013).
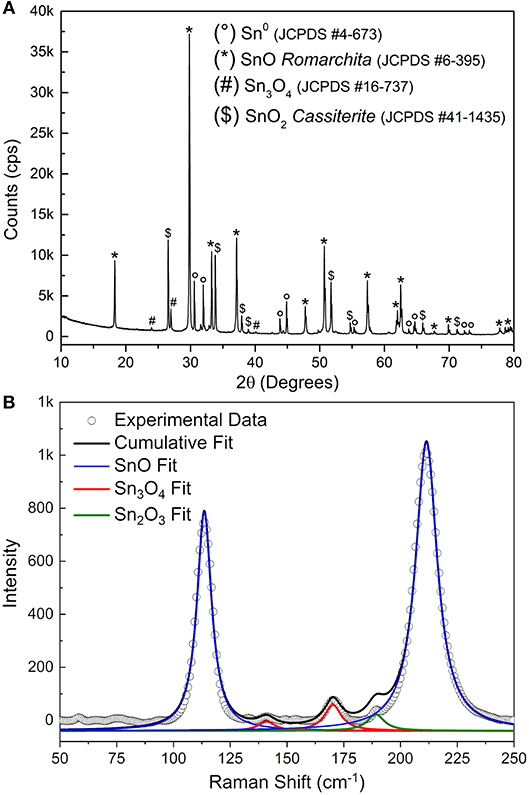
Figure 3. (A) XRD of the SnO micro-disks after synthesis and sedimentation process. (B) Raman spectra of the same SnO micro-disks. The continuous lines represent the multiple peaks fit for each phase presented in the disks (different colors).
Figure 3B shows the Raman spectra of the SnO micro-disks alongside the peaks fitting of each present phase. The blue line shows the peaks fit for the SnO phase. The means (χc) of the Lorentz simulations are at 113 and 210 cm−1, corresponding to the E1g and A1g vibrational modes of the SnO phase, respectively. These two χc values are somewhat shifted to smaller Raman values compared to the theoretical results (Eifert et al., 2017), as can be seen in Table 1.
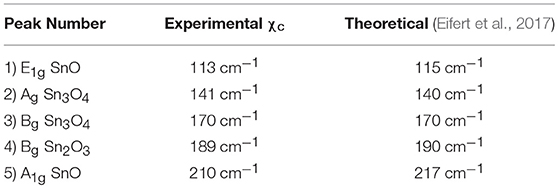
Table 1. Obtained peaks mean values (χc) for the SnO micro-disks Raman Spectra, and the theoretical results for comparative purposes.
The existence of the secondary Sn3O4 phase (red line) is minor but still present in the Raman measurements, since its Ag vibrational mode appears at 141 cm−1, and the Bg vibrational mode is shown at 170 cm−1. Nevertheless, through Raman measurements, it was also possible to attribute the existence of the Sn2O3 phase (green line)–or most probably clusters with this coordination–in the SnO micro-disks (Bg vibrational mode at 189 cm−1). This peak at 189 cm−1 and the absence of peaks regarding the SnO2 phase makes Raman spectroscopy complementary to the XRD, because in the Raman analysis the local bonding and the electronic structure play the main role, in contrast to the XRD, in which only the symmetry, the long-range 3D arrangements, and the atomic factors are taken into account (Sangaletti et al., 1998; Eifert et al., 2017). Besides, theoretical studies showed that the Sn2O3 is the strongest Raman scatterer–and that is the most probable reason it was detected–followed by SnO, Sn3O4, and SnO2 (Eifert et al., 2017).
Comparing the redshift results for the SnO peaks it can be said that the experimental bond lengths are longer than the ones used for the theoretical simulations (Hardcastle and Wachs, 1991). This outcome supports the existence of the lone pairs localized in the Sn2+ ions in the tetragonal structure of the SnO (Walsh and Watson, 2004). One noteworthy point is the higher redshift of the A1g mode compared to the E1g mode of the SnO, endorsing the contribution of the lone pairs for increasing the Sn-O binding length, once the A1g mode coincides to the oxygen vibration in the c direction and the E1g corresponds to the atoms vibration perpendicular to the c direction (Geurts et al., 1984). This finding paves the way for a more sophisticated in-situ and operando spectroscopy which can detect the interaction of oxidizing molecules (O2 and NO2, for example) with the SnO lone pairs, by shifting the peaks at 113 and 210 cm−1 to higher wavenumbers values, since an interacting molecular orbital causes less repulsion to the surrounding atoms rather than a lone pair (Atkins et al., 2018).
Figure 4A shows the gas sensor response of the SnO micro-disks under three different temperatures reached via the self-heating method. One can see the higher sensor signal obtained at 200°C (except for 1 ppm of NO2), as expected based on the measurements carried out in an adapted tubular furnace (Suman et al., 2013). This result emphasizes the need for a balance between the adsorption and desorption rate of the gases onto the SnO surface–both exponentially reliant on the temperature. Equation 1 shows an easier way of understanding this temperature effect on the sensor signal only by means of surface coverage (Θ):
where kads and kdes are the adsorption and desorption constants, respectively; ΔHChem is the chemisorption enthalpy; k is the Boltzmann constant; and T is the temperature in Kelvin.
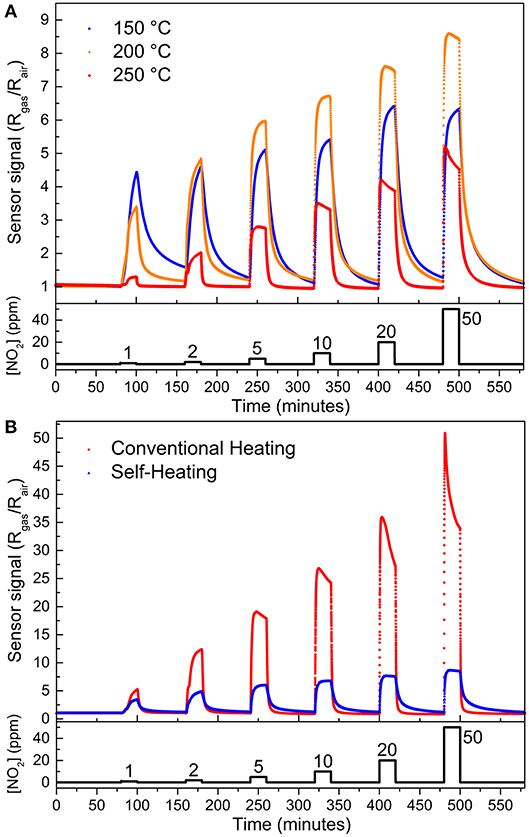
Figure 4. Gas sensor signal as a function of NO2 concentration obtained (A) by self-heating method at 150°C (blue sphere), 200°C (orange triangle), and 250°C (red rhomb). (B) at 200°C reached by two different methods: self-heating (blue triangles) and external heating (red spheres). Gas flow fixed at 200 cm3 min−1.
It is well-known that some amount of energy (heat) is necessary to overcome the activation barrier for the chemisorption (ΔHChem), otherwise, the gas molecules would be in a physisorbed state (Batzill and Diebold, 2005). However, by Equation 1, if the temperature goes too high the coverage decreases and sensor signal drops, in full agreement with previous results involving SnO micro-disks in multi- and single-device configurations (Suman et al., 2013; Masteghin and Orlandi, 2018).
Figure 4B shows the sensor response for the SnO micro-disks at 200°C reached through two different heating modes, external heating (red spheres), and self-heating (blue triangles). The sensor signal is higher for the device when it is in a hermetically sealed chamber heated by conventional resistances (external heating)–equals to 52 at 50 ppm–rather than when self-heating method was used–sensor signal equals to nine. Furthermore, the detection limit (LOD) for NO2 analyte went from 1 ppm using the self-heating mode to 600 ppb using the external heating method, both below the toxic limits. Despite the different sensor signals obtained for the two samples when exposed to different heating modes, both presented increasing sensor signals as the NO2 concentration increased. This is a result of the increased values of resistance reached after different concentrations of the analyte gas were released, corresponding to an n-type semiconductor behavior.
Table 2 summarizes the obtained sensor signals for 50 ppm of NO2, with a constant flow of 200 sccm, at 200°C. Previous results obtained in a horizontal tubular furnace were added in Table 2 for comparative purposes (Suman et al., 2013).
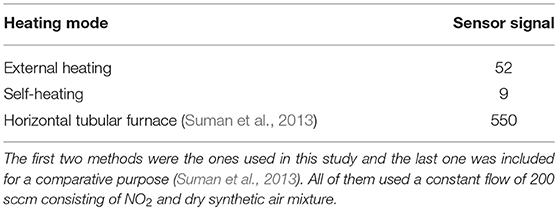
Table 2. The gas sensor signals for 50 ppm of NO2 at 200°C.
To understand how the experimental setup influences the gas sensor response is necessary to elucidate the interactions between the surface of the material and the gases (mainly Oxy- species, and NO2 from the baseline and analyte gas, respectively). The SnO micro-disks deposited onto the IDE will be considered as a porous layer with grain boundaries generated by the contact between the discs. The initial oxygen species that can vary within the operating temperature adsorb onto the material surface generating back-to-back potential barriers at the boundaries. Afterward, the NO2 interacts with the empty tin sites through the overlap of NO2 empty πu molecular orbital with the (Sn 5s–O 2pz)* lone pairs, further increasing the resistivity of the material by heightening and enlarging those potential barriers (Barsan and Weimar, 2001; Batzill and Diebold, 2005).
Thus, knowing that NO2 directly interacts with SnO surface, the higher availability of the analyte will enhance the sensor signal, due to a higher amount of electrons transferred from the semiconductor to the chemisorbed gas. Bearing this in mind, the setup heated by the external heating method is the most likely to present a larger sensor signal since it would deliver a greater amount of NO2 to react with SnO. This occurs because the NO2 dimerization reaction (Equation 2) is an exothermic reaction which releases (–)57.2 kJ mol−1. Consequently, by the Le Chatelier Principle the heat (temperature) can change the reaction direction to the NO2 side (Atkins and Jones, 2005).
NO2 dimerization has a relatively high Kp (equilibrium constant) of 6.5 at 25°C, which decreases to Kp equals 1.18 at 49.5°C (and, ~0.05 at 200°C) (Yu and Gao, 1997), endorsing the temperature effect on the amount of NO2 delivered to the SnO disks. So, Equation (2) and the Kp values support the external heating method presenting a higher sensor signal than the self-heating method.
Another factor contributing to the higher sensor signal of the external heating mode is the temperature effect (T) on the chemical potential of the NO2 molecules (μNO2) in the vapor phase [μNO2 = μ0 + RT ln (PNO2)]. It takes place because the difference in the chemical potential of the vapor phase and the adsorbed state drives the equilibrium, and once NO2 molecules have a higher μNO2 value in the heated chamber, it has a higher probability to form the Sn-NO2 adsorbed state. Nonetheless, the higher sensor signal obtained in the tubular furnace (Table 2), is related to having a larger room for the analyte gas to be heated before reaching the sample.
Figure 5A shows the response times for the self-heating measurements at three different temperatures (150, 200, and 250°C), where an exponential behavior (continuous lines) can be seen in each working temperature. The increasing temperature resulted in smaller response times, especially at higher NO2 concentration, and this effect is most pronounced between response times at 150 and 200°C. These features indicate an Arrhenius kinetics with a given threshold activation energy for the chemisorption process that is supplied to the material as heat (Zaza et al., 2019). Moreover, Figure 5B shows that different heating methods do not cause a meaningful variation in the response time at 200°C.
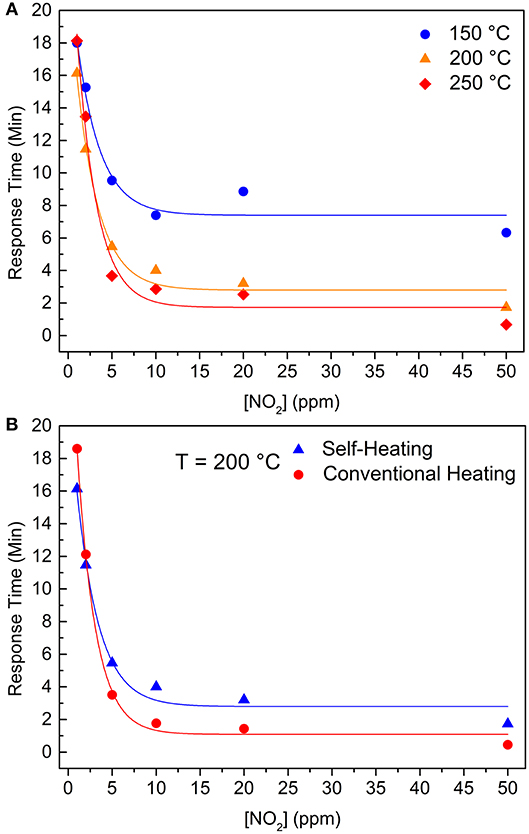
Figure 5. Response times as a function of NO2 concentration (A) for the self-heating method at 150°C (blue sphere), 200°C (orange triangle), and 250°C (red rhomb). (B) at 200°C reached by two different methods: self-heating (blue triangles) and external heating (red spheres). Continuous lines are exponential fitting of the data.
Thus, one can infer that the velocity of resistance change during the gas adsorption/chemisorption is controlled by the energy given to the electrons to cross an electric field of a charged surface (with a dipole momentum), reaching the NO2 molecule. Once this energy is mainly provided as heat, and the temperature close to the IDE is the same for both heating methods, electrons have the same probability of reaching the surface and, consequently, the same response times, regardless being self-heating or external heating.
From Figure 6A one can see a recovery time behavior change whilst increasing the operating temperature throughout the heater. In order to have a 90% recovery of the baseline resistance value, chemisorbed NO2 molecules must be released from the tin atoms. Thus, considering an Arrhenius kinetics for this removal rate constant (), the limiting factor at 200 and 250°C is the pre-exponential factor (A), because at higher IDE temperatures, the NO2 are loosely overlapped with the SnO lone pairs, so the required energy (ΔE) does not control the kinects any longer, but rather the amount of favorable collisions, which are smaller in the self-heating system when compared to external heating method (Batzill and Diebold, 2005).
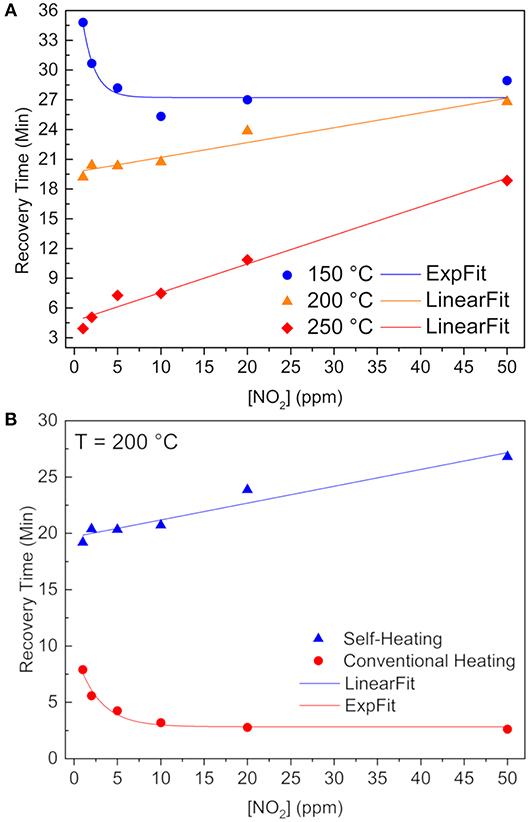
Figure 6. Recovery times as a function of NO2 concentration (A) for self-heating method at 150°C (blue sphere), 200°C (orange triangle), and 250°C (red rhomb). (B) at 200°C reached by two different methods: self-heating (blue triangles) and external heating (red spheres). Continuous lines are exponential or linear fitting of the data.
Figure 6B clearly shows a lower recovery time when submitted to the external heating method, as a result of both higher pre-exponential factor and more energy available. Besides, we showed that O(ads)− species still remain onto the SnO surface, after stopping the release of the NO2 (Masteghin and Orlandi, 2018), indicated in Equation (3) (Kaur et al., 2007; Sharma et al., 2013):
Thus, having oxygen atomic species (O−) is the quickest way to withdrawal these O(ads)− of the SnO surface and restore the baseline as observed for the external heating measurements. It is well-known that oxygen species depend on temperature (Barsan and Weimar, 2001), and that atomic oxygen is the majority at 200°C, in contrast with lower temperatures–like the atmosphere inside the chamber when using the self-heating method–where are present.
In the present investigation, it has been shown how the experimental setup can influence the obtained gas sensor properties, such as sensor signal, limit of detection, and recovery time. This shows that the sensor signal increases and the recovery time decreases when using the external heating method (conventional), and no meaningful effect on the response time was observed when using the self-heating mode.
The present work has used SnO micro-disks in “carpet” mode, previously proven to be an excellent NO2 sensor, to show how the experimental setup affects the gas sensor properties. XRD showed a majority of SnO phase (Litharge-type tetragonal structure), and this result was endorsed by Raman spectroscopy. Raman was also used to experimentally evince the existence of the so-called lone pairs, theoretically predicted and used to explain the high sensor response toward NO2. Gas sensor measurements have shown that the gradient of temperature between the sample and the chamber atmosphere is responsible for the lower sensor signal obtained by the self-heating method, as well as the higher recovery time. Although the former properties have changed with the heating method, the response time was not influenced.
This work main contribution is the use of basic thermodynamic equations to explain how temperature affects the dimerization equilibrium of NO2 molecules, the chemical potential of the analyte gas, the material coverage, and the desorption rate constant. Accordingly, the need to detail the experimental arrangement whilst analyzing the sensor properties.
The datasets generated for this study are available on request to the corresponding author.
MM executed the experimental work, wrote the first version of the manuscript, and was involved in the data analysis. DG analyzed the Raman results and revised the manuscript. MO is the coordinator of the research project, revised the manuscript, and worked on electron microscopy and electrical data analysis.
This research was funded by FAPESP [#2013/07296-2, #2015/21033-0, #2017/12870-0, and #2017/26219-0] and CNPq [#447760/2014-9, #303542/2015-2, and #443138/2016-8].
The authors declare that the research was conducted in the absence of any commercial or financial relationships that could be construed as a potential conflict of interest.
The authors thank LMA-IQ for providing electron microscopy facilities.
Atkins, P., De Paula, J., and Keeler, J. (2018). Atkin's Physical Chemistry. Oxford, UK: Oxford University Press.
Atkins, P., and Jones, L. (2005). Chemical Principles. The Quest for Insight. New York, NY: W. H. Freeman.
Azoulay-Dupuis, E., Torres, M., Soler, P., and Moreau, J. (1983). Pulmonary NO2 toxicity in neonate and adult guinea pigs and rats. Environ. Res. 30, 322–339. doi: 10.1016/0013-9351(83)90218-9
Barsan, N., Koziej, D., and Weimar, U. (2007). Metal oxide-based gas sensor research: how to? Sens. Actuators B Chem. 121, 18–35. doi: 10.1016/j.snb.2006.09.047
Barsan, N., and Weimar, U. (2001). Conduction model of metal oxide gas sensors. J. Electroceram. 7, 143–167. doi: 10.1023/A:1014405811371
Batzill, M., and Diebold, U. (2005). The surface and materials science of tin oxide. Prog. Surf. Sci. 79, 47–154. doi: 10.1016/j.progsurf.2005.09.002
Chang, L.-Y., Mercer, R. R., Stockstill, B. L., Miller, F. J., Graham, J. A., Ospital, J. J., et al. (1988). Effects of low levels of NO2 on terminal bronchiolar cells and its relative toxicity compared to O3. Toxicol. Appl. Pharmacol. 96, 451–464. doi: 10.1016/0041-008X(88)90005-1
Cheng, J. P., Wang, J., Li, Q. Q., Liu, H. G., and Li, Y. (2016). A review of recent developments in tin dioxide composites for gas sensing application. J. Ind. Eng. Chem. 44, 1–22. doi: 10.1016/j.jiec.2016.08.008
Comini, E., Faglia, G., Sberveglieri, G., Pan, Z., and Wang, Z. L. (2002). Stable and highly sensitive gas sensors based on semiconducting oxide nanobelts. Appl. Phys. Lett. 81, 1869–1871. doi: 10.1063/1.1504867
Correa, S. M. (1993). A review of NOx formation under gas-turbine combustion conditions. Combust. Sci. Technol. 87, 329–362. doi: 10.1080/00102209208947221
Crutzen, P. J. (1979). The role of NO and NO2 in the chemistry of the troposphere and stratosphere. Annu. Rev. Earth Planet Sci. 7, 443–472. doi: 10.1146/annurev.ea.07.050179.002303
Dai, Z. R., Pan, Z. W., and Wang, Z. L. (2002). Growth and structure evolution of novel tin oxide diskettes. J. Am. Chem. Soc. 124, 8673–8680. doi: 10.1021/ja026262d
Eifert, B., Becker, M., Reindl, C. T., Giar, M., Zheng, L., Polity, A., et al. (2017). Raman studies of the intermediate tin-oxide phase. Phys. Rev. Mater. 1:14602. doi: 10.1103/PhysRevMaterials.1.014602
Geurts, J., Rau, S., Richter, W., and Schmitte, F. J. (1984). SnO films and their oxidation to SnO2: raman scattering, IR reflectivity and X-ray diffraction studies. Thin Solid Films. 121, 217–225. doi: 10.1016/0040-6090(84)90303-1
Glibert, P. M., Seitzinger, S., Heil, C. A., Burkholder, J. M., Parrow, M. W., Codispoti, L. A., et al. (2005). The role of eutrophication in the global proliferation of harmful algal blooms. Oceanography 18, 198–209. doi: 10.5670/oceanog.2005.54
Hardcastle, F. D., and Wachs, I. E. (1991). Determination of vanadium-oxygen bond distances and bond orders by Raman spectroscopy. J. Phys. Chem. 95, 5031–5041. doi: 10.1021/j100166a025
Hien, V. X., and Heo, Y.-W. (2016). Effects of violet-, green-, and red-laser illumination on gas-sensing properties of SnO thin film. Sens. Actuators B Chem. 228, 185–191. doi: 10.1016/j.snb.2015.12.105
Jin, H., Abu-Raya, Y. S., and Haick, H. (2017). Advanced materials for health monitoring with skin-based wearable devices. Adv. Healthc. Mater. 6:1700024. doi: 10.1002/adhm.201700024
Kaur, J., Kumar, R., and Bhatnagar, M. C. (2007). Effect of indium-doped SnO2 nanoparticles on NO2 gas sensing properties. Sens. Actuators B Chem. 126, 478–484. doi: 10.1016/j.snb.2007.03.033
Kida, T., Suematsu, K., Hara, K., Kanie, K., and Muramatsu, A. (2016). Ultrasensitive detection of volatile organic compounds by a pore tuning approach using anisotropically shaped SnO2 nanocrystals. ACS Appl. Mater. Interfaces. 8, 35485–35495. doi: 10.1021/acsami.6b13006
Kim, H.-J., and Lee, J.-H. (2014). Highly sensitive and selective gas sensors using p-type oxide semiconductors: overview. Sens. Actuators B Chem. 192, 607–627. doi: 10.1016/j.snb.2013.11.005
Le Bellac, D., Kiat, J. M., and Garnier, P. (1995). Electronic lone pair localization and electrostatic energy calculations: application to α-PbO, SnO,Pb1−x(TiO)xO, Pb3O4, Pb3(V,P)2O8, and a BiSrCaCuO-type superconductor. J. Solid State Chem. 114, 459–468. doi: 10.1006/jssc.1995.1069
Lee, J.-H. (2009). Gas sensors using hierarchical and hollow oxide nanostructures: overview. Sens. Actuators B Chem. 140, 319–336. doi: 10.1016/j.snb.2009.04.026
Li, C., Zhang, D., Liu, X., Han, S., Tang, T., Han, J., et al. (2003). In2O3 nanowires as chemical sensors. Appl. Phys. Lett. 82, 1613–1615. doi: 10.1063/1.1559438
Li, S.-H., Chu, Z., Meng, F.-F., Luo, T., Hu, X.-Y., Huang, S.-Z., et al. (2016). Highly sensitive gas sensor based on SnO2 nanorings for detection of isopropanol. J. Alloys Compd. 688, 712–717. doi: 10.1016/j.jallcom.2016.07.248
Li, S.-M., Zhang, L.-X., Zhu, M.-Y., Ji, G.-J., Zhao, L.-X., Yin, J., et al. (2017). Acetone sensing of ZnO nanosheets synthesized using room-temperature precipitation. Sens. Actuators B Chem. 249, 611–623. doi: 10.1016/j.snb.2017.04.007
Li, X., Wang, F., Tu, J., Shah, H. U., Hu, J., Li, Y., et al. (2015). Synthesis and ethanol sensing properties of novel hierarchical Sn3O4 nanoflowers. J. Nanomater. 16:980170. doi: 10.1155/2015/980170
Li, X.-L., Lou, T.-J., Sun, X.-M., and Li, Y.-D. (2004). Highly sensitive WO3 hollow-sphere gas sensors. Inorg. Chem. 43, 5442–5449. doi: 10.1021/ic049522w
Liu, J., Wang, C., Yang, Q., Gao, Y., Zhou, X., Liang, X., et al. (2016). Hydrothermal synthesis and gas-sensing properties of flower-like Sn3O4. Sens. Actuators B Chem. 224, 128–133. doi: 10.1016/j.snb.2015.09.089
Masteghin, M., and Orlandi, M. (2018). A gas sensor based on a single sno micro-disk. Sensors. 18:3229. doi: 10.3390/s18103229
Morandi, S., Fioravanti, A., Cerrato, G., Lettieri, S., Sacerdoti, M., and Carotta, M. C. (2017). Facile synthesis of ZnO nano-structures: morphology influence on electronic properties. Sens. Actuators B Chem. 249, 581–589. doi: 10.1016/j.snb.2017.03.114
Nagase, K., and Funatsu, K. (1990). “A study of NOx generation mechanism in diesel exhaust gas,” in SAE and Technical Paper (Warrendale, PA), doi: 10.4271/901615
Orlandi, M. O., José Ramirez, A., Leite, E. R., and Longo, E. (2008). Morphological evolution of tin oxide nanobelts after phase transition. Cryst. Growth Des. 8, 1067–1072. doi: 10.1021/cg7009379
Ren, H., Zhao, W., Wang, L., Ryu, S. O., and Gu, C. (2015). Preparation of porous flower-like SnO 2 micro/nano structures and their enhanced gas sensing property. J. Alloys Compd. 653, 611–618. doi: 10.1016/j.jallcom.2015.09.065
Rietjens, M., Poelen, C. M., Hempenius, R. A., Gijbels, M. J., and Alink, G. M. (1986). Toxicity of ozone and nitrogen dioxide to alveolar macrophages: comparative study revealing differences in their mechanism of toxic action. J. Toxicol. Environ. Heal. 19, 555–568. doi: 10.1080/15287398609530952
Sangaletti, L., Depero, L. E., Allieri, B., Pioselli, F., Comini, E., Sberveglieri, G., et al. (1998). Oxidation of Sn thin films to SnO2. Micro-Raman mapping and x-ray diffraction studies. J. Mater. Res. 13, 2457–2460. doi: 10.1557/JMR.1998.0343
Sharma, A., Tomar, M., and Gupta, V. (2013). WO3 nanoclusters– SnO2 film gas sensor heterostructure with enhanced response for NO2. Sens. Actuators B Chem. 176, 675–684. doi: 10.1016/j.snb.2012.09.094
Suman, P. H., Felix, A. A., Tuller, H. L., Varela, J. A., and Orlandi, M. O. (2013). Giant chemo-resistance of SnO disk-like structures. Sens. Actuators B Chem. 186, 103–108. doi: 10.1016/j.snb.2013.05.087
Suman, P. H., Felix, A. A., Tuller, H. L., Varela, J. A., and Orlandi, M. O. (2015). Comparative gas sensor response of SnO2, SnO and Sn3O4 nanobelts to NO2 and potential interferents. Sens. Actuators B Chem. 208, 122–127. doi: 10.1016/j.snb.2014.10.119
Suman, P. H., Longo, E., Varela, J. A., and Orlandi, M. O. (2014). Controlled synthesis of layered Sn3O4 nanobelts by carbothermal reduction method and their gas sensor properties. J. Nanosci. Nanotechnol. 14, 6662–6668. doi: 10.1166/jnn.2014.9356
Walsh, A., and Watson, G. W. (2004). Electronic structures of rocksalt, litharge, and herzenbergite SnO by density functional theory. Phys. Rev. B Condens. Matter Mater. Phys. 70:235114. doi: 10.1103/PhysRevB.70.235114
Wan, Q., Li, Q. H., Chen, Y. J., Wang, T.-H., He, X. L., Li, J. P., et al. (2004). Fabrication and ethanol sensing characteristics of ZnO nanowire gas sensors. Appl. Phys. Lett. 84, 3654–3656. doi: 10.1063/1.1738932
Wang, C., Yin, L., Zhang, L., Xiang, D., and Gao, R. (2010). Metal oxide gas sensors: sensitivity and influencing factors. Sensors. 10, 2088–2106. doi: 10.3390/s100302088
Xiao, B., Wang, D., Song, S., Zhai, C., Wang, F., and Zhang, M. (2017). Fabrication of mesoporous In2O3 nanospheres and their ultrasensitive NO 2 sensing properties. Sens. Actuators B Chem. 248, 519–526. doi: 10.1016/j.snb.2017.04.022
Xu, G., Zhang, L., He, C., Ma, D., and Lu, Z. (2015). Adsorption and oxidation of NO on various SnO2(110), surfaces: a density functional theory study. Sens. Actuators B Chem. 221, 717–722. doi: 10.1016/j.snb.2015.06.143
Xu, J., Pan, Q., and Tian, Z. (2000). Grain size control and gas sensing properties of ZnO gas sensor. Sens. Actuators B Chem. 66, 277–279. doi: 10.1016/S0925-4005(00)00381-6
Yang, F., and Guo, Z. (2017). Different post-treatment processes and different gas sensing behaviors of hierarchical hollow tungsten trioxide shell. Mater. Lett. 203, 93–96. doi: 10.1016/j.matlet.2017.05.096
Yu, Q., and Gao, H. (1997). A simple determination of the NO2 dimerization equilibrium constant. J. Chem. Educ. 74:233. doi: 10.1021/ed074p233
Zaza, F., Pallozzi, V., and Serra, E. (2019). Optimization of working conditions for perovskite-based gas sensor devices by multiregression analysis. J. Nanotechnol. 2019:4628765. doi: 10.1155/2019/4628765
Keywords: SnO, gas sensor, heating mode, self-heating, external heating, NO2
Citation: Masteghin MG, Godoi DRM and Orlandi MO (2019) Heating Method Effect on SnO Micro-Disks as NO2 Gas Sensor. Front. Mater. 6:171. doi: 10.3389/fmats.2019.00171
Received: 17 May 2019; Accepted: 01 July 2019;
Published: 16 July 2019.
Edited by:
Xiaogan Li, Dalian University of Technology, ChinaCopyright © 2019 Masteghin, Godoi and Orlandi. This is an open-access article distributed under the terms of the Creative Commons Attribution License (CC BY). The use, distribution or reproduction in other forums is permitted, provided the original author(s) and the copyright owner(s) are credited and that the original publication in this journal is cited, in accordance with accepted academic practice. No use, distribution or reproduction is permitted which does not comply with these terms.
*Correspondence: Marcelo O. Orlandi, bWFyY2Vsby5vcmxhbmRpQHVuZXNwLmJy
Disclaimer: All claims expressed in this article are solely those of the authors and do not necessarily represent those of their affiliated organizations, or those of the publisher, the editors and the reviewers. Any product that may be evaluated in this article or claim that may be made by its manufacturer is not guaranteed or endorsed by the publisher.
Research integrity at Frontiers
Learn more about the work of our research integrity team to safeguard the quality of each article we publish.