 Soumendu Chakravarty
 Ralph Chbeir
 Ping Chen
 Matthieu Micoulaut
 Punit Boolchand
- 1Department of Mechanical and Materials Engineering, University of Cincinnati, Cincinnati, OH, United States
- 2Department of Electrical Engineering and Computer Science, University of Cincinnati, Cincinnati, OH, United States
- 3Laboratoire de Physique Théorique de la Matière Condensée, CNRS UMR 7600, Sorbonne Université, Paris, France
Melt dynamics and glass Topological phases of especially dry and homogenized binary AsxS100−x melts/glasses are examined in Modulated-DSC, Raman scattering, and volumetric experiments. In the S-rich glasses (12% < x < 23%), direct evidence for the elusive 537 cm−1 stretch vibrational mode of the Quasi-Tetrahedral (QT), S = As(S1/2)3, local structure is observed in FT-Raman scattering once melts are homogenized and glasses cycled through Tg+10°C for an extended period. The enthalpy of relaxation at Tg, ΔHnr(x), fragility index, m(x), Molar volumes, Vm(x) each display three distinct regimes of variation. Specifically, m(x) displays a Gaussian like global minimum (fragility window), and ΔHnr(x) displays an abrupt square-well like variation (reversibility window), while Vm(x) displays a Gaussian-like local minimum (Volumetric window) in the isostatically rigid phase (22.5% < x < 28.5%). At low x (< 20%) in the Flexible phase, glasses are segregated with a S8-rich nanophase that decouples from the As-S glassy backbone. At medium x (22.5% < x < 28.5%) glassy backbones form an isostatically rigid phase displaying a vanishing ΔHnr(x) term, and compacted structures with corresponding melts being superstrong (m < 20). At high x (28.5% < x < 40%) in the Stressed-Rigid phase, glasses possess an increasing ΔHnr(x) term, and melts become increasingly fragile, with m(x) >20 as x increases. Taken together, these results underscore that superstrong melts yield isostatically rigid glasses, while fragile ones form either Flexible or Stressed-rigid glasses upon cooling. The onset of the rigidity transition near <r> = 2.22, instead of the usual value of <r> = 2.40, is identified with presence of QT local structures in addition to Pyramidal As(S1/2)3 local structures in the glassy backbone, and with a small but finite fraction of polymeric Sn chains being decoupled from the backbone.
Introduction
Chalcogenide glasses continue to be fascinating materials since their inception nearly 4 decades ago. The fascination stems from fundamental investigations into their molecular structure that inherently control glass functionality examined as a function of network connectivity. These considerations have a close bearing on their Topological phases (Mantisi et al., 2015; Boolchand and Goodman, 2017). In recent years these materials have found a niche in select advanced applications as phase change memory materials (Raoux, 2009), in 3D X-point memory1 (Tang et al., 2009; Malventano, 2017), as materials of choice for optical fibers and waveguides in infrared optics and Supercontinuum emission (Goncalves et al., 2018; Tremblay et al., 2018), amongst many others. In these investigations, it would appear that glass functionality is apparently tied to their chemical composition, and more generally to the underlying Topological phases.
In elemental Selenium, chains are known (Gouda, 2012) to be more stable than Se8 rings, with the consequence that when a Se-melt is quenched, one obtains a bulk glass composed largely of polymeric Sen chains. The reverse is the case in elemental Sulfur, S8 rings are more stable than polymeric Sn chains, with the consequence that when an elemental Sulfur melt is quenched, one invariably obtains a molecular crystal composed of S8 crowns. And when Sulfur is heated to a T of nearly 159°C, also called Tλ, the S8 rings open up into chains, leading to the polymerization transition (Tobolsky and Eisenberg, 1959). The Tλ transition in pure S has been more recently examined in Photon correlation spectroscopy (Scopigno et al., 2007), to reveal an underlying chain relaxation process in the millisecond range, validating the Maxwell relation for the increase of viscosity for the polymerization transition. Recent Raman scattering experiments (Bellissent et al., 1990; Kalampounias et al., 2003; Andrikopoulos et al., 2005), have permitted to establish the polymerized Sulfur fraction as a function of T as T>150° C, and compare these to theory (Tobolsky and Eisenberg, 1959). Thus, Se-rich alloyed melts with group IV (Si, Ge) and/or group V (P, As) elements readily form bulk chalcogenide glasses, but their S-rich counterparts invariably demix into a majority S-rich phase composed of S8 rings, and a minority chalcogenide glass phase composed of the group IV and/or group V additive crosslinking chains of polymeric Sn.
Over the years that foregoing picture of demixing of S-rich glasses has been well-confirmed for the case of As-S binary melts in numerous investigations starting since the late sixtees (Ward, 1968). More recently, Wagner et al. (1998) used Modulated Differential Scannining Calorimetry (MDSC) to show that S-rich (x < 25%) AsxS100−x glasses display bimodal Tg's and are phase separated. Georgiev et al. (2003b) used MDSC and Raman scattering to show that the stoichiometric As2S3 glass is also intrinsically phase separated (Boolchand, 2000; Boolchand et al., 2002) into As-rich (As4S4 Realgar monomers) and As2S3 based S-rich regions (Phillips et al., 1980; Zitkovsky and Boolchand, 1987), with that degree of phase separation determined by the melt-quench temperature used to synthesize the glass. In 2008, Chen et al. confirmed S-rich glasses (x < 25%) to be demixed into a S8-rich nanophase displaying the Tλ transition near 159°C, and with the base As-S polymeric glass backbone displaying a quasi-linear variation of Tg with x over a wide range 12% < x < 40%. More significantly they (Chen et al., 2008) also showed the existence of a reversibility window in As-S glasses in the 22.5% < x < 29.5% range using MDSC to establish the three Topological phases; Flexible, Intermediate and Stressed-rigid. In their study, Chen et al., typically used 2 gram sized As-S batches, and alloyed these for 2 to 3 days at 650°C. And as we acquired more experience on learning how glass melts homogenize, it became clear to us in 2018 that such heat treatment was insufficient to fully homogenize melts/glasses in the present binary.
New and recent evidence has accrued on delayed homogenization of Chalcogenide melts. The results show that binary Ge-Se (Bhosle et al., 2011; Gunasekera et al., 2013), As-Se (Ravindren et al., 2014), and Ge-S (Chakraborty and Boolchand, 2014) and ternary GexAsxSe100−2x (Chbeir et al., 2019) melts of even small (2 gram or less) sized batches typically take 10 days or more to homogenize when alloyed at suitable temperatures. Basic glass science investigations on such homogenized glasses/melts have revealed a rather intimate and detailed correlation between melt properties such as dynamics and glass Topological phases (Boolchand and Goodman, 2017). These considerations became a strong impetus to extend such investigations to the case of the present As-S binary. In this work we have thus chosen to undertake a detailed study on the As-S binary, and have explored amongst other issues the consequences of such homogenization on fundamental correlations between glass Topological phases with melt dynamics.
In the present work, we show direct evidence for presence of Quasi-Tetrahedral S = As(S1/2)3 local structures in AsxS100−x glasses from Raman scattering, and the existence of a window in glass transition reversibility that coincides with a window in melt fragility index established from MDSC experiments, both of which to correlate with a window in molar volumes established from density measurements. Each of these windows reside in the 22.5(3)% < x < 28.5(3)% range which defines the range of compositions across which the Intermediate Phase (IP) is manifested. Our results also show that the window in molar volumes encodes in a rather direct manner the homogeneity of glasses. Furthermore, the rigidity- and stress-elastic phase transitions, which border the IP, are found to be abrupt in composition even in the freshly synthesized glasses. Upon room temperature aging of glasses over several months the reversibility window continues to remain sharp but also gets deeper. Furthermore, the rigidity onset in binary AsxS100−x glasses near <r> = 2.220(5) is found to deviate substantially from the <r> = 2.40 prediction of Phillips-Thorpe (Thorpe, 1985). We take the result to confirm the participation of both QT S = As(S1/2)3 (Boolchand et al., 2009) and Pyramidal As(S1/2)3 isostatic local structures to the formation of that special Intermediate phase. The present work also serves to demonstrate that a pre-requisite to observe these elastic phase transitions in network glasses to be sharp, is that the local connectivity of the backbone, which is determined by the mean coordination number <r> = (2 + <x>), must be well-defined, i.e., the variance in glass stoichiometry (<Δx>), on a scale of 50 microns or less must be <0.5% across the synthesized batch. After describing the materials and methods (section Materials and Methods), and the experimental results (section Experimental Results), we discuss the several broader issues related to the observed correlation between melt dynamics and glass topological phases (section Discussion). The conclusions from our findings are summarized in section Conclusions.
Materials and Methods
Synthesis of Melts/Glasses
Bulk AsxS100−x glasses were synthesized using 99.999% As2S3 lumps of typically 3 mm in diameter and 99.999% elemental S flakes from Cerac Inc. as the starting materials. Elemental Sulfur flakes were vacuum dried by pumping to 10−6 Torr for 48 h. Both starting materials were weighed and sealed in a N2 gas purged glove bag with relative humidity of <5%. Appropriate weight ratios of the two starting materials were used to synthesize bulk glasses of 1.5 gram batch size in the 15% < x < 40% range. Quartz tubes were dried in a vacuum oven at 80°C for at least 24 h prior to their use. Starting materials were sealed in quartz tubes of 5 mm ID and 1 mm wall thickness at a pressure of 3 × 10⁻⁷ Torr using a Veeco LN2 trapped diffusion pumping system. The starting materials were next alloyed by heating in a box furnace with quartz tubes held vertical, and with the T slowly increased to 650°C and kept there for varying alloying times, tr, till melts completely homogenized. Typically, FT-Raman spectra of melts quenched from a temperature 50°C above the liquidus were periodically acquired at 5 locations along the 15 mm long melt column, and the process of alloying continued till spectra at the 5 locations became identical. In the FT-Raman scattering measurements glass samples were mounted on an xyz stage to precisely control the location to probe glass column encapsulated in the quartz tube used for synthesis. These Raman profiling experiments showed that alloying times, tr, in the range 3 to 6 weeks were required to homogenize melts (section Kinetics of Melt/Glass Homogenization). Such FT-profiling experiments introduced in 2011 (Bhosle et al., 2012a,b; Gunasekera et al., 2013; Chakraborty and Boolchand, 2014) have proved to be remarkably insightful (Bhosle et al., 2012a,b; Gunasekera et al., 2013; Chakraborty and Boolchand, 2014; Chbeir et al., 2019) in understanding the intrinsically slow nature of the kinetics of melt/glass homogenization in chalcogenides.
The stoichiometric glass was synthesized by using As2S3 starting material lumps, sealed in evacuated (3 × 10⁻⁷ Torr) quartz tube, and heated to 650°C for 3 days. Thereafter, the temperature was slowly lowered to 360°C, i.e., 50°C above the liquidus (310°C), and the melt kept at that temperature for 4 h before a water quench. As established earlier (Georgiev et al., 2003b), As2S3 melts when quenched from higher temperatures increasingly nanoscale phase separate into Realgar fragments and a S-rich backbone. FT-Raman profiling measurements confirmed that the As2S3 melt/glass so synthesized was homogeneous but also mildly nanoscale phase separated.
All glass samples synthesized displayed a characteristic color that changed with composition from a lighter yellow (16%) to darker orange (26%) as x increased in the 16% < x < 26% range (Figure 1). Each glass sample displayed a clearly defined meniscus with a glass column below it of about 2 cm in length as illustrated in Figure 1, for the glass composition at x = 20%, which was subjected to FT-Raman profiling. The crystalline As2S3 specimen used in the present work, and the earlier work of Georgiev, was a gift from Professor Zallen (1974). The c-As4S4 specimen used in the present work was synthesized earlier by alloying elemental As with stoichiometric As2S3 glass (Georgiev et al., 2003b).
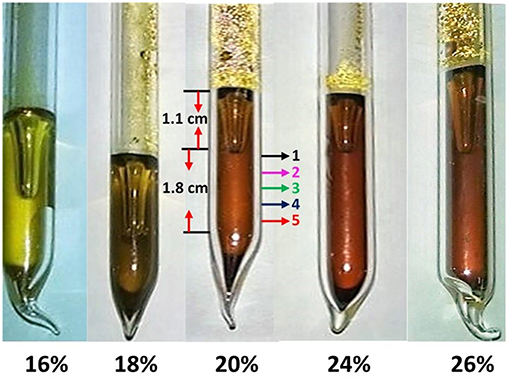
Figure 1. A view of synthesized glasses showing a change of color from a dull yellow at low x (16.0%) transitioning to darker yellow at x = 18%, and to darker orange as x increased to 26.0%. Note that each glass sample displays a meniscus. At x = 20%, we used the 1.8 cm long glass column below the meniscus to acquire ex-situ Raman scattering at 5 locations as melts were alloyed. Batch compositions were considered homogeneous when these spectra became identical.
FT-Raman Scattering
A Thermo-Nicolet model 870 FTIR with a Raman module was used to examine the molecular structure of synthesized glasses. Glasses encapsulated in evacuated quartz tube, mounted on an xyz stage of the Raman module, were examined by focusing about 125 mW of the 1,064 nm radiation from a Nd-YAG laser with a 50 micron spot size (the micro-configuration) to excite Raman scattering. Ideally one wants to use the smallest spot size to get a realistic estimate of the glass heterogeneity (Gunasekera et al., 2013). In a typical measurement 200 scans were acquired yielding a 2 cm−1 resolution and took typically 15 min of acquisition time. A glass specimen, examined at 5 locations along the length of a melt column, required about 75 min. An InGaAs detector or a Ge detector was used in the measurements. The bandgap of AsxS100−x glasses varies in the 2.3 eV < Eg < 2.8 eV range (Yamaguchi, 1985) across the composition range 0.40 > x > 0.10 of interest studied here. The 1,064 nm (1.16 eV) radiation is transparent to all the glasses examined, and yielded spectra of high signal/noise ratio. To ascertain batch heterogeneity or the lack of it, we found particularly useful to normalize the observed signals to the vibrational mode with the highest scattering strength, which in our case was either the S8-ring and -Sn chain mode at low x (<17%), or the broad band centered near 350 cm−1 that results from the As-S glass backbone at high x (>17%). The spread in scattering strength of other vibrational modes with sample location, then directly permitted to establish the variance in As content, <Δx>As across a 1.5 gram batch composition, and served as a quantitative measure of batch heterogeneity in these Raman profiling experiments (section Experimental Results).
Separately we also used a T64000 Dispersive Raman scattering facility with a microscope attachment. The 514 nm radiation from an Ar-ion laser was used to excite the scattering. Use of the 514 nm excitation in the Dispersive System leads to band-band excitation, and results from these experiments will be compared to the mid-gap excitation ones from the FT-Raman experiments.
Modulated Differential Scanning Calorimetry
A model Q2000 MDSC from TA Instruments Inc, was used to examine the nature of the glass transitions (Thomas, 2005; Bhosle et al., 2012b) in calorimetric measurements. An attractive feature of the method is that both glass and melt properties can be examined using the same glass specimen. For a measurement of Tg and the enthalpy of relaxation of a glass at Tg, the glass transition endotherm is examined in a heating scan and analyzed in terms of reversing- and non-reversing- heat flow components. On the other hand, to establish the fragility index of melts, the Tg exotherm obtained upon cooling a melt across Tg was analyzed in terms of complex Cp formalism as a function of modulation frequency. We illustrate the principle of both methods in the narrative below.
Tg and Enthalpy of Relaxation of Glasses
In DSC one typically examines thermal events, endotherms or exotherms by scanning at a linear T-ramp of 20°C/min. MDSC is an AC calorimetric method in which one superposes a programmed sinusoidal temperature oscillation over a linear T-ramp, and from the resulting modulated heat flow (Thomas, 2005) deduces the component of the heat flow that tracks the T-modulation, also called “reversing heat flow” signal. The difference signal between the heat flow and the reversing heat flow, is labeled as the non-reversing heat flow. That separation uniquely permits one to deduce Tg and the enthalpy of relaxation at Tg. The enthalpy of relaxation at Tg, the ergodicity breaking feature of a glass transition, not only depends on glass composition but also on thermal history, dryness, purity and homogeneity.
Prior to its use, the Q2000 calorimeter system was fully calibrated for T using melting of Indium metal, and the specific heat Cp using a standard sapphire specimen, the cell constant was established and uploaded in the software to undertaking any measurements. The following calibration steps were performed: (i) Baseline calibration—An empty cell is heated through the temperature range required for all our subsequent experiments. The software then automatically applies the required constants to make the baseline flat and zero the heat flow signal. (ii) Cell constant calibration—An Indium standard is heated through its melting transition. The software then automatically calculates the heat of fusion by comparing the calculated value to the theoretical value. The ratio between the two values is dialed in to the software as cell constant. (iii) Temperature calibration—An Indium standard is again heated through its melting transition. The software then automatically extrapolates the onset of recorded melting point of the Indium and compares it to the known melting point. Difference between these two values is used by the instrument as Temperature calibration constant. (iv) Heat capacity signal calibration—A sapphire standard is used here. We run the sapphire under the exact same conditions as our samples. We then calculate the calibration constant with the help of the following equation: Calibration Constant = (Theoretical value/Measured value). The calibration constant is then dialed into the software.
To illustrate a measurement of Tg and the enthalpy of relaxation at Tg, ΔHnr, we show a scan of a As26S74 glass in Figure 2. About a 10 mg quantity of a glass specimen in a platelet form preferably, was hermetically sealed in Tzero Al pans (Thomas, 2005) in an inert ambient and examined in a heating cycle at a scan rate of 3°C/min, and a modulation time period of 100 sec, and a modulation temperature amplitude of 1°C. The heating cycle across Tg was then followed by a cooling cycle as illustrated in Figure 2.
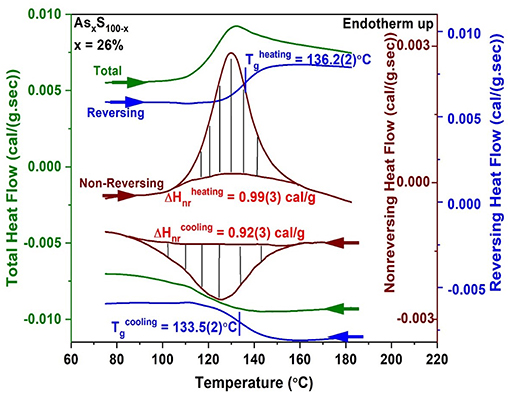
Figure 2. MDSC scan of a As26S74 glass showing the heating cycle (top 3 curves) followed by the cooling cycle (bottom 3 curves) across Tg. The total heat flow (green) is deconvoluted into a reversing (blue) and a non-reversing heat flow (brown) signal, with the hashed marked integrated area giving the enthalpy of relaxation in the heating and cooling cycles. The Tg of the glass is taken to be the average value of the inflection point of the reversing heat flow signal in heating and cooling and yields a value of Tg = 134.8(3)°C. The frequency corrected enthalpy of relaxation, ΔHnr (Thomas, 2005) is the difference between the endotherm obtained in heating up and the exotherm in cooling down, and yields a value of 0.07(3) cal/gm.
The reversing heat flow signal shows (Figure 2) a rounded step, permitting one to fix the Tg by recording the inflection point. A Tg of 136.2(2)°C was obtained in the heating cycle, and a Tg of 133.5(2)°C was obtained in the cooling cycle, yielding a mean value of 134.8(3)°C as the scan rate independent Tg of the As26S78 glass. The non-reversing heat flow term shows a Gaussian-like peak in the heating cycle and the hashed marked region yields the enthalpy ΔHnr of 0.99(3) cal/gm. In the cool-down cycle one observes an exotherm with a ΔHnr term of 0.92(3) cal/gm. The frequency corrected ΔHnr term, the difference between the two terms, ΔHnr (heating)—ΔHnr (cooling) yields a value of 0.07(3) cal/gm. There are set procedures to draw baselines as discussed in the manual of the instrument (Thomas, 2005). The baseline function used depends on the observed result, and it could either be a linear variation, or a sigmoidal tangential one or a sigmoidal horizontal one. Calorimetric results on glasses are presented in section Glass Transition Temperature (Tg(x)), Non-reversing Enthalpy of Relaxation (ΔHnr(x)), and Specific Heat Jump (ΔCp(x)) at Tg.
Fragility Index and Activation Energy for Enthalpic Relaxation Time
As a glass forming melt is cooled to Tg, it's viscosity (η) increases exponentially to reach an astronomically high value of about 1012 Pa s. One characterizes the viscous slow down by plotting the Log (η) as a function of Tg/T, and defines the slope m = d(Log (η))/d(Tg/T) as T approaches Tg to be the fragility index, “m.” It is widely believed that SiO2 glass has a fragility index of 20 (Böhmer et al., 1993). Melts characterized by a fragility index m < 20 are thus viewed to be superstrong, while those with m>>20 viewed as fragile. The fragile-strong classification of glassy melts (Williams et al., 1955; Angell, 1991) is thus widely used to characterize dynamics of glass forming melts. The Maxwell relation,
connects the viscosity, η to the shear relaxation time τ (Böhmer et al., 1993), where G∞ is the infinite frequency shear modulus that is independent of T. One thus relates viscosity to the shear relaxation time as,
When an MDSC instrument is set up to measure the melt fragility index (Carpentier et al., 2003; Thomas, 2005), one examines the glass transition exotherm as a melt is cooled past Tg in terms of a complex specific heat, , which is made of an in-phase or real term () and an out-of-phase or imaginary term (). The in-phase term displays a rounded step while the out-of-phase term shows a Gaussian-like peak. In these experiments one examines the Tg event as a function of modulation frequency (ω). The peak in corresponds to the condition when ωτ = 1, i.e., the melt completely tracks the impressed T-modulated heat flow signal. Here ω is the modulated frequency and τ the melt enthalpic relaxation time. And as ω is increased the peak in shifts to a higher T since the glass must now relax faster (i.e., τ decreases) so that the product ωτ remains 1. These observations permit one to establish the variation of τ as a function of T, and thus deduce the fragility index from the slope of such a semilog plot describing enthalpic relaxation.
In Figure 3, we illustrate an example of such a measurement for an As26S74 melt. The modulation time period tm was varied in the 80 sec < tm < 120 sec range. And we find the step in steadily shifts to higher T as the modulation frequency ω = 2π/tm is increased. On the other hand, displays a peak that steadily shifts to higher T as ω increases. By establishing the peak location, one establishes the T at which the melt has acquired an enthalpic relaxation time τ. By plotting log of τ as a function of Tg/T one obtains the fragility index as shown in Figure 3B.
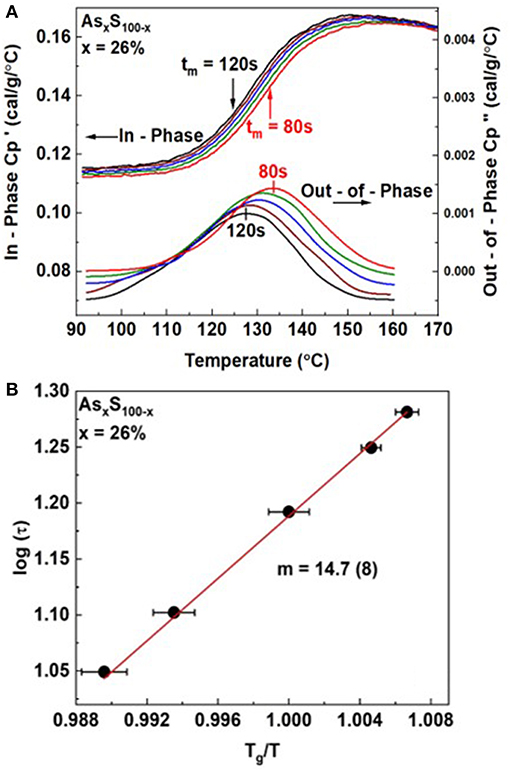
Figure 3. (A) Observed variation in the in-phase and out-of phase term for an As26S74 melt as a function of modulation frequency ω = 2π/tm showing both terms to shift to higher T as ω is increased. (B) By establishing τ from the impressed ω, and measuring the T at which the peak in occurs, one establishes the fragility index by plotting log τ against Tg/T to deduce the slope from the semilog Arrhenius plot using equation 2. The deduced value of m = 14.7(8).
The activation energy (Ea) for enthalpic relaxation is deduced using equation 3 once m and Tg are established.
For our glass at x = 26%, we obtained a fragility index of m = 14.7(8).
Volumetric Measurements
We obtained the mass density “ρ” for our glasses using the Archimedes' Principle by measuring the mass in air and volume by weighing it in a liquid-−200 Proof alcohol in our case. A Model 185 Mettler Toledo digital microbalance with a quartz fiber suspended from the pan with a hook at the bottom to support a sample was used to measure weight in air, followed by weight in the liquid. Typical glass sample size exceeded 125 mg to achieve a 0.25% accuracy in density. Molar volumes “Vm(x)” were then obtained from the known molecular weights and measured glass densities. The density of ethyl alcohol was obtained using a Si single crystal wafer of known density (ρSi) of 2.33 g/cm3. A Ge single crystal of known density (ρGe) 5.323 g/cm3 was separately used to independently confirm the accuracy of the density measurements. To obtain weight of a glass sample in alcohol, the quartz fiber was submerged in alcohol while being in suspension mode from the digital balance. The balance was then tried to nullify the effect of the buoyant force of alcohol on the fiber (taring) before positioning the glass sample on the quartz fiber hook.
Below we provide typical data on a glass sample permitting Vm to be measured.
Step 1: Measurement of the density of alcohol (ρalc) using a single crystal Si wafer.
Weight of Si single crystal wafer (ρ = 2.33 g/cm3) in air () = 230.2 mg
Weight of Si in alcohol () = 152.1 mg
ρalcohol = [(–)/] x ρSi = 0.7905 g/cm3
The density measurement was repeated four times to check for reproducibility, yielding a mean value of ρalcohol of 0.7904(2) g/cm3.
Step 2: Measurement of the density of Ge (ρGe).
Weight of Ge in air () = 123.4 mg.
Weight of Ge in alcohol () = 105.1 mg;
ρGe = [/(–)] × ρalcohol = 5.329(5) g/cm3 using the measured density of alcohol of 0.7904(2) g/cm3; The above measurement was repeated four times and the mean value of ρGe was obtained as 5.3295 g/cm3. This may be compared to the literature value of 5.323 g/cm3.
Step 3. Calculated density and molar volume of AsxS100−x glass at x = 26%;
Wair = 142.4 mg, Walcohol = 103.3 mg, Density of glass sample, Wair/(Wair–Walcohol) × 0.7904(2) = 2.739(4) g/cm3.
Molar volume of the glass specimen Vm = Molecular weight of glass sample/ρsample = 43.204/2.739 = 15.776(25) cm3/mol.
Experimental Results
Kinetics of Melt/Glass Homogenization
We have established the kinetics of AsxS100−x melt/glass homogenization across a wide range of compositions, 12% < x < 33%, using FT-Raman profiling experiments (Bhosle et al., 2011). Two broad domains of behavior emerge. At low x, 12% < x < 20%, the kinetics are rather slow and required alloying the 1.5 gram batches at 650°C for about 6 weeks to fully homogenize. At higher x, in the 20% < x < 33% range particularly, the kinetics are faster, and melts/glasses homogenize in about 4 weeks. Broadly, there are several impediments in homogenizing S-rich melts. Elemental S melts at 115.2°C, and acquires a vapor pressure of 1 Atmosphere at 444°C, which increases to 10 atmospheres near 640°C (Lide et al., 2005). Furthermore, Sulfur undergoes a polymerization transition, Tλ transition (Tobolsky and Eisenberg, 1959) near 150°C, with S8 monomers prevailing at T < Tλ, slowly opening up and transforming into polymeric Sn chains at T > Tλ (Kalampounias et al., 2003), leading to a pronounced increase in viscosity (Tobolsky and Eisenberg, 1959). The presence of the S8-rich nano-phase acts as a barrier to the growth of the As-S glass backbone, a feature that we believe qualitatively slows down the growth of the As-S backbone, as we demonstrate below using the FT-Raman profiling experiments.
Case 1: S8-rich AsxS100-x Melts in the 10% < x < 20% Range
In Figure 4, we reproduce FT-Raman profiling results of an As18S82 melt that was slowly heated at 1°C/min to 650°C in quartz tube held vertically in a box furnace. As the glass was alloyed for tr = 5d, Raman profiling experiments revealed the variance in S content, <Δ(1-x)>S across the batch to be nearly 5% (Figure 4A). In these experiments, glass heterogeneity is established by taking the scattering strength ratio of the S-rich modes (S8 + Sn) near 470 cm−1 to the broad band centered near 350 cm−1 providing a measure of As in the As-S glass backbone. The scattering strength ratio of these modes yields a measure of the S to As content of the melt locally where the laser beam scatters off the vertical glass column in an evacuated quartz tube. And as melt is alloyed longer, the variance in S content, <Δ(1-x)>S steadily decreases to become <0.4% after tr = 40d. We view this process as due to As diffusing up and S diffusing down the melt column. But even after 40 days of alloying substantial amounts of Sulfur still remained segregated as S8 rings (features labeled in the spectra). Next we heated the glass to 95°C and held it there for 2 days, and upon Raman profiling such a glass (Figure 4E), observed unmistakable evidence of a mode near 537 cm−1, which we believe represents the As = S stretch mode of S = As(S1/2)3 quasi-tetrahedral (Table 1). Here we note that the T = 95°C exceeds the Tg (= 85°C) of the glass but is less than the Tλ (= 159°C) transition of pure Sulfur. In this key heating step the As-S bearing glass backbone softens and flows across the S8-rich nanophase permitting backbone fragments to coalesce and grow in size. The S8-rich nanophase remains largely intact at 95°C. In the final step, the glass is taken to 650°C and kept there for 2 additional days and then water quenched. Raman results now provide (Figure 4F) clear evidence for a substantial growth of the 537 cm−1 mode. Also noteworthy in the spectra of Figure 4F is that the scattering strength of the S8 ring modes has now substantially decreased in relation to the one in spectrum of Figure 4E. By heating the glass to 650°C in the final step, a significant fraction of Sulfur apparently alloys in the enlarged As-S backbone, but as we comment later, it also appears that some part of Sn chains decouple from the backbone. These Sn fragments would have to be small, i.e., with n < 8, for them not to be part of the S8 rich nanophase. Closely parallel results are observed at other compositions in the 12% < x < 22% range with rather striking evidence of growth of the 537 cm−1 mode (see Supplementary Information). The slow kinetics of homogenization particularly in the S-rich glasses, x < 18%, is apparently controlled by the segregated S8-rich nanophase, which inhibits growth of the As-S backbone. The S8-rich nanophase is easily detected in calorimetric measurements by the Tλ transition (Chen et al., 2008) as we comment later in section Glass Transition Temperature (Tg(x)), Non-reversing Enthalpy of Relaxation (ΔHnr(x)), and Specific Heat Jump (ΔCp(x)) at Tg.
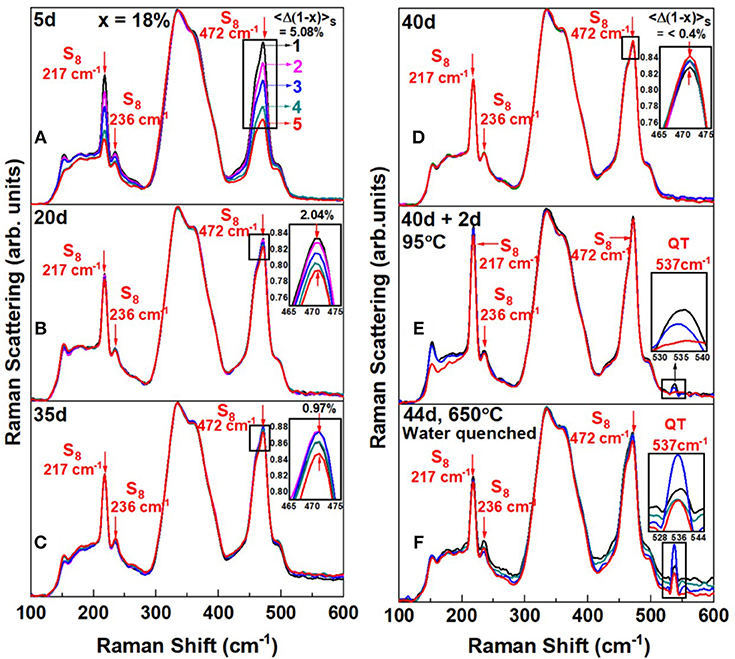
Figure 4. FT—Raman scattering of an As18S82 glass alloyed (A) for tr = 5d, displays a Sulfur—variance <Δ(1–x)>S = 5.08%, (B) for tr = 20d, that variance decreases to 2.04(5)%, (C) for tr = 20d, it decreases further to 0.97(5)% (D) and for tr = 40d nearly saturates to 0.40(5)%. The reduced Sulfur variance across the 1.5 gram batch composition is taken as evidence of glass homogenizing upon continued alloying. In (D), the homogenized melt/glass upon a thermal quench from 650°C displays a segregated backbone immersed in a sea of S8–rich fragments. In (E) heating the glass at Tg + 10°C = 95°C for 2d, results in fragments of the backbone coalescing, and the observation of the 537 cm−1 mode of QT units. In (F) by taking the glass of (E) to 650°C for 2 days and water quenching it, leads to a precipitous growth of the 537 cm−1 mode, and substantial amount of additional Sulfur alloying in the backbone inferred from the qualitative reduction of the S8 ring—fraction between spectrum (E,F). A schematic representation of the structural changes that underlie in going from (D) to (F) is shown in Figure 5.
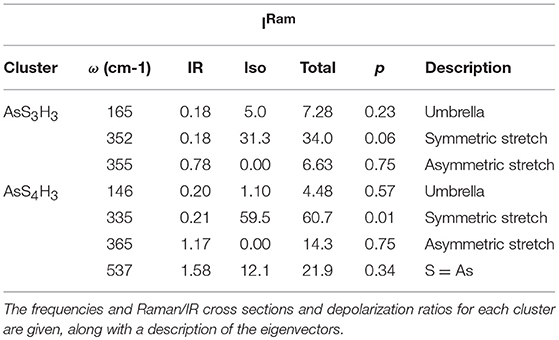
Table 1. Raman and IR vibrational modes of As-S clusters.
To illustrate the molecular structure consequences of the Raman results of Figure 4D through Figure 4F, in a schematic fashion, consider Figure 5. In step (i) of Figure 5, we view the melt to be composed of the As-S backbone fragments, shown as small brown circles, that are connected by the yellow strands that represent polymeric Sn chains when the melt is alloyed at 650°C for 40d, as the glass weighed at x = 18% homogenizes (Figure 4D). A water quench of the homogenized melts, results in the long Sn polymeric chains to break up into the more stable S8 rings that come together to form an amorphous phase shown as yellow circles in step (ii) of Figure 5. Upon heating the glass sample at 95°C for 2d (step (iii) of Figure 5), the small brown backbone fragments coalesce to form the larger sized brown rectangular objects. In step (iv) of Figure 5, the glass is taken backup to 650°C, the S8 rings polymerize and assist in growth of the glass backbone (brown rectangular objects). In the final step (v) of Figure 5, the melt is water quenched with larger sized backbone fragments forming and being intermixed with the S8 ring amorphous phase (yellow circles) when in Raman scattering (Figure 4F) we find unambiguous evidence of the 537 cm−1 mode tied to the growth of the QT local structures in the As-S backbone.
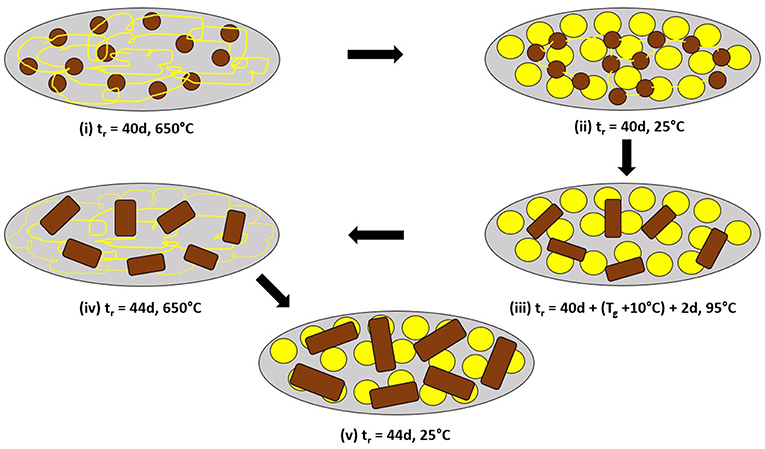
Figure 5. Schematic representation of structural changes underlying the coalescing of backbone fragments (from small brown circles to larger rectangles), and leading to the observation of the 537 cm−1 mode in As18S82 glass as shown by the Raman scattering results of Figures 4D–F. In (i) after 40d of alloying at 650°C, the melt is viewed to be composed of As18S82–rich circular domains immersed in a sea of polymeric Sn chains (thin yellow lines). (ii) After a water quench, the Sn–rich chain regions transform into the more stable S8 rings, largely decoupled from the glassy backbone. (iii) Heating the quenched glass to 95°C for 2d, results in softening and diffusion of the backbone fragments to coalesce and form the larger rectangular domains. (iv) Heating the glass to 650°C leads more Sn chains to be alloyed in the backbone, and finally (v) Upon a water quench to 25°C leads to their growth. Confirmation is given by Raman scattering that shows the S8–ring fraction to qualitatively decrease in going from Figure 4E→4F.
In Figure 6, we provide a summary of the homogenization process in a plot of the scattering strength ratio of the Sulfur-band (Sn chains + S8 rings) near 470 cm−1 to the As-related broad band centered near 350 cm−1 (Figure 5) as a function of the weighed As mole% x. The broad band comprises (Kalampounias et al., 2003) vibrational modes of the glass containing As- Pyramids and As- Quasi-tetrahedra. The red data points in Figure 6 define an empirical curve made possible by results on the fully homogenized glasses synthesized in the present work. On this empirical curve we then project the observed extremum in scattering strength ratios from the Raman profiling experiments (insets of Figures 4A–E) to deduce the S-content variance, <Δ(1-x)>S of a batch composition. This has permitted us to establish the variance <Δ(1-x)>S of a batch composition in real time, tr, in days, as homogenization of the alloyed melt proceeds. We emphasize that the measured variance is across the whole batch composition, and it is not at a local point in the melt/glass column as one would measure once the glass is extracted from the quartz tube and used in a traditional Raman scattering experiment. In a batch composition, changes in glass stoichiometry at one location will influence the global stoichiometry of the batch as a whole. These Raman profiling experiments thus measure the global homogeneity of a batch composition and not merely homogeneity at a local point in a glass specimen.
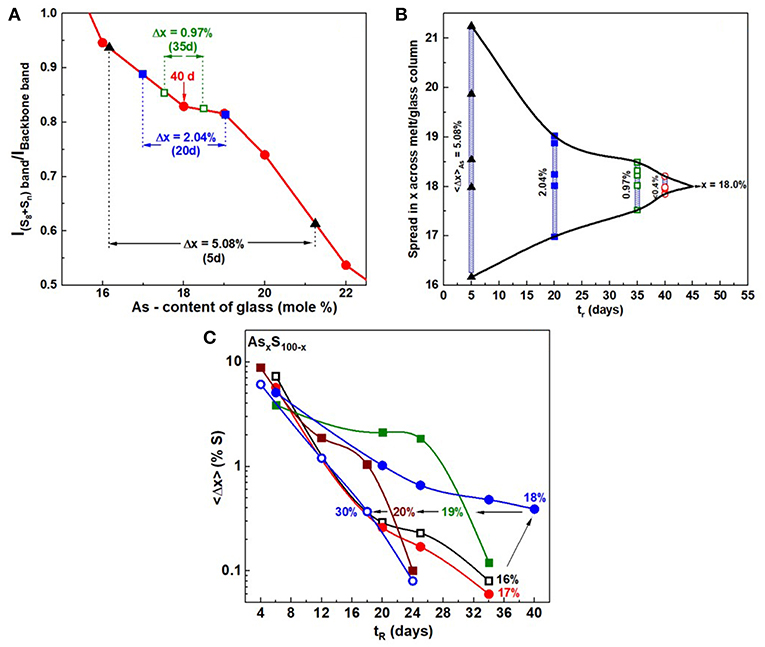
Figure 6. (A) Observed variation in the ratio of the scattering strength of S—related band near 472 cm−1 to the backbone band near 340 cm−1 plotted against the As content of glasses. The red data points are results obtained on fully homogenized glasses from x = 16% to x = 22%, with the smooth red curve serving as an empirical curve. Superposed on the calibration plot are the results obtained for a glass sample weighed at x = 18% as it was alloyed from 5 to 40d, and the variance in S—concentration to narrow from 5.08% to about 0.4%. In (B) the narrowing data of the S—variance, taken to be the same as the As—variance, is plotted as a function of alloying time, tr, in days for As18S82 glass. It provides a pictorial view of the manner in which the weighed glass at x = 18% undergoes delayed homogenization. In (C) we provide a global view how the S-variance of the batches decreases with alloying time tr in days at different As content x. Note that at x = 18%, the kinetics are slowest, and these decrease both at low x (< 18%) and high x (>18%). The x = 18% composition also is the one where the QT fraction is the highest. See Supplementary Information.
Our profiling experiments also show that in S-rich glasses (x < 20%), where a substantial amount of S segregates as S8 rings, the typical alloying time to achieve homogeneity of the melts is nearly 6 weeks. The variance in S content of a S-rich glass starts out usually near 5% after 5d of alloying, and it decreases by an order of magnitude to <½% after 40 days, when the melt/glass is considered to be homogeneous.
Case II: S8-deficient AsxS100-x Melts in the 20% < x < 33% Range
The second case of interest occurs at higher As content (Figure 7), when the S8-ring fraction is minimal. Such glass compositions now homogenize relatively quicker, i.e., after alloying at 650°C for only tr = 24d, as illustrated for a glass at x = 26% shown in Figure 7. At this composition we observe the 537 cm−1 mode of QT units once the glass has homogenized. After 4d of alloying the Sulfur-variance of the batch is near 5%. (Figure 7A), it decreases to 1% after 12d (Figure 7B), and it decreases to 0.1% after 24d (Figure 7D) when the batch composition has homogenized. The homogenization kinetics documented at x = 26%, is typical of many other glass compositions in the 20% < x < 33% range, i.e., compositions encompassing the Intermediate Phase and the Stressed-rigid Phase. Nevertheless, in the present case, as in the case of the x = 26% glass, upon heating the glass to Tg+10°C = 144°C for 2d, one observes clear evidence of the 537 cm−1 mode (Figure 7E) for the first time. By heating the glass further to 650°C for 2 days followed by a water quench, the scattering strength of the 537 cm−1 mode increases (Figure 7F) substantially and that of the S8 ring mode near 217 cm−1 decreases.
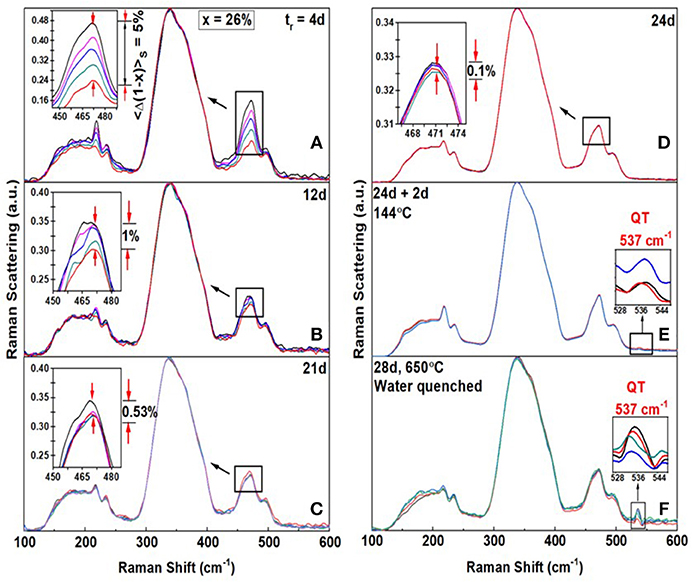
Figure 7. FT—Raman profiling results of an AsxS100−x glass at x = 26% revealing the Sulfur variance <Δ(1-x)>S (A) to be 5% after alloying for tr = 4d (B) the variance ~ 1% after tr = 12d, (C) the variance = 0.53% after 12d (D) the variance = 0.1% after tr = 24d. (E) When the glass is heated to 144°C = Tg + 10°C for 2d, evidence of the 537 cm−1 mode first appears. (F) When glass was next heated to 650°C for 2d and water quenched, the scattering strength of the 537 cm−1 mode increased substantially. These changes in Raman lineshapes in going from step (E) to (F), closely mimic those seen at x = 18% in Figure 4. In particular note that the 217 cm−1 mode of S8 rings decreases in scattering strength in going from (E) to (F). These changes in Raman scattering at x = 18% and at x = 26%, particularly the growth of the 537 cm−1 upon Tg cycling the glass followed by a heating step to 650°C and a water quench, reinforce the schematic structural changes suggested in the model of Figure 5.
The variance in S-content across a 1.5 gram sized batch composition, in the initial stages of alloying, derives from the heavier (lighter) As (S) atoms moving to the lower (upper) part of the glass column. The compositional gradient is most helpful in tracking the growth of homogeneity by merely probing <1% of the glass column. If one had rocked the melts, it would have been challenging to completely track the super-strong melt inclusions in a sea of fragile ones without probing more than 50% of the batch composition, and that would have been a formidable task to implement. In a previous study (Chen et al., 2008) of As-S glasses, melts were typically alloyed at 600 to 650°C for 2 to 3 days. We became aware that chalcogenide melts undergo delayed homogenization starting in 2011 (Bhosle et al., 2011; Gunasekera et al., 2013; Chakraborty and Boolchand, 2014). And as we present results from the present work, we shall discuss the present findings in relation to the previous ones bringing out the crucial role of homogenization in elucidating the physics and chemistry of these glasses. Once the physics of homogenization is established, one can always design procedures to expedite homogenization of larger batches over several days rather than several weeks.
Raman Scattering on AsxS100-x Glasses
FT-Raman scattering on the especially homogenized bulk AsxS100−x glasses were acquired using a Thermo-Nicolet Nexus 870 FTIR with Raman module. The observed lineshapes as function of glass composition are summarized in Figure 8. In the top panel (Figure 8A) we include Raman scattering of the two reference crystalline phases of interest (Georgiev et al., 2003b); c-As2S3 and c-As4S4. In the middle panel we present Raman spectra of AsxS100−x glasses in the high As content range, 40% > x > 24% (Figure 8B), while in the bottom panel spectra of glasses in the low As-content range, 20% < x < 12% (Figure 8C).
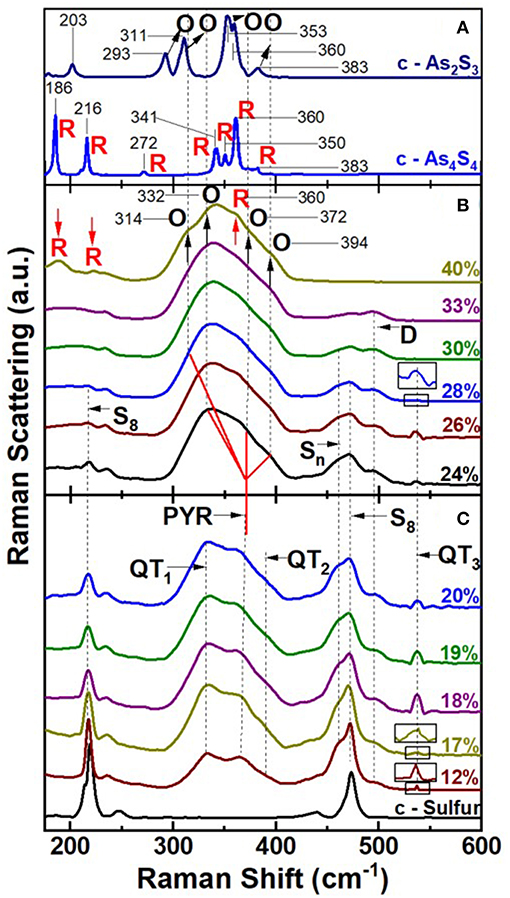
Figure 8. FT Raman results on (A) c-As2S3 (Orpiment) and c-As4S4 (Realgar), (B) AsxS100−x bulk glasses at high As content in the 40% < x < 24% range, and in (C) at low As content in the range 20% < x < 12% and of crystalline—Sulfur. In (C) we observe the three expected modes of QT S = As(S1/2)3 local structures labeled QT1, QT2, and QT3, and the modes of PYR As(S1/2)3 local structure labeled PYR. These modes occur at frequencies close to those predicted by NRLMOL calculations (Table 1). In (B) at x = 40%, the four observed modes labeled O with indicated mode frequencies in cm−1 are due to Orpiment—like features, and are systematically blue shifted wrt to the O-modes in c-As2S3 in (A) by about 14 to 21 cm−1. The stoichiometric glass (x = 40%) also displays 3 modes labeled R that occur at frequencies reasonably close to those observed in c-As4S4 as in (A). Feature D near 490 cm−1 is observed over a wide range of x, 12% < x < 33%. The observation of R modes in the x = 40% glass shows the stoichiometric glass is mildly NSPS as noted earlier by Georgiev et al. (2003b). In (B) modes of QT species steadily go over into those of O—species as x increases from 24 to 40%. Modes of polymeric Sn chains (461 cm−1), and of monomeric S8 species (217 cm−1, 472 cm−1) are observed as expected. See text.
Raman Scattering in AsxS100-x Glasses in the High As Range 24% < x < 40%
In glass science one has often been tempted to draw analogies between the Raman spectrum of the stoichiometric glass with its crystalline counterpart. The case of the stoichiometric glass at x = 40% and c-As2S3 (orpiment) is no exception (Ward, 1968), since both are viewed as composed predominantly of a polymeric network of PYR units. But there are glaring differences as well. The stoichiometric glass is actually NSPS into As-rich As4S4 Realgar units that decouple from the S-rich polymeric network composed of PYR units in which a finite concentration of S-S bonds persist (Phillips et al., 1980; Zitkovsky and Boolchand, 1987). Furthermore, the degree of segregation of As2S3 glass is intimately tied to the melt quench temperature (Tq), with the segregation (Georgiev et al., 2003b) increasing as Tq > Tliquidus. The evidence of segregation is unmistakable in Raman spectrum of Figure 8B, as the triad of modes near 188, and 220 and 352 cm−1 labeled R in the stoichiometric glass (Figure 8B), appears at nearly the same frequency (within 2 cm−1) as their counterparts in c-As4S4 (Realgar) (Figure 8A). This is as one expects, given that Realgar is composed of molecular cages composed of 8-atom clusters (Bonazzi et al., 1995) with strong intramolecular interactions mediated by covalent bonds, but weaker inter-cluster ones deriving from non-bonding van der Walls interactions.
A close examination of the Raman lineshape of the stoichiometric glass also reveals a quartet of modes (Georgiev et al., 2003b) labeled O (Figure 8B) that are found in c-As2S3 but with a notable difference. The modes in the glass are blue shifted by about 14 to 21 cm−1 in relation to those of c-As2S3 (Figure 8A). This is illustrated by the vertical broken black lines passing through the glass modes, which are found to be systematically shifted to a higher frequency in relation to the quartet of modes in the crystal (see arrows in Figure 8A). The blue shift of modes in the glass is viewed to be the consequence (Georgiev et al., 2003b) of the greater molar volume, Vm (15.4 cm3) of the glass than the crystal Vm (14.10 cm3) (Robie and Bethke, 1962). The more open structure of the glass promotes intra-molecular interactions due to σ-bonds in PYR and QT local structures at the expense of the intermolecular ones mediated by π-bonds between these local structures.
The range of intermediate range glass compositions in the 24% < x < 35% poses challenges in Raman lineshape deconvolution as we comment in the next section.
Raman Scattering in AsxS100-x Glasses in the Low As Range, 12% < x < 20%
Raman scattering of As-deficient glasses in the 12% < x < 20% range display lineshapes (Figure 8B) that reveal the triad of QT modes; QT1 = 335 cm−1, QT2 = 390 cm−1, and QT3 = 537 cm−1, and a pair of closely spaced modes of PYR units (352, 355 cm−1) in the broad band centered near 340 cm−1 as illustrated in Figure 9 for compositions at x = 12, 17, and 18% (see Supplementary Information).
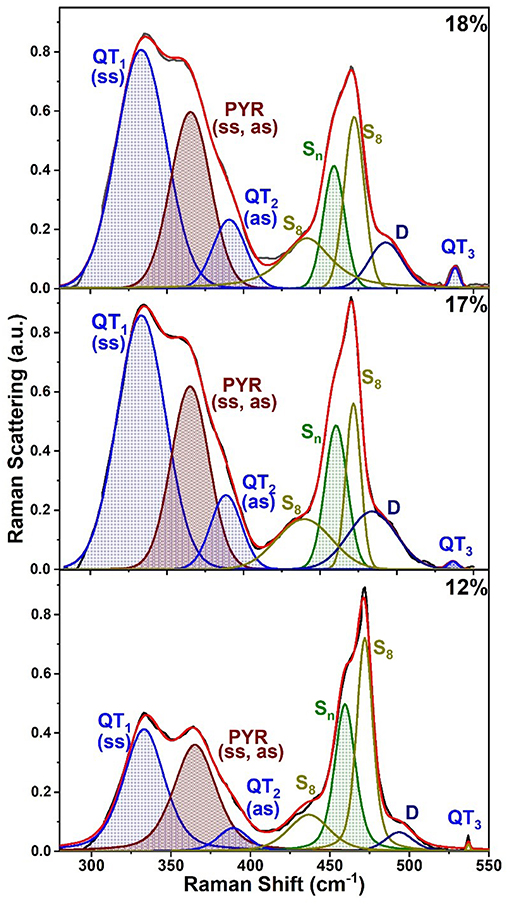
Figure 9. Observed FT Raman scattering in AsxS100−x glasses at low x (< 18%) deconvoluted in terms of a superposition of requisite number of Voight profiles as illustrated in the plots. See text and Table 1 for the mode assignments.
All the observed lineshapes (Figure 9) at x of 18% or less, were least squares fit to a superposition of Voight profiles, and the observed mode frequencies of the two local structures are found, indeed, quite close to those deduced by the NRLMOL code (Table 1). Even the observed Integrated intensity of the various modes (Figure 9) are in reasonable accord with the projected Raman cross-sections of the various modes by the NRLMOL code.
The main band centered near 350 cm−1 has contributions from the symmetric stretch (ss), and asymmetric stretch (as) of QT and PYR units. The band near 472 cm−1 has contributions from Sn chains and S8 rings, while the highest frequency mode is the S = As stretch mode of QT units. Least squares fit of the lineshape used the Peakfit software from SPSS Inc. In addition, we observe a mode near 490 cm−1, labeled D in the spectra (Figures 8C, 9), which is observed over a wide range (12% < x < 37%) of As content. The mode is consistent with a stretch vibration of S-S dimers between AsS3 pyramids, as suggested by the mode scattering strength variation in our Raman lineshapes, which display a global maximum near x = 25% (see Supplementary Information). The other modes observed include S8 ring modes (217 cm−1, 472cm−1) and Sn chain mode (461 cm−1) over a wide range of x, the elusive mode near 537 cm−1 from the QT, S = As(S1/2)3 local structure, labeled as QT3. This mode is, indeed, observed in these homogeneous glasses in the 12% < x < 26% range.
At lower As content (x < 15%), as the S-content of the glasses increases and the content of the S8 nanophase grows, formation of the polymeric As-S backbone becomes a challenge as we noted earlier in homogenization studies in section Kinetics of Melt/Glass Homogenization. By a low-T anneal of the homogenized glasses, at Tg + 10°C, we could observe the high frequency QT mode even at x = 12% (Figures 8, 9).
In the transition range, 22% < x < 35%, spanning the Intermediate phase and the Stressed-rigid phases of the present As-S binary, evolution of the Raman spectra poses challenges to uniquely deconvolute. This is the case because as the QT local structures deplete and the PYR units grow, one finds that orpiment-like structures must evolve giving rise to the quartet of O-modes, whose frequency closely overlaps with those of the QT local structures formed at low x. In Figure 8B, we illustrate the challenge by drawing a continuous red line coming from the PYR mode observed at low x (< 20%), to the quartet of O-modes expected at higher As content. Since as many as 7 vibrational modes of the O-species and QTn-species occur and have overlapping mode frequencies, clearly one can only obtain fits to the spectra of the glasses by imposing several constraints on mode centroids and widths. The procedure raises the obvious questions on the uniqueness of the fitting process.
Dispersive and FT Raman Scattering in AsxS100-x Glass Compared
We have also examined As-S glasses in Dispersive Raman scattering using 514 nm excitation using a T64000 Micro-Raman system from Horiba Inc. As an illustration we show in Figure 10 spectrum of a As18S82 bulk glass examined in FT-Raman scattering excited using 1,064 nm excitation (Figure 10A), and separately in Dispersive Raman (Figure 10B). There are several features common to both spectra including the S8-ring modes near 151, 217, and 472 cm−1, the As-S backbone band centered near 340 cm−1 and the polymeric Sn chain mode near 461 cm−1. But there is also a glaring difference; the 537 cm−1 mode is observed in FT-Raman spectrum Figure 10A but not in Dispersive Raman spectrum Figure 10B.
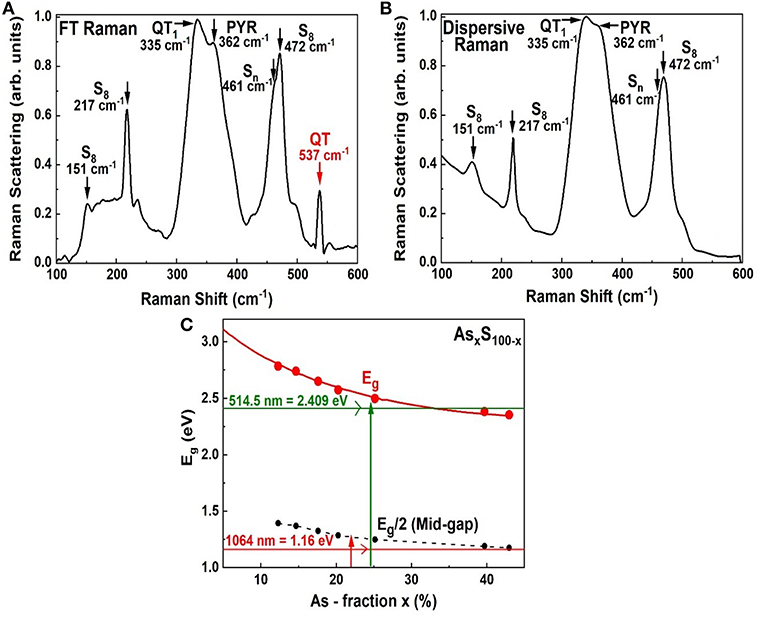
Figure 10. Showing (A) FT—Raman spectrum of an As18S82 glass as in Figure 4F, (B) a Dispersive Raman spectrum of the same glass, and (C) the variation of the optical band gap in AsxS100−x glasses reported by Yamaguchi (1985). In (A) the scattering is excited in the midgap region using the 1,064 nm as shown in (C), while in (B) the scattering is excited using 514 nm radiation that excited the scattering in the conduction band region.
These results lead us to believe that the electronic states contributing to the QT local structure are most likely resonantly excited in the mid-gap region by the 1,064 nm excitation. The QT are qualitatively suppressed in Dispersive Raman making use of the near band gap excitation as schematically illustrated in Figure 10C, on a plot of the optical band gap of AsxS100−x glasses reported by Yamaguchi (Yamaguchi, 1985). The pattern is not unique to the glass composition at x = 18%, but is observed at other compositions at x < 24%., Dispersive Raman scattering on As-S glasses have also been reported by Golovchak et al. (2010) and Bychkov et al. (2006). Also see Supplementary Material.
Glass Transition Temperature (Tg(x)), Non-reversing Enthalpy of Relaxation (ΔHnr(x)), and Specific Heat Jump (ΔCp(x)) at Tg
The compositional trends in calorimetric observables such as glass transition temperature, Tg(x), enthalpy of relaxation ΔHnr(x) at Tg, and the specific heat jump at Tg ΔCp(x), in AsxS100−x glasses deduced from Modulated DSC experiments on the present glasses are summarized in Figure 11. Also included in Figure 11 is the observed variation of Molar volumes (Vm(x)) in glasses. Taken together, both the Calorimetric and Volumetric results provide a global view of the three distinct regimes of variation. At low x (<22%), one observes two endotherms; one near T = 150°C that shifts minimally in T with increasing x, but with an enthalpy of relaxation that steadily decreases with increasing x to vanish near x > 22% (not shown in Figure 11). On the other hand, the second endotherm is found to steadily upshift in T almost quasi-linearly with increasing x in the 15% < x < 40% range. These Tg(x) trends (Figure 11A) are similar to those reported by Wagner et al. (1998), who were one of the first to employ MDSC to examine As-S glasses. In their work, Wagner et al. identified the endotherm near 150°C as a second glass transition, and viewed the bimodal Tg's observed at x < 25% as evidence of phase separation of these S-rich glasses. In a subsequent study (Chen et al., 2008), examined many more compositions and recognized that the 150°C endotherm is actually the Tλ transition, i.e., presence of S-rich domains composed of S8 rings that polymerize into Sn chains as T exceeds Tλ, in these S-rich binary As-S glasses. They noted that the Tλ transition, well-established in pure S and is observed near the same temperature of about 150°C.
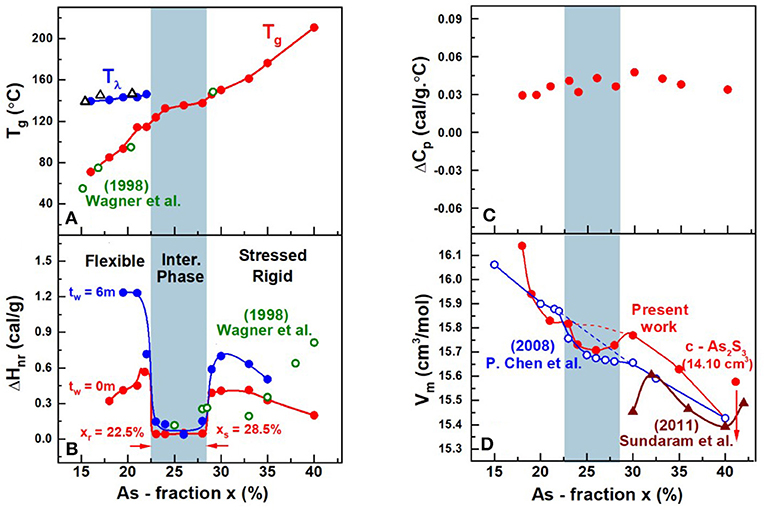
Figure 11. Compositional trends of (A) Tλ transition ( ) and the glass transition temperature (
 ) Tg(x) from present work and Tλ transition (Δ) and the glass transition temperature (
 ) from Wagner et al. (1998) (B) the enthalpy of relaxation at Tg, ΔHnr(x) in the fresh () and 6 m aged state () from present work and the enthalpy of relaxation () from Wagner et al. (1998) (C) the specific heat jump at Tg, ΔCp(x) and (D) molar volumes, Vm(x), in the present AsxS100−x glasses. The Tg(x) increases almost quasi—linearly with x while ΔHnr(x) shows a square-well like behavior, the reversibility window. Vm(x) displays a local minimum in the IP, the volumetric window that coincides with the IP boundary (light blue panel). Trends in Vm(x) reported by Chen et al. (2008) on glasses (
 ) that were not as well-homogenized show a smearing of the volumetric window near the edges of the IP where the rigidity and stress transitions occur. The brown data set is from Sundaram et al. (2011) on glasses that were reacted for 12–24 h inside a rocking furnace. See text.
The nature of the second endotherm observed in As-S glasses became transparent when more detailed compositional trends became available (Chen et al., 2008), and showed a quasi-linear increase of Tg(x) with x (Figure 11A) over a wide composition range 10% < x < 40% to represent the glass transition characterizing the As-S network backbone. The enthalpy of relaxation, ΔHnr(x), of the endotherm, one found, displays a rather sharply defined square-well like variation in the composition range, 22.5% < x < 28.5% (Chen et al., 2008). In the present work we confirm the findings of Chen et al., and in addition, now show that in homogenized glasses, the square-well variation of ΔHnr(x), also known as the reversibility window is observed even in fresh glasses as well as 6-month aged ones (Figure 11B). Reversibility windows have now been widely observed in many glass systems including chalcogenides and oxides (Mantisi et al., 2015; Boolchand and Goodman, 2017). These windows represent signature of the isostatically rigid phases also known as the Intermediate Phases (Boolchand et al., 2001). The abrupt nature of the onset of the window near x = xr = 22.5% represents the rigidity transition, and the end of the window near x = xs = 28.5% as the onset of the stress-transition (Chen et al., 2008). These two elastic phase transitions in the present As-S binary glasses are found to be particularly abrupt in composition “x” in the present glasses, due to the especially homogenized nature of glasses synthesized as will be discussed later in section Discussion.
Variation of Melt Fragility Index With Glass Composition
One cannot overemphasize the tremendous resource MDSC provides in measuring Tg and ΔHnr(x) of a glass, and also to establish the fragility index, m(x), from the activation energy Ea of the enthalpy relaxation time of melts using the same glass specimen. The methodology to measure melt fragility index using MDSC was described earlier in section Modulated Differential Scanning Calorimetry. Fragility index are established in viscosity, or flexure, measurements that generally require much larger glass samples than those used in measuring Tg and enthalpy of relaxation using DSC or MDSC. That consideration also raises issues concerning sample homogeneity that is more easily achieved in smaller batch sizes (2 grams or less) than in larger (20 grams or more) ones.
The observed variation in the fragility index, m(x), of AsxS100−x melts reveal a Gaussian-like minimum centered around the reversibility window (blue panel), with m < 20 in the window and acquiring values of m > 20 outside the window. In Figure 12A, we include the fragility index “m” of As2S3 glass measured in Dilatometric studies reported by Málek (1997). In Figure 12A we also show with a broken line the fragility index of SiO2 glass near m = 20. The super-strong character of melts, i.e., m < 20, in the blue panel, defines the fragility window, which coincides with the reversibility window in glass composition “x,” and we shall discuss these results in section Discussion. Given the measured m(x), we have projected the expected melt viscosity variation with x using the MYEGA formalism (Mauro et al., 2009), and these results (Figure 12A) show that near x = 25%, melt viscosity far exceeds those at x = 15% or at x = 35% by nearly 2 orders of magnitudes. The activation energy for enthalpy relaxation Ea(x) deduced from the fragility index results and the inverse of Ea(x) are plotted in Figures 12B,C, respectively. Our Raman profiling experiments (Figures 6, 7) provide ample evidence that the 1.50 gram sized AsxS100−x melts, in the present work, take several weeks rather than several days to homogenize. That feature of glass forming melts has been noted earlier (Gunasekera et al., 2013; Mohanty, 2018; Chbeir et al., 2019) in other glass systems as well, and is responsible for the delayed homogenization of glass forming melts that encompass a fragility window in general.
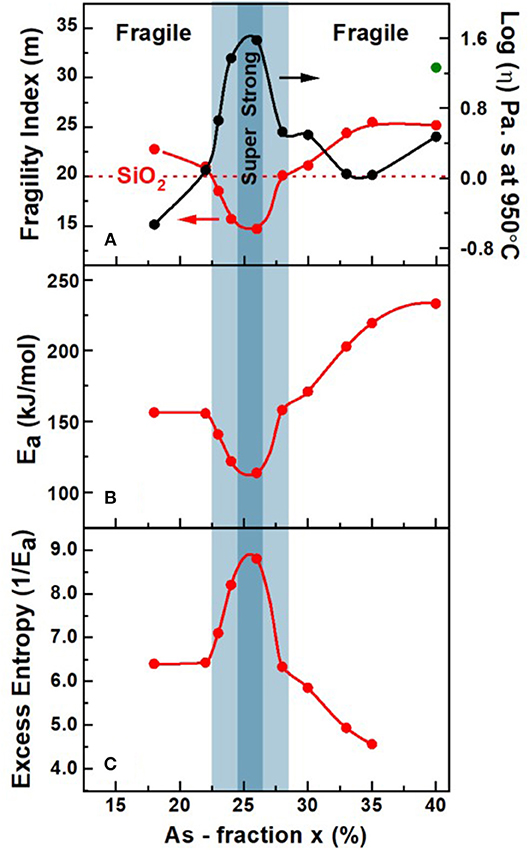
Figure 12. (A) Observed variation in fragility index m(x), (B) activation energy of enthalpy relaxation time, Ea(x), and (C) the variation in 1/Ea with x in AsxS100−x melts obtained using mDSC. Also included in (A) is the projected variation (•) of melt viscosity (η) based on the presently measured m(x) and the MYEGA formalism (Mauro et al., 2009). In (A) the observed Gaussian—like minimum in m(x) centered around the reversibility window (shaded light blue), with m < 20 in the window and acquiring values of m > 20 outside the window, serves to define the fragility window. The super—strong character of melts near x = 25.0% acquiring an m = 15.0, is illustrated with a darker blue color. The green color data for m(x) of 31 at x = 40% is from Dilatometric measurements of Málek (1997).
Variation of Molar Volumes With Glass Composition
The density of glasses were measured using Archimedes method (section Volumetric Measurements), which permitted one to extract trends in the variation of molar volumes, Vm(x) with x. These compositional trends in Vm(x), for the especially homogenized bulk glasses (Figure 11D), are compared to those reported by Chen et al. (2008) in an earlier investigation of the present binary. In addition, we have summarized Vm(x) results from previous reports (Sundaram et al., 2011) on binary AsxS100−x glasses in Figure 11D. These results when taken together reveal a broad pattern; the reported Vm(x) results at x>30% vary significantly between different reports highlighting the challenges in synthesizing reproducible glasses.
It is useful to recall that Chen et al. (2008) used 2 gram sized batches and alloyed them at 650°C for typically 2d or 3d. In 2003, we assumed the glasses were rendered homogenous by that thermal treatment. The present Vm(x) results highlight in a rather unambiguous fashion the intimate role played by glass homogeneity on network packing. The local minimum of Vm(x) in the IP region of the present glasses is localized entirely in the IP presumably because of the homogeneity of the glasses. The smearing of Vm(x) at the rigidity- (xr = 22.5%) and stress-elastic phase boundaries (xs = 28.5%) observed in our previous (Chen et al., 2008) report is entirely consistent with the expected variance in S stoichiometry, <Δ(1-x)>S in those set of glass samples. For glasses synthesized in 2008, we estimate the homogeneity, i.e., variance in S stoichiometry, <Δ(1-x)>S across the synthesized batch compositions to be near 3% (see Figures 4, 5). Such considerations also have interesting consequences on the measured Vm(x), outside the IP, both in the stressed-rigid phase (x > xs), and the flexible phase (x < xr) where the present Vm values measurably exceed (Figure 11D) some earlier reports (Sundaram et al., 2011). These factors underscore in a direct fashion the crucial role of the variation of Vm(x) on glass/melt homogeneity of batch compositions. We comment on these results in section Glass Topological Phases.
Discussion
Glass Topological Phases
Topological Phases of AsxS100-x Glasses
The Calorimetric, Volumetric, and Raman scattering results on the especially homogenized AsxS100−x glasses and melts reported in this work display three distinct regimes of variation as a function of their composition “x.” The enthalpy of relaxation at Tg in the glasses, ΔHnr(x), shows a square-well like behavior (Figure 13) with the heat flow term becoming miniscule in the 22.5% < x < 28.5% range. One of the first attempts to link calorimetric observation of a minuscule enthalpy of relaxation at Tg (ΔHnr term) with flexibility and rigidity of glassy networks was due to Micoulaut (2010), who showed that the vanishing of ΔHnr at Tg is the signature of an isostatically rigid glass, i.e., a glass in which nc = nd. Here nc represents the count of mechanical constraints/atom due to bond-stretching and bond-bending covalent forces, while nd the degrees of freedom/atom = 3 in 3D networks. Such networks conform to that Maxwell-Phillips rigidity condition (Maxwell, 1864; Phillips, 1979) and are viewed as rigid but unstressed, and form part of the Intermediate Phase (IP) (Boolchand et al., 2001; Georgiev et al., 2001). The IP is bounded on the low connectivity side, i.e., x = xr = 22.5% by the rigidity-transition, and on the high connectivity side, i.e., x = xs = 28.5% by the stress-transition. In As-S glasses, since As atoms are 3-fold and Sulfur atoms 2-fold coordinated, the mean coordination number
varies linearly with x. Furthermore, since < r> provides a measure of network connectivity, and since Tg is determined by the connectivity of a glassnetwork (Micoulaut, 1998), one expects Tg(x) to increase linearly with x (Figure 11A).
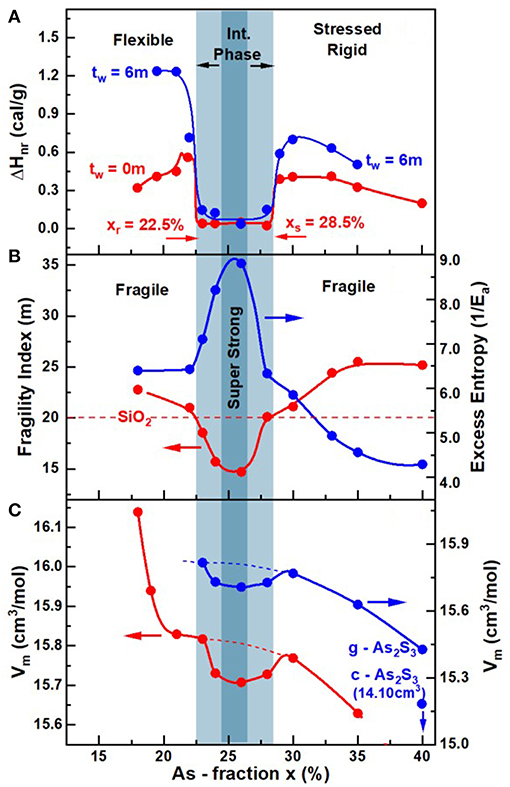
Figure 13. Compositional trends in (A) enthalpy of relaxation at Tg (ΔHnr) (B) melt fragility index and (C) glass molar volumes displaying local minima in the 22.5% < x < 28.5% range, the light blue panel. In (B) we also plot the inverse of the activation energy, Ea, for enthalpy relaxation times. In (A) the light blue panel gives the glass reversibility window, (B) compositions for which m < 20 defines the fragility window, and in (C) the local minimum in molar Volumes illustrates the volumetric window in glasses. To better illustrate Vm(x) results at x > 30%, we have redrawn the data on a coarser ordinate scale on the right to illustrate the reduction in Vm in both g- and c- As2S3 [14.10(2) cm3] (Robie and Bethke, 1962).
The increase of Tg(x) with x (Figure 11A) and the observation of the reversibility window (Figure 11B) uniquely fixes the Topological Phases in the present As-S glasses. Glass compositions at x < xr with a lower Tg and thus <r>, are thus viewed to be in the Flexible phase, compared to those at x > xs that possess a higher Tg and thus <r> are in the Stressed-rigid phase, while those in between, xr < x < xs possess an optimal connectivity <r> to be in the Intermediate Phase (Figures 11B, 13A). The abruptness of the rigidity- and stress- transitions is fundamentally tied to the percolative nature of these elastic phase transitions (Thorpe et al., 2000). And to observe that intrinsic behavior in a laboratory experiment requires that glasses synthesized be homogeneous, ideally on an atomic scale. Experiments have shown that even if the homogeneity of a glass is established on a much larger scale of 50 μm, it is in practice a reasonably sufficient condition for the elastic phase transitions to be sharp (Bhosle et al., 2011). In the experiments, this requires that the variance of As content, <Δx>As, across an AsxS100−x batch composition, measured on a scale of 50 μm, to be < 0.5% (Figures 4, 6, 7). If the variance <Δx>As exceeds 3% or more, one expects the two transitions to be smeared (Bhosle et al., 2012a,b) leading to a Gaussian-like or even triangular shaped reversibility window as noted elsewhere (Bhosle et al., 2012a,b). Sulfur-rich glasses containing more than 80 mole% of S, in general, pose yet another challenge. A feature peculiar to the chemistry of Sulfur, is that the S8 ring conformation is more stable than a polymeric Sn chain one. Thus, when melts are cooled S-rich domains condense into a S8-rich-nanophase once the T < 150°C, the Tλ transition. The segregated S8-rich nanophase cuts the As-S polymeric backbone and serves as an impediment to the growth of that backbone. In this work (section Kinetics of Melt/Glass Homogenization) we show that once glass/melts are homogenized, an additional step of low-temperature heating above Tg for 24 h or more, is crucial to coalesce fragmented segments of the backbone between the S8 rich nanophase domains, to observe the elusive mode of the As = S stretch mode near 537 cm−1 of the As-centered, S = As(S1/2)3 quasi-tetrahedral units.
The assignment of the 537 cm−1 mode with the S = As(S1/2)3 QT units is in complete agreement with the calculated frequency of that As = S stretch mode using NRLMOL code (Chen et al., 2008). More significantly the compositional variation of the mode scattering strength unambiguously shows a maximum near x = 18%, precursive to the onset of rigidity (see Supplementary Information). The QT and PYR units are each isostatically rigid (nc = 3), and their presence in comparable amounts in the backbone assists in stabilizing the IP by the increased configurational entropy (Sc) of the backbone (Yan, 2018). Our FT-Raman scattering results on the present As-S glasses also show (see Supplementary Information) that the scattering strength of the 490 cm−1 mode shows a maximum near x = 25% in the present binary, in harmony with the assignment as a stretch mode of S-S dimer linking AsS3 pyramids. Thus, our earlier assignment (Chen et al., 2008) of the 490 cm−1 with QT units is clearly not supported by these new results on especially homogenized glasses.
Aging Behavior of ΔHnr(x) and Network Configurational Entropy Sc
Our aging experiments on As-S glasses performed at RT for 6 months show that the enthalpy of relaxation, ΔHnr(x), increases nearly 4-folds in the flexible phase (x < 22.5%) and by nearly 2-folds in the stressed-rigid phase (x > 28.5%), and remains unchanged and near vanishing in the Intermediate phase. These results unambiguously show the stability of the Intermediate phase over the neighboring phases in the present glasses. In particular the abrupt nature of the rigidity- and stress- elastic phase transition remains intact upon aging.
In our aging experiments, glasses were held at room temperature (Ta = 25°C). And since the kinetics of aging are determined by the Ta/Tg ratio, one expects aging of ΔHnr(x), in the flexible phase (Ta/Tg = 0.80) to be more pronounced than in the stressed rigid phase (Ta/Tg = 0.69), since Tg of glasses in the flexible phase (~100°C) are lower than those in the stressed rigid ones (~140°C). Our aging results are clearly in harmony with that expectation.
The vanishing of the ΔHnr(x) term in the Intermediate phase suggests that network glasses possess melt-like configurational entropy. The aging related increase of the ΔHnr(x) term outside the IP suggests that there are entropy sinks contributing to the lowering of the configurational entropy in those phases. We view the formation of S8 rings as entropy sinks in the flexible phase, which lead to an increase of the ΔHnr(x) term. A perusal of the observed Raman spectra of the glasses (Figure 8) shows a rather pronounced growth in scattering strength of the S8 related vibrational features near 217 cm−1 and 472 cm−1 as the As content of glasses, x is <24%. In the stressed-rigid glasses formed at x > 28.5%, one expects the entropy of the glassy backbones to steadily reduce since both QT- and PYR-local structures are formed in the IP, but only PYR-local structures persist as x increases to 40%. The steadily decreasing chemical disorder as x increases to 40%, may be viewed as aspects of local and intermediate range structure that contribute to the lowering of configurational entropy. And since Vm of c-As2S3 is quite low, one expects Vm(x) in the glasses to also decrease as x increases to the stoichiometric composition, x = 40%. That view is independently corroborated by the configurational entropy, Sc, variation within the Adam Gibbs approach, which is determined by the inverse of the activation energy Ea (Figure 13B) of the enthalpy relaxation times (section Ideal Glasses, IP, and Configurational Entropy) deduced from fragility index measurements. Note that in Figure 13B, the variation of 1/Ea against x, displays a maximum in the IP and 1/Ea steadily decreases in the stressed-rigid phase. We revisit the glass network configurational entropy considerations in section Ideal Glasses, IP, and Configurational Entropy in context with the nature of ideal glasses formed in the IP.
We conclude this section with a comment. Although stoichiometric g-As2S3 possesses a <r> = 2.40, it is quite noteworthy that no IP forms around that composition (McCloy et al., 2010) as suggested by the finite enthalpy of relaxation observed for the stoichiometric glass. The stoichiometric glass is segregated into an As-rich nano phase and a S-rich As2S3+δ. The NSPS structure does not sustain an IP. This result in not peculiar to As2S3.
The Rigidity Phase Transition in AsxS100-x Glasses Near x = 22.5%
The Phillips-Thorpe prediction for onset of rigidity in disordered molecular networks (Thorpe et al., 2000; Phillips, 2004) near <r> = 2.40 has been remarkably successful in understanding the Group IV-selenides and sulfides (Selvanathan et al., 1999; Bhosle et al., 2011, 2012a,b; Chakraborty and Boolchand, 2014) [Ge(or Si)]x[Se)]100-x. The elastic phase transition stems from isostatically rigid (nc = 3) local structures, such as GeSe4 or SiSe4 or GeS4 tetrahedral units that percolate near a mean <r> = 2.40. On the other hand, the case of the group V-chalcogenides, such As-Se, P-Se, drew attention several years ago, when one noticed that onset of rigidity is observed at a measurably lower mean coordination number near <r> = 2.28 (Georgiev et al., 2000; Boolchand et al., 2009). The transition was identified with presence of isostatically rigid (i.e., nc = 3) local structures based on QT (Ch = Pn(Ch1/2)3) units formed in Pnictide (Pn = P or As) based chalcogenides (Ch = S or Se). The case of binary P-Se (Georgiev et al., 2001), and ternary (P or As)xGeySe100−x−y (Chakravarty et al., 2005; Qu and Boolchand, 2005; Chbeir et al., 2019) have convincingly shown in calorimetric and Raman scattering evidence that the onset of rigidity occurs near <r> of 2.28, suggesting that Pn- centered QT local structures are implicated in the percolation of rigidity at the lower connectivity. We note that the <r> of the QT species is 2.28.
The case of the present As-S binary, where the onset of rigidity transition occurs near <r> = 2.22, even lower than the usual circumstance near <r> = 2.28, opens the obvious question, how are we understand the shift to an <r> to an even lower value of <r> than 2.28? We believe these observations have a structural connection, and comment on it next.
MDSC experiments on PxS100−x glasses show (Vempati, 2005) the reversibility window to occur in the 16% < x < 19% range (Figure 14). Raman scattering measurements unequivocally show three well-resolved vibrational modes near 377, 416, and 472 cm−1. These modes are, respectively identified (Vempati, 2005) with the stretch modes of S = P(S1/2)3 QT units labeled as P4, P(S1/2)3 PYR units labeled as P3, and polymeric Sn chains (Boolchand et al., 2009). And from the observed scattering strength ratio of the QT and PYR modes, one obtains an approximate concentration ratio NP4/NP3 of 0.60(5). The stoichiometry of the backbone suggested for onset of the rigidity transition near x = 16% is then found to be near P28S82. These data clearly suggest that the polymeric Sn chains are largely decoupled from the backbone in these binary PxS100−x glasses. It is useful to remind ourselves that the stoichiometry of the P-Se backbone at the onset of the rigidity transitions in PxSe100−x glasses also occurs near x = 28.0%, except in these binary glasses the polymeric Sen chains comprise part of the isostatically rigid backbone. Thus, the structural picture that emerges is that while in the P-Se binary glasses the polymeric Sen chains form part of the backbone, in sharp contrast in binary P-S binary glasses the polymeric Sn chains are nearly completely decoupled from the backbone causing the onset of rigidity to shift down in x rather strikingly. One could not have guessed from the Raman scattering results alone if the polymeric Sn chains are part of or decoupled from the glassy backbone, but when these optical measurements are correlated with the Calorimetric ones, a clear interpretation of the shift in the elastic phase transition to lower x in the P-S binary emerges.
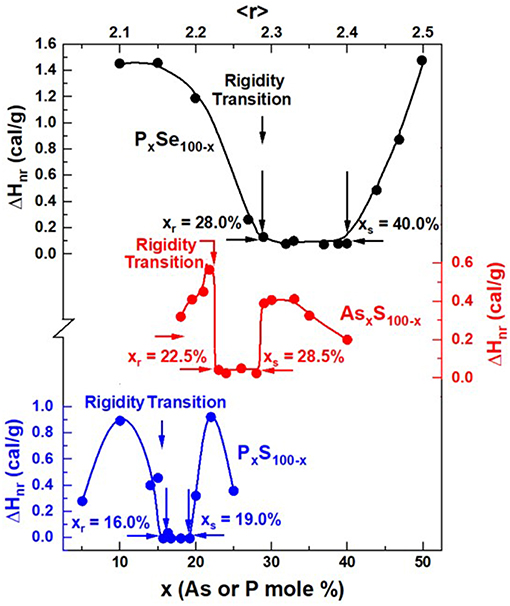
Figure 14. Observed reversibility windows in PxS100−x (Vempati, 2005), AsxS100−x (Figure 11B, tm = 0, present work), and PxSe100−x (Chakravarty et al., 2005) glasses. Note that the rigidity transition, xr = 16% in PxS100−x, shifts up to xr = 22.5% in AsxS100−x, and then to xr = 28% in the PxSe100−x binary.
That brings us to the case of the present As-S binary glasses. We note that the onset of rigidity (Figure 14) occurs near xr = 22.5%, shifted down from the case of P-Se binary at xr = 28% by nearly 6% in x. This is nearly half-way in between the shift in x observed between the onset of rigidity in the P-Se binary near xr = 28% and the onset of rigidity transition near xr = 16% in the P-S binary. The case of the As-S binary poses formidable challenges in uniquely fitting the observed Raman lineshapes to deduce the fraction of QT/PYR near x = 22.5% as we eluded to in section Raman Scattering on AsxS100−x Glasses. Nevertheless, from the location of the rigidity transition xr = 22.5% in As-S glasses, we speculate that in these sulfide glasses nearly half of the polymeric Sn chains are decoupled from the backbone. That observation reminds of the finding in our Raman profiling experiments that showed in the final step of melt quenching after Tg cycling S-rich glasses (x < 22%), one clearly observes (See Figures 4, 6 for example) the S8 ring fraction in glasses to sharply decrease, underscoring that the polymeric Sn fraction has increased. And it would appear that not all these Sn chain fragments become part of the backbone. The behavior needs to be further explored in future work.
Compaction of IP Glassy Networks in Homogeneous AsxS100-x Glasses
The molar volume Vm(x), variation in the present glasses (Figures 11D, 13C) displays three rather distinct regimes; in the flexible phase one observes a pronounced growth in Vm(x) at x < 20% (b) in the IP range one observes a Gaussian-like local minimum, and (c) in the stressed-rigid phase a rather sharp reduction of Vm(x) occurs at x > 29%. Equally striking is the fact that Vm(x) in the IP range systematically exceed those noted earlier in the glasses synthesized by Chen et al. (2008). Furthermore, one cannot miss noting that trends in Vm(x) in the three regions, in the especially homogenized glasses of the present work, are completely distinct. At x < 21%, Vm(x) increases precipitously and at low x, at x > 30%, Vm(x) decreases remarkably, while in the IP, one observes a Gaussian-like minimum. Trends in Vm(x) in our earlier investigations (Chen et al., 2008) showed a clear smearing of the variation near the two elastic phase boundaries (rigidity and stress) separating these three regions. These differences in trends of Vm(x) are most likely connected to the homogeneity of glasses synthesized in the present work.
The pronounced growth of Vm at x < 20% (Figure 11D) appears to be closely correlated with the sharp increase in the concentration of S8 rings observed in Raman scattering (Figure 8). Here we must remember that the inter-ring forces that stabilize the S8 ring nanophase derive from lone pair interactions. On the other hand, at x > 30%, the sharp reduction in Vm(x) must surely be tied to the pronounced growth of pyramidal As(S1/2)3 local units with a <r> of 2.40 that promote increased cross-linking of the glasses as one approaches the stoichiometric glass composition at x = 40%. The crystalline phase (orpiment) that is fully polymerized has the lowest Molar volume of 14.10(2) cm3 (Robie and Bethke, 1962). The local minimum in Vm(x) observed in the IP, so clearly displayed in the present homogeneous glasses, confirms the role of the weaker long range forces (van der Walls, and Coulombic) that come into play when the strong covalent forces (bond-bending and bond-stretching) are exactly balanced by the degrees of freedom of 3 per atom. Network compaction in the IP is the realization of the Maxwell-Phillips rigidity criteria, nc = nd, being exactly fulfilled in that special phase. The absence of a smearing of that local minimum near the edges is a direct reflection of the low variance in <Δx>As in the presently synthesized bulk glasses.
Correlating Melt Fragility Index With Glass Enthalpy of Relaxation
The key central finding of the present work is that the melt fragility index m(x) in the AsxS100−x binary is found to be closely correlated to the glass enthalpy of relaxation. Specifically, glassy melts examined in the composition range 22.5% < x < 28.5% (Figure 12A) display a Gaussian-like minimum of the fragility index m(x). A perusal of the observed variation in m(x) shows that m < 20 in the said range, but increases to m > 20 outside that range. One defines the melt composition range across which m < 20 to be the “fragility window”. These fragility index measurements made use of the same especially homogenized bulk glasses that were used to establish the glass enthalpy of relaxation that revealed the square-well like variation defining the “reversibility window” (Figure 11B). The observed trends in the compositional variation of the fragility index, m(x), characteristic of melts, and the enthalpy of relaxation at Tg, ΔHnr(x), a quantity that characterizes the glasses shows that there exists a rather intimate relationship between melts and glasses. These trends demonstrate that super-strong melts upon cooling to Tg give rise to isostatically rigid glasses in the Intermediate Phase (Figure 13). While, fragile melts formed at non-IP compositions upon cooling will give rise to either Flexible glasses or Stressed-rigid ones. Furthermore, one can also distinguish the fragile melts that give rise to Flexible glasses from those that form Stressed-Rigid ones. In Flexible glasses the fragility index decreases with increasing Tg, but in Stressed-rigid ones, the reverse is true, i.e., the fragility index increases with Tg.
The intimate correlation between the fragility window and the reversibility window noted here for the As-S binary is reminiscent of two other recent reports on chalcogenides, one on the Ge-Se binary (Gunasekera et al., 2013) and the other on the Ge-S binary (Chakraborty and Boolchand, 2014), where closely similar results are found. The melt-glass correlation has also been noted in a modified oxide (Mohanty, 2018) the case of—sodium phosphate glasses. These new findings clearly suggest that the correlation between melt dynamics and glass Topological phases may well be a generic feature of the glassy state of matter.
Equilibrium Phase Diagram, Eutectics, and Aging of the Reversibility Window
The equilibrium phase diagram of As-S binary was reported in the year 1981 by Borisova (1981). In the report the author found the existence of a eutectic near an As composition of x = 15% with a eutectic temperature (TE) of about 150°C. Subsequently the phase diagram was re-investigated in 1990 by Okamoto in Binary Alloy Phase diagram 2nd Edition (Okamoto, 1990). In this later report, interestingly, no evidence of a eutectic was found.
Our results on the aging of the reversibility window in the present As-S binary glass system shown in Figures 11B, 13A is fully compatible with the absence of a eutectic near x = 15%. Indeed, if there was a eutectic near x = 15%, one would expect the rigidity transition to smear with aging time and not to show an abrupt change in the enthalpy of relaxation as documented in Figures 11B, 13A.
We conclude this section with a final remark. In both the AsxSe100−x and PxSe100−x binary systems, the equilibrium phase diagrams display evidence (Monteil and Vincent, 1975; Okamoto, 2000) of a eutectic near x = 20%. The presence of the eutectic has attracted much interest in glass science. It constitutes signature of phase separation that causes the liquidus to locally decrease. That circumstance assists in rapid cooling of melts and has been used to promote (Richet, 2001) glass formation in metallic systems. The presence of a eutectic in the As-Se and P-Se binary systems has another interesting consequence. In both these binary systems, we have reported evidence of reversibility windows; for the As-Se binary in the 28% < x < 37% range, and for the P-Se binary in the 28% < x < 40% (Georgiev et al., 2003a; Ravindren et al., 2014). However, in both these systems, aging of glasses inevitably leads to the smearing of the rigidity transition and even narrowing of the reversibility window (Chen et al., 2010) since the Tg's of the glasses near the rigidity transition are quite close to the Eutectic Temperature (TE). It is for this reason the reversibility window does not retain its near square-well shape upon aging of the glasses when heated to Tg. That circumstance needs to be distinguished from the case when no eutectic occurs in the vicinity of the reversibility window, as is the case in the present As-S binary and the rigidity- and stress- transition continue to be abrupt both in the fresh and aged glasses and elsewhere (Bhosle et al., 2011; Chakraborty and Boolchand, 2014; Chbeir et al., 2019).
Ideal Glasses, IP, and Configurational Entropy
Adam-Gibbs (Adam and Gibbs, 1965) suggested that the exponential increase in viscosity of a melt as it is cooled to a temperature T, can be tied to its loss of excess configurational entropy (Sc) by the following equation,
Since the viscosity of a melt is viewed to be a thermally–activated process
One must conclude from equations 5 and 6 that the excess configuration entropy Sc must vary as the inverse of the activation energy of enthalpy 1/Ea. From MDSC experiments on the present glasses we have established Ea, the activation energy for enthalpy relaxation (Figure 3 and Equation 3). The compositional variation of 1/Ea (Figure 12C) displays a pronounced peak centered on the IP. The result implies that IP melts must continue to possess a high configurational entropy even when such melts are cooled to near Tg (Yan, 2018). The excess entropy Sc is defined as the entropy difference between the super cooled liquid at T and the state of the glass at which the entropy can no longer be lost (Bestul and Chang, 1964). The high configurational entropy of IP glass compositions is precisely what is also implied in the minuscule or vanishing enthalpy of relaxation ΔHnr(x) of these special glass compositions. In contrast the abrupt and sizable increase of the ΔHnr(x) term in non-IP compositions (flexible and stressed-rigid phase) is due to such networks possessing entropy sinks. In the flexible phase the entropy sinks include S8 monomers for which direct evidence emerges from not only the Raman vibrational modes of these species (Figure 8) but also the pronounced increase of molar volumes at x < 22.5% (Figure 13C) evolving in the flexible phase. In the stressed-rigid phase the entropy sinks include pyramidal (AsS1/2)3 units that steadily compact the backbone network into structural configurations akin to those found in orpiment as revealed by Raman scattering (Figure 8) as well as the variation of Molar volumes (Figure 13C). IP glasses represent ideal glasses. They not only possess a high glass forming tendency, show minimal aging, and form isostatically rigid structures that are adaptive in nature. These ideal glasses also exist only in high configurational entropy structures as found in corresponding melts. These observations on IP glasses as ideal glasses are clearly at variance with the notion advanced many years ago that ideal network glasses possess low configurational entropy and form at T close to the Kauzmann temperature (Angell, 1995).
Conclusions
We have examined especially homogenized AsxS100−x glasses in Modulated-DSC, Raman scattering and Molar volume experiments over a wide range, 12% < x < 40%, of compositions. Glasses were synthesized by alloying As2S3 and elemental S as starting materials in evacuated quartz tubes, and quenched melts Raman profiled as a function alloying time till the observed lineshapes along the length of melt column became identical. Sulfur-rich (x < 20%) melts required about 6 weeks while S-deficient ones (x > 20%) about 4 weeks of alloying time at 650°C to homogenize. In such homogenized glasses the variance in As content, <Δx>As across 1.5 gram sized batches reduced by an order of magnitude to become < %. A second step of heating glasses at Tg + 10°C for 2 days, once glasses were homogenized, was found sufficient to observe the elusive 537 cm−1 mode of the S = As stretch mode of S = As(S1/2)3 local structures at x < 26% in FT-Raman scattering experiments. In such glasses, the enthalpy of relaxation at Tg, ΔHnr(x), displays a square-well like variation in the 22.5% < x < 28.5% composition range even in the fresh state, defining the Reversibility window. The fragility index, m(x), of corresponding melts show a Gaussian-like local minimum with m < 20 in the same composition range, thus defining a Fragility window. Molar volumes, Vm(x), of glasses display a local Gaussian like minimum localized entirely in the Reversibility window and underscoring the compacted nature of glasses formed in that composition range defining a Volumetric window. On AsxS100−x glasses that were alloyed for 3 days at 650°C in our previous work (Chen et al., 2008), the Vm(x) window is found to be smeared at its edges by comparison (Figure 11D), because of the larger variance in As-stoichiometry <Δx>As across the same size batches synthesized. At low x (< 20%) in the Flexible phase, glasses are segregated into a S8-rich nanophase and an As-S bearing glassy backbone. At medium x (22.5% < x < 28.5%) glassy backbones composed of both QT and PYR local structures form the building blocks of the isostatically rigid Intermediate Phase (IP) displaying a vanishing ΔHnr(x) term, and with corresponding melts displaying a super-strong behavior (m < 20) that contributes to the delayed homogenization of melts. At high x (28.5% < x < 40%) glasses exist in a Stressed-rigid phase, possessing an increasing ΔHnr(x) term, and with corresponding melts becoming increasingly fragile, m(x)>20, with increasing x. These results unequivocally demonstrate that superstrong melts yield isostatically rigid glasses, while fragile one's form either Flexible or Stressed rigid glasses upon cooling past Tg. The most exceptional nature of AsxS100−x glasses formed in the 22.5% < x < 28.5% range, displaying a Reversibility window, a Volumetric window, and their melt counterparts showing a Fragility window, are realization of the self-organized IP formed in these network glasses.
Data Availability
Publicly available datasets were analyzed in this study. This data can be found here: https://pubs.acs.org/doi/abs/10.1021/jp411823j.
Author Contributions
SC synthesized glasses and performed Modulated DSC experiments, Raman scattering, and Molar volume experiments, he analyzed these data working closely with RC, PC, and PB. MM assisted with discussions on topological phases, melt dynamics, and ideal glasses. PB coordinated the experimental work performed at University of Cincinnati, and all co-authors including RC, MM, PC, and PB assisted in writing the manuscript.
Funding
PB acknowledges support from NSF grant DMR 08-53957. MM acknowledges support of Agence Nationale de la Recherche (ANR) Grant No ANR-11-BS08-10012 from American Fulbright Commission and International Materials Institute (H. Jain).
Conflict of Interest Statement
The authors declare that the research was conducted in the absence of any commercial or financial relationships that could be construed as a potential conflict of interest.
Acknowledgments
It is a pleasure to acknowledge discussions with Dr. Richard Zallen and Dr. Jim Phillips on issues of glass science spread over several decades. We thank Dr. Alan Jackson for assistance with simulation package NRLMOL to calculate Raman and Infrared vibrations from characteristic local structures. We have benefitted from discussions with Caleb McDonald, Len Thomas and Steve Hall on the use of the Q2000 TA Instruments MDSC.
Supplementary Material
The Supplementary Material for this article can be found online at: https://www.frontiersin.org/articles/10.3389/fmats.2019.00166/full#supplementary-material
Footnotes
1. ^3D XPointTM: A Breakthrough in Non-Volatile Memory Technology. Intel. Available online at: https://www.intel.com/content/www/us/en/architectureand-technology/intel-micron-3d-xpoint-webcast.html (accessed April 17, 2019).
References
Adam, G., and Gibbs, J. H. (1965). On the temperature dependence of cooperative relaxation properties in glass-forming liquids. J. Chem. Phys. 43, 139–146. doi: 10.1063/1.1696442
Andrikopoulos, K. S., Kalampounias, A. G., and Yannopoulos, S. N. (2005). Rounding effects on doped sulfur's living polymerization: the case of As and Se. Phys. Rev. B 72:014203. doi: 10.1103/PhysRevB.72.014203
Angell, C. A. (1991). Relaxation in liquids, polymers and plastic crystals - strong fragile patterns and problems. J. Non Cryst. Solids 131, 13–31. doi: 10.1016/0022-3093(91)90266-9
Angell, C. A. (1995). Formation of glasses from liquids and biopolymers. Science 267, 1924–1935. doi: 10.1126/science.267.5206.1924
Bellissent, R., Descotes, L., Boué, F., and Pfeuty, P. (1990). Liquid sulfur: local-order evidence of a polymerization transition. Phys. Rev. B 41, 2135–2138. doi: 10.1103/PhysRevB.41.2135
Bestul, A. B., and Chang, S. S. (1964). Excess entropy at glass transformation. J. Chem. Phys. 40, 3731–3733. doi: 10.1063/1.1725086
Bhosle, S., Gunasekera, K., Boolchand, P., and Micoulaut, M. (2012a). Melt homogenization and self-organization in chalcogenides-part I. Int. J. Appl. Glass Sci. 3, 189–204. doi: 10.1111/j.2041-1294.2012.00093.x
Bhosle, S., Gunasekera, K., Boolchand, P., and Micoulaut, M. (2012b). Melt homogenization and self-organization in chalcogenides-part II. Int. J. Appl. Glass Sci. 3, 205–220. doi: 10.1111/j.2041-1294.2012.00092.x
Bhosle, S., Gunasekera, K., Chen, P., Boolchand, P., Micoulaut, M., and Massobrio, C. (2011). Meeting experimental challenges to physics of network glasses: assessing the role of sample homogeneity. Solid State Commun. 151, 1851–1855. doi: 10.1016/j.ssc.2011.10.016
Böhmer, R., Ngai, K. L., Angell, C. A., and Plazek, D. J. (1993). Nonexponential relaxations in strong and fragile glass formers. J. Chem. Phys. 99, 4201–4209. doi: 10.1063/1.466117
Bonazzi, P., Menchetti, S., and Pratesi, G. (1995). The crystal structure of pararealgar, As 4 S 4. Am. Mineral. 80, 400–403. doi: 10.2138/am-1995-3-422
Boolchand, P. (2000). The maximum in glass transition temperature (Tg) near x = 1/3 in GexSe1-x glasses. Asian J. Phys. 9, 709–721.
Boolchand, P., Chen, P., and Vempati, U. (2009). Intermediate phases, structural variance and network demixing in chalcogenides: the unusual case of group V sulfides. J. Non Cryst. Solids 355, 1773–1785. doi: 10.1016/j.jnoncrysol.2008.11.046
Boolchand, P., Georgiev, D. G., and Goodman, B. (2001). Discovery of the intermediate phase in chalcogenide glasses. J. Optoelectr. Adv. Mater. 3, 703–720.
Boolchand, P., Georgiev, D. G., Qu, T., Wang, F., Cai, L., and Chakravarty, S. (2002). Nanoscale phase separation effects near rfl = 2.4 and 2.67, and rigidity transitions in chalcogenide glasses. Comptes Rendus Chime 12, 713–724. doi: 10.1016/S1631-0748(02)01440-6
Boolchand, P., and Goodman, B. (2017). Glassy materials with enhanced thermal stability. MRS Bull. 42, 23–28. doi: 10.1557/mrs.2016.300
Borisova, Z. (1981). Glassy Semiconductors. Springer. Available online at: https://www.springer.com/us/book/9781475708530 (accessed March 31, 2019).
Bychkov, E., Miloshova, M., Price, D. L., Benmore, C. J., and Lorriaux, A. (2006). Short, intermediate and mesoscopic range order in sulfur-rich binary glasses. J. Non Cryst. Solids 352, 63–70. doi: 10.1016/j.jnoncrysol.2005.11.002
Carpentier, L., Desprez, S., and Descamps, M. (2003). From strong to fragile glass- forming systems: a temperature modulated differential scanning calorimetry investigation. Phase Transit. 76, 787–799. doi: 10.1080/01411590310001603708
Chakraborty, S., and Boolchand, P. (2014). Topological origin of fragility, network adaptation, and rigidity and stress transitions in especially homogenized nonstoichiometric binary GeS glasses. J. Phys. Chem. B 118, 2249–2263. doi: 10.1021/jp411823j
Chakravarty, S., Georgiev, D. G., Boolchand, P., and Micoulaut, M. (2005). Ageing, fragility and the reversibility window in bulk alloy glasses. J. Phys. Condens. Matter 17, L1–L7. doi: 10.1088/0953-8984/17/1/L01
Chbeir, R., Bauchy, M., Micoulaut, M., and Boolchand, P. (2019). Evidence for a correlation of melt fragility index with topological phases of multicomponent glasses. Front. Mater. 6:173. doi: 10.3389/fmats.2019.00173
Chen, P., Boolchand, P., and Georgiev, D. G. (2010). Long term aging of selenide glasses: evidence of sub-Tg endotherms and pre-Tg exotherms. J. Phys. Condens. Matter 22. doi: 10.1088/0953-8984/22/6/065104
Chen, P., Holbrook, C., Boolchand, P., Georgiev, D. G., Jackson, K. A., and Micoulaut, M. (2008). Intermediate phase, network demixing, boson and floppy modes, and compositional trends in glass transition temperatures of binary As-S system. Phys. Rev. B 78:224208. doi: 10.1103/PhysRevB.78.224208
Georgiev, D. G., Boolchand, P., Eckert, H., Micoulaut, M., and Jackson, K. (2003a). The self-organized phase of bulk P x Se 1 – x glasses. Europhys. Lett. 62, 49–55. doi: 10.1209/epl/i2003-00361-2
Georgiev, D. G., Boolchand, P., and Jackson, K. A. (2003b). Intrinsic nanoscale phase separation of bulk As 2 S 3 glass. Philos. Mag. 83, 2941–2953. doi: 10.1080/1478643031000151196
Georgiev, D. G., Boolchand, P., and Micoulaut, M. (2000). Rigidity transitions and molecular structure of AsxSe1Àx glasses. Phys. Rev. B 4, R9228–R9231.
Georgiev, D. G., Mitkova, M., Boolchand, P., Brunklaus, G., Eckert, H., and Micoulaut, M. (2001). Molecular structure, glass transition temperature variation, agglomeration theory, and network connectivity of binary P-Se glasses. Phys. Rev. B 64, 134204-1–134204-11. doi: 10.1103/PhysRevB.64.134204
Golovchak, R., Shpotyuk, O., Mccloy, J. S., Riley, B. J., Windisch, C. F., Sundaram, S. K., et al. (2010). Structural model of homogeneous As-S glasses derived from Raman spectroscopy and high-resolution XPS. Philos. Mag. 90, 4489–4501. doi: 10.1080/14786435.2010.510455
Goncalves, C., Kang, M., Sohn, B.-U., Yin, G., Hu, J., Tan, D. T. H., et al. (2018). New candidate multicomponent chalcogenide glasses for supercontinuum generation. Appl. Sci. 8:2082. doi: 10.3390/app8112082
Gouda, P. (2012). Arsenic Selenium Antimony Ultra-trace Analysis Atomic Absorption Spectroscopy, Inductively Coupled Plasma, Bench Chemistry. 3rd Edn. Bloomington, IN: iUniverse, Inc.
Gunasekera, K., Bhosle, S., Boolchand, P., and Micoulaut, M. (2013). Superstrong nature of covalently bonded glass-forming liquids at select compositions. J. Chem. Phys. 139:164511. doi: 10.1063/1.4826463
Kalampounias, A. G., Andrikopoulos, K. S., and Yannopoulos, S. N. (2003). Probing the sulfur polymerization transition in situ with Raman spectroscopy. J. Chem. Phys. 118, 8460–8467. doi: 10.1063/1.1566938
Lide, D. R., Baysinger, G., Chemistry, S., Berger, L. I., Goldberg, R. N., and Kehiaian, H. V. (2005). CRC Handbook of Chemistry and Physics. CRC Press. Available online at: http://www.hbcpnetbase.com
Málek, J. (1997). Dilatometric study of structural relaxation in arsenic sulfide glass. Thermochimica Acta 311, 183–198. doi: 10.1016/S0040-6031(97)00466-8
Malventano, A. (2017). How 3D XPoint Phase - Change Memory Works. Available online at: https://www.pcper.com/reviews/Editorial/How-3D-XPoint-Phase-Change-Memory-Works
Mantisi, B., Bauchy, M., and Micoulaut, M. (2015). Cycling through the glass transition: evidence for reversibility windows and dynamic anomalies. Phys. Rev. B 92:134201. doi: 10.1103/PhysRevB.92.134201
Mauro, J. C., Yue, Y., Ellison, A. J., Gupta, P. K., and Allan, D. C. (2009). Viscosity of glass-forming liquids. Proc. Natl. Acad. Sci. U. S. A. 106, 19780–19784. doi: 10.1073/pnas.0911705106
Maxwell, J. C. (1864). L. On the calculation of the equilibrium and stiffness of frames. Philos. Mag. Ser. 4, 294–299. doi: 10.1080/14786446408643668
McCloy, J. S., Riley, B. J., Sundaram, S. K., Qiao, H. A., Crum, J. V., and Johnson, B. R. (2010). Structure-optical property correlations of arsenic sulfide glasses in visible, infrared, and sub-millimeter regions. J. Non Cryst. Solids 356, 1288–1293. doi: 10.1016/j.jnoncrysol.2010.04.018
Micoulaut, M. (1998). The slope equations: a universal relationship between local structure and glass transition temperature. Eur. Phys. J. B 294, 277–294. doi: 10.1007/s100510050184
Micoulaut, M. (2010). Linking rigidity transitions with enthalpic changes at the glass transition and fragility: insight from a simple oscillator model. J. Phys. Condens. Matter 22:285101. doi: 10.1088/0953-8984/22/28/285101
Mohanty, C. (2018). Direct evidence for topological phases in sodium phosphate glasses from Raman scattering, infrared reflectance and modulated dsc (Master's thesis). University of Cincinnati, Cincinnati, OH.
Monteil, Y., and Vincent, H. (1975). Les seleniures de phosphore. J. Inorg. Nucl. Chem. 37, 2053–2056. doi: 10.1016/0022-1902(75)80828-1
Okamoto, H. (2000). As - Se: Desk Handbook: Phase Diagrams for Binary Alloys. Materials Park: ASM International.
Phillips, J. C. (1979). Topology of covalent non-crystalline solids.1. Short-range order in chalcogenide alloys. J. Non Cryst. Solids 34, 153–181. doi: 10.1016/0022-3093(79)90033-4
Phillips, J. C. (2004). Constraint theory and hierarchical protein dynamics. J. Phys. Condens. Matter 16, S5065–S5072. doi: 10.1088/0953-8984/16/44/004
Phillips, J. C., Beevers, C. A., and Gould, S. E. B. (1980). Molecular structure of As2Se3 glass. Phys. Rev. B 21, 5724–5732. doi: 10.1103/PhysRevB.21.5724
Qu, T., and Boolchand, P. (2005). Shift in elastic phase boundaries due to nanoscale phase separation in network glasses: the case of Ge x As x S1- 2 x. Philos. Mag. 85, 875–884. doi: 10.1080/147864304123314636
Raoux, S. (2009). Phase change materials. Annu. Rev. Mater. Res. 39, 25–48. doi: 10.1146/annurev-matsci-082908-145405
Ravindren, S., Gunasekera, K., Tucker, Z., Diebold, A., Boolchand, P., and Micoulaut, M. (2014). Crucial effect of melt homogenization on the fragility of non-stoichiometric chalcogenides. J. Chem. Phys. 140:134501. doi: 10.1063/1.4869107
Robie, R. A., and Bethke, P. M. (1962). Molar Volumes and Densities of Minerals. Reston, VA: U.S. Geological Survey.
Scopigno, T., Yannopoulos, S. N., Scarponi, F., Andrikopoulos, K. S., Fioretto, D., and Ruocco, G. (2007). Origin of the λ transition in liquid sulfur. Phys. Rev. Lett. 99:025701. doi: 10.1103/PhysRevLett.99.025701
Selvanathan, D., Bresser, W. J., Boolchand, P., and Goodman, B. (1999). Thermally reversing window and stiffness transitions in chalcogenide glasses. Solid State Commun. 111, 619–624. doi: 10.1016/S0038-1098(99)00248-3
Sundaram, S. K., McCloy, J. S., Riley, B. J., Murphy, M. K., Qiao, H. A., Windisch, C. F., et al. (2011). Gamma radiation effects on physical, optical, and structural properties of binary As-S glasses. J. Am. Ceramic Soc. 95, 1048–1055. doi: 10.1111/j.1551-2916.2011.04938.x
Tang, S., Karpov, I. V., Dodge, R., Klehn, B., Kalb, J. A., Strand, J., et al. (2009). “A stackable cross point Phase Change Memory,” in 2009 IEEE International Electron Devices Meeting (Baltimore: IEDM), 1–4.
Thomas, L. (2005). T.A. Instruments. Modulated DSC Technology, Chapters (New Castle: TA Instruments), 1–9.
Thorpe, M. F. (1985). Rigidity percolation in glassy structures. J. Non Cryst. Solids 76, 109–116. doi: 10.1016/0022-3093(85)90056-0
Thorpe, M. F., Jacobs, D. J., Chubynsky, M. V., and Phillips, J. C. (2000). Self-organization in network glasses. J. Non Cryst. Solids 266–269, 859–866. doi: 10.1016/S0022-3093(99)00856-X
Tobolsky, A. V., and Eisenberg, A. (1959). Equilibrium polymerization of sulfur. J. Am. Chem. Soc. 81, 780–782. doi: 10.1021/ja01513a004
Tremblay, J.-É., Malinowski, M., Richardson, K. A., Fathpour, S., and Wu, M. C. (2018). Picojoule-level octave-spanning supercontinuum generation in chalcogenide waveguides. Opt. Express 26:21358. doi: 10.1364/OE.26.021358
Vempati, U. (2005). Reversibility Windows, Non-aging and Nano Scale Phase Separation Effects in Bulk Germanium-Phosphorus-Sulfide Glasses (Master's thesis). University of Cincinnati, Cincinnati, OH.
Wagner, T., Kasap, S. O., Vlček, M., Sklenár~, A., and Stronski, A. (1998). The structure of As xS100yx glasses studied by temperature-modulated differential scanning calorimetry and Raman spectroscopy. 5, 5581–5588. doi: 10.1016/S0022-3093(98)00194-X
Ward, A. T. (1968). Raman spectroscopy of sulfur, sulfur-selenium, and sulfur-arsenic mixtures. J. Phys. Chem. 72, 4133–4139. doi: 10.1021/j100858a031
Williams, M. L., Landel, R. F., and Ferry, J. D. (1955). The temperature dependence of relaxation mechanisms in amorphous polymers and other glass-forming liquids. J. Am. Chem. Soc. 77, 3701–3707. doi: 10.1021/ja01619a008
Yamaguchi, M. (1985). The relationship between optical gap and chemical composition in chalcogenide glasses. Philos. Mag. B 51, 651–663. doi: 10.1080/13642818508243153
Yan, L. (2018). Entropy favors heterogeneous structures of networks near the rigidity threshold. Nat. Commun. 9:1359. doi: 10.1038/s41467-018-03859-9
Zallen, R. (1974). Pressure-Raman effects and vibrational scaling laws in molecular crystals: S 8 and As 2 S 3. Phys. Rev. B 9, 4485–4496. doi: 10.1103/PhysRevB.9.4485
Keywords: modulated differential scanning calorimeter (MDSC), Raman, molar volume, topological constraint theory, configurational entropy
Citation: Chakravarty S, Chbeir R, Chen P, Micoulaut M and Boolchand P (2019) Correlating Melt Dynamics and Configurational Entropy Change With Topological Phases of AsxS100–x Glasses and the Crucial Role of Melt/Glass Homogenization. Front. Mater. 6:166. doi: 10.3389/fmats.2019.00166
Received: 13 May 2019; Accepted: 25 June 2019;
Published: 15 July 2019.
Edited by:
Morten M. Smedskjaer, Aalborg University, DenmarkReviewed by:
Gerardo Naumis, National Autonomous University of Mexico, MexicoLe Yan, University of California, Santa Barbara, United States
Copyright © 2019 Chakravarty, Chbeir, Chen, Micoulaut and Boolchand. This is an open-access article distributed under the terms of the Creative Commons Attribution License (CC BY). The use, distribution or reproduction in other forums is permitted, provided the original author(s) and the copyright owner(s) are credited and that the original publication in this journal is cited, in accordance with accepted academic practice. No use, distribution or reproduction is permitted which does not comply with these terms.
*Correspondence: Punit Boolchand, Ym9vbGNocEB1Y21haWwudWMuZWR1