 Aleksandra Drozd-Rzoska
- Institute of High Pressure Physics Polish Academy of Sciences, Warsaw, Poland
The report presents the evidence for the hypothetically “universal” previtreous behavior of the pressure related apparent fragility: , where P* is the extrapolated singular pressure. This finding was the basis for deriving the “model-free” dependence for the pressure evolution of the structural relaxation time: . All these led to the new way of testing the dynamic crossover phenomenon via 1/mT (P) vs. P plot. Finally, the behavior of electric conductivity in the previtreous domain is discussed. The experimental evidence covers 8*OCB (liquid crystal), EPON 828 (resin), diisobutyl phthalate, and propylene carbonate (low molecular weight liquids). Experiments were carried up to extreme P~ 2.2 GPa, in the “bulk” measurement capacitor. This report also contains a summary of existing descriptions of the pressure evolution of structural relaxation time or viscosity on approaching the glass transition.
Introduction
The glass transition remains the grand challenge of the condensed matter physics and material engineering (Kennedy, 2005; Berthier and Ediger, 2016; Kremer and Loidl, 2018; Royall et al., 2018; Tong and Tanaka, 2018). Decades of research yielded the excellent experimental and theoretical evidence, based on increasingly sophisticated approaches (Donth, 2007; Berthier and Ediger, 2016; Kremer and Loidl, 2018; Royall et al., 2018; Tong and Tanaka, 2018). However, the long-awaited cognitive breakthrough is still elusive. Notable problems appear even for the hallmark feature of the previtreous dynamics: the super-Arrhenius (SA) evolution of viscosity η(T) or the structural (primary, alpha) relaxation time τ(T) (Ngai, 2011; Berthier and Ediger, 2016; Kremer and Loidl, 2018; Royall et al., 2018; Tong and Tanaka, 2018). The general SA relation has the following form (Donth, 2007; Ngai, 2011):
where P = 0.1MPa, T > Tg, Tg is for the glass temperature and R means the gas constant; Ea(T) denotes the apparent, temperature dependent, activation energy. This is related to the SA behavior. For the domain where for Ea(T) = Ea = const, one obtains the basic Arrhenius (A) relation. A similar relation describes η(T) changes.
The prefactor τ0 denotes the terminal value at the infinite temperature, for which is most often assumed. It is correlated with “infinite” temperature studies or the estimation the time scale of atomic vibrations,τ0 = h/kT (Donth, 2007; Ngai, 2011). However, when considering various glass formers ranging from low molecular weight liquids to liquid crystals and plastic crystals is evidenced (Drozd-Rzoska and Rzoska, 2006; Lunkenheimer et al., 2010; Martinez-Garcia et al., 2013).
The isothermal compressing constitutes the alternative path of approaching the glass transition. It offers unique possibilities of decoupling phenomena overlapping under atmospheric pressure, the selective focus on the free volume related properties or revealing the impact of phenomena “hidden” under pressure (Roland et al., 2005, 2008; Drozd-Rzoska et al., 2008a,b; Rzoska et al., 2010; Floudas et al., 2011; Kondrin et al., 2012; Rzoska, 2017).
The relation for describing the pressure-viscosity behavior was first proposed by Barus (B) via the relation η(P) ∝ exp(αP), α = const, (Barus, 1893). For describing the complex dynamics in the previtreous domain, one can consider the super-Barus (SB) relation, with the pressure dependent coefficient α(P):
where T = const, P < Pg, and Pg is for the glass (vitrification) pressure; Va(P) denotes the apparent activation volume (Roland et al., 2005, 2008; Rzoska et al., 2010; Floudas et al., 2011; Rzoska, 2017); is the reference prefactor.
The prefactor in SB Equation (2) can be approximated by the relaxation time under atmospheric pressure for the selected isotherm. Consequently, it ranges between 10−10s and 10s for the same glass former (Drozd-Rzoska et al., 2008a,b; Rzoska, 2017). The general SA-SB formula can be obtained linking Equations (1, 2) (Roland et al., 2005; Floudas et al., 2011):
where T > Tg and P < Pg. The similar relation occurs for η(T, P) changes.
Following Equation (3), the isobaric temperature evolution is described by:
where P = const.
Equation (4) coincides with the SA Equation (1) for P = 0, yielding τref. = τ0. In practice, such isobar can be approximated by temperature studies under atmospheric pressure (P ≈ 0.1MPa). It is notable that in high-pressure studies the pressure stabilization and determination hardly (if at all) reaches ±0.2MPa. For studies under moderate and high pressures Equation (4) suggest the more complex form of the prefactor.
Previtreous temperature changes of τ(T) or η(T) are inherently associated with the “Angell plot,” recognized as the hallmark picture for the glass transition physics (Angell, 1985; Böhmer et al., 1993; Donth, 2007; Ngai, 2011; Berthier and Ediger, 2016; Kremer and Loidl, 2018; Royall et al., 2018; Tong and Tanaka, 2018). It enables the common presentation of the previtreous dynamics for different glass formers via the normalized plot log10τ(T) or log10η(T) vs. Tg/T, assuming or (Angell, 1985; Böhmer et al., 1993). This plot led to the concept of fragility as the metric of the SA dynamics: m = mP(Tg) = [d log10τ(T)/d(Tg/T)]T = Tg, being one of the key concepts of the glass transition physics (Berthier and Ediger, 2016; Kremer and Loidl, 2018; Royall et al., 2018; Tong and Tanaka, 2018). In the Angell plot, the basic Arrhenius behavior manifests as the straight line for which m = mmin. = log10τ(Tg) − log10τ0 = 16, assuming (Böhmer et al., 1993). For the isothermal, pressure related previtreous behavior the plot log10τ(P) or log10η(P) vs. P/Pg has been indicated as the counterpart of the Angell plot, leading to the pressure related fragility (Roland et al., 2005; Rzoska et al., 2010; Floudas et al., 2011). However, for such plots, one obtains a “fan” of curves for the same glass former, due to the fact that log10τref. ranges between −10 and 1 for different tested isotherms. For the basic Barus behavior (Va(P) = Va = const in the given domain of pressures) the “minimal” fragility can range between 1 and 12, for an arbitrary glass former. To remove the inconsistency between temperature and pressures paths it was proposed to take into account that a solid/liquid can be isotropically stretched down to the absolute stability limit spinodal (PSL < 0), hidden under negative pressures (Lukacs and Martinas, 1990; Sciortono et al., 1995; Imre et al., 1998, 2002). Notable is the experimental evidence of the smooth passing P = 0, from the “positive” to the negative pressures domains in glass-forming liquids (Angell and Qing, 1989; Imre et al., 2002). Consequently, the plot log10τ(P) vs. ΔP = P − PSL as the pressure counterpart of the “Angell plot” was proposed (Drozd-Rzoska, 2005; Drozd-Rzoska et al., 2007, 2008b). This resulted in the approximately constant prefactor: and then the “universal” minimal fragility . All these led to the new definition of the apparent fragility , which can be linked to the “old” one as follows:
where ΔP = P − PSL, ΔPg = Pg − PSL and P ≤ Pg
General SA and SB equations for portraying experimental data cannot be used directly, because of unknown forms of the apparent activation energy and activation volume dependences. Consequently, “replacement equations” are used (Donth, 2007; Ngai, 2011; Kremer and Loidl, 2018; Royall et al., 2018; Tong and Tanaka, 2018). For temperature studies under the atmospheric pressure the dominant role plays the Vogel-Fulcher-Tammann (VFT) equation (Vogel, 1921; Fulcher, 1925; Tammann, 1925; Donth, 2007; Ngai, 2011; Kremer and Loidl, 2018; Royall et al., 2018; Tong and Tanaka, 2018):
where T > Tg and the VFT singular temperature T0 < Tg; DT is the fragility strength related to the fragility via (Böhmer et al., 1993). In the physics of polymers the Williams-Landel-Ferry (WLF) relation, the parallel of Equation (6), is used (Williams et al., 1955; Donth, 2007; Ngai, 2011).
Originally, the VFT equation was introduced empirically (Vogel, 1921; Fulcher, 1925; Tammann, 1925) and subsequently derived as the output “checkpoints” of significant glass transition models. One can recall here the free volume model (Turnbull and Cohen, 1961; Betancourt et al., 2015; Hao, 2015), Adam-Gibbs entropic models (Adam and Gibbs, 1965; Schneider et al., 1999; Dudowicz et al., 2006), random first-order transition (RFOT) theory (Wolyness and Lubchenko, 2013; Lerner and Bouchbinder, 2018), and Tanaka's “critical” model (Tanaka et al., 2010; Tong and Tanaka, 2018). The hypothetical “universal” meaning of the VFT for the previtreous behavior results from the enormous experimental evidence (Rzoska et al., 2010; Berthier and Ediger, 2016; Kremer and Loidl, 2018; Royall et al., 2018; Tong and Tanaka, 2018). Notwithstanding, significant objections against its fundamental validity appeared in the last two decades:
(i) One of the key arguments for the uniqueness of the VFT description is the empirical coincidence between the VFT singular temperature T0 and the Kauzmann temperature TK(Kauzmann, 1948), i.e., the “dynamic” and “thermodynamic” estimations of the ideal glass transition temperature (Berthier and Ediger, 2016; Kremer and Loidl, 2018). However, there is clear evidence that 0.8 < T0/TK < 2.2 (Tanaka, 2003; Martinez-Garcia et al., 2014).
(ii) The root-mean-square residual analysis showed the prevalence of other than VFT relations for portraying τ(T) or η(T) experimental data, tested for several “popular” low molecular weight liquids and polymeric glass formers (Richert, 2000; Hecksher et al., 2008; Lunkenheimer et al., 2010; Zheng and Mauro, 2017).
(iii) The linearized derivative-based and distortions-sensitive analysis showed a clear preference for the critical like portrayal in the ultraviscous domain close to Tg: , where TC < Tg and the exponent 8.5 < ς < 15, for glass forming liquid crystals, plastic crystals and also polystyrene, xylitol, propanol,… (Drozd-Rzoska and Rzoska, 2006; Drozd-Rzoska et al., 2010; Martinez-Garcia et al., 2013).
(iv) The case-sensitive analysis of the apparent activation energy index IDO(T) = −dlnEa(T)/dlnT = [dEa/Ea]/[dT/T] (Dyre and Olsen, 2004) questioned the general validity of the VFT/WLF portrayal (Hecksher et al., 2008; McKenna, 2008; Martinez-Garcia et al., 2013, 2014; Martinez-Garcia et al., 2015).
The empirical critique of the VFT equation led to the development and success of alternative model relations. One can recall the MYEGA (Waterton-Mauro) equation (Mauro et al., 2009), Avramov-Milchev model relation (Avramov and Milchev, 1998), Schmidtke-Petzold-Kahlau-Hofmann-Rössler scaling relation (Schmidtke et al., 2012) or Elmatad-Garrahan-Chandler model dependence (Elmatad et al., 2009).
The discussion of the pressure (isothermal) previtreous behavior often recalls studies by Johari and Whalley (JW) in superpressed glycerol as the reference (Johari and Whalley, 1972), which introduces the following relation:
where J = const, P < Pg and T ~ 20oC; the extrapolated singular pressure P0 > Pg.
Measurements were carried out using the broadband dielectric spectroscopy up to frequency f = 105 KHz, for pressures P < 5.3GPa (Johari and Whalley, 1972). Extreme pressure studies were possible only via the anvil-cell high-pressure technique, inherently associated with a minimal pressurized volume and then very small measurements capacitor with the micrometric gap between its plates (Roland et al., 2005; Rzoska et al., 2010; Floudas et al., 2011). The qualitative development of the broadband dielectric spectroscopy (BDS) which occurred four decades ago enabled the scan of hundreds of frequencies ranging from microHz to few GHz with the resolution of 5–6 relevant digits (Kremer and Schönhals, 2003). Consequently, BDS has become the basic tool for studying the inherently multi-time scale complex dynamics in glass forming systems (Kremer and Schönhals, 2003; Berthier and Ediger, 2016; Kremer and Loidl, 2018; Royall et al., 2018). Notwithstanding, the application of BDS for high-pressure studies is limited to frequencies f < 10MHz: approaching the GHz frequency range remains the future challenge (Roland et al., 2005; Rzoska et al., 2010; Floudas et al., 2011). In the year 1998, the application of new BDS facilities and the new design of the measurement capacitors (Rzoska et al., 2018) enabled obtaining the high-resolution τ(P) experimental data for ultraviscous glycerol compressed up to 0.35 GPa (for T ~ 260K). Their analysis showed the limited adequacy of Equation (7) and the fair portrayal via the empirical relation (Paluch et al., 1998):
where DP is the fragility strength for the pressure path; the prefactor τref. has the same meaning as in SB Equation (2).
Equation (8) was “designed” to enable approximations via JW Equation (7) or via the basic Barus relation, in properly selected “terminal” ranges of pressures. It is worth stressing that the JW Equation (7) cannot be reduced to the basic Barus form. The extension of Equation (8) into the negative pressures domain requires the substitution mentioned above: P → ΔP = P − PSL (Drozd-Rzoska, 2005; Drozd-Rzoska et al., 2007, 2008a,b):
where is the corrected by the impact of the stability limit (SL) pressure fragility strength.
This relation is associated with four fitted coefficients, i.e., more than the optimal number of three adjustable parameters (Donth, 2007; Ngai, 2011; Kremer and Loidl, 2018). The number of fitted parameters in Equation (9) can be reduced by the direct estimation of PSL < 0 pressure, but this constitutes the extreme experimental challenge (Imre et al., 2002). Notwithstanding, one can support the analysis via Equations (8, 9) by the distortion-sensitive and derivative-based analysis of experimental data, yielding (Drozd-Rzoska, 2005; Drozd-Rzoska et al., 2007; Drozd-Rzoska et al., 2008a,b):
where Equation (10a) is linked to Equation (8) and Equation (10b) to Equation (9).
Relations (8) and (9) are associated with the same value of PVFT singular pressure P0 but different fragility strengths: (Drozd-Rzoska et al., 2008a,b). Equations 10a,b offer the estimation of key parameters in Equations (8, 9) via the simple linear regression fit, supporting the final non-linear analysis of experimental data.
In the last three decades Equation (8), due to its simplicity and the link to fragility via the fragility related coefficient DP, has become the key tool for describing τ(P) and η(P) experimental data in compressed glass-forming systems (Roland et al., 2005; Rzoska et al., 2010; Floudas et al., 2011; Rzoska, 2017; White and Lipson, 2018). Despite this success, there are still no theoretical models deriving Equation (8), often recalled as the pressure counterpart of the VFT relation: the PVFT equation (Roland et al., 2005; Floudas et al., 2011). In the opinion of the author, the latter name can be justified by the fact that it is possible to transform the VFT Equation (6) into the PVFT Equation (8) via the simple substitution T = A/P: τ(T) = τ0exp[DTT0/(T − T0)] → = τ0exp[DT(A/P0)/((A/P) − (A/P0))] = τ0exp[DT(A/P0)/((AP0 − AP)/P0P)] =
. = τ0exp[DTP/(P0 − P)]. The latter suggest the coincidence between τ0, DT in the VFT Equation (6) and τ0, DP in the PVFT Equation (8), but in practice they differ very strongly. However, the coincidence between these coefficient appears when considering the substitution T = A/ΔP into the VFT equation (6), what leads to the corrected PVFT Equation (9). In the opinion of the author this can be considered as the argument for the only “effective” validity of the basic PVFT Equation (8).
However, such a simple link leads to the question that if significant problems with describing τ(T) or η(T) experimental data via the VFT equation [issues (i)–(iv)] also extends for the PVFT/ (corrected PVFT) dependences applied for describing τ(P) or η(P) SB behavior?
It is notable that the relation similar to Equation (8) was reported in 1963 by Roelands et al. (1963): η(P) = η0exp(α0P/(1 + R3P)), where R3 and α0 are constants, for describing viscosity changes in lubricating oils. Kovarski (1993) introduced the dependence , where V0 and c are constants, to portray relaxation time changes in vitrifying polymers. There is also a set of other dependences proposed for portraying τ(P) or η(P) behavior in the previtreous domains, for instance, given by the Avramov-Milchev (Avramov, 2005), the free volume (Roland et al., 2005; Rzoska et al., 2010; Floudas et al., 2011) or the Adam–Gibbs (Roland et al., 2005; Floudas et al., 2011) models. However, they require more than three fitted parameters which inherently limits their application.
When testing the previtreous behavior in the extended range of pressures and temperatures the existence of two dynamical domains associated with the dynamical crossover occurring at (TB, PB) was discovered. It was first reported by Stickel et al. (1995), basing on the analysis of τ(T) experimental data and later by Casalini et al. (2003) for τ(P) and η(P) experimental data in the previtreous domain. They discovered such phenomenon applying vs. 1/T (Stickel et al., 1995) and vs. P (Casalini et al., 2003) plots, respectively.
These relations can be derived linking the SA Equation (1) with the VFT Equation (6) and the SB Equation (2) with the PVFT Equation (8), focusing on the “linear presentation” of results (see Equations 10a,b).
Notable, that such way of analysis analysis assume a priori the validity of VFT (Equation 6) and PVFT (Equation 8) relations, in both dynamical domains. At least for the temperature path the critical-like portrayal , with φ = 1.5−3 and TB ~ 1.2Tg, derived within the Mode-Coupling-Theory (MCT) is expected in the high temperature dynamical domain (T > TB), i.e., (Götze and Sjögren, 1995; Mallamace et al., 2010; Ngai, 2011). Studies focused on MCT-type behavior are usually based on τ1/φ vs. T plot, showing the empirical coincidence (Mallamace et al., 2010; Ngai, 2011). and the occurrence in the high temperature dynamical domain for (Mallamace et al., 2010; Rzoska et al., 2010; Ngai, 2011). Following refs. (Roland et al., 2005; Floudas et al., 2011; Ngai, 2011) one can coincide the high temperature dynamical (isobar, atmospheric pressure) with the low-pressure dynamical domain (isotherm): the preliminary evidence for the MCT-type behavior for the pressure path and was reported in Patkowski et al. (2003). The dynamical crossover (TB,PB) is indicated as the onset of the secondary relaxation or the emergence of the translational-orientational decoupling (Roland et al., 2005; Roland, 2008, 2010; Floudas et al., 2011; Ngai, 2011) showed experimentally the time-scale invariance of τ(TB, PB) for the given glass former. Novikov and Sokolov (2003) basing on the Stickel et al. (1995) analysis for 28 different glass formers suggested the hypothetical “magic universality” of the dynamic crossover time scale , later evidenced also under pressure (Casalini and Roland, 2004; Roland et al., 2005; Floudas et al., 2011). However, this concept has been questioned due to the evidence of notable discrepancies for a few glass formers (Ding and Sokolov, 2006; Ngai, 2011; Mallamace et al., 2014). One should stress that the critical-like behavior mentioned in issue (iii) above was associated with the low-temperature domain (close to Tg) and has no links to the MCT critical-like behavior associated with the high-temperature domain for T >> Tg. Notable, that the existence of two dynamical domains was also confirmed beyond BDS studies (Wu et al., 2009; Hoffman et al., 2017; Bartoš et al., 2018). Generally, the dynamical crossover phenomenon is associated with the crossover from the ergodic to the non-ergodic (ultraviscous, ultraslow) domain on approaching the glass transition (Roland et al., 2005; Floudas et al., 2011; Ngai, 2011), Stickel et al. (1995), and Casalini et al. (2003).
This report presents the evidence for the presumably universal long-range previtreous changes of the pressure related apparent fragility. This “anomaly” led to the “model-free” derivation of the critical-like relation for the pressure evolution of the primary/structural relaxation time. All these led to new conclusions for the dynamic crossover phenomenon. Finally, the extension of results for the electric conductivity and related properties is considered.
Experimental
This report presents the results of high-pressure studies, up to P ~ 2.2 GPa, of the structural relaxation time in glass forming liquid crystalline 8*OCB (isooctyloxycyanobiphenyl) (Pawlus et al., 2010), epoxy resin EPON 828 (Rzoska and Drozd-Rzoska, 2011) and two low-molecular-weight liquids diisobutyl phthalate (DIBP) (Paluch et al., 1996) and propylene carbonate (PC) (Drozd-Rzoska et al., 2008a,b). For 8*OCB and EPON 828 results are presented for two isotherms. In each case, studies were carried out between the atmospheric pressure (P = 0.1MPa) and Pg(T), for time-scales ranging between τ(Tg, Pg) = 100s and τ ~ 10−7s. The latter is associated with existing limitations in high-pressure experimental studies to frequencies f < 10MHz.(Roland et al., 2005; Rzoska et al., 2010; Floudas et al., 2011). To overcome this problem for PC and DIBP, τ(P) experimental data were matched with scaled electric conductivity σ(P) data. The scaling of τ(P) and τσ(P) ∝ 1/σ(P) experimental data was possible because the low-pressure dynamical domain obeys the translational-orientational coupling τ(T, P)σ(T, P) = const (Starzonek et al., 2015). Studies were carried out in the measurement capacitor with the macroscopic gap between the capacitor's plates d = 0.2 mm. For the applied measurement of voltage U = 1V, the electric field intensity E = 5kV/m. So far, for studies in the challenging GPa domain, the microscopic gap was used. However, for instance for the 20μm gap one obtains E = 5 MV/m, which is the value where nonlinear phenomena are essential (Rzoska and Drozd-Rzoska, 2011; Richert, 2018). The scheme of the applied capacitor is presented in ref. (Rzoska et al., 2018). One of the critical problems in high-pressure studies is the separation between the tested sample and the pressure transmitted medium (Plexol in the given case). For the results presented, the transmission of pressure to the tested sample took place via the deformation of the Teflon film (Rzoska et al., 2018). All samples before measurements were degassed prior to measurements. Studies were carried out using the impedance analyzer Novocontrol BDS model 2015. The primary relaxation time was determined from the peak relaxation time of dielectric loss curves τ = 1/2πfpeak. The electric conductivity was estimated from the low-frequency part of the BDS spectrum using the relation σ = (2πf) ε″(f) (Kremer and Schönhals, 2003; Rzoska et al., 2010). The pressure chamber was surrounded by the special jacket enabling fluid flow from the thermostat with external liquid circulation, V = 25 L total volume and the temperature control ~ 0.02K. The pressure was exerted and controlled via the computer controlled pump.
Results and Discussion
Figures 1, 2 show the pressure evolution of the structural relaxation time for tested glass forming systems in the previtreous domain. They are a liquid crystal (8*OCB), epoxy resin (EPON 828) and two low molecular weight liquids: diisobutyl phthalate (DIBP) and propylene carbonate (PC). For 8*OCB and EPON 828 results are given for two isotherms. Figure 2 shows the supplementary, “focused,” presentation of results from Figure 1. This is associated with qualitatively different available ranges of pressures in tested systems: each glass forming system could be studied between the atmospheric pressure and the glass transition pressure.
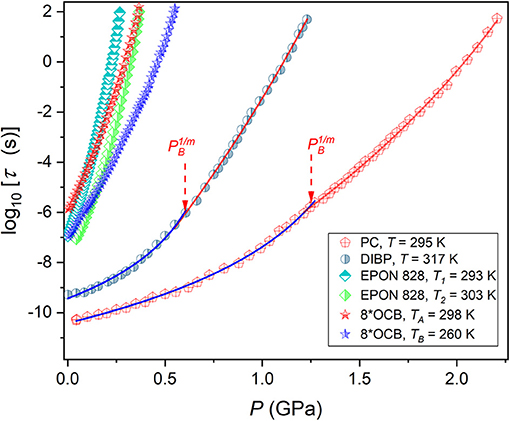
Figure 1. Pressure dependences of the primary relaxation time for tested glass forming systems. Experimental data are portrayed by Equation (15), with parameters given in Table 2. Note the manifestation of the dynamic crossover phenomenon (different colors matched of portraying curves), associated with changes of values in Equation (15). Temperatures related to tested isotherms are given.
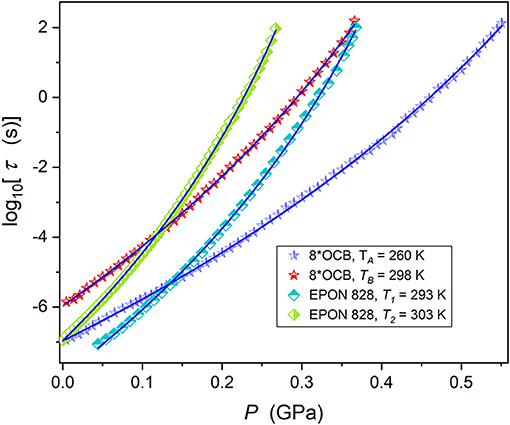
Figure 2. Pressure dependences of the primary relaxation time in 8*OCB and EPON 828, for two isotherms. Experimental data are portrayed by Equation (15), with parameters given in Table 2. Temperatures related to tested isotherms are given.
Values of glass pressures for each tested isotherm are given in Table 1. It is notable that high-resolution τ(P) results for pressures well-above 1 GPa and with “bulk parameters” of the measurements capacitor are still hardly available (Roland et al., 2005; Rzoska et al., 2010; Floudas et al., 2011; Rzoska, 2017). The apparent fragility can be determined from τ(P) experimental data using the relation (Roland et al., 2005; Floudas et al., 2011):
where 0.1MPa < P < Pg, T = const: see also Equation (5).
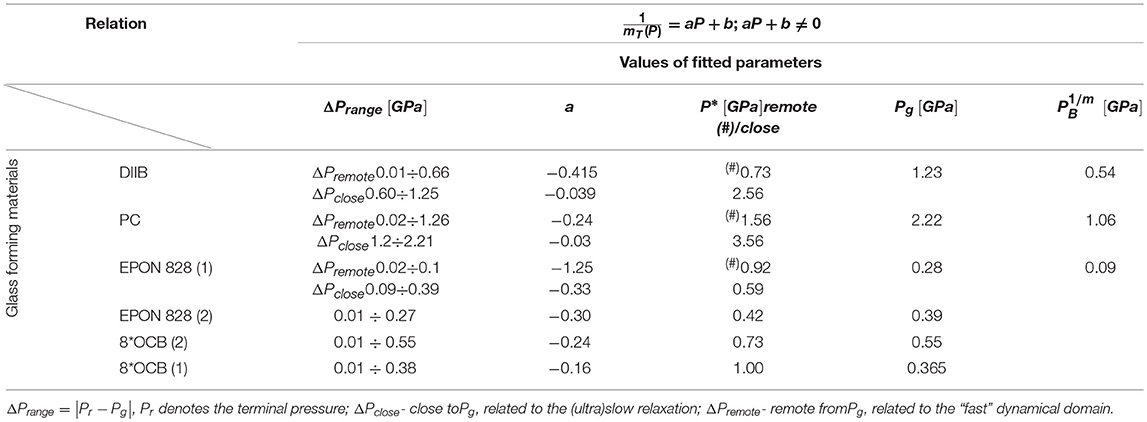
Table 1. Results of the linear regression fit for the reciprocal of apparent fragility mT(P): see Equations (12, 13).
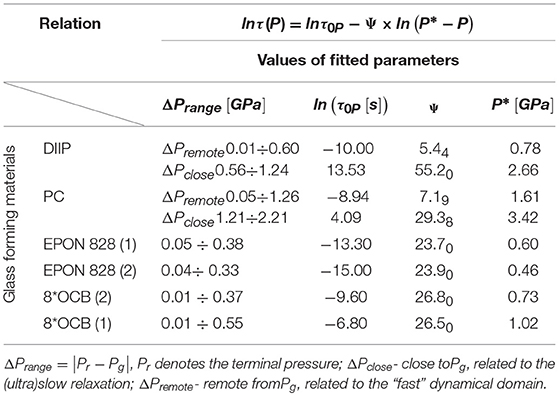
Table 2. Results of fitting of experimental data τ(P → Pg), for the primary (structural) relaxation time via Equations (15, 16).
The experimental pressure evolutions of the apparent fragility in tested glass formers, based on empirical data from Figures 1, 2 and Equation (11), are presented in Figures 3, 4. The applied scale, vs. P, reveals the simple and hypothetically universal form of the previtreous behavior in the high pressure (HP) domain, adjacent to Pg:
where and ; the singular pressure is estimated via the condition . A similar behavior occurs for the low pressures (LP) domain P < PB:
where and the singular pressure is estimated as .
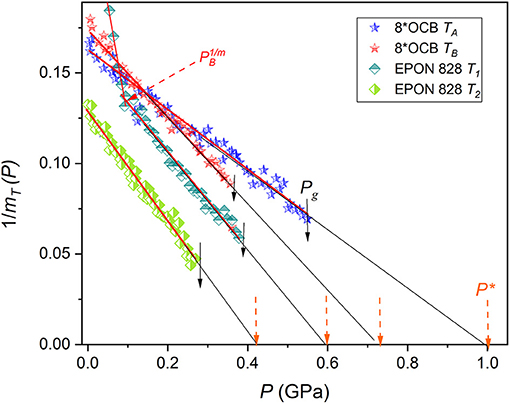
Figure 3. The universal previtreous behavior of the reciprocal of the pressure apparent fragility (Equation 11) for supercooled 8*OCB and EPON 828, basing on experimental data from Figures 1, 2. Results of the linear regression fit (Equations 12, 13) in Table 1 are collected. Solid arrows indicate the glass transition. The dashed (orange) arrows show singular pressures . For the “high temperature” isotherm for EPON 828, the dynamic crossover pressure is also indicated.
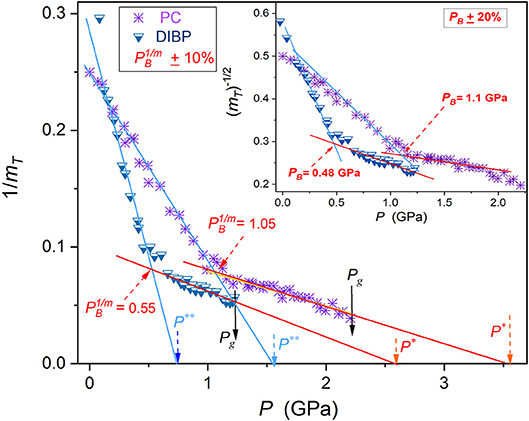
Figure 4. The universal previtreous behavior of the reciprocal of the pressure apparent fragility for super-pressed propylene carbonate and diisobutyl phthalate, based on experimental data from Figure 1. Results of the linear regression fit (Equations 15, 16) are collected in Table 1. The solid arrows indicated glass transition pressures, and the dashed (orange) arrows extrapolated singular pressures and . Dynamical crossover pressures are indicated.
The dynamical crossover pressure is defined as the intersection of lines described by Equations (12, 13), for HP and LP domains, respectively. Linking Equations (11) and Equations (12, 13) one obtains:
Subsequently, the integration of Equation (14) yields the relation:
for the ultraviscous HP domain , with and
For the LP dynamical domain, remote (R) from the glass pressure:
for , and .
Linking Equations (15, 16) and Equation (11) one can obtain relations enabling the estimation of power exponent from 1/mT(P) vs. P plots, i.e., via the simple linear regression fit:
Power exponents depends on the fragilities, mT(Pg), , and the relative values of discontinuities , ), respectively. Tables 1, 2 present results of analysis of the apparent fragility via Equations (12, 13) and the relaxation time via Equations (15, 16). Graphically, the solid curves in Figures 1, 2 support the validity of the discussed description.
Figure 4 presents the pressure evolution of the reciprocal of the apparent fragility 1/mT(P) and in the inset the dependence vs. P, for the same set of data. The latter is directly linked to the Casalini et al. (2003) plot developed for estimating the dynamic crossover pressure PB, namely: . As mentioned in the Introduction, the Casalini et al. (2003) ΦT(P) plot assumes a priori the validity of the PVFT Equation (8) in both dynamical domains. Estimations of the dynamic crossover pressure by both mentioned methods (indicated as PB and , respectively) differs by ca. 10%. The arbitrariness of the estimation is more significant for the Casalini et al. (2003) type analysis presented in the inset. The analysis based on vs. P plots yielded: for EPON 828 (and ), for DIIB ( and ) and PC ( and ).
Results presented above are associated with the primary relaxation time evolution, but they can also be applied for other dynamic properties: viscosity, diffusion or electric conductivity. The shift from the low pressure (or high temperature) to the high pressure (low temperature) dynamical domain changes the translational-orientational coupling (Ngai, 2011; Starzonek et al., 2015): (translational—orientational coupling) → PB → (translational—orientational decoupling). For the electric conductivity such behavior is associated with the Debye-Stokes-Einstein (DSE) and the fractional DSE (f-DSE) dependences (Starzonek et al., 2015):
where parameters CLP = const, CHP = const and S denotes the f-DSE exponent, describing the decoupling. Linking Equations (15, 16, 19) one obtains for the high-pressure dynamical domain:
The inset in Figure 5 confirms the validity of the critical-like portrayal [Equations (15, 20)], using linearized plots:
Values of exponents S, Ψ, Ψσ are given in the plot. The inset shows the f-DSE behavior for the same set of experimental data and the direct estimation of the “decoupling” exponent S. It is in fair agreement with the estimation from the inset S = Ψσ/Ψ, resulted from Equation (20).
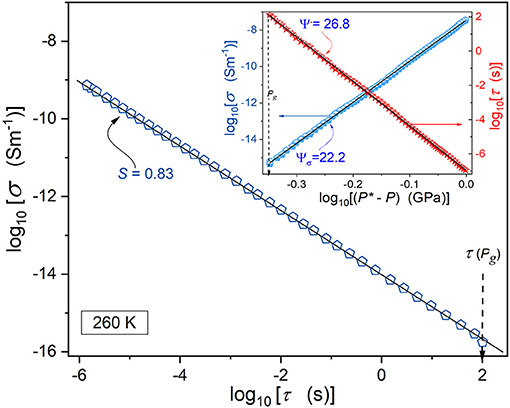
Figure 5. The pressure evolution of the primary relaxation time and electric conductivity for superpressed 8*OCB (T = 260 K isotherm), based on a log-log scale plot [see Equations (20, 21)]. The main part of the plot shows the f-DSE behavior in the high-pressure dynamical domain [see Equation (19)].
Conclusions
This report presents the evidence that the pressure related apparent fragility can show the “universal” pretransitional anomaly, both on approaching the glass transition pressure and the dynamic crossover pressure. The resulted linear pressure dependence of its reciprocal enables a simple and “model-free” estimation of the dynamic crossover pressure, also introducing new parameters associated with Pg and PB: extrapolated singular pressures and and coupled “discontinuities” of transitions and . The obtained “pretransitional” anomalies of the apparent fragility served as a reference for deriving critical-like equations for portraying the τ(P) evolution (Equations 15, 16). All parameters for these relations can be determined from 1/mT(P) the plot and based on the exact definition of the prefactor τ0P: it is equal to the relaxation time at P* − P = 1GPa. Notable that the description via Equations (15, 16) extends into the negative pressures region. The obtained relation for τ(P) has the critical-like form, associated with the power exponents Ψ () and ΨR for the “remote” dynamical domain (). Notable, that Ψ >> ΨR, which according to Equations (17, 18) may results from the difference between fragilities visible in Figures 3, 4. On the other hand there is w very weak impact of the shift from one isotherm to another on values of power exponents.
The question arises if the critical-like behavior in the low-pressure domain is coupled to the MCT-type behavior. In the opinion of the author, the answer is negative: Equation (16) obeys up to the dynamical crossover pressure PB and the singular pressure is located at . For the MCT-type behavior, one should expect the singularity at PC ≈ PB, with the critical-like description terminating well-above PB (Götze and Sjögren, 1995; Mallamace et al., 2010; Ngai, 2011). Results presented in this report indicate the equal importance of the glass transition and the dynamical crossover between the ergodic domains, introducing the novel way of estimating the dynamical crossover loci between both domains. It yields slightly shifted estimations (denoted as ) in comparison with the PB values from Casalini et al. (2003) plot ΦT(P) plot, which assumes a priori the validity of the PVFT Equation (8). Notable, that relations developed in this report, including (15, 16), cover both dynamical domains and can also be applied for other dynamical properties. They are directly applied for the pressure evolution of viscosity η(P). For the electric conductivity or diffusion the impact of translational-orientational decoupling should be taken into account.
Author Contributions
The author confirms being the sole contributor of this work and has approved it for publication.
Conflict of Interest Statement
The author declares that the research was conducted in the absence of any commercial or financial relationships that could be construed as a potential conflict of interest.
Acknowledgments
This research was carried out due to the support of the National Centre for Science (Poland), project NCN OPUS ref. 2016/21/B/ST3/02203, head AD-R.
References
Adam, G., and Gibbs, J. H. (1965). On the temperature dependence of cooperative relaxation properties in glass-forming liquids. J. Chem. Phys. 43, 139–146. doi: 10.1063/1.1696442
Angell, C. A. (1985). “Strong and fragile liquids,” in Relaxations in Complex Systems, eds. K. L. Ngai, and G. B. Wright (Natl. Tech. Inf. Serv., U.S. Dept. Comm., Springfield).
Angell, C. A, and Qing, Z. (1989). Glass in a stretched state formed by negative-pressure vitrification: trapping in and relaxing out. Phys. Rev. B 39, 8784–8787. doi: 10.1103/PhysRevB.39.8784
Avramov, I. (2005). Viscosity in disordered media. J. Non Cryst. Solids 351, 3163–3173 doi: 10.1016/j.jnoncrysol.2005.08.021
Avramov, I., and Milchev, A. (1998). Effect of disorder on diffusion and viscosity in condensed systems. J. Non Cryst. Solids 104, 253–260. doi: 10.1016/0022-3093(88)90396-1
Bartoš, J., Corsaro, C., Mallamace, D., Švajdlenková, H., and Lukešová, M. (2018). ESR evidence of the dynamic crossover in the supercooled liquid states of a series of solid n-alkanes. Phys. Chem. Chem. Phys. 20, 11145–11151. doi: 10.1039/C8CP00175H
Barus, C. (1893). Isothermals, isopiestic and isometrics relative to viscosity. Am. J. Sci. 45, 87–96. doi: 10.2475/ajs.s3-45.266.87
Berthier, L., and Ediger, M. (2016). Facets of glass physics. Phys. Today 69, 41–46. doi: 10.1063/PT.3.3052
Betancourt, B. A. P., Hanakata, P. Z., Starr, F. W., and Douglas, J. F. (2015). Quantitative relations between cooperative motion, emergent elasticity, and free volume in model glass-forming polymer materials. Proc. Natl. Acad. Sci. U.S.A. 112, 2966–2971 doi: 10.1073/pnas.1418654112
Böhmer, H., Ngai, K. L., Angell, C. A., and Plazek, D. J. (1993). Nonexponential relaxations in strong and fragile glass formers. J. Chem. Phys. 99, 4201–4209. doi: 10.1063/1.466117
Casalini, R., Paluch, M., and Roland, C. M. (2003). Dynamic crossover in supercooled liquids induced by high pressure. J. Chem. Phys. 118, 5701–5703. doi: 10.1063/1.1564046
Casalini, R., and Roland, M. C. (2004). Scaling of the supercooled dynamics and its relation to the pressure dependences of the dynamic crossover and the fragility of glass formers. Phys. Rev. B 71:014210. doi: 10.1103/PhysRevB.71.014210
Ding, Y., and Sokolov, A. P. (2006). Breakdown of time-temperature superposition principle and universality of chain dynamics in polymers. Macromolecules 39, 3322–3326. doi: 10.1021/ma052607b
Donth, E. (2007). The Glass Transition. Relaxation Dynamics in Liquids and Disordered Materials (Berlin: Springer).
Drozd-Rzoska, A. (2005). Pressure dependence of the glass temperature in supercooled liquids. Phys. Rev. E 72:041505. doi: 10.1103/PhysRevE.72.041505
Drozd-Rzoska, A., and Rzoska, S. J. (2006). On the derivative-based analysis for temperature and pressure evolution of dielectric relaxation times in vitrifying liquids. Phys. Rev. E 73:041502. doi: 10.1103/PhysRevE.73.041502
Drozd-Rzoska, A., Rzoska, S. J., and Paluch, M. (2008a). Universal critical-like scaling of dynamic properties in symmetry-selected glass formers. J. Chem. Phys. 129, 184509–184515. doi: 10.1063/1.3000626
Drozd-Rzoska, A., Rzoska, S. J., Paluch, M., Imre, A. R., and Roland, C. M. (2007). On the glass temperature under extreme pressures. J. Chem. Phys. 126:164504. doi: 10.1063/1.2721044
Drozd-Rzoska, A., Rzoska, S. J., Pawlus, S., Martinez-Garcia, J. C., and Tamarit, J. L. (2010). Evidence for critical-like behavior in ultraslowing glass-forming systems. Phys. Rev. E 82:031501. doi: 10.1103/PhysRevE.82.031501
Drozd-Rzoska, A., Rzoska, S. J., and Roland, C. M. (2008b). On the pressure evolution of dynamic properties in supercooled liquids. J. Phys. Condens. Matter. 20:244103. doi: 10.1088/0953-8984/20/24/244103
Dudowicz, J., Freed, K. F., and Douglas, J. F. (2006). Entropy theory of polymer glass formation revisted. I. General formulation. J. Chem. Phys. 124:064901. doi: 10.1063/1.2166391
Dyre, J. C., and Olsen, N. B. (2004). Landscape equivalent of the shoving model. Phys. Rev. E 69:042501. doi: 10.1103/PhysRevE.69.042501
Elmatad, Y. S., Garrahan, J. P., and Chandler, D. (2009). Corresponding states of structural glass formers. J. Phys. Chem. B 113, 5563–5567. doi: 10.1021/jp810362g
Floudas, G., Paluch, M., Grzybowski, A., and Ngai, K. L. (2011). Molecular Dynamics of Glass-Forming Systems. Effect of Pressure (Berlin: Springer).
Fulcher, G. S. (1925). Analysis of recent measurements of the viscosity of glasses. J. Am. Ceram. Soc. 8, 339–355. doi: 10.1111/j.1151-2916.1925.tb16731.x
Götze, W., and Sjögren, L. (1995). The mode coupling theory of structural relaxations. Transp. Theory Stat. Phys. 24, 801–853. doi: 10.1080/00411459508203936
Hao, T. (2015). Unveiling the relationships among the viscosity equations of glass liquids and colloidal suspensions for obtaining universal equations with the generic free volume concept. Phys. Chem. Chem. Phys. 17, 21885–21893. doi: 10.1039/C5CP03651H
Hecksher, T., Nielsen, A. I., Olsen, N. B., and Dyre, J. C. (2008). Little evidence for dynamic divergences in ultraviscous molecular liquids. Nat. Phys. 4, 737–741. doi: 10.1038/nphys1033
Hoffman, D. J., Sokolowsky, K. P., and Fayer, M. D. (2017). Direct observation of dynamic crossover in fragile molecular glass formers with 2D IR vibrational echo spectroscopy. J. Chem. Phys. 146:124505. doi: 10.1063/1.4978852
Imre, A. R., Maris, H. J., and Williams, P. R. (2002). Liquids Under Negative Pressure. Dordrecht: Kluwer.
Imre, A. R., Martinas, K. M., and Rebelo, L. P. N. (1998). Thermodynamics of negative pressures in liquids, J. Non Equilib. Thermodyn. 23, 351–375. doi: 10.1515/jnet.1998.23.4.351
Johari, G. P., and Whalley, E. P. (1972). Dielectric properties of glycerol in the range 0.1–105Hz, 218–357 K, 0–53 kb. Faraday Symp. Chem. Soc. 6, 23–41. doi: 10.1039/FS9720600023
Kauzmann, W. (1948). The nature of the glassy state and the behavior of liquids at low temperatures. Chem. Rev. 43, 219–256. doi: 10.1021/cr60135a002
Kennedy, D. (2005). 125th Anniversary Issue: 125 outstanding problems in all of science: what is the nature of the glassy state. Science 309:83. doi: 10.1126/science.309.5736.883b
Kondrin, M. V., Gromnitskaya, E. L., Pronin, A. A., Lyapin, A. G., Brazhkin, V. V., and Volkov, A. A. (2012). Dielectric spectroscopy and ultrasonic study of propylene carbonate under ultra-high pressures. J. Chem. Phys. 137:084502. doi: 10.1063/1.4746022
Kovarski, A. L. (1993). “pvT effects in molecular dynamics of polymers,” in High Pressure Chemistry and Physics of Polymers, ed A. L. Kovarski (Boca Raton: CRC Press), 117–153.
Lerner, E., and Bouchbinder, E. A. (2018). A characteristic energy scale in glasses. J. Chem. Phys. 148:214502. doi: 10.1063/1.5024776
Lukacs, B., and Martinas, K. (1990). Thermodynamics of negative absolute pressures. Acta. Phys. Polon. B 21, 177–187.
Lunkenheimer, P., Kastner, S., Köhler, M., and Loidl, A. (2010). Temperature development of glassy α-relaxation dynamics determined by broadband dielectric spectroscopy. Phys. Rev. E 81:051504. doi: 10.1103/PhysRevE.81.051504
Mallamace, F., Branca, C., Corsaro, C., Leone, N., Spooren, J., and Chen, S.-H., et al. (2010). Transport properties of glass-forming liquids suggest that dynamic crossover temperature is as important as the glass transition temperature. Proc. Natl. Acad. Sci. U.S.A. 107, 22457–22462. doi: 10.1073/pnas.1015340107
Mallamace, F., Corsaro, C., Leone, N., Villari, V., Micali, N., and Chen, S. H. (2014). On the ergodicity of supercooled molecular glass-forming liquids at the dynamical arrest: the o-terphenyl case. Sci. Rep. 4:3747. doi: 10.1038/srep03747
Martinez-Garcia, J. C, Rzoska, S. J., Drozd-Rzoska, A., and Martinez-Garcia, J. A. (2013). Universal description of ultraslow glass dynamics. Nat. Comm. 4:1823. doi: 10.1038/ncomms2797
Martinez-Garcia, J., Rzoska, S. J., Drozd-Rzoska, A., Starzonek, S., and Mauro, J. C. (2015). Fragility and basic process energies in vitrifying systems. Sci. Rep. 5:8314. doi: 10.1038/srep08314
Martinez-Garcia, J. C., Rzoska, S. J., Drozd-Rzoska, A., Martinez-Garcia, J., and Mauro, J. C. (2014). Divergent dynamics and the Kauzmann temperature in glass forming systems. Sci. Rep. 4:5160. doi: 10.1038/srep05160
Mauro, J. C., Yue, Y., Ellison, A. J., Gupta, P. K., and Allan, D. C. (2009). Viscosity of glass-forming liquids. Proc. Natl. Acad. Sci. U.S.A. 24:19780. doi: 10.1073/pnas.0911705106
McKenna, G. B. (2008). Diverging views on glass transition. Nat. Phys. 4, 673–674. doi: 10.1038/nphys1063
Ngai, K. L. (2011). Relaxation and Diffusion in Complex Systems (Partially Ordered Systems) (Berlin: Springer).
Novikov, V. N., and Sokolov, A. P. (2003). Universality of the dynamic crossover in glass-forming liquids: a “magic” relaxation time. Phys. Rev. E 67:031507. doi: 10.1103/PhysRevE.67.031507
Paluch, M., Rzoska, S. J., and Zioło, J. (1998). On the isothermal pressure behaviour of the relaxation times for glass-forming liquids. J. Phys. Matter 10, 4131–4135. doi: 10.1088/0953-8984/10/19/001
Paluch, M., Zioło, J., Rzoska, S. J., and Habdas, P. (1996). High pressure and temperature dependence of dielectric relaxation in supercooled di-isobutyl phthalate. Phys. Rev. E 54, 4010–4013. doi: 10.1103/PhysRevE.54.4008
Patkowski, A., Matos Lopez, M., and Fisher, E. W. (2003). Pressure dependence of the high-frequency light scattering susceptibility of orthoterphenyl: a mode coupling analysis. J. Chem. Phys. 119, 1579–1585. doi: 10.1063/1.1581847
Pawlus, S., Mierzwa, M., Paluch, M., Rzoska, S. J., and Roland, C. M. (2010). Dielectric and mechanical relaxation in isooctylcyanobiphenyl (8*OCB). J. Phys. 22, 235101 doi: 10.1088/0953-8984/22/23/235101
Richert, R. (2000). Scaling vs. Vogel-Fulcher-type structural relaxation in deeply supercooled materials. Physica A 287, 26–36. doi: 10.1016/S0378-4371(00)00451-9
Richert, R. (2018). Nonlinear Dielectric Spectroscopy (Berlin: Springer). doi: 10.1007/978-3-319-77574-6
Roelands, C. J. A., Vlugter, J. C., and Waterman, H. I. (1963). The viscosity-temperature-pressure relationship of lubricating oils and its correlation with chemical constitution. ASME J. Basic Eng. 11, 601–611. doi: 10.1115/1.3656919
Roland, C. M. (2008). Characteristic relaxation times and their invariance to thermodynamic conditions. Soft. Matter. 4, 2316–2322. doi: 10.1039/b804794d
Roland, C. M. (2010). Relaxation phenomena in vitrifying polymers and molecular liquids. Macromolecules 43, 7875–7890. doi: 10.1021/ma101649u
Roland, C. M., Bogoslovov, R. B., Casalini, R., Ellis, A. R., Bair, S., Rzoska, S. J, Czuprynski, K., et al. (2008). Thermodynamic scaling and the characteristic relaxation time at the phase transition of liquid crystals. J. Chem. Phys. 128:224506. doi: 10.1063/1.2931541
Roland, C. M., Hensel-Bielowka, S., Paluch, M., and Casalini, R. (2005). Supercooled dynamics of glass-forming liquids and polymers under hydrostatic pressure. Rep. Prog. Phys. 68, 1405–1478. doi: 10.1088/0034-4885/68/6/R03
Royall, C. P., Turci, F., Tatsumi, S., Russo, J., and Robinson, J. (2018). The race to the bottom: approaching the ideal glass? J. Phys. 30:363001. doi: 10.1088/1361-648X/aad10a
Rzoska, S. J. (2017). New challenges for the pressure evolution of the glass temperature. Front. Mat. 4:033. doi: 10.3389/fmats.2017.00033
Rzoska, S. J., and Drozd-Rzoska, A. (2011). Dual field nonlinear dielectric spectroscopy in a glass forming EPON 828 epoxy resin. J. Phys. 24 :035101. doi: 10.1088/0953-8984/24/3/035101
Rzoska, S. J., Mazur, V., and Drozd-Rzoska, A. (2010). Metastable Systems Under Pressure (Berlin: Springer).
Rzoska, S. J., Drozd-Rzoska, A., and Starzonek, S. (2018). “Nonlinear dielectric effect in critical liquids,” in Nonlinear Dielectric Spectroscopy ed R Richert (Springer, Berlin), 187–218.
Schmidtke, B., Petzold, N., Kahlau, R., Hofmann, M., and Rössler, E. A. (2012). From boiling point to glass transition temperature: transport coefficients in molecular liquids follow three-parameter scaling. Phys. Rev. E 86:041507. doi: 10.1103/PhysRevE.86.041507
Schneider, U., Lunkenheimer, P., Brand, R., and Loidl, A. (1999). Broadband dielectric spectroscopy on glass-forming propylene carbonate. Phys. Rev. E 59, 6924–6936. doi: 10.1103/PhysRevE.59.6924
Sciortono, F., Essmann, U., Stanley, H. E., Hammati, M., Shao, J., Wolf, G. H., and Angell, C. A. (1995). Crystal stability limits at negative and positive pressures, and crystal-to-glass transition. Phys. Rev. E. 52, 6484–6491. doi: 10.1103/PhysRevE.52.6484
Starzonek, S., Rzoska, S. J., Drozd-Rzoska, A., Pawlus, S., Martinez-Garcia, J.-C., and Kistersky, L. (2015). Fractional Debye–Stokes–Einstein behaviour in an ultraviscous nanocolloid: glycerol and silver nanoparticles. Soft. Matter. 11, 5554–5562. doi: 10.1039/C5SM00266D
Stickel, F., Fischer, E. W., and Richert, R. (1995). Dynamics of glass-forming liquids. I. Temperature-derivative analysis of dielectric relaxation data. J. Chem. Phys. 102, 6251–6257. doi: 10.1063/1.469071
Tanaka, H. (2003). Relation between thermodynamics and kinetics of glass-forming liquids. Phys. Rev. Lett. 90:05570. doi: 10.1103/PhysRevLett.90.055701
Tanaka, H., Kawasaki, T., Shintani, H., and Watanabe, K. (2010). Critical-like behaviour of glass-forming liquids. Nat. Mat. 112, 2966–2971. doi: 10.1038/nmat2634
Tong, H., and Tanaka, H. (2018). Revealing hidden structural order controlling both fast and slow glassy dynamics in supercooled liquids. Phys. Rev. X 8:011041. doi: 10.1103/PhysRevX.8.011041
Turnbull, D., and Cohen, M. H. (1961). Free-volume model of the amorphous phase: glass transition. J. Chem. Phys. 34, 120–124. doi: 10.1063/1.1731549
Vogel, H. (1921). Temperaturabhängigkeitsgesetz der viskosität von flüssigkeiten. Phys. Zeit. 22, 645–646.
White, R. P., and Lipson, J. E. G. (2018). Pressure-dependent dynamics of polymer melts from arrhenius to non-arrhenius: the cooperative free volume rate equation tested against simulation data. Macromolecules 51, 4896–4909. doi: 10.1021/acs.macromol.8b00591
Williams, M. L., Landel, R. F., and Ferry, J. D. (1955). The temperature dependence of relaxation mechanisms in amorphous polymers and other glass-forming liquids. J. Am. Chem. Soc. 77, 3701–3707. doi: 10.1021/ja01619a008
Wolyness, P. C., and Lubchenko, V. (2013). Structural Glasses and Supercooled Liquids: Theory, Experiment, and Applications. New York, NY: Wiley.
Wu, X., Zhou, X., Liu, C., and Zhu, Z. (2009). Slow dynamics of the α and α′ relaxation processes in poly(methyl methacrylate) through the glass transition studied by mechanical spectroscopy. J. Appl. Phys. 106:013527. doi: 10.1063/1.3168494
Keywords: glass transition, high pressures, structural relaxation time, fragility, previtreous behavior, universality
PACS: 64.70.P- ; 62.50.-p; 64.70.pm ; 64.70.qj ; 64.70.kj
Citation: Drozd-Rzoska A (2019) Pressure-Related Universal Previtreous Behavior of the Structural Relaxation Time and Apparent Fragility. Front. Mater. 6:103. doi: 10.3389/fmats.2019.00103
Received: 26 January 2019; Accepted: 18 April 2019;
Published: 15 May 2019.
Edited by:
Morten M. Smedskjaer, Aalborg University, DenmarkReviewed by:
Benoit Rufflé, Université de Montpellier, FranceRoger Jay Loucks, Alfred University, United States
Copyright © 2019 Drozd-Rzoska. This is an open-access article distributed under the terms of the Creative Commons Attribution License (CC BY). The use, distribution or reproduction in other forums is permitted, provided the original author(s) and the copyright owner(s) are credited and that the original publication in this journal is cited, in accordance with accepted academic practice. No use, distribution or reproduction is permitted which does not comply with these terms.
*Correspondence: Aleksandra Drozd-Rzoska, YWdhdGthLm1hbHdpbmthQGdtYWlsLmNvbQ==