 Wenyu Liao
 Xiao Sun2,1
 Aditya Kumar
 Hongyan Ma
94% of researchers rate our articles as excellent or good
Learn more about the work of our research integrity team to safeguard the quality of each article we publish.
Find out more
ORIGINAL RESEARCH article
Front. Mater. , 24 April 2019
Sec. Structural Materials
Volume 6 - 2019 | https://doi.org/10.3389/fmats.2019.00078
This article is part of the Research Topic Frontiers in Materials: Rising Stars View all 56 articles
Determination of degrees of hydration/reaction of components of blended cementitious systems (i. e., cement and SCMs: supplementary cementitious materials) is essential to estimate the systems' properties. Although the best methods for determining degrees of reaction of different SCMs have been recommended by RILEM TC238, they rely on either expensive equipment (e.g., nuclear magnetic resonance) or time-consuming sample preparation and data processing (e.g., backscattered electron image analysis). Furthermore, these methods cannot simultaneously characterize degree of hydration of cement and degree of reaction of SCMs. A novel decoupling method, which can simultaneously estimate the degree of hydration of cement and the degree of reaction of silica fume in binary cementitious materials, is proposed in this study. Based on experimentally determined and theoretically validated stoichiometric parameters of cement hydration and pozzolanic reaction, the contents of calcium hydroxide and hydrate water in pastes are expressed as functions of degree of hydration of cement and degree of reaction of silica fume. With the two contents determined by thermogravimetric analysis, the two degrees can be solved mathematically. It is found that in binary binders the incorporation of silica fume affects hydration kinetics of cement, leading to lower ultimate degree of hydration, shorter dormant stage, and faster hydration in the acceleration stage. As a result, the degree of hydration of cement in blended paste is higher at early ages (e.g., 3 days) but lower at later ages (e.g., 120 days) than that in plain cement paste. In a given blended paste, the degree of reaction of silica fume can be tied to the degree of hydration of cement. The decoupling method is promising for rapid estimations of degrees of hydration/reaction of cementitious materials in a blended system, since it does not require expensive characterization tools or complex data processing methods.
Supplementary cementitious materials (SCMs), such as silica fume (SF), fly ash (FA), ground granulated blast-furnace slag (GGBFS) and limestone (LS) powder, have been widely used in concrete because of their environmental and performance merits (Juenger and Siddique, 2015). On the one hand, SCMs can minimize energy consumption and CO2 emission associated with portland cement production (Damtoft et al., 2008; Schneider et al., 2011; Gruyaert et al., 2012; Wang et al., 2017). On the other hand, after short or long hydration times, SCMs incorporated concrete can achieve similar or better mechanical properties, as well as improved durability with respect to various deterioration mechanisms, such as sulfate attack and chloride penetration, compared with plain portland cement concrete (Lee et al., 2016; Yoo and Kwon, 2016). Regardless of the type of cementitious materials used, the temporal evolutions of degree of hydration and assemblage of hydration products have direct and significant impact on mechanical and transport properties of concrete. Therefore, hydration kinetics of cementitious materials and microstructure development of the paste are crucial to evaluate and/or predict the serviceability and durability of concrete.
Several well-established methods for studying hydration kinetics and microstructure evolution of plain portland cement have been developed. The degree of hydration can be routinely monitored/determined using one, or a combination, of several experimental approaches, such as measurement of heat of hydration (Wadsö, 2015; Lapeyre and Kumar, 2018), quantification of non-evaporable water and calcium hydroxide (CH) contents with thermogravimetric analysis (TGA) (Powers and Brownyard, 1946; Fagerlund, 2009; Ma and Li, 2013; Lothenbach et al., 2015), quantitative phase analysis with powder x-ray diffraction (XRD) (Snellings, 2015), and backscattered electron (BSE) image analysis (Scrivener et al., 2016). The microstructure and phase assemblage of hardened pastes can be characterized using mercury intrusion porosimetry (MIP) (Ma, 2014), nitrogen adsorption (Escalante-Garcia, 2003), BSE image analysis (Scrivener et al., 2016), etc. Based on experimental results and/or theoretical hydration kinetics, computer models, such as HYMOSTRUC (van Breugel, 1995a,b), the multi-component model (Kishi and Maekawa, 1996), CEMHYD3D (Bentz et al., 1998), and μic (Bishnoi and Scrivener, 2009; Kumar et al., 2012), have been developed to describe the hydration process of cement and/or microstructural development of cement paste. However, when these methods are employed in SCMs incorporated cementitious materials, one may encounter problems due to complexities of SCMs and the multi-component pastes (Fanghui et al., 2015). Although thermodynamic models, for example, GEMS (Gibbs free energy minimization software), have been used to resolve such complexities, they necessitate specific inputs of degrees of hydration of each reactant at a target point (De Weerdt et al., 2011; Schöler et al., 2015; Fernández et al., 2018). Computer-based microstructure models also need explicit information pertaining to degree of reaction of each component and/or kinetic (e.g., C-S-H nucleation and growth) parameters to simulate microstructure development in multi-phase cement paste (Ma, 2013). How to determine degrees of hydration/reaction of various components in a blended cementitious material is thus an essential research topic.
Since hydration of cement and pozzolanic reactions of SCMs are exothermic processes, several models based on direct calorimetry measurements have been developed to describe the hydration of blended cementitious materials (De Schutter and Taerwe, 1995; Swaddiwudhipong et al., 2003; Riding et al., 2013). They are useful in predicting the heat of hydration and semi-adiabatic temperature rise in mass concrete, and can be used to broadly estimate the overall degree of hydration of blended cementitious materials (Fanghui et al., 2016; Qiang et al., 2016; Zhang et al., 2016). However, the interactions between cement hydration and pozzolanic reaction of SCMs (with portlandite) are not explicitly considered by these models. To better describe the hydration behavior of multi-component cementitious materials, quantitative methods that can simultaneously determine the degree of hydration of cement and the degrees of pozzolanic reaction of SCMs are needed.
It is generally accepted that the reactions of SCMs (amorphous silica and alumina) consume CH from hydration of cement, leading to formation of secondary (i.e., pozzolanic) C-S-H and other phases (e.g., calcium aluminate hydrates). Assuming that the degree of hydration of cement is not affected by SCMs, one can determine the degree of pozzolanic reaction of SCMs incorporated in the same paste based on experimentally determined reduction in CH content and reasonably formulated stoichiometry of pozzolanic reactions (Shi and Day, 2000; Pane and Hansen, 2005; Neithalath et al., 2009; Rodríguez et al., 2012). However, this assumption, albeit basic, is invalid due to the filler effect, dilution effect, as well as pozzolanic effect of SCMs. Similarly, calculating degree of hydration of blended cementitious materials directly from non-evaporable water content may also be problematic, because the influence of SCMs on the non-evaporable water content of the paste is not explicitly known (Weng et al., 1997; Escalante-Garcia, 2003). Some researchers proposed to determine the degree of reaction of SCMs first, and then to calculate the degree of hydration of cement mathematically. Lam et al. (2000) proposed a method which uses the degree of reaction of FA as a “cementing efficient factor” to calculate the effective water-to-cement ratio, based on which the degree of hydration of cement is estimated. Li et al. (Xiang et al., 2009) experimentally determined the degree of reaction of FA and the overall content of CH, from which the hydration degree of cement in the blended cement paste was derived based on the stoichiometric relationships proposed by Papadakis (1999). The accuracy of this type of method depends on the stoichiometric relationships used to describe the pozzolanic reactions and the experimental methods employed to characterize the degree of pozzolanic reaction. The degrees of reaction of SCMs are often determined by measuring the amount of unreacted SCMs using selective dissolution methods (Li et al., 1985; Ohsawa et al., 1985; Lam et al., 2000; Poon et al., 2001; Haha et al., 2010; Narmluk and Nawa, 2011). However, in some instances, the selective dissolution method may not be reliable. For instance, Haha et al. (2010) demonstrated that the EDTA-based selective dissolution methods underestimate the degree of reaction of FA due to the presence of amorphous phases. Similarly other solvents-based selective dissolution methods cannot completely dissolve the hydrates and unreacted OPC phases, and thus lead to unpredictable errors. Image analysis methods (Haha et al., 2010; Deschner et al., 2013) have been also proposed for such estimations. These methods, which rely on analyses of BSE images, are not perfect, but considered to be more reliable than selective dissolution methods (Scrivener et al., 2015). Kocaba et al. (2012) showed that selective dissolution methods are also unreliable when used to determine the degree of reaction of GGBFS, and suggested an image analysis method to produce relatively more accurate estimates. BSE image analysis was also recommended as the best method to characterize the degree of reaction of GGBFS in a blended paste, because unreacted GGBFS particles have a unique gray level range in BSE images, thus making it easier to distinguish them from unhydrated cement and hydrates (Scrivener et al., 2015). In spite of these merits, BSE image analysis fails to characterize degree of reaction of SF, since SF particles can be smaller than the pixel size of a BSE image. In such cases, researchers have recommended using nuclear magnetic resonance (NMR) (Scrivener et al., 2015). However, NMR is not a widely and routinely available characterization tool in most of research institutes. BSE image analysis has another drawback, that is, it requires tedious and time consuming procedure to prepare samples and a large number of images to perform statistical analysis. Therefore, this method is more suitable for validation of other methods, rather than being used as the primary method for characterization of degree of reaction of SCMs (Scrivener et al., 2016).
Another class of methods used to characterize the hydration of binary blended cementitious materials can be called decoupling methods. These methods require only basic material characterization equipment (e.g., TGA and calorimetry) that are cost-efficient and widely available. They need neither time-consuming sample preparation nor complicated data interpretation. The obtained experimental results can be analyzed mathematically, based on theoretically-derived stoichiometric relations, to estimate degree of hydration of cement and degree of reaction of SCMs in a single step. Wang et al. (2004) assumed that the volumetric expansion coefficients of pozzolanic reaction products are equal to that of hydration products and established a set of functions to describe the reduction of porosity. The porosity and the CH content in the hardened blended cement paste were experimentally quantified, and the equations were solved to estimate both degree of hydration of cement and the degree of pozzolanic reaction of FA. A similar method was employed to study SF-cement system (Atlassi, 1995). These methods are straightforward and easy to use, thus are worthy to be further tested and refined.
Inspired by prior decoupling methods, this study proposes a novel decoupling method to simultaneously estimate the degree of hydration of cement and the degree of reaction of the SCM in binary pastes. SF, which is a relatively pure and homogeneous compound (amorphous silica content >90%), is selected as a representative example of SCM to demonstrate fundamental aspects of this decoupling method. The proposed method does not require determination of the degree of reaction of SF through selective dissolution or NMR. Instead, the hydrate (chemically bonded) water and CH contents of SF-cement pastes are expressed as functions of the degree of hydration of cement (α) and the degree of reaction of SF (αSF), using well-established and validated stoichiometric relations. Since the aforementioned pair of contents can be determined using TGA, α, and αSF can be estimated by solving an equation set (two equations of two unknowns). Validation of the method is provided using a separate and indirect porosity-based method.
Cement that satisfies the requirements of ASTM C150 for Type I portland cement was used in this study. Its engineering properties can be expressed by the initial setting time of 150 min, the final setting time of 180 min, 7 days compressive strength of 41 MPa and 28 days compressive strength of 57 MPa. The chemical composition of the cement, as expressed by percentages of oxides, is listed in Table 1. The mineral composition, in percentages of the four basic mineral phases and gypsum, calculated from modified Bogue calculations (Standard US., 2018) is listed in Table 2. Besides, Blain surface area of the irregularly shaped cement particles is 360 m2/kg, and its density is 3.15 g/cm3. Condensed SF, of which 93% is amorphous silica, was used in this study. Its chemical composition is shown in Table 1. The mean single particle diameter of the SF is 0.1 μm and the average density is 2.2 g/cm3.
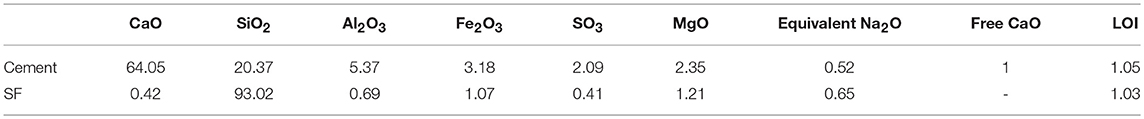
Table 1. Chemical composition of the ordinary portland cement (%).
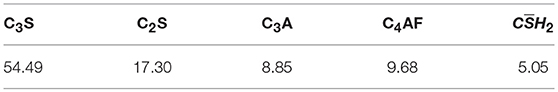
Table 2. Mineral composition of the ordinary portland cement (%).
Plain cement pastes were prepared with water-to-cement ratios (w/c) of 0.3, 0.4, and 0.5. In binary cementitious materials, weight-based substitution levels of cement by SF were 5 and 10%, respectively. In blended pastes, the water-to-binder ratio (w/b) was kept constant at 0.4. The six pastes were named PC03, PC04, PC05, SF00 (identical to PC04), SF05, and SF10, respectively. To prepare the pastes, raw materials were mixed using a vertical-axis pot mixer. Water was poured into the pot, then cementitious materials were added slowly while the blades were rotating. In the case of blended pastes, SF was added first, followed by cement. The subsequent mixing process consisted of a 3-min low speed mixing, a half-minute pause, and a 2-min high-speed mixing. After mixed, fresh mixtures were cast into ϕ15 mm plastic tubes, and two ends of the tubes were sealed to prevent moisture exchange and carbonation. Sealed specimens were stored at 23 ± 2°C until specific ages for characterization. Concerned ages included 1, 3, 7, 28, 60, and 120 days.
Thermogravimetric analysis (TGA) was used to determine the contents of hydrate water and CH in the plain and blended cement pastes. At specific ages, small pieces were firstly sawed off from the paste specimens, and then ground into fine particles (<63 μm) in a CO2-free chamber. Hydration was arrested using isopropanol [solvent exchange (Winnefeld et al., 2016)] for 15 min followed by ether flushing. After drying, about 40 mg of the resulting powder sample was analyzed by recording the weight while heating the sample up from room temperature to 1,000°C at 10°C/min, in a TGA 5500 (TA Instruments). Nitrogen gas was chosen to maintain an inert atmosphere, and corundum was selected as the reference material. Contents of hydrate water and CH were calculated from the weight loss in the ranges of <550°C and 450–550°C, respectively (De Weerdt et al., 2011; Schöler et al., 2015; Adu-Amankwah et al., 2017). Hydrate water content is normalized by dehydrated sample weight at 550°C, to obtain the hydrate water amount per gram of binder (wH). In plain cement paste, wH is used to calculate the degree of hydration of cement (α), that is, α = wH/ 0.23. CH content is normalized by the dried sample weight before TGA, to calculate mCH, that is, weight percentage of CH in dry paste sample (anhydrous binder and hydration products). Note that the abovementioned temperature ranges are rough descriptions, and the exact temperature boundaries for temperature intervals were determined by the tangent method from the corresponding derivative thermogravimetric (DTG) curve. The standard deviations of five independent TGA analyses at all tested ages were not larger than 0.15% for mH and 0.2% for mCH. It is also worth noting that the adopted drying method may lead to overestimation of hydrate water content, and, thus, degree of hydration. However, this method is consistent with current practice of characterization (Scrivener et al., 2016), and has high enough reliability for the purpose of estimating, rather than accurately determining, the degree of hydration of cement and the degree of reaction of silica fume in a blended cement paste.
Mercury intrusion porosimetry (MIP) was employed to determine the capillary porosity (ϕ), pore size distribution (PSD) curves, and skeletal density (, g/cm3) of hydrated pastes, for parameter derivation and validation of the decoupling method. At all concerned ages, cuboid samples with the smallest dimension smaller than 5 mm were sawed off from the specimen. Hydration suspension and drying were performed according to the solvent replacement drying procedure suggested by Aligizaki (2005). For pore size calculations based on Washburn equation (Washburn, 1921), the contact angle between mercury and hardened cement paste was chosen as 130° and the mercury surface tension of 480 mN/m was used. The abovementioned critical specimen size, drying method, and theoretical parameters, as well as other operational parameters, were all selected based on a general discussion on utilization of MIP in concrete technology (Ma, 2014). A Micromeritics AutoPore IV 9500 was used for MIP measurements. The instrument has a maximum applicable pressure of 210 MPa, which corresponds to a minimum detectable pore diameter of approximately 6 nm, when the selected contact angle and surface tension are used for pore size calculation. It is worth noting that, although MIP is an inappropriate method for determining the pore size distribution of cement-based materials because of the well-known ink-bottle effect (Moro and Böhni, 2002), it is useful to provide threshold diameters, intrudable pore volume measurements, as well as overall comparisons of pore structures (finer or coarser) (Diamond, 2000). Only physically meaningful parameters from MIP were used for derivations and validations in this study.
Since pozzolanic reaction of SF consumes CH from cement hydration to form secondary reaction product, it is essential to know how CH is formed and consumed. Cement hydration is so complex that no agreement on how it takes place has been reached. Therefore, in this study, CH formation during cement hydration is estimated from experimental results. Another key parameter, volume of hydrates generated when one unit volume of cement is completely hydrated (κh), is also derived from experimental results. Derivations of these two parameters from TGA and MIP results are presented in this section. TGA results (i.e., α and mCH) and MIP results (i.e., ϕ and ) of the three plain cement pastes at different ages—used for the derivations—are shown in Table 3. Figure 1 shows a comparison of α characterized in this study and those predicted (at 23°C, consistent with the curing temperature in this study) by a model developed by Riding et al. (2013). Riding's model was developed through regression on degrees of hydration of 7 types of portland cements in various pastes (various w/c ratios at 18 different ages), and, thus, captures the effects of cement composition, fineness, and w/c on hydration kinetics. This comparison, to a large extent, shows the reliability of the TGA method used in this study in estimating the degree of hydration of cement.
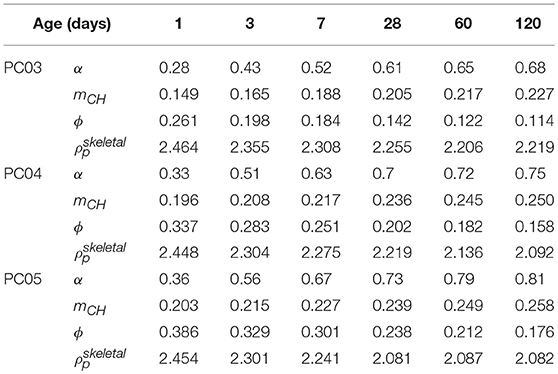
Table 3. Experimental results of plain cement pastes.
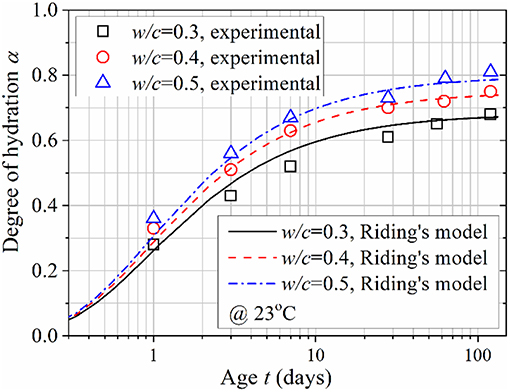
Figure 1. Comparison of the degrees of hydration data and Riding's model.
mCH and take only solid phases (anhydrous cement and hydration products) into account, and the fractions of anhydrous cement and hydration products in the solid phases are determined by α (regardless of w/c). Therefore, both mCH and should be functions of α. In Figures 2, 3, mCH and are plotted against α. Two curves/lines are added to mark the global and high degree of hydration range trends. In Figure 2, it can be seen that mCH slightly increases in the low-α range, while gradually merging with the high-α range trend line—which shows a directly proportional relation between mCH and α. As seen in Figure 3, the evolution of has a similar trend: it decreases, slightly, with respect to α in low-α range, and then merges into a line where there is a negative constant ratio between these two parameters. The authors acknowledge that early age (or low-α range) data are affected by the rapid hydration of C3A, so only data of age >3 days (or α > 0.5) are selected for further analysis. It also implies that the method developed in this study is applicable for cementitious materials at later ages as opposed to early ages.
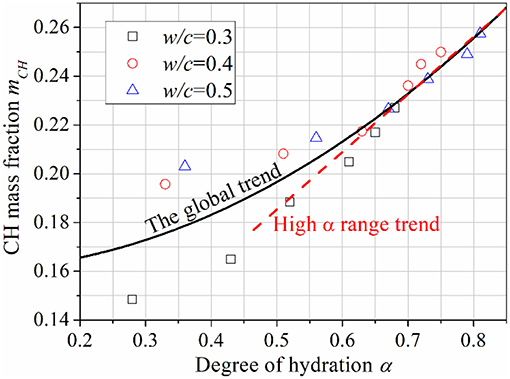
Figure 2. Evolution of CH mass fraction following degree of hydration.
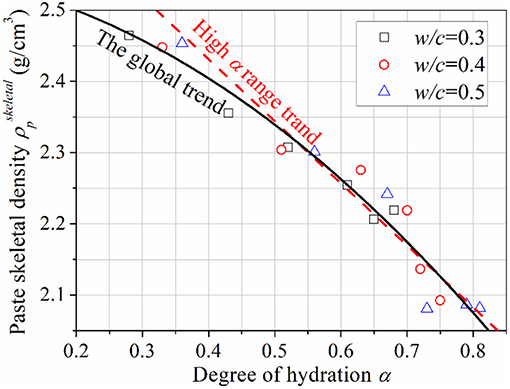
Figure 3. Evolution of paste skeletal density following degree of hydration.
Provided 1 cm3 (unit volume) of cement, and ignoring shrinkage, the volume of cement paste prepared with a specific w/c is
where ρcem is the density of cement. At a specific degree of hydration, α, the volume of anhydrous cement is
The total volume of solid phases including anhydrous cement and hydrates can be calculated as
in which the volume of hydrates is
From mCH, the volume fraction of CH in the solid phases can be calculated as
where density of CH, ρCH = 2.24 g/cm3. Thus, the volume of CH can be obtained as
Based on VCH, the volume fraction of CH in hydrates is calculated as
and the volume of CH generated when this unit volume of cement is completely hydrated can be determined as
To sum up, the above two parameters can be expressed as
Using TGA and MIP results included in Table 3, and κCH are calculated, and plotted against α in Figures 4, 5, respectively. It can be seen that, in the high-α range, both and κCH are constants. After averaging, these two parameters are derived as 0.272 and κCH = 0.583, respectively.
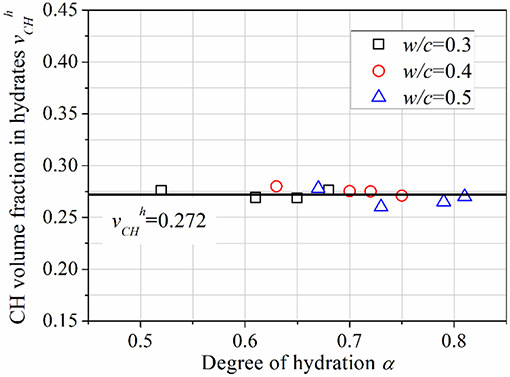
Figure 4. Evolution of following degree of hydration.
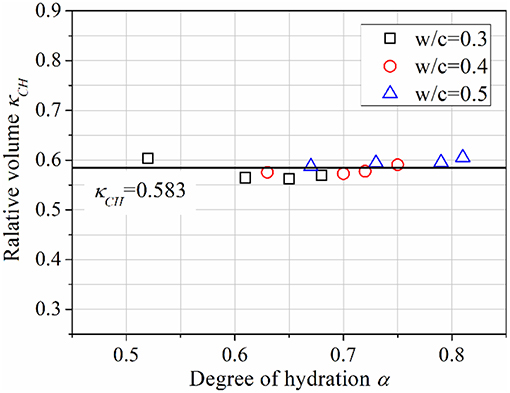
Figure 5. Evolution of κCH following degree of hydration.
Given these two constants, the volume of hydrates when one unit volume of cement is completely hydrated, κh, can be obtained as = 0.583/0.272 = 2.14. This deduced value of κh is consistent with the value used for developing the well-known Powers' model, that is, 2.13 (Sanahuja et al., 2007).
In this study, it is assumed that the pozzolanic reaction of SF takes place according to Equation (11). This assumption has been adopted successfully in many simulations and calculations involving SF (Bentz, 2000; Bentz et al., 2000; Swaddiwudhipong et al., 2003; Yajun and Cahyadi, 2004).
According to Equation (11), when 1 g of amorphous silica is reacted, the mass of pozzolanic C-S-H produced is
where Mi represents the molecular weight of i in g/mol. Given that molecular weight of pozzolanic C-S-H MPC − S − H = 191.8 g/mol (based on C-S-H stoichiometry shown in Equation 11) and that of silica MS = 60 g/mol, 191.8/60 = 3.20 g/g reacted silica. The masses of consumed CH and water are 1.1MCH/MS = 1.36 g/g reacted silica and 2.8MH/MS = 0.84 g/g reacted silica, respectively. In the SF incorporated system, the increase in hydrate water equals the amount of water consumed, that is, 0.84 g/g reacted silica. When the reactant is SF rather than silica, the amounts of CH and H consumption should be multiplied by the glass phase content, GCSF, while the total amount of solid products generated when 1 g of SF is totally reacted reads
For the SF used in this study, GCSF = 93%, thus, 3.20 × 0.93 + (1–0.93) = 3.04 g/g reacted SF. One of the reactants in Equation (11), CH, is formed in cement hydration. Therefore, the net mass increase of reaction products when 1 g of SF is totally reacted can be calculated by subtracting the mass of consumed CH, i.e.,1.36 g/g reacted silica, from , that is
Substituting GCSF into Equation (14), the calculations lead to = 1.78 g/g reacted SF, in which the increase in chemically bound hydrate water and gel water totals 0.78 g/g reacted SF. It should be noted that this describes the “undersaturated” state. If the reaction products are dried under 11%RH, gel water will evaporate, and C1.1SH3.9 transforms into C1.1SH2.0 (Bentz, 2000). Under such dry conditions, 2.63 g/g reacted silica, and the consumed water is 0.9MH/MS = 0.27 g/g reacted silica. Through Equations (13, 14), the value of = 1.25 g/g reacted SF, in which the chemically bound water is 0.25 g/g reacted SF. To sum up, the complete reaction of 1 g SF (used in this study) under saturated condition needs 0.78 g water, in which 0.25 g transforms to chemically bound water, while 0.53 g to gel water or physically bound water.
When 1 cm3 (unit volume) of silica is totally reacted, the volume of pozzolanic C-S-H is
where Vi represents the molar volume of i in cm3/mol. Given that VPC − S − H = 101.81 cm3/mol, VS = 27.27 cm3/mol, VCH = 33.1 cm3/mol and VH = 33.1 cm3/mol, it can be calculated that 101.81/27.27 = 3.73 cm3/cm3 reacted silica. The volume of consumed CH and water are 1.1VCH/VS = 1.34 cm3/ cm3 reacted silica and 2.8 VH/VS = 1.85 cm3/ cm3 reacted silica, respectively. When the reactant is SF rather than silica, calculations can be carried out in a similar way with that in mass calculations above. Thus, when 1 cm3 (unit volume) of SF is totally reacted, the total volume of reaction products (including the inert residue and assuming that the residue has the same density as that of amorphous silica) is
The net volume increase of reaction products, with respect to the volume of cement hydrates, is
Substituting GCSF = 93% into Equations (16, 17), it can be deduced that 3.54 cm3/ cm3 reacted SF and = 2.29 cm3/ cm3 reacted SF. The parameter is higher than κh (2.14 cm3/cm3 hydrated cement), which implies that SF is more effective in filling capillary pores than cement at the same degree of hydration/reaction.
In section Parameters related to Cement Hydration, κCH has been deduced to be 0.583 cm3/ cm3 hydrated cement. When 1 g of cement is totally hydrated, the mass of CH formed can be calculated as 0.415 g. Considering that 1 g of blended binder consists of mcem g of cement and mSF g of SF, and it is hydrated to a specific degree, in which the degree of hydration of cement is α and the reaction degree of SF is αSF, the mass fraction of CH in dried solid phase (dried according to section Thermogravimetric Analysis) can be calculated as
while the amount of hydrate water is
The two parameters, mCH and wH, of blended pastes at different ages were determined by TGA. The results are shown in Table 4. Note that SF00 here and PC04 in section Parameters Related to Cement Hydration are the same pastes (same cement and same w/c). However, they were prepared in two different batches—the first batch (PC04) for parameters derivation while the second batch (SF00) for comparison with SF blended pastes. The mCH and wH (or α) of SF00 in Table 4 deviate more or less from that of PC04 in Table 3 at the same ages. These limited derivations are attributed to variations in the actual curing conditions (i.e., temperature and humidity in the curing room). The evolution of mCH is plotted in Figure 6. It can be seen that, the higher the SF replacement, the lower the mCH at the same age. Even after considering the dilution effect resulted from the incorporation of SF, the mCH in blended cement paste is still lower than that of reference plain cement paste. This should certainly be attributed to the consumption of CH in the pozzolanic reaction of SF.
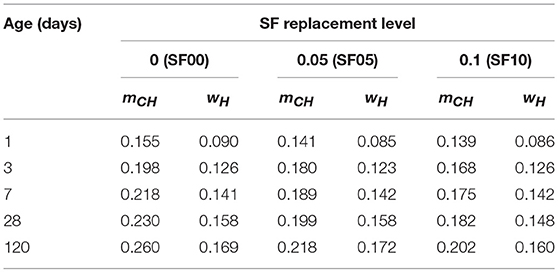
Table 4. Results of TGA for SF blended pastes (w/b = 0.4).
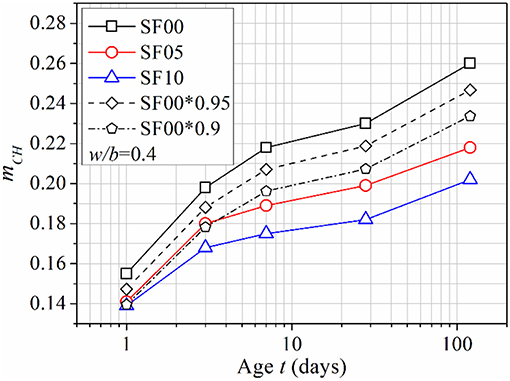
Figure 6. Evolution and comparison of mCH in SF blended pastes.
Substituting mCH, wH (Table 4), mcem (0.95 in SF05 and 0.90 in SF10) and mSF (0.05 in SF05 and 0.10 in SF10) into Equations (18, 19), there are only two unknowns left in these two equations, i.e., the degree of hydration of cement, α, and the degree of reaction of SF, αSF. Solving this equation set, α and αSF can be determined simultaneously. The results have been plotted in Figure 7. It can be seen from Figure 7 that the inclusion of SF accelerates hydration of cement at early ages, but suppresses cement hydration slightly at later ages. The higher the replacement ratio is, the more significant the effect will be. The early age acceleration can be explained by the dilution effect (constant w/b increases effective w/c) and the filler effect (fine SF particles increase nucleation sites for precipitation of hydration products), and the latter effect should be dominant. SF is beneficial to the early development of hydration and strength, and leads to the formation of denser microstructure as compared with that of plain cement paste. However, the dense microstructure may make it difficult for water to penetrate toward the unhydrated remnants of cement, which suppresses the late age hydration of cement (Neville, 1995). This dense microstructure formed through early ages could also hinder the reaction of agglomerated SF particles at later ages. This explains why αSF almost stops increasing after 28 days, as shown in Figure 7.
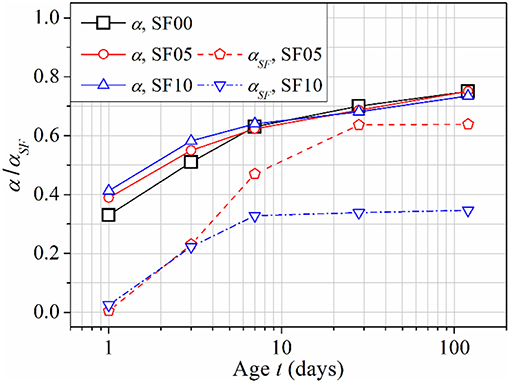
Figure 7. Evolutions of α and αSF in cement-SF blended pastes.
In this study, the model developed by Riding et al. (2013) is adopted to describe the hydration kinetics of cement in plain cement paste. This model is expressed by Equation (20)
in which αu is a physically meaningful parameter—ultimate degree of hydration, τ is the hydration time parameter in hours related to the induction period, β is the hydration slope parameter in the acceleration period, and t represents age of paste in days. In blended pastes, the overall degree of hydration of binder has two components, i.e., the degree of hydration of cement, α, and the degree of reaction of SF,αSF. It is assumed that the degree of hydration of cement in the blended binder can also be described by the Riding's model. Equation (20) was used to fit the data points in Figure 7, as shown in Figure 8, and the obtained kinetic parameters are listed in Table 5. It is seen that the incorporation of SF tends to shorten the dormant stage (smaller τ) and further accelerate the acceleration stage (larger β), both of which imply accelerated hydration of cement at early ages. However, the long-term/ultimate degree of hydration of cement is suppressed (slightly smaller αu).
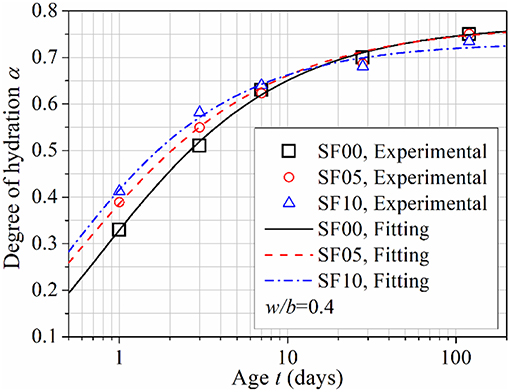
Figure 8. Nonlinear fitting of hydration degree of cement (α) in blended pastes.
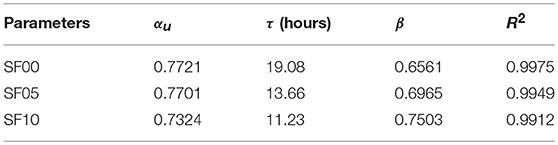
Table 5. Kinetic parameters in Equation (20) obtained from non-linear fitting.
To express hydration kinetics of the blended binders, the reaction kinetics of SF also need to be known. Rather than through separated fittings, the degree of reaction of SF (αSF) is tied to the degree of hydration of cement (α) in the same blended paste through a reasonably established relation, shown in Equation (21), which is modified from Swaddiwudhipong et al.'s work (Swaddiwudhipong et al., 2003). It is assumed that, in a specific cement-SF binary paste at a particular status (or age), the amount of SF that can be reacted depends on the content of CH available for pozzolanic reaction. A parameter, μCH, is proposed to denote the ratio of reacted CH in pozzolanic reaction to total amount of CH form due to hydration of cement. The relation between αSF and α can thus be expressed as
where the constant 0.74 is the weight (g) of amorphous silica reacted with 1 g of CH during the pozzolanic reaction described by Equation (11). Theoretically, the parameter μCH should not be a constant, but a function of the total amount of CH generated by cement hydration (i.e., ) and the total amount of amorphous silica (i.e., GCSFmSF). This function has been deduced empirically through surface fitting on experimental data (in Figure 7), as shown in Equation (22),
where , = GCSFmSF, and R2 = 0.9966 for the surface fitting. It is worth noting that Equation (22) is only valid for the specific case in this study, as μCH should also depends on the mean diameter and degree of agglomeration of SF particles.
Since no precise method has been available to simultaneously estimate the degree of hydration of cement (α) and degree of reaction of SF (αSF) in a binary paste, an indirect method is employed to preliminarily validate the decoupling approach developed in this study. To do this, capillary porosity calculated from a modified Powers' model, based on the estimated α and αSF, is compared with capillary porosity determined by MIP. Assuming paste volume equals summation of volumes of water, cement, and SF, and pore volume decreases due to expansions of solid hydration/reaction products of cement and SF, the modified Powers' model is derived as
Substituting κh = 2.14, 2.29, ρcem = 3.15 g/cm3 and ρSF = 2.2 g/cm3 into Equation (22), the modified Powers' model can be re-written as
Chemical shrinkage is ignored in this derivation.
Pore structure of SF incorporated cement pastes, SF05 and SF10, are characterized by MIP. Their cumulative porosity curves at ages of 3 days and 120 days are shown in Figure 9. It can be seen that at both ages SF10 shows a finer pore structure, represented by smaller threshold pore diameter. At early ages (e.g., 3 days), higher SF content facilitates hydration of cement and results in lower porosity; while at later ages (e.g., 120 days), higher SF content suppresses further hydration of cement and leads to higher porosity. These findings of pore structure are consistent with the revealed degrees of hydration/reaction shown in Figure 7. Capillary porosities calculated from Equation (24) and measured by MIP are compared in Figure 10. The trends of evolution of porosities as well as the comparative relations between SF05 and SF10 revealed by calculations and measurements are consistent to each other, but the results of calculations are consistently higher than MIP results. On the one hand, Equation (24) ignores chemical shrinkage, which can lead to errors in capillary porosity calculation. On the other hand, MIP tends to underestimate, more or less, the capillary porosity due to limited maximum pressure and the existence of pores isolated from the interconnected capillary network (Ma and Li, 2013; Ma et al., 2014, 2015). Considering these two points, the deviation of calculated capillary porosities from MIP results seems to be reasonable.
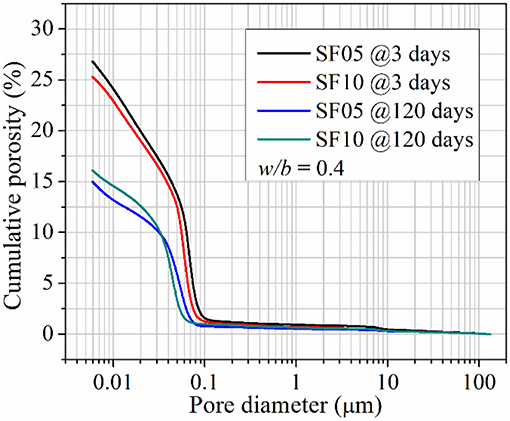
Figure 9. Comparison of pore structure of SF incorporated cement pastes at early and late ages.
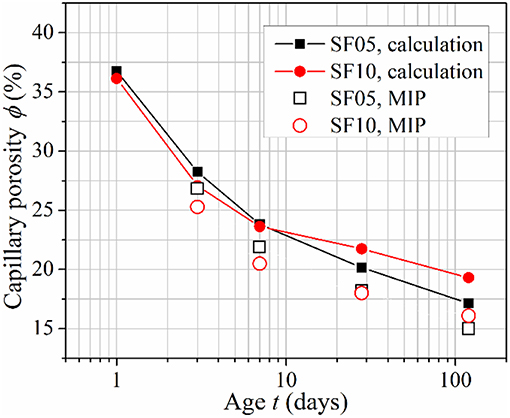
Figure 10. Comparison of calculated and measured capillary porosity.
A decoupling method which can simultaneously estimate the degree of hydration of cement and the degree of reaction of SF of a cement-SF binary cementitious material in a blended paste is presented in section Results and Analysis. This method has been preliminarily and indirectly validated through comparison of capillary porosities calculated from the estimated degrees of hydration/reaction and those measured by MIP. A direct validation is desired in future study, through comparison of the estimated degree of reaction of SF with that characterized by NMR, according to the RILEM TC 238 report (Scrivener et al., 2015), as well as a comparison of the estimated degree of hydration of cement with that characterized by quantitative XRD and/or BSE image analysis. Once validated, this decoupling method will be a promising method for prompt estimations of degrees of hydration/reaction of blended cementitious materials, since it requires only widely available and inexpensive characterization tools (i.e., TGA and MIP) and simple data processing. It must be noted that the accuracy of this method is limited by the stoichiometric parameters of cement hydration, which are derived roughly from experimental results in this study, and the assumed pozzolanic reaction, that is, Equation (11). However, since the viability of the decoupling method has been proven, stoichiometric parameters of cement hydration and pozzolanic reaction derived from more reliable methods, for example, thermodynamic simulation and advanced characterizations, can be substituted into this model to improve its accuracy. Furthermore, this decoupling method can be readily extended to estimate the degree of reaction of other SCMs, for example, FA and GGBFS, provided the stoichiometric parameters of their pozzolanic reactions can be determined reliably.
The reaction kinetics of SF and the effect of SF on hydration of cement depend on the degree of agglomeration of SF particles (Meng et al., 2016) (out of other factors like mean particle size and mass percentage of silica). This is because SF particles can rarely be perfectly dispersed in cement paste; instead they form flocs as sketched in Figure 11A. If SF can be perfectly dispersed, its influence on cement hydration can be enhanced, and the degree of hydration of cement can be improved. The authors posit that it is reasonable to use Equations (20, 21) to describe the hydration of cement in cement-SF blended paste, and the relation between degree of hydration of SF and degree of hydration of cement, respectively. However, it is clarified that Equation (22) and the kinetic parameters listed in Table 5 are only valid under the specific conditions of this study. Nevertheless, no regardless of how SF particles are distributed in cement paste, they can block the interconnected capillary network due to their small particle size/large surface area and high reactivity, leading to finer pore structures as sketched in Figure 11B and illustrated by the MIP results in Figure 9.
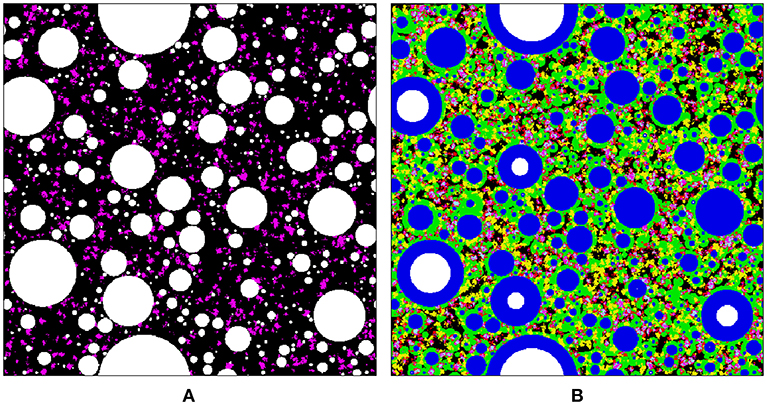
Figure 11. Sketch of the microstructure of SF incorporated cement paste: (A) initial status; (B) mature paste. In the images, colors represent specific phases: white, anhydrous cement; blue, inner hydration products; green, outer C-S-H layer; yellow, crystalline hydrate (including CH); magenta, agglomerated SF particles; cyan/red, secondary C-S-H formed in pozzolanic reaction of SF.
Widely available and inexpensive experimental methods, that is, TGA and MIP, are used to derive important stoichiometric parameters of cement hydration and to characterize the porosity, skeletal density, hydrate water, and CH contents of plain and blended cement pastes. Based on the experimental results, a decoupling method is developed to estimate the degree of hydration of cement and degree of reaction of SF in a cement-SF blended cement paste, using only TGA. A modified Powers' model is derived to calculate capillary porosities of blended pastes from the degrees of hydration/reaction of the pastes' components. The calculated porosities are compared to MIP results to validate the decoupling method, albeit indirectly. In addition to the development and validation of the decoupling method, the following conclusions can be drawn from this study:
(1) The incorporation of SF affects the hydration kinetics of cement in the binary binder, leading to lower ultimate degree of hydration, shorter dormant stage, and faster reaction in the acceleration stage. As a result, the degree of hydration of cement in a blended paste is higher at early ages (e.g., 3 days) but lower at later ages (e.g., 120 days) than that in the reference plain cement paste. In the tested range of substitution levels of cement by SF (i.e., 5 and 10%), the higher the substitution level of SF, the more significant the effects on cement hydration kinetics.
(2) In a given blended paste, the degree of reaction of SF can be tied to the degree of hydration of cement through a secondary parameter. The parameter describes the rate of CH consumption in pozzolanic reaction. The higher the substitution level, the lower the degree of reaction of SF at a given age.
(3) A higher substitution level of SF, in a blended paste, results in lower porosity, and smaller threshold pore diameter at early ages (e.g., 3 days), but higher porosity at later ages (e.g., 120 days).
The decoupling method developed in this study is based on widely available characterization tools and simple data analysis, and does not necessitate the use of expensive instrumentation or time-consuming data-processing protocols. It is thus a promising method for prompt and convenient estimations of degrees of hydration/reaction of blended cementitious materials, especially when accurate estimates are not required. Methods recommended by RILEM TC 238 should be used for more accurate estimations. For future work, the degree of hydration of cement and the degree of reaction of SF, in relation to various processing parameters—for example, water-to-binder ratio, substitution level of SF, chemical composition and fineness of cement and SF, and curing temperature—will be characterized by validated and reliable methods. Based on collected datasets, advanced approaches, for example, machine learning, will be used to model and predict the hydration kinetics of blended cements.
All authors listed have made a substantial, direct and intellectual contribution to the work, and approved it for publication.
Financial support from National Science Foundation under 1761697 and 1661609 and from the Advanced Materials for Sustainable Infrastructure seed funding at Missouri University of Science and Technology is gratefully acknowledged. HS would also like to acknowledge the support from National Natural Science Foundation of China under 51520105012 and 51408365.
The authors declare that the research was conducted in the absence of any commercial or financial relationships that could be construed as a potential conflict of interest.
Technical support from the Materials Research Center and the Center for Infrastructure Engineering Studies at Missouri University of Science and Technology is also acknowledged.
Adu-Amankwah, S., Zajac, M., Stabler, C., Lothenbach, B., and Black, L. (2017). Influence of limestone on the hydration of ternary slag cements. Cement Concrete Res. 100, 96–109. doi: 10.1016/j.cemconres.2017.05.013
Aligizaki, K. K. (2005). Pore Structure of Cement-Based Materials: Testing, Interpretation and Requirements. Boca Raton, FL: CRC Press.
Atlassi, E. H. (1995). Nonevaporable water and degree of cement hydration in silica fume-cement systems. Special Publication. 153, 703–718.
Bentz, D. P. (2000). Influence of silica fume on diffusivity in cement-based materials: II. Multi-scale modeling of concrete diffusivity. Cement Concrete Res. 30, 1121–1129. doi: 10.1016/S0008-8846(00)00263-5
Bentz, D. P., Jensen, O. M., Coats, A. M., and Glasser, F. P. (2000). Influence of silica fume on diffusivity in cement-based materials: experimental, I., and computer modeling studies on cement pastes. Cement Concrete Res. 30, 953–962. doi: 10.1016/S0008-8846(00)00264-7
Bentz, D. P., Waller, V., and de Larrard, F. (1998). Prediction of adiabatic temperature rise in conventional and high-performance concretes using a 3-D microstructural model. Cement Concrete Res. 28, 285–297. doi: 10.1016/S0008-8846(97)00264-0
Bishnoi, S., and Scrivener, K. L. (2009). μic: a new platform for modelling the hydration of cements. Cement Concrete Res. 39, 266–274. doi: 10.1016/j.cemconres.2008.12.002
Damtoft, J. S., Lukasik, J., Herfort, D., Sorrentino, D., and Gartner, E. M. (2008). Sustainable development and climate change initiatives. Cement Concrete Res. 38, 115–127. doi: 10.1016/j.cemconres.2007.09.008
De Schutter, G., and Taerwe, L. (1995). General hydration model for Portland cement and blast furnace slag cement. Cement Concrete Res. 25, 593–604. doi: 10.1016/0008-8846(95)00048-H
De Weerdt, K., Been Haha, M., Le Saout, G., Kjellsen, K. O., Justnes, H., and Lothenbach, B. (2011). Hydration mechanisms of ternary Portland cements containing limestone powder and fly ash. Cement Concrete Res. 41, 279–291. doi: 10.1016/j.cemconres.2010.11.014
Deschner, F., Münch, B., Winnefeld, F., and Lothenbach, B. (2013). Quantification of fly ash in hydrated, blended Portland cement pastes by backscattered electron imaging. J. Microsc. 251, 188–204. doi: 10.1111/jmi.12061
Diamond, S. (2000). Mercury porosimetry: an inappropriate method for the measurement of pore size distributions in cement-based materials. Cement Concrete Res. 30, 1517–1525. doi: 10.1016/S0008-8846(00)00370-7
Escalante-Garcia, J. (2003). Nonevaporable water from neat OPC and replacement materials in composite cements hydrated at different temperatures. Cement Concrete Res. 33, 1883–1888. doi: 10.1016/S0008-8846(03)00208-4
Fagerlund, G. (2009). Chemically Bound Water as Measure of Degree of Hydration: Method and Potential Errors: Division of Building Materials. Lund Institute of Technology.
Fanghui, H., Qiang, W., and Jingjing, F. (2015). The differences among the roles of ground fly ash in the paste, mortar and concrete. Construction Building Mater. 93, 172–179. doi: 10.1016/j.conbuildmat.2015.05.117
Fanghui, H., Qiang, W., Mutian, L., and Mutian, M. (2016). Early hydration properties of composite binder containing limestone powder with different finenesses. J. Thermal Analysis Calorimetry 123, 1141–1151. doi: 10.1007/s10973-015-5088-9
Fernández, Á., Lothenbach, B., Cruz Alonso, M., and García Calvo, J. L. (2018). Thermodynamic modelling of short and long term hydration of ternary binders. Influence of Portland cement composition and blast furnace slag content. Construc. Build. Mater. 166, 510–521. doi: 10.1016/j.conbuildmat.2018.02.007
Gruyaert, E., Van den Heede, P., Maes, M., and De Belie, N. (2012). Investigation of the influence of blast-furnace slag on the resistance of concrete against organic acid or sulphate attack by means of accelerated degradation tests. Cement Concrete Res. 42, 173–185. doi: 10.1016/j.cemconres.2011.09.009
Haha, M. B., De Weerdt, K., and Lothenbach, B. (2010). Quantification of the degree of reaction of fly ash. Cement Concrete Res. 40, 1620–1629. doi: 10.1016/j.cemconres.2010.07.004
Juenger, M. C., and Siddique, R. (2015). Recent advances in understanding the role of supplementary cementitious materials in concrete. Cement Concrete Res. 78, 71–80. doi: 10.1016/j.cemconres.2015.03.018
Kishi, T., and Maekawa, K. (1996). Multi-component model for hydration heating of Portland cement. Concrete Library JSCE 28, 97–115.
Kocaba, V., Gallucci, E., and Scrivener, K. L. (2012). Methods for determination of degree of reaction of slag in blended cement pastes. Cement Concrete Res. 42, 511–525. doi: 10.1016/j.cemconres.2011.11.010
Kumar, A., Bishnoi, S., and Scrivener, K. L. (2012). Modelling early age hydration kinetics of alite. Cement Concrete Res. 42, 903–918. doi: 10.1016/j.cemconres.2012.03.003
Lam, L., Wong, Y., and Poon, C. (2000). Degree of hydration and gel/space ratio of high-volume fly ash/cement systems. Cement Concrete Res. 30, 747–756. doi: 10.1016/S0008-8846(00)00213-1
Lapeyre, J., and Kumar, A. (2018). Influence of pozzolanic additives on hydration mechanisms of tricalcium silicate. J. Am. Ceramic Soc. 101, 3557–3574. doi: 10.1111/jace.15518
Lee, B., Kim, G., Nam, J., Cho, B., Hama, Y., and Kim, R. (2016). Compressive strength, resistance to chloride-ion penetration and freezing/thawing of slag-replaced concrete and cementless slag concrete containing desulfurization slag activator. Construct. Build. Mater. 128, 341–348. doi: 10.1016/j.conbuildmat.2016.10.075
Li, S., Roy, D. M., and Kumar, A. (1985). Quantatative determination of pozzolanas in hydrated systems of cement or Ca(OH)2 with fly ash or silica fume. Cement Concrete Res. 15, 1079–1086. doi: 10.1016/0008-8846(85)90100-0
Lothenbach, B., Durdzinski, P., and De Weerdt, K. (2015). Thermogravimetric analysis, in A Practical Guide to Microstructural Analysis of Cementitious Materials, eds K. Scrivener, R. Snellings, and B. Lothenbach (Boca Raton, FL: CRC Press). doi: 10.1201/b19074-6
Ma, H. (2013). Multi-Scale Modeling of the Microstructure and Transport Properties of Contemporary Concrete. Doctoral dissertation, the Hong Kong University of Science and Technology.
Ma, H. (2014). Mercury intrusion porosimetry in concrete technology: tips in measurement, pore structure parameter acquisition and application. J. Porous Mater. 21, 207–215. doi: 10.1007/s10934-013-9765-4
Ma, H., Hou, D., and Li, Z. (2015). Two-scale modeling of transport properties of cement paste: Formation factor, electrical conductivity and chloride diffusivity. Comp. Mater. Sci. 110, 270–280. doi: 10.1016/j.commatsci.2015.08.048
Ma, H., Hou, D., Lu, Y., and Li, Z. (2014). Two-scale modeling of the capillary network in hydrated cement paste. Construct. Build. Mater. 64, 11–21. doi: 10.1016/j.conbuildmat.2014.04.005
Ma, H., and Li, Z. (2013). Realistic pore structure of Portland cement paste: experimental study and numerical simulation. Comput. Concr. 11, 317–336. doi: 10.12989/cac.2013.11.4.317
Meng, W., Lunkad, P., Kumar, K., and Khayat, K. (2016). Influence of silica fume and polycarboxylate ether dispersant on hydration mechanisms of cement. J. Phys. Chem. C 120, 26814–26823. doi: 10.1021/acs.jpcc.6b08121
Moro, F., and Böhni, H. (2002). Ink-bottle effect in mercury intrusion porosimetry of cement-based materials. J. Colloid Interface Sci. 246, 135–149. doi: 10.1006/jcis.2001.7962
Narmluk, M., and Nawa, T. (2011). Effect of fly ash on the kinetics of Portland cement hydration at different curing temperatures. Cement Concrete Res. 41, 579–589. doi: 10.1016/j.cemconres.2011.02.005
Neithalath, N., Persun, J., and Hossain, A. (2009). Hydration in high-performance cementitious systems containing vitreous calcium aluminosilicate or silica fume. Cement Concrete Res. 39, 473–481. doi: 10.1016/j.cemconres.2009.03.006
Neville, A. M. (1995). Properties of Concrete: Fourth and final Edition. London: Pearson Education Limited.
Ohsawa, S., Goto, A. S., and Daimon, M. (1985). Quantitative determination of fly ash in the hydrated fly ash - CaSO4•2H2O•Ca(OH)2 system. Cement Concrete Res. 15, 357–366. doi: 10.1016/0008-8846(85)90047-X
Pane, I., and Hansen, W. (2005). Investigation of blended cement hydration by isothermal calorimetry and thermal analysis. Cement Concrete Res. 35, 1155–1164. doi: 10.1016/j.cemconres.2004.10.027
Papadakis, V. G. (1999). Effect of fly ash on Portland cement systems: Part, I. Low-calcium fly ash. Cement Concrete Res. 29, 1727–1736. doi: 10.1016/S0008-8846(99)00153-2
Poon, C. S., Kou, S. C., Wong, Y. L., and Wong, R. (2001). Rate of pozzolanic reaction of metakaolin in high-performance cement pastes. Cement Concrete Res. 31, 1301–1306. doi: 10.1016/S0008-8846(01)00581-6
Powers, T. C., and Brownyard, T. L. (1946). “Studies of the physical properties of hardened portland cement paste,” in American Concrete Institute Journal Proceedings, 43, 101–132.
Qiang, W., Mengxiao, S., and Dengquan, W. (2016). Contributions of fly ash and ground granulated blast-furnace slag to the early hydration heat of composite binder at different curing temperatures. Adv. Cement Res. 28, 320–327. doi: 10.1680/jadcr.15.00077
Riding, K. A., Poole, J. L., Folliard, K. J., Juenger, M. C. G., and Schindler, A. K. (2013). Modeling hydration of cementitious systems. ACI Mater. J. 109, 225–234. doi: 10.14359/51683709
Rodríguez, E. D., Bernal, S. A., Provis, J. L., and Pay,á, J. (2012). Structure of Portland cement pastes blended with sonicated silica fume. J. Mater. Civil Eng. 24, 1295–1304. doi: 10.1061/(ASCE)MT.1943-5533.0000502
Sanahuja, J., Dormieux, L., and Chanvillard, G. (2007). Modelling elasticity of a hydrating cement paste. Cement Concrete Res. 37, 1427–1439. doi: 10.1016/j.cemconres.2007.07.003
Schneider, M., Romer, M., Tschudin, M., and Bolio, H. (2011). Sustainable cement production—present and future. Cement Concrete Res. 41, 642–650. doi: 10.1016/j.cemconres.2011.03.019
Schöler, A., Lothenbach, B., Winnefeld, F., and Zajac, M. (2015). Hydration of quaternary Portland cement blends containing blast-furnace slag, siliceous fly ash and limestone powder. Cement Concrete Composites 55, 374–382. doi: 10.1016/j.cemconcomp.2014.10.001
Scrivener, K., Snellings, R., and Lothenbach, B. (2016). “Electron microscopy,” in A Practical Guide to Microstructural Analysis of Cementitious Materials, eds K. Scrivener, R. Snellings, and B. Lothenbach (Boca Raton, FL: CRC Press), 351–418.
Scrivener, K. L., Lothenbach, B., De Belie, N., Gruyaert, E., Skibsted, J., Snellings, R., et al. (2015). TC 238-SCM: hydration and microstructure of concrete with SCMs - State of the art on methods to determine degree of reaction of SCMs. Mater. Struct. 48, 835–862. doi: 10.1617/s11527-015-0527-4
Shi, C., and Day, R. L. (2000). Pozzolanic reaction in the presence of chemical activators: Part, I. Reaction kinetics. Cement Concrete Res. 30, 51–58. doi: 10.1016/S0008-8846(99)00205-7
Snellings, R. (2015). “X-ray powder diffraction applied to cement,” in A Practical Guide to Microstructural Analysis of Cementitious Materials, eds K. Scrivener, R. Snellings, and B. Lothenbach (Boca Raton, FL: CRC Press), 107–176. doi: 10.1201/b19074-5
Standard US. (2018). ASTM C150/ C150M-18 Standard Specification for Portland Cement. West Conshohocken, PA: ASTM International. Available online at: www.astm.org
Swaddiwudhipong, S., Wu, H., and Zhang, M. (2003). Numerical simulation of temperature rise of high-strength concrete incorporating silica fume and superplasticiser. Adv. Cement Res. 15, 161–169. doi: 10.1680/adcr.2003.15.4.161
van Breugel, K. (1995a). Numerical simulation of hydration and microstructural development in hardening cement-based materials: (I) theory. Cement Concrete Res. 25, 319–331. doi: 10.1016/0008-8846(95)00017-8
van Breugel, K. (1995b). Numerical simulation of hydration and microstructural development in hardening cement-based materials: (II) applications. Cement Concrete Res. 25, 522–530. doi: 10.1016/0008-8846(95)00041-A
Wadsö, L., Winnefeld, F., Riding, K. A., and Sandberg, P. (2015). “Calorimetry,” in A Practical Guide to Microstructural Analysis of Cementitious Materials, eds K. Scrivener, R. Snellings, and B. Lothenbach (Boca Raton, FL: CRC Press), 37–74. doi: 10.1201/b19074-3
Wang, A., Zhang, C., and Sun, W. (2004). Fly ash effects: II. The active effect of fly ash. Cement Concrete Res. 34, 2057–2060. doi: 10.1016/j.cemconres.2003.03.001
Wang, D., Zhou, X., Meng, Y., and Chen, Z. (2017). Durability of concrete containing fly ash and silica fume against combined freezing-thawing and sulfate attack. Construct. Build. Mater. 147, 398–406. doi: 10.1016/j.conbuildmat.2017.04.172
Washburn, E. W. (1921). The dynamics of capillary flow. Phys. Rev. 17, 273–283. doi: 10.1103/PhysRev.17.273
Weng, J. K., Langan, B., and Ward, M. (1997). Pozzolanic reaction in Portland cement, silica fume, and fly ash mixtures. Can. J. Civil Eng. 24, 754–760. doi: 10.1139/l97-025
Winnefeld, F., Scholer, A., and Lothenbach, B. (2016). “Sample Preparation,” in A Practical Guide to Microstructural Analysis of Cementitious Materials, eds K. Scrivener, R. Snellings, and B. Lothenbach (Boca Raton, FL: CRC Press), 1–36.
Xiang, L., Peiyu, Y., and Aruhan (2009). Assessment method of hydarion degree of cement in complex binder based on the calcium hydroxide content. J. Chinese Ceramic Soc. 37, 1–5.
Yajun, J., and Cahyadi, J. (2004). Simulation of silica fume blended cement hydration. Mater. Struct. 37, 397–404. doi: 10.1007/BF02479636
Yoo, S.-W., and Kwon, S.-J. (2016). Effects of cold joint and loading conditions on chloride diffusion in concrete containing GGBFConstruction, S., and Building Materials. 115, 247–255.
Keywords: silica fume, blended cement, degree of hydration, pozzolanic reaction, thermogravimetric analysis, decoupling
Citation: Liao W, Sun X, Kumar A, Sun H and Ma H (2019) Hydration of Binary Portland Cement Blends Containing Silica Fume: A Decoupling Method to Estimate Degrees of Hydration and Pozzolanic Reaction. Front. Mater. 6:78. doi: 10.3389/fmats.2019.00078
Received: 30 November 2018; Accepted: 05 April 2019;
Published: 24 April 2019.
Edited by:
John L. Provis, University of Sheffield, United KingdomReviewed by:
Guang Ye, Delft University of Technology, NetherlandsCopyright © 2019 Liao, Sun, Kumar, Sun and Ma. This is an open-access article distributed under the terms of the Creative Commons Attribution License (CC BY). The use, distribution or reproduction in other forums is permitted, provided the original author(s) and the copyright owner(s) are credited and that the original publication in this journal is cited, in accordance with accepted academic practice. No use, distribution or reproduction is permitted which does not comply with these terms.
*Correspondence: Hongyan Ma, bWFob25AbXN0LmVkdQ==; bWh5MTEwM0BnbWFpbC5jb20=
Disclaimer: All claims expressed in this article are solely those of the authors and do not necessarily represent those of their affiliated organizations, or those of the publisher, the editors and the reviewers. Any product that may be evaluated in this article or claim that may be made by its manufacturer is not guaranteed or endorsed by the publisher.
Research integrity at Frontiers
Learn more about the work of our research integrity team to safeguard the quality of each article we publish.