 Shengxi Li
 Lizeth J. Sánchez
 Hongbo Cong
94% of researchers rate our articles as excellent or good
Learn more about the work of our research integrity team to safeguard the quality of each article we publish.
Find out more
ORIGINAL RESEARCH article
Front. Mater., 13 February 2019
Sec. Environmental Degradation of Materials
Volume 6 - 2019 | https://doi.org/10.3389/fmats.2019.00010
This article is part of the Research TopicFrontiers in Materials: Rising Stars View all 56 articles
The time-dependent effects of temperature and salt (NaCl) concentration on the corrosion behavior of carbon steel in CO2-saturated environments were explored using various electrochemical techniques coupled with XRD, Raman spectroscopy, and SEM/FIB examinations. At constant salt level, corrosion rate increases, and stabilizes when the temperature is below 60°C. When temperature is higher than 60°C, corrosion rate firstly increases, reaches an apex, and then starts decreasing continuously. The magnitude of the decrease is inversely proportionally to the salt concentration, which is attributed to the microstructure of dual-layer FeCO3 scale. Polarization experiments indicate the anodic process is more affected by salt concentration than temperature while the opposite is true for the cathodic kinetics. Although chloride is not detected in the corrosion scale, it is regarded to have significant influence on the nucleation and growth of FeCO3 and therefore the properties (e.g., thickness and compactness) of the corrosion scales. Lastly, a mechanism is proposed for the evolution of corrosion scales on carbon steel in CO2 saturated environment as a function of temperature and salt concentration.
The corrosion of carbon steel caused by dissolved carbon dioxide (CO2) has been recognized to pose a serious threat to the oil and gas industry (Jasinski, 1987; Liu et al., 2009a, 2012; Liu F. G. et al., 2009; Zhu et al., 2011; Sun et al., 2012). The carbonic acid (H2CO3), in equilibrium with dissolved CO2, is very corrosive to carbon steel. The failure of equipment in the oil and gas industry caused by CO2 corrosion often results in great economic loss and catastrophic accidents, which has attracted great attention (de Waard et al., 1991; Liu et al., 2009a,b; Ortega-Sotelo et al., 2011).
The understanding of CO2 corrosion mechanisms under the effects of many mechanical and environmental factors has been of great interest in the corrosion field. Numerous factors have been investigated to further our understanding on CO2 corrosion, including temperature (Nesic et al., 1996; Kinsella et al., 1998; Liu F. G. et al., 2009; Zhu et al., 2011), pH (de Waard et al., 1991; Nesic et al., 1996; Linter and Burstein, 1999), partial pressure (Jasinski, 1987; Kinsella et al., 1998; Zhang et al., 2012), and flow rate (Videm and Dugstad, 1987; de Waard et al., 1991; Fang et al., 2013). Temperature, as one of the most important influencing factors in CO2 corrosion, plays a vital role in the possible formation of corrosion product layer. It is generally believed that, at low temperatures (below 60°C), no protective layer forms on the steel surface because of the high solubility of the corrosion product iron carbonate (FeCO3). As temperature increases, FeCO3 precipitates from the solution due to the decrease of solubility and forms compact and adherent corrosion product layers on the steel surface (Tang et al., 2003; Shukla and Quraishi, 2009; Porcayo-Calderon et al., 2015). Therefore, corrosion rate generally decreases as the protective corrosion layers form at temperatures above 60°C. Yin et al. (2009) investigated the effect of temperature on the corrosion of carbon steel in CO2-saturated NaCl environments. They concluded that temperature affected the crystal size and thickness of the corrosion product layer and both high and low temperatures resulted in small amounts of cementite (Fe3C) and magnetite (Fe3O4) in the corrosion product layer. Han et al. (2009) also confirmed Fe3O4 and FeCO3 as the dominant species in the corrosion product using X-ray diffraction (XRD) and transmission electron microscopy/energy dispersive X-ray analysis (TEM/EDX).
In recent years, the effect of salt concentration on the CO2 corrosion of mild steel has also been studied. Liu et al. demonstrated that chloride destroyed the corrosion product films and changed their morphology but had no effect on the composition of the corrosion product (Liu et al., 2014). Mao et al. found that the presence of a small content of chloride could significantly reduce the passivating tendency of carbon steel (Mao et al., 1994). Schmitt et al. reported that increasing chloride could inhibit CO2 corrosion by decreasing the solubility of CO2 in solution at room temperature (Schmitt, 2015). Similarly, Nešić et al. found that the corrosion rate of carbon steel in CO2 and NaCl environment significantly decreased with increasing NaCl concentration from 3 to 25 wt. % (Fang et al., 2013). Han et al. also reported decreased corrosion rates with an increase of salt concentration from 0.5 to 20 wt. % (Han et al., 2011). They proposed a model showing that cathodic reactions were decelerated by NaCl but anodic reactions were not significantly affected. Contrary to Han's model (Han et al., 2011), the potentiodynamic sweep analyses by Nešić et al. showed that both cathodic and anodic processes were slowed down by the increase of salt concentration (Fang et al., 2013). In our recent study of Cl− concentration on the corrosion behavior of carbon steel at room temperature, the results suggested that corrosion rate increased with decreasing Cl− concentration (Zeng et al., 2016). Moreover, there was no protective corrosion scale formed at room temperature, and the increasing presence of Cl− resulted in the formation of more porous and non-protective corrosion product films on carbon steel (Liu et al., 2014; Zeng et al., 2016).
Despite the above-mentioned studies, scarce information is available on how temperature affects the cathodic and anodic kinetics individually and how Cl− influences the microstructure of the corrosion scale at various temperatures. In this research, we investigated the effect of salt concentration (0.001–10 wt.%) on the corrosion behavior of carbon steels (C1018 and C1010) in CO2-saturated NaCl solutions at various temperature levels (25 to 80°C). The corrosion rate evolution of C1018 steel was obtained through electrochemical impedance spectroscopy (EIS) and linear polarization resistance (LPR) measurements. The effects of temperature and Cl− concentration on the anodic and cathodic kinetics were investigated separately by potentiodynamic and potentiostatic polarization experiments using microelectrodes. The surface and cross-sectional morphology of the corrosion scale was examined using scanning electron microscope (SEM) equipped with focused ion beam (FIB). The composition of the corrosion products was obtained using a combination of XRD and Raman spectroscopy. Lastly, a new corrosion scale formation mechanism was proposed based on all the results obtained.
Two grades of carbon steels, C1010 and C1018 were used depending on their availability. The nominal chemical composition of the carbon steels has been reported in a previous publication (Zeng et al., 2016). Wire electrodes of alloy C1010 with a diameter of 500 μm (~0.002 cm2 exposed area) were utilized in the polarization (potentiodynamic and potentiostatic) experiments. Rectangular cuboid electrodes with dimensions of 15 × 10 × 6 mm (~6 cm2 exposed area) were cut from a C1018 carbon steel bar and tested under naturally corroding conditions. The preparation and assembly of these electrodes has been given in a previous publication (Zeng et al., 2016). Before each test, the specimen was ground successively with 240, 320, and 600 grit silicon carbide (SiC) abrasive papers, rinsed with acetone, isopropanol, deionized (DI) water (18.2 MΩ·cm, MilliQ DQ-3), and Ar-dried.
The test solutions with concentrations ranging from 0.001, 0.01, 0.1, 1, to 10 wt.% were made from analytical grade NaCl (Fisher Scientific) and DI water. The test solution was pre-purged with research grade CO2 (99.9%, Praxair) for at least 1 h before immersing the specimen, and the test system was continuously purged at a lower flow rate to ensure CO2 saturation throughout the test. The initial solution pH was ~ 4 at room temperature with negligible dependence on NaCl concentration (Zeng et al., 2016). All tests were performed at ambient pressure.
A 200 ml jacketed EuroCell (Gamry) was used as the test vessel. Working electrode was either the epoxy embedded C1010 wire electrode or C1018 rectangular cuboid electrode. A graphite rod (Gamry) was used as counter electrode and saturated calomel electrode (SCE, Pine Research) was connected to the cell externally through a luggin capillary and positioned by the working electrode as closely as possible (~1 mm).
The long-term immersion tests were conducted using the rectangular cuboid C1018 steel electrodes for 100 cycles (1 h/cycle) and each cycle contained sequential measurements of 45-min OCP (Open Circuit Potential), 3-min LPR, 2-min OCP, and 10-min EIS. LPR measurements were conducted by polarizing the electrode from −10 to +10 mV with respect to OCP at a scan rate of 0.125 mV/s. EIS measurements were carried out at OCP with an AC excitation amplitude of 10 mV, and frequency range from 104 to 10−2 Hz.
Anodic and cathodic polarization experiments were performed using the epoxy-embedded C1010 wire electrodes. Before polarization, 1 h OCP measurement was conducted to let the potential of the electrode stabilize. A typical anodic scan started at −30 mV vs. OCP to +1.0 V vs. SCE, while the cathodic scan started at +30 mV vs. OCP to −1.1 V vs. SCE, with a scan rate of 0.167 mV/s. Potentiostatic polarization tests were also conducted at selected potential levels of −0.5 V and −0.8 V vs. SCE using the wire electrodes for 20 h.
The cell temperature was maintained with a circulating water bath (Polyscience) and the effect of temperature was investigated at four levels: 25, 40, 60, and 80°C. All the electrochemical measurements were carried out by using a Solartron Modulab® system.
After long-term immersion, the electrodes were immediately rinsed with DI water and acetone. The surface and cross-sectional morphologies of the corrosion scales were examined by a TESCAN LARA3 field emission SEM coupled with a gallium FIB. The accelerating voltage was 20 kV.
A Rigaku MiniFlexTM II benchtop XRD system equipped with a Cu (Kα) radiation was used for XRD measurements directly from the exposed sample surface. The scans were performed in a 2θ range of 20–80° with a scan speed of 0.02° (2θ)/s.
Raman spectroscopic analysis of the phase composition of the corrosion products was conducted using a Horiba LabRam HR micro Raman spectrometer operated with an air-cooled Nd:YAG laser (532 nm). The laser power (at sample) was approximately 6 mW. The spectra resolution was 4 cm−1 and the accumulation time was 120 s.
The EIS technique was used to determine both polarization resistance and solution resistance. Figures 1A,B show examples of Nyquist and Bode plots of C1018 electrodes in CO2-saturated 1% NaCl solutions maintained at 40 °C. In the first few hours (0~10 h), the Nyquist plots (Figure 1A) exhibit depressed capacitive semicircles at high to medium frequency, inductive semicircles at low frequency, and another capacitive semicircles at even lower frequency (as marked by arrows in Figure 1A). The depressed capacitive semicircles at high to medium frequency are related to the double layer capacitance and charge transfer resistance, while the inductive semicircles at low frequency can be attributed to the adsorption of intermediate corrosion products (Sun et al., 2012), or the relaxation of water-iron species (das Chagas Almeida et al., 2017) on the steel surface. The appearance of this new capacitive semicircle at low frequency is correlated to the formation of initial corrosion product (e.g., FeCO3) on the electrode surface (Sun et al., 2012). This capacitive semicircle gradually disappeared with increasing immersion time, indicating that the initial corrosion product was unable to accumulate in this environment. The corresponding Bode plots (Figure 1B) show two time constants, i.e., a high frequency peak and a low frequency valley. The peak with a maximum phase angle increases and shifts to lower frequency with increasing immersion time, which is usually associated with an increase of double layer capacitance (Sun et al., 2012; Zhao and Chen, 2012). In comparison, Figures 1C,D show examples of Nyquist and Bode plots of C1018 electrodes in CO2-saturated 1% NaCl solutions maintained at higher temperature (80°C). It is observed from the inset of Figure 1C that, in the first 10 h, the shape of Nyquist plots is similar to that of the plots shown in Figure 1A (three semicircles). However, only a high-frequency capacitive semicircle and a low-frequency capacitive semicircle can be found after 30 h. The low-frequency inductive semicircle has disappeared. The corresponding Bode plots show two peaks at both high-frequency and low-frequency ranges. The aperture of phase angles also increases with increasing immersion time, which could be a result of an increased surface coverage leading to a more capacitive surface film (Kinsella et al., 1998; Ortega-Toledo et al., 2011; Sun et al., 2012). The larger diameter of the semi-circle indicates higher corrosion resistance due to the formation of protective corrosion scale at 80°C.
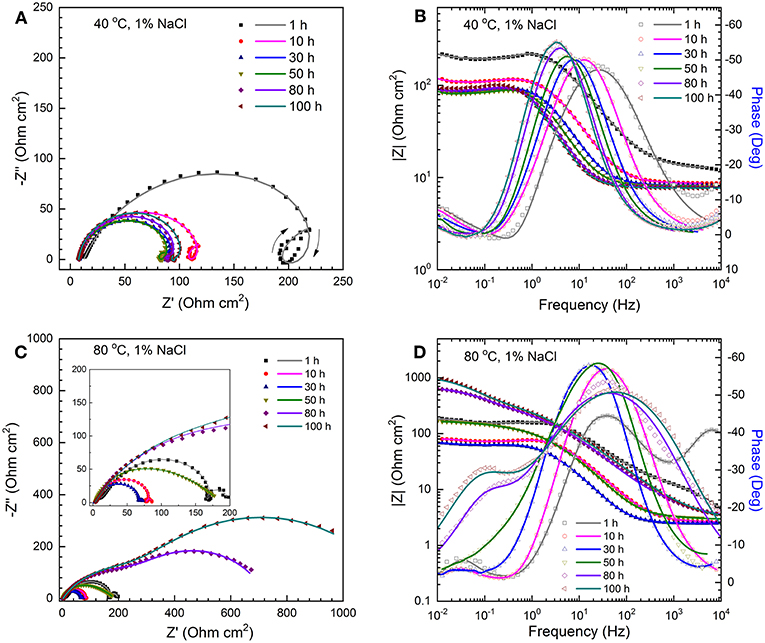
Figure 1. The time-sequenced Nyquist plots (A,C) and corresponding Bode plots (B,D) for the C1018 steel samples tested in CO2-saturated 1% NaCl solutions at 40°C (A,B) and 80°C (C,D). Scatter plots: measured; solid lines: fitted.
In order to provide an insight into the effect of Cl− on the formation of corrosion scales, long-term immersion tests were conducted at 80°C in solutions with various salt concentrations (from 0.001 to 10%). As an example, Figure 2 shows the Nyquist and Bode plots of C1018 steel tested in 0.01% NaCl at 80°C. In the initial stage (< 5 h, Figure 2A), the acquired Nyquist plot shows a capacitive semicircle at high to medium frequency, an inductive loop and a capacitive semicircles at low frequency, similar to those obtained in 1% NaCl at 80°C (Figure 1C). After 30 h, the inductive loop disappears (Figure 2B). Another noticeable change in the shape of the Nyquist plot occurs after 60 h, which is characterized by the appearance of a capacitive semicircle at high frequency (Figure 2B). Then, the diameters of these capacitive semicircles increase with immersion time, indicating the increase of polarization resistance. At 100 h, the two capacitive semicircles in the range of medium to low frequency nearly overlap (Figure 2C). The corresponding Bode plots are shown in Figure 2D. Only a high frequency peak and a low frequency capacitive “semi-peak” can be observed before 60 h. In comparison, three peaks can be clearly seen after 60 h (as marked by arrows in Figure 2D), indicating that corrosion product films with different microstructures may have formed on the steel surface. In terms of the EIS results that are not shown here, those obtained in the 0.001 and 0.1% NaCl solutions at 80°C are similar to those obtained in the 0.01% NaCl (Figure 2), and those from the 10% NaCl solution are similar to those from the 1% NaCl solution (Figures 1C,D). Since the shape of the impedance plots changes noticeably with Cl− concentration, it is reasonable to infer that Cl− may play a critical role in the microstructure of corrosion scale, as discussed in the following sections.
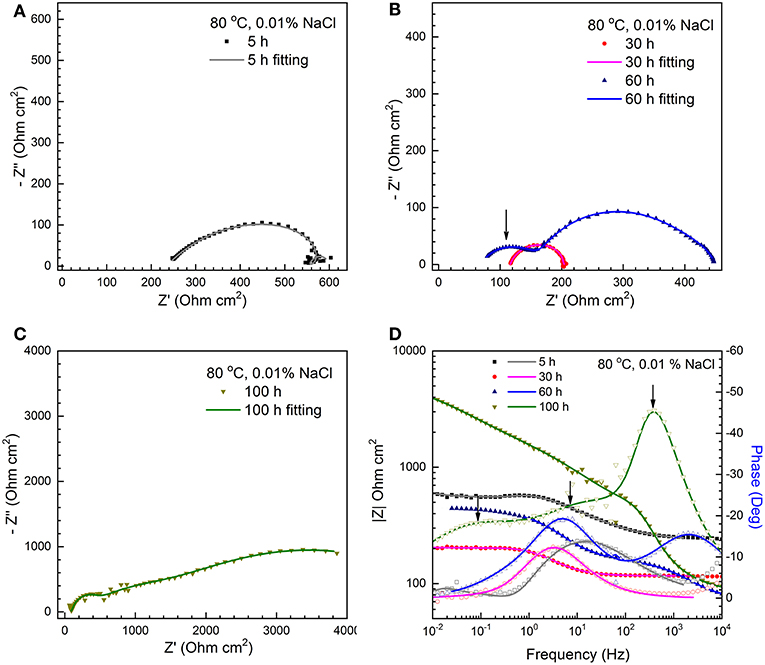
Figure 2. The Nyquist plots (A–C) and corresponding Bode plots (D) for a C1018 sample tested in 0.01% NaCl with CO2 saturation at 80°C (scatter plots: measured; solid lines: fitted).
The EIS results were fitted with different equivalent electrical circuits (ECs) shown in Figure 3 (Zhu et al., 2011; Sun et al., 2012; Wei et al., 2015). These ECs were proposed based on the EIS characteristics and SEM/FIB characterizations. In these ECs, the following elements were considered: solution resistance (Rs), charge transfer resistance (Rt), inductive resistance (RL), constant phase element (CPE) representing the double layer capacitance, and the resistance of corrosion scale/film (Rf).
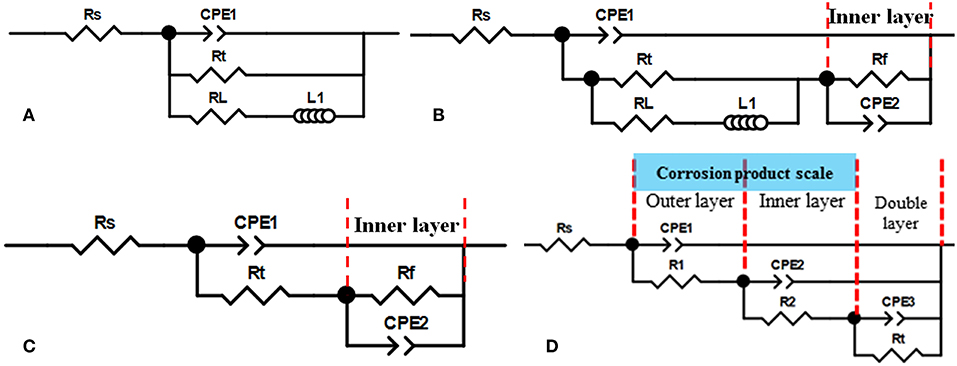
Figure 3. Four equivalent electrical circuits used to fit the EIS curves obtained in different concentration NaCl solutions at different temperature and exposure time. (A) no corrosion scale; (B) initial formation of corrosion scale; (C) complete formation of inner layer; (D) dual-layer corrosion product scale.
The EC in Figure 3A has no Rf element and was used for fitting most of the EIS data obtained at 25°C and 40°C because no stable protective corrosion scale formed under these circumstances. Notice that, at 40°C, initial corrosion product actually formed in the early stage of immersion (< 10 h) but later dissolved. Therefore, an EC containing the Rf element (Figure 3B) was used to analyze the EIS data from the initial stage. At temperature levels of 60 and 80°C, the shape of the obtained EIS spectra varied significantly in different stages of immersion. In general, three stages were identified. In stage I (< 30 h), a protective corrosion scale started to form and partially covered the sample surface, and an EC which includes the elements for this scale (i.e., Rf and CPE2 in Figure 3B) was used for curve fitting. In stage II (30–60 h), it is believed that a uniform corrosion scale (inner layer) completely covered the sample surface and resulted in the disappearance of inductance loops in the EIS spectra. Therefore, a new EC without the RL element (Figure 3C) was employed. In stage III (>60 h), FeCO3 crystals gradually formed an additional layer (outer layer). Since the microstructure of this layer was different from the inner layer (SEM/FIB characterizations), it caused additional semicircles at high frequency in the EIS spectra. Therefore, an EC which has elements for both the inner and outer corrosion product layers was used to fit the EIS data in this case (Figure 3D). The following equations were used to calculate based on different ECs in Figure 3:
The LPR measurements were also conducted to determine the corrosion resistance in conjunction with the EIS measurements. Figure 4A shows the evolution of LPR curves (up to 100 h) of C1018 steel in CO2-saturated 1% NaCl solutions maintained at 40°C. A good linear relationship between polarization (E–Ecorr) and current density is observed. The apparent polarization resistance (), determined by the slope of the LPR curves, gradually decreases with immersion time up to 30 h (marked by an arrow in Figure 4A). After ~ 50 h, the LPR curves overlap, indicating the stabilization of polarization resistance. This result coincides with the finding in a previous work conducted at room temperature (Zeng et al., 2016). In contrast, at 80°C, the slope of the LPR curves decreases initially but starts to increase significantly after 30 h (Figure 4B), and relatively high polarization resistance is found after extended immersion (>80 h). Figure 4C shows the representative LPR results of C1018 steel in the dilute NaCl solution (0.001%) maintained at 80°C. An initial decrease of polarization resistance up to 30 h is followed by a later increase, similar as those shown in Figure 4B. The true polarization resistance () was obtained by subtracting the solution resistance (Rs by EIS results) from the apparent polarization resistance (), and then converted to corrosion rates.
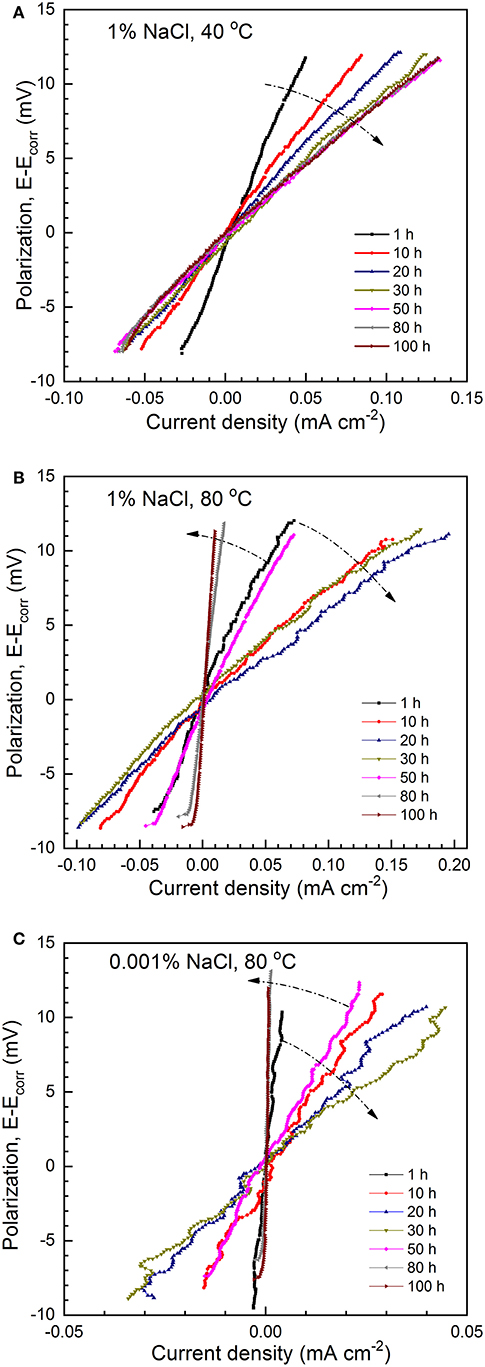
Figure 4. The evolution of LPR curves of C1018 in (A) 1% NaCl, 40°C, (B) 1% NaCl, 80°C, and (C) 0.001% NaCl, 80°C with CO2 saturation.
The evolution of polarization resistance (RP) is compared at different temperature levels in 1% NaCl (Figure 5A) and different salt concentrations at 80°C (Figure 5B). It is evident that the results from EIS () and LPR () agree with each other. The corrosion rates were then determined by Stern-Geary equation, using an average B () value of 21 mV. Detailed explanation is provided in a previous publication (Zeng et al., 2016). Figure 5C shows the effect of temperature on corrosion rate in 1% NaCl solution. As immersion time increases, the corrosion rate gradually increases and reaches steady state around 30 h. The general trend is that corrosion rate increases with rising temperature at the same exposure time. The highest corrosion rate in 1% NaCl at 80 °C appears in the initial stage of the immersion (10–30 h). Corrosion rate does not change with further immersion at 25 and 40°C. However, after ~ 80 h at 60°C and 30 h at 80°C, corrosion rate starts decreasing with longer immersion time, which is more noticeable at 80°C. It is projected that the corrosion rate would keep decreasing at 60°C should testing time be prolonged.
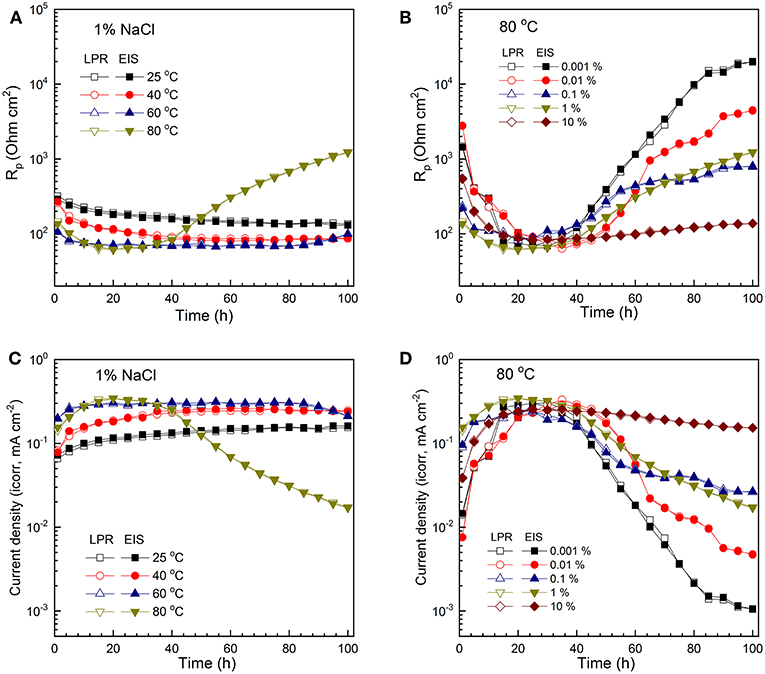
Figure 5. The evolution of Rp (A) and corrosion rate (C) of C1018 steel in 1% NaCl at various temperature levels, showing the effect of temperature; evolution of Rp (B) and corrosion rate (D) of C1018 steel in NaCl solutions maintained at 80°C and with varying NaCl concentration, showing the effect of NaCl concentration.
Figure 5D presents the effect of Cl− concentration on corrosion rate at 80°C. The corrosion rate increases initially with time (0–30 h) at all salt concentrations. At ~30 h, the highest corrosion rate of C1018 steel is reached at the same level (~0.2–0.3 mA/cm2) in different Cl− solutions. After 30 h, corrosion rates start decreasing at all Cl− concentration levels. The general trend is that corrosion rate increases with increasing salt concentration at the same exposure time. The corrosion rate of the sample tested in 0.001% NaCl at 80°C shows the most significant decrease, possibly due to the formation of more compact and FeCO3-rich corrosion scale at high temperature and low Cl− concentration. In comparison, the sample in 10% NaCl solution shows the least decrease in corrosion rate after 30 h. It should be noted that the 30 h critical time may be related to the specific experimental setup used in this work, including the size of the electrode.
Figure 6A presents the XRD pattern of the corrosion product on a C1018 steel sample tested in 1% NaCl at 40°C. The diffraction peaks observed at angles of 44.8° and 65.2° can be ascribed to the Fe substrate (JCPDS NO. 87-0722), while the rest of the peaks with low intensity, are in good agreement with Fe3C (JCPDS NO. 76-1877). Figure 6B shows the XRD pattern obtained from a sample tested in 1% NaCl at 80°C. The main corrosion product identified in this environment is FeCO3 (JCPDS NO. 83-1764) with three main diffraction peaks at 25.0°, 32.3°, and 53.4° corresponding to the (012), (104), and (116) planes of FeCO3, respectively. In addition, Fe2CO3OH (JCPDS NO. 52-0163) as an intermediate corrosion product was also detected.
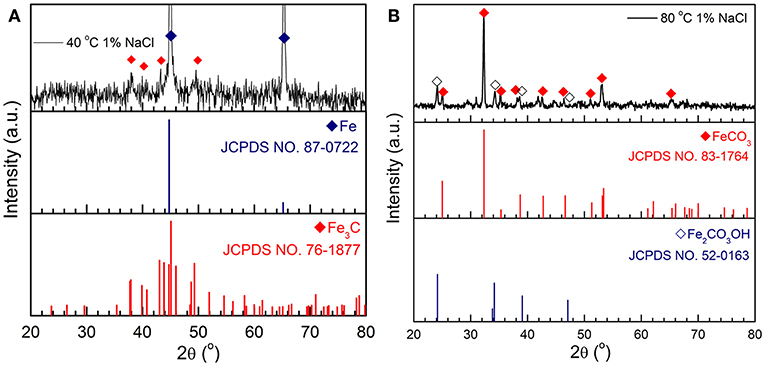
Figure 6. XRD patterns of the corrosion products formed on C1018 steel after 100 h in 1% NaCl at (A) 40 and (B) 80°C.
Figure 7 shows the surface morphology of corrosion scale formed on C1018 steel exposed in CO2-saturated 1% NaCl solution with different temperatures. At 25°C (Figure 7a) and 40°C (Figure 7b), typical morphology of Fe3C (cementite) was observed and no crystalline particles formed on the sample surfaces. In addition, more Fe3C accumulated on the sample tested at 40°C than that from 25°C, which is correlated to the higher corrosion rate observed at higher temperature (40 vs. 25°C). For the C1018 steel samples tested at 60°C (Figure 7c) and 80°C (Figure 7d), the morphologies feature the formation of crystalline particles that are uniformly distributed on the surfaces. Two types of FeCO3 are identified to have formed on the steel exposed at 60 and 80°C, one has a cubic structure and the other is of a planar type. Although the corrosion scales formed at 60 and 80°C are believed to be protective, they still contain pores (arrows indication in Figures 7c,d) that may act as channels for local corrosion to occur. In addition, the size of the cubic FeCO3 crystalline particles formed at 80°C is larger than those formed at 60°C, indicating the growth of FeCO3 is accelerated at higher temperature.
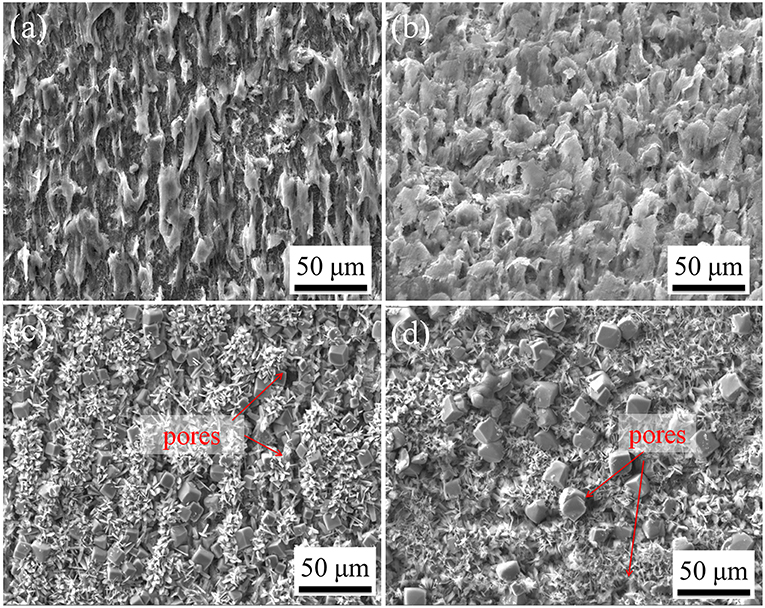
Figure 7. SEM images of C1018 steel sample surfaces after 100 h immersion in 1% NaCl solutions maintained at (a) 25°C, (b) 40°C, (c) 60°C, and (d) 80°C.
Figure 8 provides the corresponding cross-sectional morphologies of the corrosion scales formed on C1018 steel tested in CO2-saturated 1% NaCl solutions with different temperatures. The Fe3C layer on the sample exposed at 40°C (Figure 8b) is thicker and more dense than that on the sample exposed at 25°C (Figure 8a). Notice that a relatively large portion of the Fe3C scale on the sample from 40°C has a lamellar structure, as shown in the inset in Figure 8b. Figures 8c,d show the morphologies of the corrosion scales formed at 60 and 80°C, which contain both compact regions and porous regions.
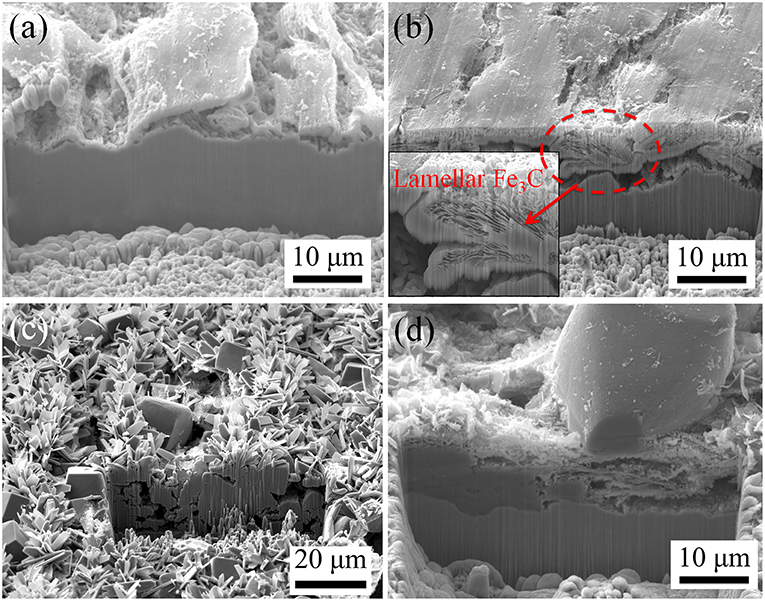
Figure 8. Cross-sectional morphologies of the corrosion product layers on C1018 samples tested in 1% NaCl solutions maintained at (a) 25°C, (b) 40°C, (c) 60°C, and (d) 80°C.
In an attempt to understand the role of Cl− in the corrosion scale formation, the surface and cross-section of the C1018 steel samples exposed in 0.01 and 10% NaCl solutions at 80°C were further investigated by SEM/FIB and compared. Figure 9a shows typical SEM images of the sample tested in 0.01% NaCl solution at 80°C, which shows a uniform corrosion product scale without large pores. A high-magnification SEM image (inset in Figure 9a) reveals that the corrosion scale is mainly composed of thin flakes with some cubic particles embedded in it. In comparison, the sample tested in 10% NaCl solution at 80°C has more cubic particles on its surface (Figure 9b). Notice that this corrosion scale also has many small holes and cracks underneath the cubic particles. Figures 9c,d show the corresponding cross-sectional images of the two samples. It can be clearly seen that the corrosion product films are composed of both outer layer and inner layer. Moreover, the inner layer on the sample tested in 0.01% NaCl (Figure 9c) is much more compact than its counterpart in 10% NaCl (Figure 9d). In addition, the sample tested in 0.01% NaCl solution has larger planar-shaped crystals and smaller cubic crystals than the sample tested in 10% NaCl. A high-magnification SEM image for the marked region in Figure 9d is shown in Figure 9e, which indicates that the inner layer of the scale consists of lamellar-structured Fe3C and FeCO3 particles, as confirmed by Raman spectra in Figure 9f. The spectrum from the outer layer (crystal particle layer) has main peaks at 183, 281, 728, 1084, and 1721 cm−1, which can be as assigned to FeCO3 (Li et al., 2015, 2016; Wei et al., 2015). Besides the strong peaks for FeCO3, the spectrum obtained from the inner layer also shows a weak peak at 950 cm−1, possibly due to Fe3C. Based on the microstructure shown in Figure 9e, it is reasonable to hypothesize that, at relatively high Cl− concentration, lamellar-structured Fe3C crosslinked with the FeCO3 particles in the initial stage of corrosion to form the porous inner layer, while FeCO3 crystals (both of planar and cubic structures) precipitated from the solution forming the outer layer on the top of the Fe3C/FeCO3 inner layer. In contrast, the much more compact inner layer in low Cl− solution significantly reduces corrosion and the formation of FeCO3 crystals (cubic) in the outer layer.
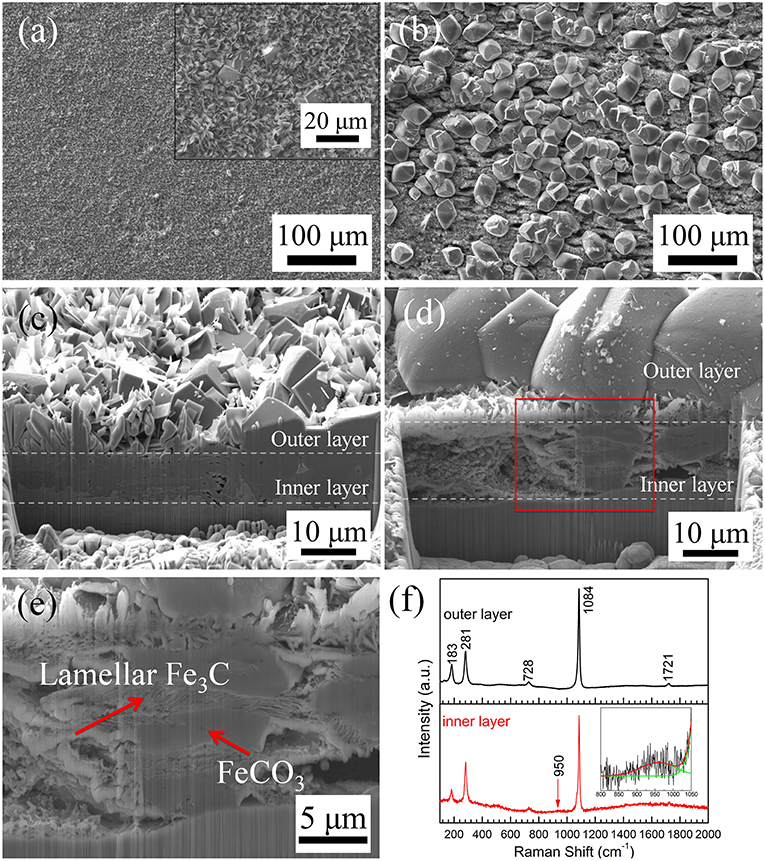
Figure 9. (a) Surface and (c) cross-sectional morphologies of C1018 steel sample tested in 0.01% NaCl at 80°C; (b) surface and (d,e) cross-sectional morphology of C1018 steel sample tested in 10% NaCl solution at 80°C; (f) Raman spectra obtained from the inner and outer corrosion product layers.
The microstructural characterization of the corrosion scale agrees with the corrosion rate analysis shown in Figure 5. At relatively low temperature (i.e., 25 and 40°C), the corrosion product layers mainly consist of Fe3C with minimal presence of FeCO3 and are thus porous and non-protective. As a result, the corrosion rate remains high even after 100 h. The accumulation of more Fe3C at 40°C compared to 25°C, may further enhance the corrosion rates by serving as strong cathode. In contrast, thick and compact (at least locally) corrosion scales formed on C1018 steel surface exposed at 60 and 80°C, which resulted in the decrease of overall corrosion rate. The high temperature facilitated the precipitation of FeCO3 particles especially at 80°C, which shows larger crystal size and higher density as compared to those formed at 60°C (Figures 7, 8). Lastly, at 80°C, the presence of higher Cl− concentration interferes with the formation of a compact inner layer and the protectiveness decreases as a result, which suggests the detrimental effect of Cl− and explains the higher corrosion rate observed (Figure 5D).
Potentiodynamic and potentiostatic polarization experiments were performed using microelectrodes to further understand the effect of temperature and chloride concentration on the anodic and cathodic kinetics of carbon steel in CO2-saturated NaCl solutions.
As shown in Figure 10, increasing Cl− concentration slightly decreases the Ecorr values at all three temperature levels: (A) 40°C, (B) 60°C, and (C) 80°C, but significantly increases the anodic current density, indicating an acceleration of anodic process by Cl−. In contrast, at a fixed Cl− concentration, the anodic current density increases only slightly as the temperature increases from 25 to 80°C (Figures 10D–F). Therefore, within the temperature-salt concentration matrix studied here, the anodic process is regarded as Cl−-driven instead of temperature-driven, or the anodic reaction is more sensitive to Cl− concentration than temperature.
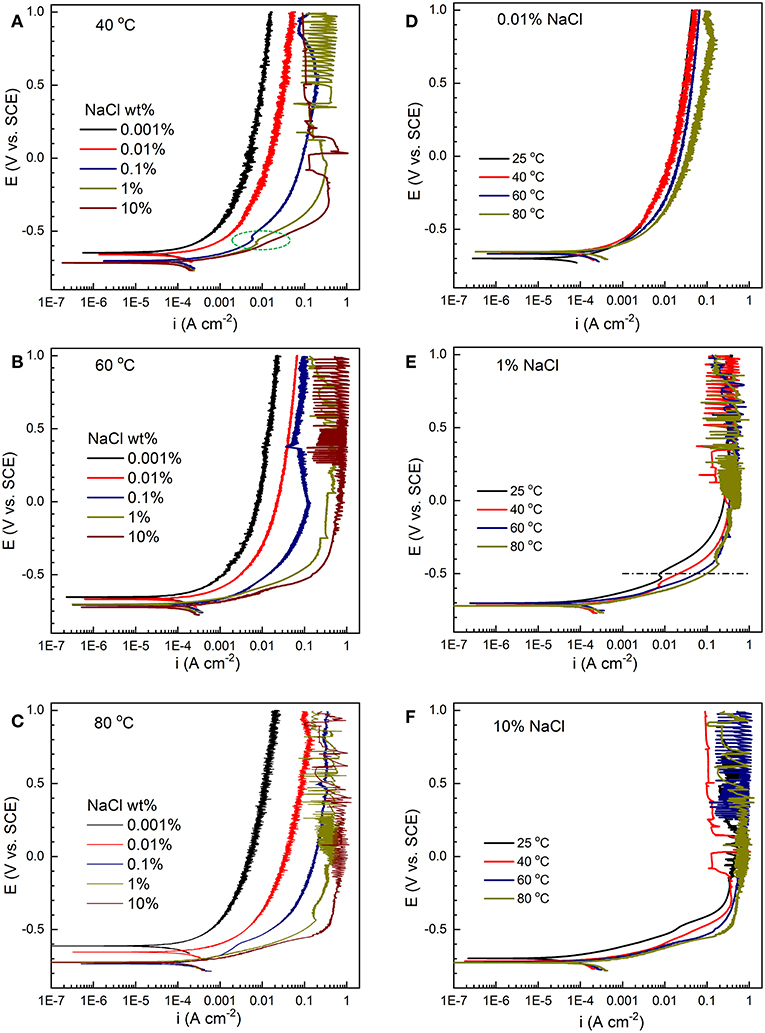
Figure 10. Anodic polarization curves of C1010 steel with varying salt concentration (0.001% to 10%) at constant temperature levels, (A) 40°C, (B) 60°C, and (C) 80°C. Anodic polarization curves with varying temperature (25 to 80°C) at constant salt concentration levels, (D) 0.01%, (E) 1%, and (F) 10%.
The anodic current density (ia) can be expressed by the following relationship:
To determine the dependence of ia on [Cl−] (i.e., exponent α), current density values at selected constant potential (Figures 10A–C) were plotted against chloride concentration at the same temperature (results not shown). A good linear relationship was found for all temperature levels (40°C, 60°C, and 80°C), and the slopes are approximately 0.5 at the same applied potential (e.g., −0.5 V/SCE), i.e.,
Our previous study on the effect of Cl− concentration on the anodic kinetics at 25°C showed that Cl− accelerated the anodic reaction with a reaction order of 0.5 (Zeng et al., 2016). At room temperature, the anodic kinetics is dominated by chloride adsorption in concentrated chloride solutions (e.g., 10%) and hydroxyl adsorption in dilute solutions (e.g., 0.001%) (McCafferty and Hackerman, 1972; Burstein and Davies, 1980). The catalytic role of Cl− in the anodic dissolution of iron has been proposed to form intermediate adsorbed species, such as (McCafferty and Hackerman, 1972) and (Wei et al., 2015). In contrast, the formation of dominates in dilute solutions (McCafferty and Hackerman, 1972). A comparison between Figure 10D (0.01%) and Figure 10F (10%) clearly indicates two different anodic behaviors. A change in the anodic behavior can be observed from the polarization curves in 0.1% NaCl solution (green circle in Figure 10A), which may suggest the transition from predominant hydroxyl adsorption to chloride adsorption. Lastly, it has been reported that CO2 does not appear to act directly over a free iron surface and there is no competition between water and CO2 (das Chagas Almeida et al., 2017). The role of HCO (by dissolved CO2) can be hypothesized as follows (Burstein and Davies, 1980).
The potentiodynamic polarization results can be approximately dissected into two regions: low applied potential region under charge transfer control and high applied potential under mass transport control. Large current oscillation (one order of magnitude) is observed in the mass transport region, more noticeable at higher temperature and higher salt concentrations. Potentiostatic polarization experiments were then performed to study this oscillating behavior at selected applied potential (Eapplied = −0.5 V/SCE) in 1% NaCl solution with various temperatures and the results are shown in Figure 11. It is observed that the current density gradually decreases throughout the 20-h period at 40°C. In contrast, the current density profiles show periodic oscillations for the samples tested at 60 and 80°C, which feature sharp current peaks and drops. The oscillation amplitude (peak to valley) decreases throughout the 20-h test and upper limit shows similar trend as 40°C. It is hypothesized that the periodic current oscillation is attributed to the precipitation and re-dissolution of corrosion products. The drop of current is due to accumulation of the corrosion product film leading to mass transport control, whereas the rise of current is probably related to the breakdown of film with subsequent active iron dissolution processes (Ma et al., 2003). In addition, the oscillation occurs more frequently at 80°C than 60°C, which may be attributed to faster precipitation rate and lower solubility of FeCO3 at higher temperature (Bénézeth et al., 2009).
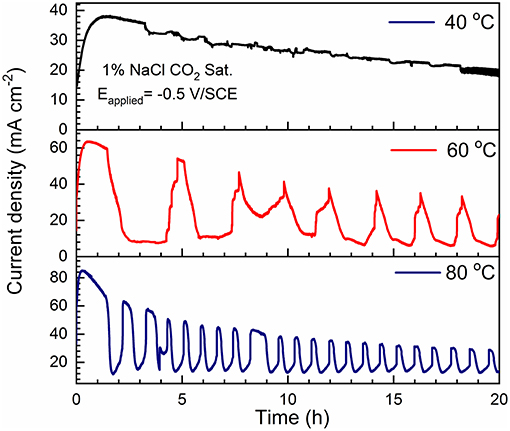
Figure 11. Potentiostatic polarization curves (Eapplied = −0.5 V/SCE) of C1010 steel tested in 1% NaCl with CO2 saturation for 20 h at different temperature levels, i.e., 40, 60, and 80°C.
As shown in Figures 12A-C, the cathodic polarization curves show a nearly vertical line in the low overpotential range, indicating that the cathodic process is under mass-transport control, probably due to H+ and/or H2CO3 reduction (Heuer and Stubbins, 1999; Wu et al., 2004). At more negative potential (below −0.9 V/SCE), water reduction becomes the dominant process (Bonnel et al., 1983; Ogundele and White, 1986). The diffusion-limited cathodic current density is in the range of 0.2–0.6 mA/cm2 (e.g., at −0.8 V/SCE). It increases slightly with lower Cl− concentration (Zeng et al., 2016), but overlap is observed. In contrast, the cathodic current density increases significantly with increasing temperature at the constant Cl− concentration, as demonstrated in Figures 12D-F. This suggests that the cathodic reaction is more sensitive to temperature than Cl− concentration, opposite to the anodic kinetics. In addition, as temperature increases, the cathodic kinetics gradually changes from mass-transport control to mixed charge-transfer/mass transport control.
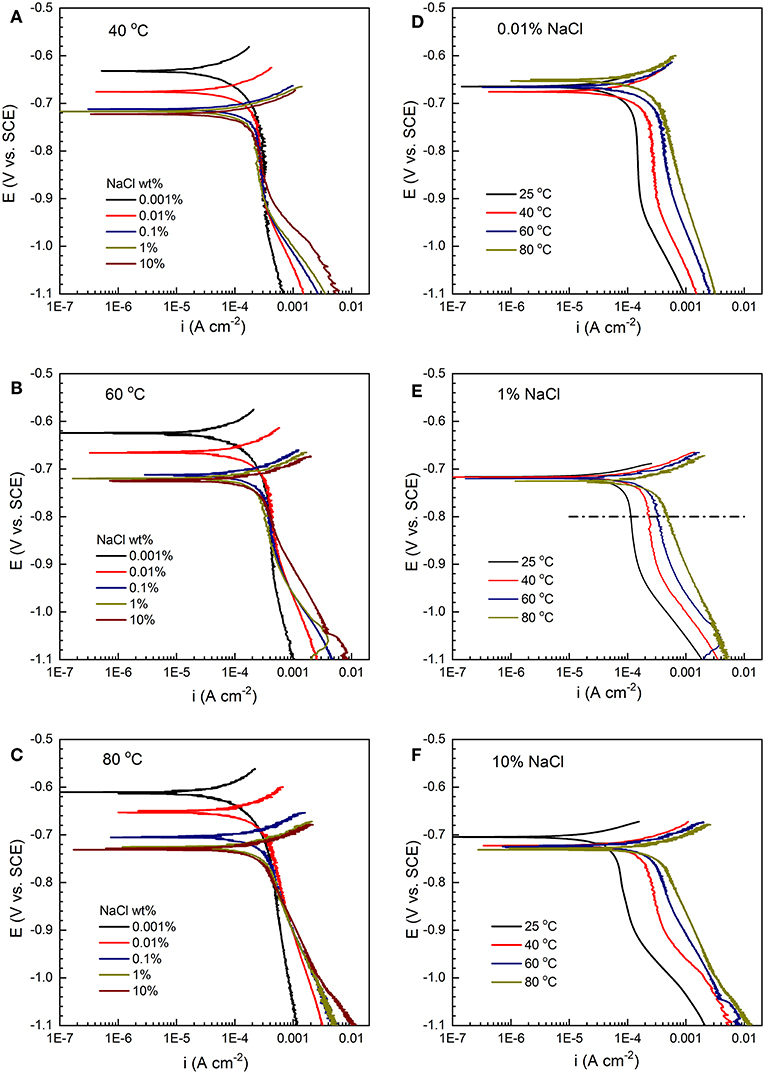
Figure 12. Cathodic polarization curves of C1010 steel with varying salt concentration (0.001% to 10%) at constant temperature levels, (A) 40°C, (B) 60°C, and (C) 80°C. Cathodic polarization curves with varying temperature (25 to 80°C) at constant salt concentration levels, (D) 0.01%, (E) 1%, and (F) 10%.
To better understand the dependence of cathodic kinetics on temperature, potentiostatic polarization experiments were conducted at −0.8 V/SCE in 1% NaCl solutions for 20 h at various temperatures. The result is shown in Figure 13. Activation energy ( was calculated according to Equation 8 (Tang et al., 2003; Shukla and Quraishi, 2009; Porcayo-Calderon et al., 2015).
When the stabilized cathodic current densities are plotted vs. temperature (inset in Figure 13), the slope yields an activation energy value of 20 kJ mol−1, close to that obtained from the potentiodynamic polarization results at the same potential (i.e., 22 kJ mol−1 in Figure 12E).
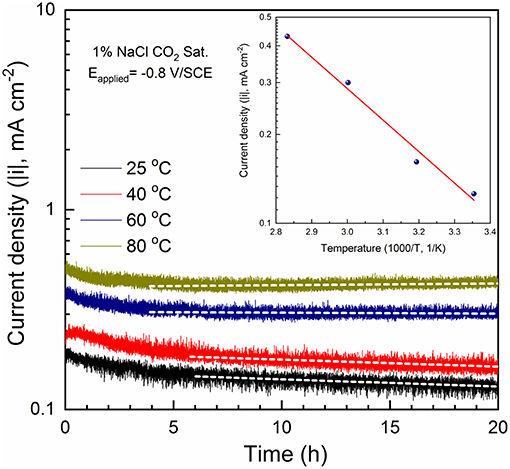
Figure 13. Potentiostatic polarization curves (Eapplied = −0.8 V/SCE) of C1010 steel tested in 1% NaCl with CO2 saturation at different temperature levels, i.e., 25, 40, 60, and 80°C. Inset: a plot of i as a function of 1/T for the calculation of cathodic activation energy of 20 kJ mol−1.
When dissolved in water, CO2 is hydrated to form carbonic acid, which can be further dissociated to provide hydrogen ions for the cathodic reduction reaction.
The cathodic reactions on carbon steel in CO2-saturated NaCl solutions have been well-documented by Nešić and co-workers (Nesic et al., 1996), through the possible reduction routes of H+, H2CO3, and/or . It is suggested that the cathodic limiting current density is strongly related to the CO2 concentration in the solution (Nesic et al., 1995). It has been confirmed that corrosion rate strongly depends on the solubility of CO2 (Nesic et al., 1995; Shadley et al., 1998; Liu et al., 2014). Our results also indicate that the peak corrosion rates under freely corroding condition (Figure 5D) match the cathodic limiting current densities (Figure 12), on the order of 0.3 mA/cm2.
To evaluate the variation of dissolved CO2 concentration as a function of temperature and NaCl concentration, calculation was performed using the OLI® stream analyzer and the result is shown in Figure 14. At constant temperature levels, the concentration of dissolved CO2 decreases slightly as the NaCl concentration increases from 0.001 to 1%, but a relatively large drop upon further increase to 10%. Moreover, the decreasing trend becomes less significant as temperature increases from 25 to 80°C (i.e., less salt concentration effect was observed at higher temperature). This offers one possible explanation for the initial increase (30 h) of corrosion rates to approximately the same level at 80°C in all NaCl concentrations (Figure 5D). In addition, Figure 14 also shows the significant decreases of CO2 solubility with the increase of temperature from 25 to 80°C, more noticeable in more diluted solution. In contrast, cathodic polarization results suggest that the diffusion limiting current density increases with temperature at all NaCl concentrations (Figure 12D–F), and corrosion rate increases with temperature in the early stage of immersion (Figure 5C). This clearly indicates that CO2 solubility cannot be used as the sole indicator for cathodic kinetics (Schmitt, 2015). Increasing temperature may accelerate both electrochemical and chemical reactions by promoting transfer process of reactive species or increasing reactive rate coefficient (Yin et al., 2009; Porcayo-Calderon et al., 2015), which dominates over the decreasing solubility of CO2.
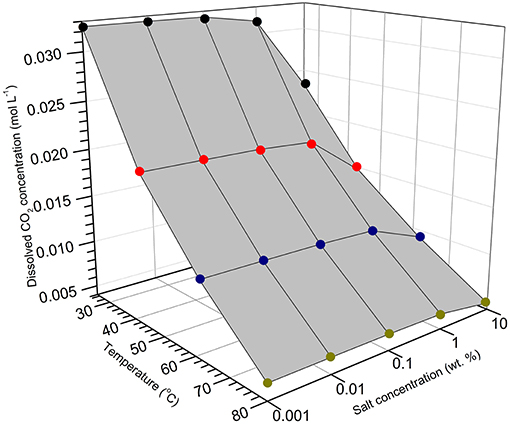
Figure 14. OLI® calculation of CO2 solubility as a function of NaCl salt concentration and temperature.
According to the above-mentioned results and discussion, a possible mechanism for the formation of corrosion scale on carbon steel in CO2-saturated NaCl solutions is proposed and illustrated in Figure 15. Initially, corrosion occurs uniformly in small areas (anodic) with the formation of H2 bubbles on top of the Fe3C phase (cathodic) (Figure 15A). In this stage, EIS spectra indicate similar corrosion behavior, regardless of salt concentration and temperature. In general, the apparent corrosion rates increase with rising temperature (cathodic kinetics) and salt concentration (anodic kinetics), and gradually increase with time. The dissolution of Fe surrounding the Fe3C phase exposes more cementite on the sample surface (Figure 15B). At the same time, the enrichment and local supersaturation of Fe2+ ions at the metal surface facilitates the formation of early corrosion products, for example FeCO3 (Figure 15C), as verified by additional semicircles at low frequency in the EIS spectra shown in Figure 1. At lower temperature (≤ 40°C), the initially formed FeCO3 is unstable, and later dissolves due to its high solubility at low temperatures. This results in Fe3C accumulation on the surface (Figure 15D), as confirmed by SEM images in Figure 7 and XRD results in Figure 6. In contrast, FeCO3 is more stable and begins to accumulate on the steel surface at higher temperature (≥60°C), because the corrosion rate increases but the solubility of FeCO3 decreases with increasing temperature (Bénézeth et al., 2009).
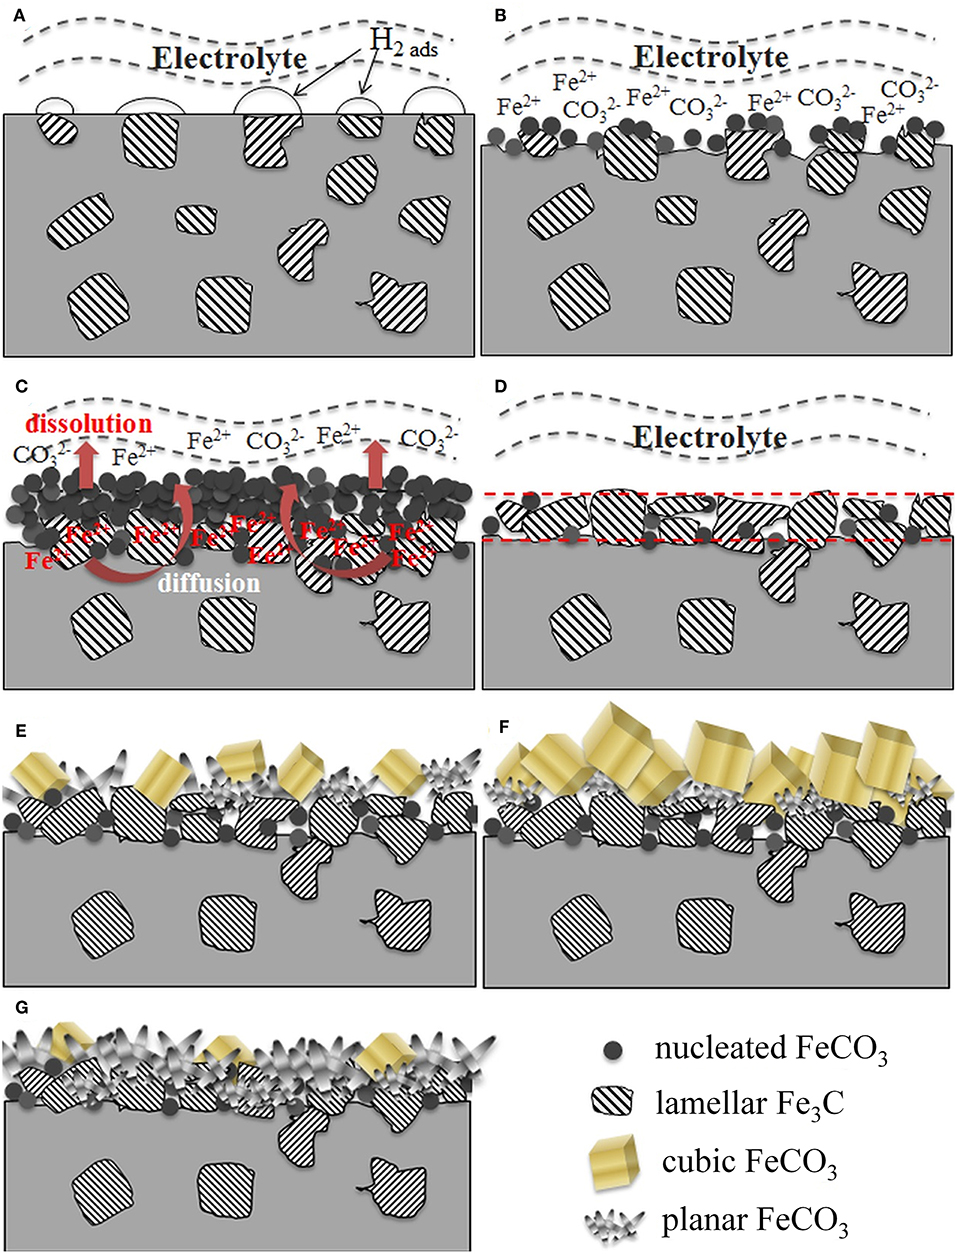
Figure 15. Schematic diagrams showing the formation of corrosion scales on carbon steel immersed in CO2-saturated NaCl solutions as a function of time, temperature and salt concentration. (A) initial corrosion upon immersion; (B) early FeCO3 nucleation; (C) accumulation of FeCO3; (D) accumulation of Fe3C; (E) dual-layer formation; (F) growth of cubic FeCO3 in outer layer; (G) compact inner layer with planar FeCO3.
It is generally believed that the growth of the FeCO3 film occurs in two steps: nucleation and crystal growth. The growth behavior of crystals is mainly determined by the internal structure of a given crystal (Liu et al., 2012). The carbonate ions (CO) exhibits planar structure and the bond angle of O-C-O is 120° (Zhong et al., 2013). When Fe2+ and CO combine to form FeCO3 crystal nuclei (stage I), iron and oxygen atoms tend to form Fe-O octahedron between the different planes of CO. As a result, the germinated FeCO3 prefers to grow in lamellar structure and finally matures to cubic crystal particles according to the Fe2+/CO concentration (Zhu et al., 2006; Liu et al., 2012; Zhong et al., 2013). In this case, a protective film (inner layer) consisting of a combination of Fe3C and FeCO3 (planar and crystal structure) is formed (stage II). However, the microstructure of the corrosion scale depends on both temperature and Cl− concentration. In high salt concentration (1% NaCl and above), the Cl−-accelerated anodic reaction (Figure 10) leads to the formation of more porous inner layer (Figure 9). As a result, the apparent corrosion rate remains high (Figure 5). The higher Fe2+ concentration, at least locally, facilitates the formation of cubic form of corrosion products on top of the inner layer (Figure 15E). The cubic form of corrosion product is likely a result of dissolution-precipitation process. At the same salt concentration, higher temperature promotes the further nucleation and growth of crystal particles, and therefore, more crystal particles with larger size form (Figure 15F). In low salt concentration (0.001 to 0.1%) at 80°C, however, a majority of the steel surface is covered with planar FeCO3 instead of cubic crystal particles (Figure 15G). This phenomenon can be probably attributed to the relatively low Cl− concentrations and slower anodic kinetics (Figure 10). Assuming similar availability of CO, lower Fe2+ in dilute NaCl solutions controls the precipitation process and small crystals form uniformly which are further anchored with Fe3C to create a more compact layer. This form of corrosion product may be a direct reaction by HCO with surface absorbed species (e.g., FeOHads) through Equation 7. This layer significantly increases the corrosion resistance of carbon steel and slows down further corrosion (Figure 5). Therefore, the steel surfaces immersed in dilute NaCl solutions are covered with planar-structured FeCO3 crystals with only a small amount of cubic crystals embedded in them, because the low concentration of Fe2+ in the bulk solution limits the growth of FeCO3 to large cubic size. In summary, although Cl− has no effect on the composition of the corrosion product, its presence and concentration significantly affect the morphology and microstructure of the corrosion scale and therefore the apparent corrosion rate.
1) In CO2-saturated NaCl solutions, the corrosion rate of carbon steel increases with temperature during the initial stage of immersion. However, corrosion rate shows a decreasing trend over time at higher temperature (i.e., 60 and 80°C). This is attributed to the formation of protective corrosion scales (i.e., FeCO3), which occurs faster at higher temperature.
2) At constant temperature, the initial corrosion rate of carbon steel increases with salt concentration. After an apex corrosion rate is reached, which is independent of the salt concentration, corrosion rate shows a decreasing trend over time and the magnitude is inversely proportional to the salt concentration.
3) At temperature higher than 60°C, FeCO3 is the dominant corrosion product, with the possible existence of Fe2CO3OH. The cross-sectional profile of the corrosion scale shows a dual layer structure with a surface layer consisting of bulk FeCO3 crystals (planar and cubic) and an inner layer of Fe3C anchored with FeCO3. The thickness and compactness of FeCO3 layer increase from 60 to 80°C. In contrast, the corrosion product formed on carbon steel is mainly Fe3C at temperature below 60°C.
4) Cl− has no effect on the composition of the corrosion product; however, it affects the microstructure of the corrosion scale. In dilute NaCl solutions (0.001%, 0.01%, 0.1%), the nucleation of FeCO3 is fast and occurs uniformly, resulting in a compact inner layer of FeCO3 and an outer layer of crosslinked FeCO3 flakes. However, in concentrated NaCl solutions (1 and 10 %), the adsorption of Cl− may impede the nucleation of FeCO3, resulting in the growth of large FeCO3 crystals on top of the porous inner layer.
5) The salt concentration has more noticeable effect on the anodic kinetics than temperature. The competition between Cl− and OH− affects the anodic reaction rate and more importantly, the protectiveness of the corrosion scale. Periodic precipitation and dissolution of the corrosion scale is inferred to occur at higher temperature and higher applied potential.
6) The cathodic reaction, which is under diffusion control and/or mixed control, is more sensitive to temperature than salt concentration. Theoretical calculation indicates the solubility of CO2 decreases with increasing temperature, which suggests the enhanced cathodic kinetics at higher temperature is due to other factors.
SL and ZZ conducted electrochemical tests, data analyses and characterizations, and also drafted the manuscript. MH assisted in performing electrochemical tests and LS helped with manuscript preparation. HC supervised the overall research work and finalized the manuscript.
The authors declare that the research was conducted in the absence of any commercial or financial relationships that could be construed as a potential conflict of interest.
We acknowledge the funding support from the University of Akron.
Bénézeth, P., Dandurand, J. L., and Harrichoury, J. C. (2009). Solubility product of siderite (FeCO3) as a function of temperature (25–250°C). Chem. Geol. 265, 3–12. doi: 10.1016/j.chemgeo.2009.03.015
Bonnel, A., Dabosi, F., Deslouis, C., Duprat, M., Keddam, M., and Tribollet, B. (1983). Corrosion study of a carbon steel in neutral chloride solutions by impedance techniques. J. Electrochem. Soc. 130, 753–761. doi: 10.1149/1.2119798
Burstein, G. T., and Davies, D. H. (1980). The effects of anions on the behaviour of scratched iron electrodes in aqueous solutions. Corrosion Sci. 20, 1143–1155. doi: 10.1016/0010-938X(80)90145-6
das Chagas Almeida, T., Bandeira, M. C. E., Moreira, R. M., and Mattos, O. R. (2017). New insights on the role of CO2 in the mechanism of carbon steel corrosion. Corrosion Sci. 120, 239–250. doi: 10.1016/j.corsci.2017.02.016
de Waard, C., Lotz, U., and Milliams, D. E. (1991). Predicitive model for CO2 corrosion engineering in wet natural gas pipelines. Corrosion 47, 976–985. doi: 10.5006/1.3585212
Fang, H., Brown, B., and Nesic, S. (2013). Sodium chloride concentration effects on general CO2 corrosion mechanisms. Corrosion 69, 297–302. doi: 10.5006/0222
Han, J., Carey, J. W., and Zhang, J. (2011). Effect of sodium chloride on corrosion of mild steel in CO2-saturated brines. J. Appl. Electrochem. 41, 741–749. doi: 10.1007/s10800-011-0290-3
Han, J., Young, D., Colijn, H., Tripathi, A., and Nesic, S. (2009). Chemistry and structure of the passive film on mild steel in CO2 corrosion environments. Ind. Eng. Chem. Res. 48, 6296–6302. doi: 10.1021/ie801819y
Heuer, J. K., and Stubbins, J. F. (1999). An XPS characterization of FeCO3 films from CO2 corrosion. Corrosion Sci. 41, 1231–1243. doi: 10.1016/S0010-938X(98)00180-2
Jasinski, R. (1987). Corrosion of N80-Type steel by CO2/water mixtures. Corrosion 43, 214–218. doi: 10.5006/1.3583139
Kinsella, B., Tan, Y. J., and Bailey, S. (1998). Electrochemical impedance spectroscopy and surface characterization techniques to study carbon dioxide corrosion product scales. Corrosion 54, 835–842. doi: 10.5006/1.3284803
Li, S., George, R. D., and Hihara, L. H. (2016). Corrosion analysis and characteristics of discarded military munitions in ocean waters. Corrosion Sci. 102, 36–43. doi: 10.1016/j.corsci.2015.09.014
Li, S., Kealoha, J., and Hihara, L. H. (2015). “Corrosion of low-carbon steel in seawater/biodiesel mixtures – a study related to the corrosion of fuel tanks in ships,” in Corrosion 2015 Conference and Expo (Houston, TX: NACE International).
Linter, B. R., and Burstein, G. T. (1999). Reactions of pipeline steels in carbon dioxide solutions. Corrosion Sci. 41, 117–139. doi: 10.1016/S0010-938X(98)00104-8
Liu, F. G., Du, M., Zhang, J., and Qiu, M. (2009). Electrochemical behavior of Q235 steel in saltwater saturated with carbon dioxide based on new imidazoline derivative inhibitor. Corrosion Sci. 51, 102–109. doi: 10.1016/j.corsci.2008.09.036
Liu, G., Deng, Q., Wang, H., Ng, D. H. L., Kong, M., Cai, W., et al. (2012). Micro/nanostructured [small alpha]-Fe2O3 spheres: synthesis, characterization, and structurally enhanced visible-light photocatalytic activity. J. Mater. Chem. 22, 9704–9713. doi: 10.1039/C2JM31586F
Liu, Q. Y., Mao, L. J., and Zhou, S. W. (2014). Effects of chloride content on CO2 corrosion of carbon steel in simulated oil and gas well environments. Corrosion Sci. 84, 165–171. doi: 10.1016/j.corsci.2014.03.025
Liu, X., Okafor, P. C., and Zheng, Y. G. (2009a). The inhibition of CO2 corrosion of N80 mild steel in single liquid phase and liquid/particle two-phase flow by aminoethyl imidazoline derivatives. Corrosion Sci. 51, 744–751. doi: 10.1016/j.corsci.2008.12.024
Liu, X., Zheng, Y. G., and Okafor, P. C. (2009b). Carbon dioxide corrosion inhibition of N80 carbon steel in single liquid phase and liquid/particle two-phase flow by hydroxyethyl imidazoline derivatives. Mater. Corrosion 60, 507–513. doi: 10.1002/maco.200805133
Ma, H. Y., Yang, C., Li, G. Y., Guo, W. J., Chen, S. H., and Luo, J. L. (2003). Influence of nitrate and chloride ions on the corrosion of iron. Corrosion 59, 1112–1119. doi: 10.5006/1.3277530
Mao, X., Liu, X., and Revie, R. W. (1994). Pitting corrosion of pipeline steel in dilute bicarbonate solution with chloride ions. Corrosion 50, 651–657. doi: 10.5006/1.3293540
McCafferty, E., and Hackerman, N. (1972). Kinetics of iron corrosion in concentrated acidic chloride solutions. J. Electrochem. Soc. 119, 999–1009. doi: 10.1149/1.2404426
Nesic, S., Postlethwaite, J., and Olsen, S. (1996). An electrochemical model for prediction of corrosion of mild steel in aqueous carbon dioxide solutions. Corrosion 52, 280–294. doi: 10.5006/1.3293640
Nesic, S., Pots, B., Postlethwaite, J., and Thevenot, N. (1995). Superposition of diffusion and chemical reaction controlled limiting currents-application to CO2 corrosion. J. Corrosion Sci. Eng. 1.
Ogundele, G. I., and White, W. E. (1986). Some observations on corrosion of carbon steel in aqueous environments containing carbon dioxide. Corrosion 42, 71–78. doi: 10.5006/1.3584888
Ortega-Sotelo, D. M., Gonzalez-Rodriguez, J. G., Neri-Flores, M. A., Casales, M., Martinez, L., and Martinez-Villafañe, A. (2011). CO2 corrosion inhibition of X-70 pipeline steel by carboxyamido imidazoline. J. Solid State Electrochem. 15, 1997–2004. doi: 10.1007/s10008-010-1226-2
Ortega-Toledo, D. M., Gonzalez-Rodriguez, J. G., Casales, M., Martinez, L., and Martinez-Villafañe, A. (2011). CO2 corrosion inhibition of X-120 pipeline steel by a modified imidazoline under flow conditions. Corrosion Sci. 53, 3780–3787. doi: 10.1016/j.corsci.2011.07.028
Porcayo-Calderon, J., Martínez de la Escalera, L. M., Canto, J., Casales-Diaz, M., and Salinas-Bravo, V. M. (2015). Effect of the temperature on the CO2-corrosion of Ni3Al. Int. J. Electrochem. Sci. 10, 3136–3151.
Schmitt, G. (2015). “Fundamental aspects of CO2 metal loss corrosion. part ii: influence of different parameters on CO2 corrosion mechanism,” in Corrosion 2015 Conference and Expo (Houston, TX: NACE International).
Shadley, J. R., Shirazi, S. A., Dayalan, E., and Rybicki, E. F. (1998). Prediction of erosion-corrosion penetration rate in a carbon dioxide environment with sand. Corrosion 54, 972–978. doi: 10.5006/1.3284819
Shukla, S. K., and Quraishi, M. A. (2009). 4-Substituted anilinomethylpropionate: new and efficient corrosion inhibitors for mild steel in hydrochloric acid solution. Corrosion Sci. 51, 1990–1997. doi: 10.1016/j.corsci.2009.05.020
Sun, J. B., Zhang, G. A., Liu, W., and Lu, M. X. (2012). The formation mechanism of corrosion scale and electrochemical characteristic of low alloy steel in carbon dioxide-saturated solution. Corrosion Sci. 57, 131–138. doi: 10.1016/j.corsci.2011.12.025
Tang, L., Mu, G., and Liu, G. (2003). The effect of neutral red on the corrosion inhibition of cold rolled steel in 1.0 M hydrochloric acid. Corrosion Sci. 45, 2251–2262. doi: 10.1016/S0010-938X(03)00046-5
Videm, K., and Dugstad, A. (1987). “Effect of flow rate, pH, Fe2+ concentration and steel quality on the CO2 corrosion of carbon steel,” in Corrosion/87 Conference and Expo (Houston, TX: NACE International).
Wei, L., Pang, X., Liu, C., and Gao, K. (2015). Formation mechanism and protective property of corrosion product scale on X70 steel under supercritical CO2 environment. Corrosion Sci. 100, 404–420. doi: 10.1016/j.corsci.2015.08.016
Wu, S. L., Cui, Z. D., He, F., Bai, Z. Q., Zhu, S. L., and Yang, X. J. (2004). Characterization of the surface film formed from carbon dioxide corrosion on N80 steel. Mater. Lett. 58, 1076–1081. doi: 10.1016/j.matlet.2003.08.020
Yin, Z. F., Feng, Y. R., Zhao, W. Z., Bai, Z. Q., and Lin, G. F. (2009). Effect of temperature on CO2 corrosion of carbon steel. Surf. Interface Anal. 41, 517–523. doi: 10.1002/sia.3057
Zeng, Z., Lillard, R. S., and Cong, H. (2016). Effect of salt concentration on the corrosion behavior of carbon steel in CO2 environment. Corrosion 72, 805–823. doi: 10.5006/1910
Zhang, G. A., Lu, M. X., Qiu, Y. B., Guo, X. P., and Chen, Z. Y. (2012). The relationship between the formation process of corrosion scales and the electrochemical mechanism of carbon steel in high pressure CO2-containing formation water. J. Electrochem. Soc. 159, C393–C402. doi: 10.1149/2.030209jes
Zhao, J., and Chen, G. (2012). The synergistic inhibition effect of oleic-based imidazoline and sodium benzoate on mild steel corrosion in a CO2-saturated brine solution. Electrochim. Acta 69, 247–255. doi: 10.1016/j.electacta.2012.02.101
Zhong, Y., Su, L., Yang, M., Wei, J., and Zhou, Z. (2013). Rambutan-like FeCO3 hollow microspheres: facile preparation and superior lithium storage performances. ACS Appl. Mater. Interfaces 5, 11212–11217. doi: 10.1021/am403453r
Zhu, L.-P., Xiao, H.-M., Liu, X.-M., and Fu, S.-Y. (2006). Template-free synthesis and characterization of novel 3D urchin-like [small alpha]-Fe2O3 superstructures. J. Mater. Chem. 16, 1794–1797. doi: 10.1039/B604378J
Keywords: mild steel, EIS, CO2 corrosion, chloride effect, temperature effect, corrosion kinetics, corrosion scale
Citation: Li S, Zeng Z, Harris MA, Sánchez LJ and Cong H (2019) CO2 Corrosion of Low Carbon Steel Under the Joint Effects of Time-Temperature-Salt Concentration. Front. Mater. 6:10. doi: 10.3389/fmats.2019.00010
Received: 23 November 2018; Accepted: 25 January 2019;
Published: 13 February 2019.
Edited by:
Guang-Ling Song, Xiamen University, ChinaReviewed by:
Changdong Gu, Zhejiang University, ChinaCopyright © 2019 Li, Zeng, Harris, Sánchez and Cong. This is an open-access article distributed under the terms of the Creative Commons Attribution License (CC BY). The use, distribution or reproduction in other forums is permitted, provided the original author(s) and the copyright owner(s) are credited and that the original publication in this journal is cited, in accordance with accepted academic practice. No use, distribution or reproduction is permitted which does not comply with these terms.
*Correspondence: Hongbo Cong, aGNvbmdAdWFrcm9uLmVkdQ==
Disclaimer: All claims expressed in this article are solely those of the authors and do not necessarily represent those of their affiliated organizations, or those of the publisher, the editors and the reviewers. Any product that may be evaluated in this article or claim that may be made by its manufacturer is not guaranteed or endorsed by the publisher.
Research integrity at Frontiers
Learn more about the work of our research integrity team to safeguard the quality of each article we publish.