
94% of researchers rate our articles as excellent or good
Learn more about the work of our research integrity team to safeguard the quality of each article we publish.
Find out more
ORIGINAL RESEARCH article
Front. Mater. , 24 March 2017
Sec. Ceramics and Glass
Volume 4 - 2017 | https://doi.org/10.3389/fmats.2017.00006
This article is part of the Research Topic Ultrastrong Glasses: Improving Mechanical Properties of Disordered Solids through Topo-Chemical Engineering View all 14 articles
An observed minimum in the critical crack initiation load at Poisson’s ratio (ν) of 0.21–0.22 in Na2O–TiO2–SiO2 glasses was investigated. Vickers indentation was used to examine hardness and average cracking length, fracture toughness was measured through the single-edge pre-cracked beam method, and volumes of densification and shear flow around indents were measured using atomic force microscopy. Relations between the critical crack initiation load and hardness, average crack length, fracture toughness, and the volume fractions of densification and shear flow were studied. No correlations were observed between hardness, average crack length, or fracture toughness with the critical crack initiation load. A link between the minimum in crack initiation load and a change in deformation mechanisms (densification versus shear flow) was observed.
Understanding structure–property relationships in glasses remains a distinct challenge in designing new glasses for specific applications (Mauro et al., 2014). In the pursuit of developing ultra-strong glasses, an improved understanding of what structural characteristics and properties contribute to either hindering or promoting crack initiation and propagation in glasses is of great importance (Wondraczek et al., 2011). Lewandowski et al. (2005) observed an interesting correlation between fracture energy and Poisson’s ratio (ν) in oxide and metallic glasses, where a brittle-to-ductile transition occurs at ν = 0.31–0.32. Rouxel et al. (2014) developed indentation cracking maps to predict driving forces for cracking in glasses. They found a critical value at ν ≈ 0.21–0.23 where the indentation stress field was greatly reduced during indentation, as well as a transition from easily damaged to highly resilient glasses at ν = 0.33 (Rouxel, 2015).
In a recent study by the authors, an unexpected trend was observed, where the critical load (Pc) for initiating cracks at the corners of Vickers indentations went through a minimum as the Poisson’s ratio was increased from 0.18 to 0.24 in Na2O–TiO2–SiO2 glasses (Scannell et al., 2015), with the minimum occurring at ν = 0.21–0.22. This behavior is not anticipated by the driving forces maps developed by Rouxel et al. (2014), which predict that the driving forces for radial cracking should increase with the Poisson’s ratio across the examined range (0.18–0.24). While driving forces for median cracks should decrease over this range, this minimum is not observed in other glass systems (Kato et al., 2010; Sellappan et al., 2013), and thus driving forces alone cannot explain the cracking behavior. The purpose of this study is to investigate this behavior further. Different hypothesis are examined in the present work to explain this minimum of Pc. It is likely that as the glass response changes from primarily deforming through densification to shear flow, an intermediate region could exist where the competing deformation mechanisms result in an increase in residual stresses around the indent, consistent with the bell-shaped curve for the residual stress intensity factor as a function of ν [ξ in Fig. 5 in Rouxel (2015)]. Since both the deformation mechanism and fracture toughness are dependent on the composition, it is possible that a change in fracture toughness could compensate for changes in the driving forces for cracking. It is also possible that as the driving forces for radial and lateral cracks increase and those for median and conical cracks decrease with increasing ν, more energy could be dissipated through the formation of more and longer radial cracks. To investigate these possibilities, Na2O–TiO2–SiO2 glasses of the same compositions in Scannell et al. (2015) were examined. The hardness and average crack length were investigated through Vickers indentation, the fracture toughness was measured through the single-edge pre-cracked beam method (SEPB), and the volume fractions of shear flow and densification around Vickers indents were measured using atomic force microscopy (AFM). A structural model was proposed to explain the minimum in crack initiation load and a change in deformation mechanisms (densification versus shear flow) under indentation.
This work follows on our previous work. For a more detailed discussion of glass synthesis, sample preparation, and indentation experiments, please refer to Scannell et al. (2015). A brief summary of the previous work is provided here, with further experiments described in detail.
Glasses with compositions of (x)Na2O–(y)TiO2–(1 − x − y)SiO2, where x = 10, 15, 20, and 25 and y = 4, 7, and 10 mol%, were synthesized through a traditional melt-quench method. Powders were melted at 1,500°C, poured at 1,700°C, and annealed for 1 h at 600°C. Samples were prepared by cutting with a diamond saw, grinding with Al2O3 papers, and polished to an optical finish with a CeO2 slurry. The elastic moduli were measured using Brillouin light scattering (Scannell et al., 2016). A summary of the glass compositions examined and their mechanical properties is seen in Table 1.

Table 1. Elastic moduli of Na2O–TiO2–SiO2 glasses measured through Brillouin light scattering and density measured through the Archimedes method (Scannell et al., 2016).
For Vickers indentation experiments, samples of 10 mm × 10 mm × 4 mm were prepared with two parallel, optically polished surfaces. Ten indents were made at 49, 9.8, 4.9, 2.9, 1, and 0.5 N each. Indents were imaged optically or using an SEM, depending on their size. For each indent, the number of cracks originating from the corners of the Vickers indent was counted, and an exponential fit of load versus number of cracks was used to find the critical loads to initiate two or four cracks. The crack lengths and indent diagonals were measured under an optical microscope. Vickers hardness and the average crack length were calculated for each load.
To determine whether the presence of water affected the trend observed in the crack initiation load, 10 Vickers indents were made on a sample of each composition at 9.8, 4.9, 2.9, 2.0, and 0.5 N in a nitrogen atmosphere. The number of cracks around each indent was counted 15 min after indentation, with the samples kept in the nitrogen atmosphere continuously. Additionally, three samples, namely, 10 Na2O–7 TiO2–83 SiO2, 15 Na2O–7 TiO2–78 SiO2, and 25 Na2O–7 TiO2–68 SiO2, were soaked in toluene to remove water present in the surface of the glass and then indented in a nitrogen atmosphere. With increasing Na2O content, the load decreases from 10 to 15 Na2O, increases slightly from 15 to 20 Na2O, and then increases significantly between 20 and 25 Na2O. This behavior matches the previously observed behavior in indentations made in air (Scannell et al., 2015).
Densification and shear flow under the Vickers indents were examined by making 0.5 N Vickers indents on samples with dimensions of approximately 5 mm × 5 mm × 1 mm with parallel, optically polished surfaces. A 0.5 N load was chosen to still have a relatively large indent while mostly avoiding cracking in all samples. Ten indents were made on a sample of each composition, and the indentation profiles were mapped using an AFM. The samples were then annealed at 0.9 Tg (K) for 1 h, and the indentation profiles were mapped again. Volume of the pileup above the glass surface and volume of the indentation below the surface were calculated from the indentation profiles using Gwyddion (Necas and Klapetek, 2012) for both pre- and post-annealing measurements. The volumes of permanent deformation that occurred through densification and through shear flow were calculated by Eqs 1 and 2, respectively,
where Vd is the densified volume, Vs is the volume deformed through shear flow, V− is the volume of the indent before (i) and after (a) annealing, and V+ is the pileup volume (see Figure 1). Further discussion on this type of analysis has been done by Yoshida et al. (2007) and Sellappan et al. (2013). An important distinction between the shear volume calculated here and that calculated by Sellappan et al. is that the shear volume here includes all volume deformed through shear, both upward resulting in pileup and downward resulting in residual stresses, while Sellappan et al. only included the shear flow upward that contributed toward pileup. The Na2O–TiO2–SiO2 system appears particularly susceptible to shear flow downward with negligible amounts of pileup around indents prior to annealing, similar to some of the indent profiles observed by Kato et al. (2011). Thus, only a portion of the shear volume reported here contributes toward relaxing the deformed volume, while the remainder contributes toward residual stresses.
Fracture toughness of glasses was measured through the SEPB method (Nose and Fujii, 1988) for four glasses with 4 mol% TiO2 and 10, 15, 20, and 25 mol% Na2O. For SEPB experiments, samples were prepared as 30 mm × 4 mm × 3 mm bars. All four sides of the bars were polished to an optical finish, with the opposite sides polished to be parallel to within ≤50 μm. The ends were polished to an optical finish so that it was possible to see through the bar to observe the pre-crack growth. To make the initiation of the pre-cracks more reliable, a series of 9.8 N Vickers indentations were made in a line along the middle of the bottom face perpendicular to the length direction. Indentations were at a load where radial–median cracks regularly occurred with a minimum of other forms of cracking (lateral/conical/chipping). Indents were spaced approximately 30–40 μm apart.
The sample was placed between two tungsten carbide bars, the bottom of which had a gap in the middle (Figure 2). This gap was aligned with the line of indents so that when a compressive stress was applied a crack would grow stably at the indentations. A Lloyd tester was used to load the sample, moving at 0.2 mm/min until 10 N was reached, then at 0.1 mm/min up to 200 N, and finally at 0.05 mm/min until the loading was manually stopped. By looking through the polished end of the bar using a camera, it was possible to observe the pre-crack growth. Loading was halted when the pre-crack had grown horizontally across the entire bottom surface of the sample and vertically was 20–40% of the height of the bar (~1–1.5 mm).
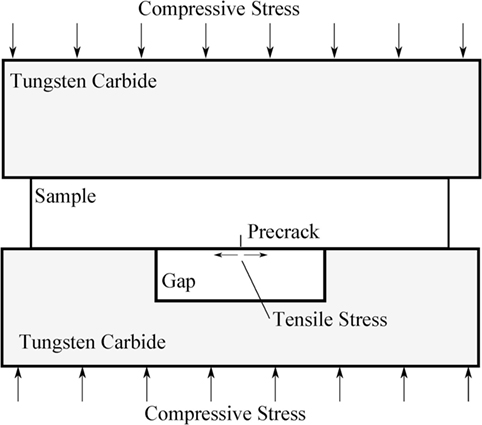
Figure 2. Schematic of the experimental setup used to generate a pre-crack in a glass bar for single-edge pre-cracked beam method test.
The fracture toughness of the pre-cracked bar was measured through a three-point bend test. Deflection and load were recorded every 0.05 s. Fracture toughness was calculated using Eq. 3:
where Y is a geometric factor dependent on the a/W ratio for 4 ≤ L/W ≤ 8 (Srawley, 1976), P is the maximum load, B is the width, W is the height, L is the loaded span (20 mm), a is the pre-crack length, and KIC is the fracture toughness.
The brittleness of the glass samples were calculated following the work of Sehgal and Ito (1999) using Eq. 4:
where C is the crack length, P is the indentation load, a is the indentation diagonal, and the geometric factor γ = 2.39 N1/4/μm1/2. Brittleness was calculated using average values for crack length and indentation size at 2.94, 4.9, 9.8, and 49 N loads.
Experimental error for all measurements is given as the SD of measured values. Vickers hardness was measured 10 times at each load for each composition, average crack lengths are of all measured cracks for that load/composition, with a maximum of 40 cracks being averaged, densification and shear flow volumes were measured at 10 indents for each composition, and fracture toughness was measured 4–8 times at each composition. Some fracture toughness measurements were excluded based on a variety of criteria, which will be discussed in more detail in the following section.
The hardness of Na2O–TiO2–SiO2 glasses versus Poisson’s ratio is shown in Figure 3. These data were presented previously in a tabular form with hardness versus composition (Scannell et al., 2015). The 4.9 N loads are of particular interest because that is where four radial/median cracks are initiated at the corners of the Vickers indents consistently, for all compositions, without the generation of significant lateral or conical cracking. Scatter in hardness measurements was quite large, but a weak trend of decreasing hardness with Poisson’s ratio is observed. This trend mainly follows the increasing Na2O content, which depolymerizes the network and reduces the stiffness of the network (Table 1), with changes in TiO2 not showing a clear trend in how it changes hardness.
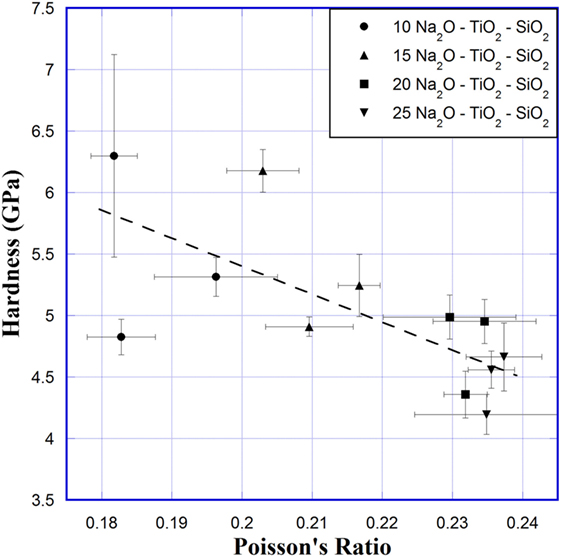
Figure 3. Hardness versus Poisson’s ratio for Na2O–TiO2–SiO2 glasses. Hardness at 4.9 N load is shown. Error bars represent SD across 10 measurements for hardness and 5 measurements of each composition for Poisson’s ratio. Line is a guide for the eyes.
Figure 4 shows the log of average crack length of radial/median cracks originating from the corners of Vickers indents at 2.9, 4.9, 9.8, and 49 N. Log of crack length increases linearly with increasing Poisson’s ratio. A few glasses, at ν = 0.183, 0.196, and 0.235, have much lower observed crack lengths at 2.9 and 4.9 N. It is difficult to tell if these extremely small average crack lengths are representative. These glasses are the most resistant to crack initiation, and particularly at 2.9 N many of the indents had no visible cracking. It is possible for these glasses that cracks that formed did not exit the surface completely. It should be noted that the error bars were not calculated on a log scale, so the error bar above each point is smaller than that below the point.
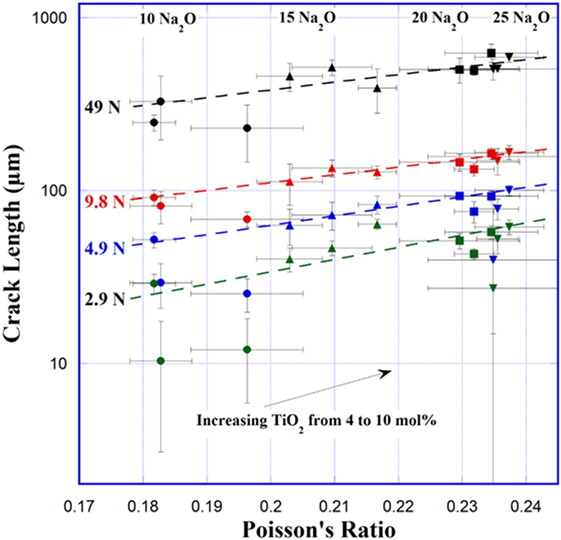
Figure 4. Average crack length at the corners of Vickers indents versus Poisson’s ratio. Error bars represent the SD across all cracks measured at each load. Lines are guides for the eyes.
Fracture toughness of Na2O–TiO2–SiO2 bars is plotted versus Poisson’s ratio in Figure 5A. Samples with 4 mol% TiO2 and 10, 15, 20, and 25 Na2O were measured. The fracture toughness appears to decrease slightly with increasing Poisson’s ratio; however, the decrease is significantly lower than the experimental error. Error bars represent the SD across three to six measurements made at each composition. Figure 5B shows the load versus displacement curve for SEPB measurements, which exhibit an unstable crack extension. Unstable crack extension is seen by the sudden failure in the load versus displacement curve and has been shown to provide more reliable fracture toughness measurements (To et al., 2016). A large variation in the maximum load and deflection of samples is seen in Figure 5B. This variation corresponds to difference in the length of the pre-crack. While most measurements were fairly consistent, values of fracture toughness were found to deviate significantly if the pre-crack was smaller than ~20% or greater than 80% of the sample bar height, or if the pre-crack did not form perpendicular to the bar length, or if the length to height ratio, L/W, was not between 4 and 8. Samples that fell into these categories were not included in the values presented in Figure 5A.
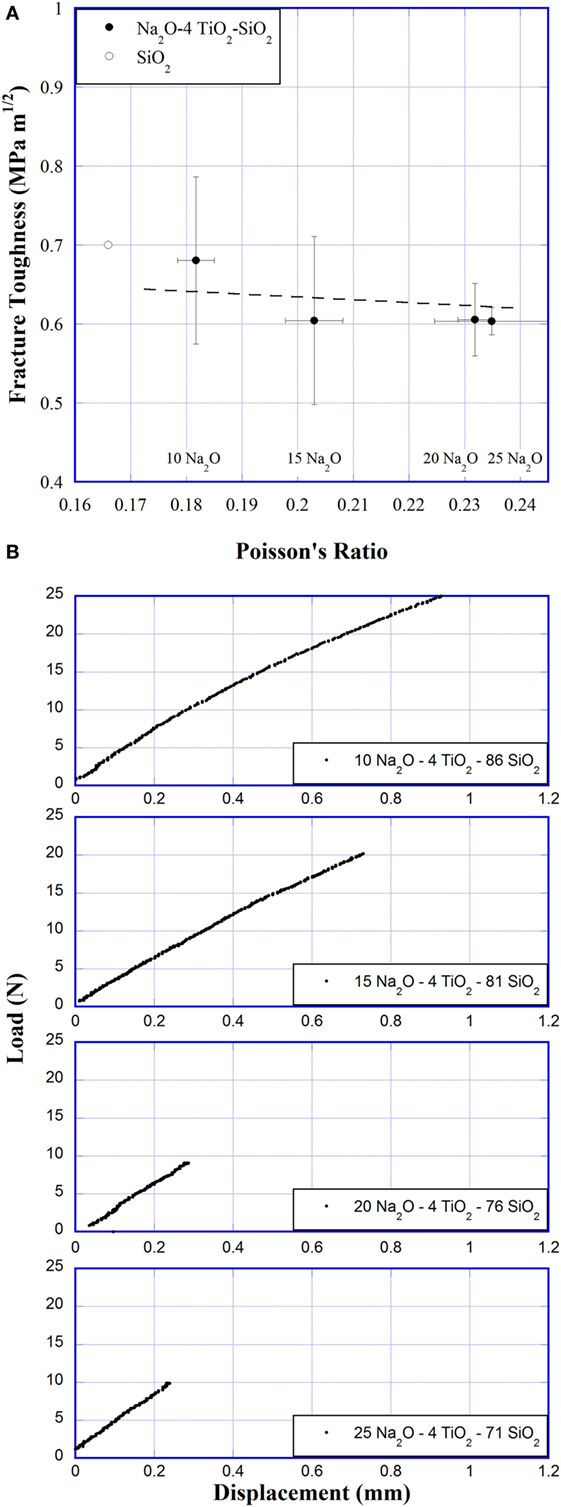
Figure 5. (A) Fracture toughness versus Poisson’s ratio. SiO2 fracture toughness was taken from literature (Sehgal and Ito, 1999; Sellappan et al., 2013). Line is added for a guide to the eyes. (B) Representative load versus displacement curves of single-edge pre-cracked beam method experiments.
Results of the AFM indentation recovery experiments are shown in Figures 6A,B. The densification and shear volumes were calculated using Eqs 1 and 2, and the deformation volume fractions are defined as the densification volume (Vd) and the shear volume (Vs) divided by the indent volume before annealing , respectively. The volume assigned to shear flow increases slowly with Poisson’s ratio between 0.18 and 0.23, from 4.5 to 6.4 μm3. At ν = 0.237, there is a large jump in sheared volume to 12.9 μm3. The densification volume also increases slowly with Poisson’s ratio between 0.18 and 0.23, from 13.2 to 16.5 μm3. Then the densification volume decreases rapidly between 0.23 and 0.24. However, while the magnitude of the deformation volumes changed, the relative fractions of densified volume and shear volume remain almost constant until ν = 0.237, where the shear and densified volume fractions almost switch in relative magnitude.
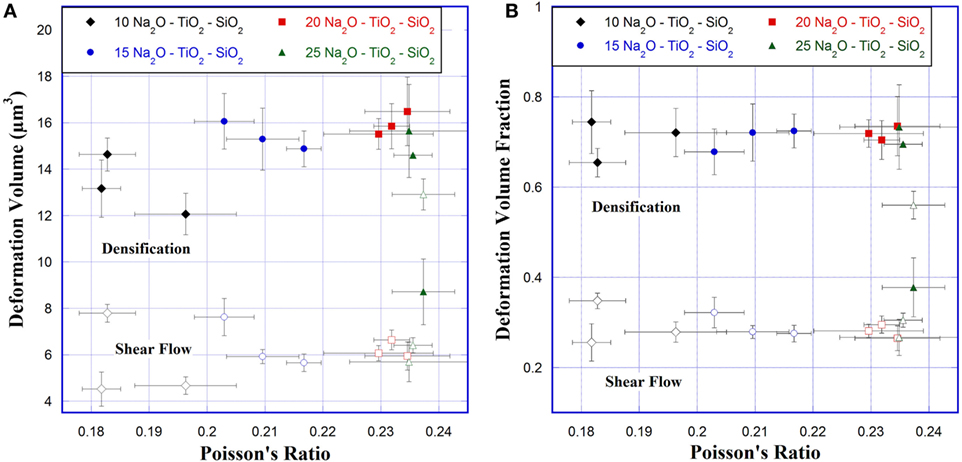
Figure 6. (A) Densification and shear volumes and (B) densification and shear volume fractions for 0.5 N Vickers indents versus Poisson’s ratio. Solid symbols correspond to densification and open symbols to shear flow.
Atomic force microscopy images of Vickers indents in 10 Na2O–7 TiO2–83 SiO2 (ν = 0.183), 15 Na2O–7 TiO2–78 SiO2 (ν = 0.210), 20 Na2O–4 TiO2–76 SiO2 (ν = 0.232), and 25 Na2O–10 TiO2–65 SiO2 (ν = 0.237) glass before and after annealing can be seen in Figure 7. Pileup around the indents is minimal before annealing but becomes large after annealing, especially in the first three glasses. Recovered volume can also be seen in a decreased depth of the indent and along the indent sides. The corners of the indents show relatively little change before and after annealing. The volume recovered after annealing at the bottom of the indent, along the sides, and the increased pileup are the volume deformed through densification. The remaining indent volume was deformed through shear flow. A larger sheared volume can be clearly seen in 25 Na2O–10 TiO2–65 SiO2 (ν = 0.237) glass. As is visible from the relatively little pileup before annealing, most of the volume deformed through shear flow was pushed downward. This volume would contribute to residual stresses around the indent. It should also be noted that the last 0.5–1 µm of the Vickers indenter tip is blunted, which is still within the manufacturer specifications. According to studies by Gross (2012) and Yoshida et al. (2012), the effectively blunter tip should promote an increased amount of densification, lower residual stress, and higher radial surface stress. It could have an impact on the magnitude of the densification and shear flow measured through AFM and annealing experiments but should not change any overall trends observed.
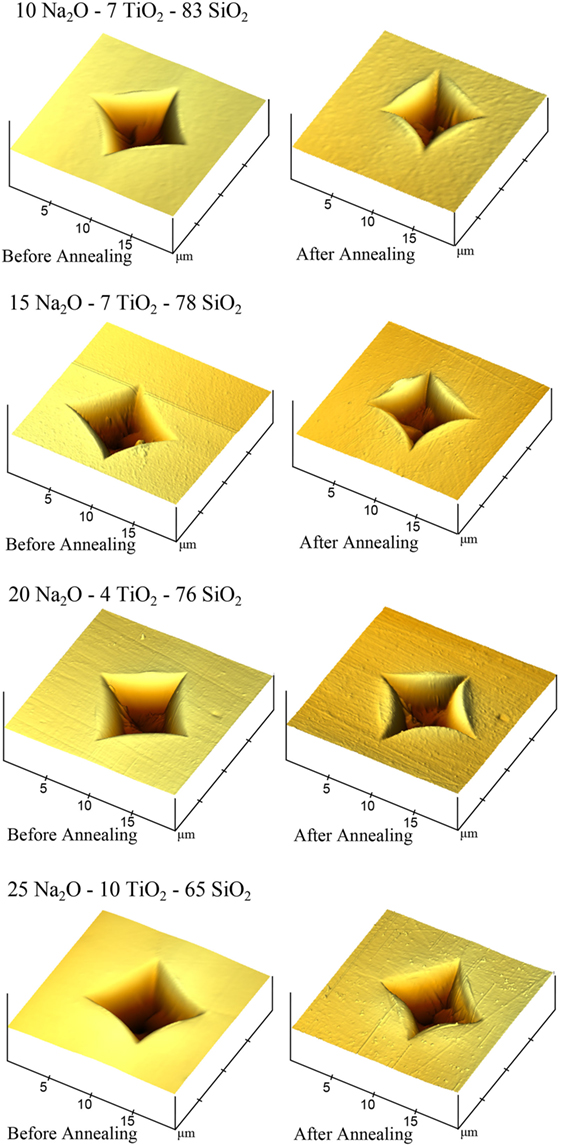
Figure 7. Atomic force microscopy (AFM) images of 10 Na2O–7 TiO2–83 SiO2 (ν = 0.183), 15 Na2O–7 TiO2–78 SiO2 (ν = 0.210), 20 Na2O–4 TiO2–76 SiO2 (ν = 0.232), and 25 Na2O–10 TiO2–65 SiO2 (ν = 0.237) glass before and after annealing. AFM image dimensions are 20 μm × 20 μm × 0.5 μm at a 45° angle.
From our previous study (Scannell et al., 2015), it was observed that the ratio of Young’s modulus to hardness (E/H) increased with increasing Poisson’s ratio, suggesting that driving forces for radial and lateral cracks should be larger at higher ν (Yoshida et al., 2007). Additionally, the fraction of energy that was irreversible in the indentation process was found to increase from ν = 0.18 to 0.22 then to decrease slightly with ν (Scannell et al., 2015). A greater fraction of irreversible energy used to generate the indent could indicate several things: there is an increase in the ability of the glass to deform (either through densification or shear flow), an increase in the amount of energy used for the generation of cracks around the indent, and/or an increase in the residual stresses around the indent. Possible explanations for this minimum in the critical crack initiation load will be discussed with regard to the data presented here and in literature.
The decrease in hardness (Figure 3) with increasing Poisson’s ratio indicates that the size of the indentation is increasing. This hardness change corresponds to the increase in the Na2O content in the glass, with no consistent change observed between different TiO2 contents. A decrease in hardness with increasing Na2O content, and therefore Poisson’s ratio, is expected as Na2O depolymerizes the glass network, reducing the stiffness and making it more susceptible to deformation. While an increased hardness generally corresponds to greater fracture toughness, this is complicated when multiple deformation mechanisms are present (Lawn and Marshall, 1979). Reports on glasses with high crack resistances show that hardness does not directly correlate with fracture toughness or crack resistance (Sehgal and Ito, 1998, 1999; Kato et al., 2010). Sehgal and Ito (1999) did observe a correlation between the crack initiation load and a brittleness factor. Calculating the brittleness from the indentation in Na2O–TiO2–SiO2 glasses, a weak trend of increasing brittleness with increasing Poisson’s ratio is observed for 9.8 and 49 N loads (Figure 8A). At 4.9 and 2.94 N loads (Figure 8B), this trend is not clearly visible. The scatter in the brittleness values is quite high and does not follow the trend of the crack initiation load, suggesting that brittleness may not work particularly well for characterizing these glasses. Additionally, the analysis of brittleness in these glasses at 4.9 and 2.94 N loads is somewhat questionable. At these loads, the crack length is approximately equal to or shorter than the indentation diagonal. Lawn and Marshall (1979) pointed out that this is where the mechanical response transitions from being hardness controlled to toughness controlled. Thus, the long-range assumptions on fracture toughness used in the calculation of brittleness are not as reliable at low loads where short cracks occur.
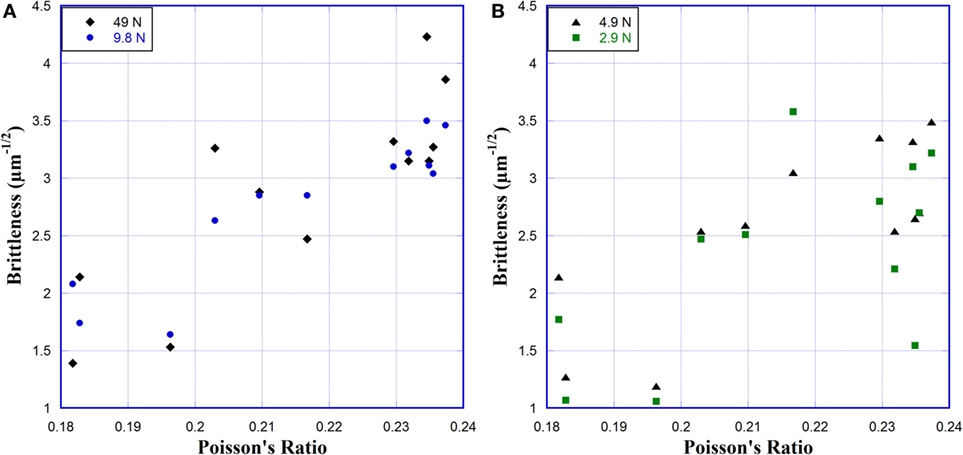
Figure 8. Brittleness of glasses versus Poisson’s ratio for (A) 49 and 9.8 N and (B) 4.9 and 2.9 N. Brittleness was calculated using the method described by Sehgal and Ito (1999).
The indentation diagonals are roughly 30, 45, 65, and 150 μm in length at 2.94, 4.9, 9.8, and 49 N loads. Looking at the average crack lengths over a range of loads versus Poisson’s ratio (Figure 4), we see that the crack length quickly grows to be larger than the indent diagonal, but they are quite comparable at low loads. The average crack length appears to increase logarithmically with increasing Poisson’s ratio, with a few exceptions at 2.94 and 4.9 N loads where the crack length is significantly shorter. But this reduced crack length does not occur for all glasses that have crack lengths approximately equal to the length of the indentation diagonal. So while the relative sizes of the crack lengths and indent diagonals are related to the brittleness, they are likely not the explanation for the unusual cracking behavior. Even at higher loads, where the brittleness calculations are reliable, and it increases with increasing Poisson’s ratio, it does not show any relationship with the crack initiation loads. Similar findings have been reported by Kato et al. (2010) for a variety of commercial glasses.
The fracture toughness, KIC, remains approximately constant, possibly decreasing slightly, with increasing Poisson’s ratio. This change directly follows an increase in the Na2O content, which corresponds to an increase in the number of weaker interatomic bonds in the network. This would be expected to promote an easier path to fracture, so a slight decrease in the fracture toughness would be expected. These values approximately match literature values of glasses with similar compositions (Sehgal and Ito, 1998, 1999; Kato et al., 2011). The fracture toughness does not appear to have any correlation with the minimum observed in the critical crack initiation load. This is in agreement with the findings of Kato et al. (2010).
The minimum in crack initiation load is roughly predicted by models by Lawn and Marshall (1979) and Hagan (1979), which follow the form of
where Pc is the crack initiation load, C is a constant, H is the hardness, and KIC is the fracture toughness. Lawn and Marshall used a value of C = 2.2 × 10⁴ and Hagan used C = 885, where the difference in the constant C arises from different assumptions about the maximum operating stresses. Crack initiation loads from our experiments and both models are shown in Figure 9. These models assume the existence of subsurface flaws at the plastic–elastic boundary, which either exist prior to indentation (Lawn and Marshall) or are nucleated during the indentation (Hagan). These models predict the minimum load to initiate a crack in the material, so it would be expected that they would predict a lower load than required to initiate four cracks. Lawn and Marshall’s model actually predicts higher loads because their value of C does not include the possibility of flaws nucleating during indentation. These models also assume that the material behaves in a purely elastic–plastic manner. As our glasses follow the trend predicted by the models, this suggests that these glasses are structurally inhomogeneous at some level and exhibit inhomogeneous shear flow when indented (Hagan, 1980). Inhomogeneous shear flow occurs as shear flow lines intersect and can create defect sources, promoting crack initiation.
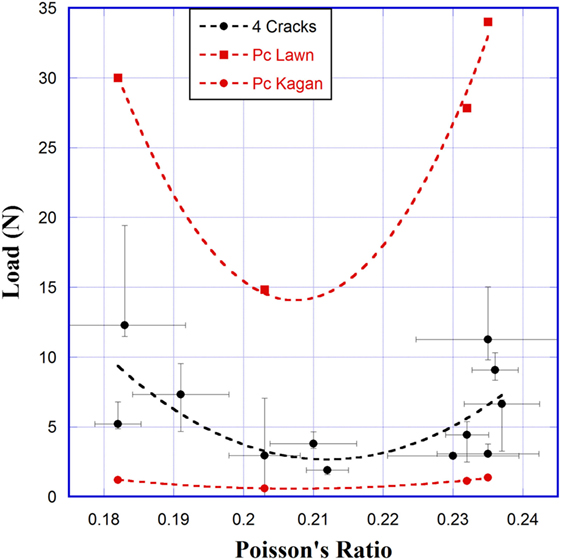
Figure 9. Crack initiation load versus Poisson’s ratio for Na2O–TiO2–SiO2 glasses measured experimentally (black) (Scannell et al., 2015) and calculated (red) from Eq. 4. Dashed lines are an exponential fit of data and act as a guide to the eyes.
Kato et al. (2010) did observe a correlation between the crack resistance and the recovery of indentation depth (RID). RID is a measure of the change in depth of the Vickers indent, which effectively estimates the fraction of deformation volume created through densification. In their study, glasses with a greater amount of densification were found to have higher crack resistance. Volume recovery of indentations has been observed to have a dependency on the indentation load but becomes almost constant at loads above 0.50 N (Yoshida et al., 2007). Indentations examined in this study were performed at 50 gf, so it is unlikely that indentation size effect has a significant influence on the densification volumes observed. The densification volume increases from 13.1 to 16.5 μm3 as Poisson’s ratio increases from 0.18 to 0.23; however, the percentage of densification remains effectively the same (Figure 6). As the densification volume increases the load to initiate cracks decreases. At the same time, the volume of materials deformed through shear flow increases from 4.5 to 6.4 μm3. At ν > 0.235, the observed densified volume starts to decrease rapidly, while the sheared volume continues to increase gradually. At ν = 0.237, the fractions of densification volume and sheared volume change roles, with the fraction of densification volume becoming smaller than the sheared volume.
The transition between densification and shear flow at ν = 0.237 matches the decrease in volume recovery at indents observed by Sellappan et al. (2013). However, the increase in crack initiation load between ν = 0.23 and 0.24 does not. Sellappan et al. (2013) and Kato et al. (2010) both observed a decrease in the load to initiate cracks with a decrease in the volume recovery ratio. Aakermann et al. (2015) observed a decrease in the crack resistance of mixed alkali aluminosilicate glasses when compressed, which they attributed to a change in the volume ratio of the two permanent deformation mechanisms. It is interesting that the observed minimum in crack initiation load is not accompanied by a change in the relative fractions of densification and shear flow, but rather that the change happens just after the minimum ends and the crack initiation load increases.
The change in the deformation mechanisms between the 20 and 25 Na2O glasses should be accompanied by a significant change in the structure. This could be caused by the formation of 2D regions with high concentrations of weaker bonds, as per the percolation model suggested by Farges et al. (1996). Example structural models for Na2O–TiO2–SiO2 glasses are shown in Figure 10. Ti is drawn as being primarily fivefold coordinated in these models for simplicity, which was the dominant coordination found by Farges (1999), Henderson et al. (2002), and Reynard and Webb (1998). In the 10 Na2O–10 TiO2–80 SiO2, 15 Na2O–4 TiO2–81 SiO2, 15 Na2O–10 TiO2–75 SiO2, and 20 Na2O–10 TiO2–70 SiO2 glasses, Ti only has a slight tendency to form clusters and clusters are isolated. At 25 Na2O, Ti has a stronger tendency to form clusters. In the 25 Na2O–10 TiO2–65 SiO2 glass, clusters are longer and more interconnected than those in the 25 Na2O–4 TiO2–71 SiO2 glass. In the 10 and 15 Na2O glasses, Na atoms are well dispersed throughout the glass structure, they become slightly concentrated in the 20 Na2O glass and more so along the interconnected Ti clusters in 25 Na2O glasses. Addition of Na2O gradually depolymerizes the silica network, Ti shields Si to some extent by attracting Na to form Ti-, Na-rich clusters.
Formation of Ti-, Na-rich clusters with a local, high packing density and number of non-bridging oxygen would be more susceptible to shear flow, but a sufficient concentration of these clusters would need to exist before shear flow could occur on a large scale. This is seen in the large jump in shear flow volume at ν = 0.237 as the TiO2 content is increased from 4 to 10 mol% at 25 Na2O. The small change in deformation volumes between ν = 0.18 and 0.23 suggests that there is relatively little difference in how the insolated Ti-, Na-rich clusters and the SiO2 network respond to deformation. A possible alternative explanation for the effectively constant volume fractions is the promotion of densification by shear flow, which has been observed in silica glass (Mackenzie, 1963). If this is also the case in our glasses, when the shear flow is large but not quite at the critical level, it is possible that the increased shear flow facilitates the densification of glass underneath the indent. This could explain why the fractions of densification and shear flow remain effectively constant as the volume fraction of Ti-, Na-rich clusters increases.
Before Ti-, Na-rich clusters become interconnected, and the longer range shear flow across clusters is possible, shear of these clusters would be localized, possibly explaining the negligible pileup before annealing and the large amount of shear deformation underneath the indent (Figure 7). This shear volume contributes directly to the residual stresses that promote crack growth. Above the critical level of Ti-, Na-rich cluster concentration, the longer range shear flow becomes much easier, relieving stress under indentation. It also becomes the dominant deformation mechanism to dissipate energy, thus the crack initiation load increases. This would explain the minimum observed in the crack initiation load as observed in Figure 9. Once initiated, cracks can propagate easily through interconnected Ti-, Na-rich clusters (weak regions), which explains the increase of crack length with increasing Poisson’s ratio (Figure 4).
The above observations show the complexity in the deformation and cracking of glass under indentation and indicate the importance of illustrating the microscopic origins of densification and shear flow and the interplay between the two in order to fully understand the behaviors of glass under sharp contact loading. Not only the amount of shear deformation but also its location and/or length scale seem to play a role in determining the crack initiation and propagation in glass under indentation. The structural mechanisms by which shear flow would promote densification during indentation are not fully understood. To the authors’ knowledge, specific structural mechanisms have only been attributed in the silica glass system. Rouxel (2015) discusses the relationship between shear flow, pressure, and densification, mainly focusing on silica, but also extending his discussion to silicate glasses in general.
A minimum in the critical crack initiation load at ν = 0.21–0.22 was investigated. Hardness decreased slightly with increasing Poisson’s ratio, from ~5.5 to ~4.5 GPa. Crack length increased with increasing Poisson’s ratio, approximately doubling between ν of 0.18 and 0.24. The fracture toughness did not change appreciably with changing Poisson’s ratio, remaining at 0.6 ± 0.1 MPa m1/2. No correlations between the minimum in crack initiation load and hardness, crack length, or fracture toughness were observed.
The volume fractions of glass deformed through shear flow and densification were found to remain relatively constant with Poisson’s ratio between 0.18 and 0.235, with a sharp decrease in densification and increase in shear flow between 0.235 and 0.237. This accompanies the composition change of 4–10 mol% TiO2 at 25 Na2O. A structural model has been proposed in which Ti-, Na-rich clusters increase in population and become more and more interconnected with increasing Na2O and TiO2 content. Initial formation of these clusters acts to increase localized shear flow beneath the indenter, increasing residual stress and promoting crack formation until shear flow can take place over longer ranges via interconnected Ti-, Na-rich clusters, relieving stress and increasing crack initiation load. Meanwhile, interconnected Ti-, Na-rich clusters form weak regions in the glass matrix to facilitate crack propagation once initiated.
LH and TR designed the project. GS, DL, and FC carried out the experiments. All authors participated in data analysis and manuscript writing.
The authors declare that the research was conducted in the absence of any commercial or financial relationships that could be construed as a potential conflict of interest.
GS is indebted to the Chateaubriand Fellowship program for funding 1 year study in Rennes (France), hence promoting collaboration between RPI and IPR. TR is grateful to the European Research Council for supporting these researches through the Advanced Grant 320506 (DAMREG) of the seventh framework program “Ideas.” LH acknowledges the financial support from the US National Science Foundation under grant No. DMR-1105238 and DMR-1255378. Theany Tô (Glass Mechanics Department, IPR, Rennes, France) is acknowledged for his assistance in performing the SEPB measurements.
Aakermann, K., Januchta, K., Pedersen, J., Svenson, M., Rzoska, S., Bockowiski, M., et al. (2015). Indentation deformation mechanism of isostatically compressed mixed alkali aluminosilicate glasses. J. Non-Cryst. Solids 426, 175–183. doi:10.1016/j.jnoncrysol.2015.06.028
Farges, F. (1999). A Ti K-edge EXAFS study of the medium range environment around Ti in oxide glasses. J. Non-Cryst. Solids 244, 25–33. doi:10.1016/S0022-3093(98)00846-1
Farges, F., Brown, G. E. J., Navrotsky, A., Gan, H., and Rehr, J. J. (1996). Coordination chemistry of Ti(IV) in silicate glasses and melts: II. Glasses at ambient temperature and pressure. Geochim. Cosmochim. Acta 60, 3039–3053. doi:10.1016/0016-7037(96)00145-7
Gross, T. M. (2012). Deformation and cracking behavior of glasses indented with diamond tips of various sharpness. J. Non-Cryst. Solids 358, 3445–3452. doi:10.1016/j.jnoncrysol.2012.01.052
Hagan, J. T. (1979). Micromechanics of crack nucleation during indentations. Phys. Chem. Solids 14, 2975–2980.
Hagan, J. T. (1980). Shear deformation under pyramidal indentations in soda-lime glasses. J. Mater. Sci. 15, 1417–1424. doi:10.1007/BF00752121
Henderson, G., Liu, X., and Fleet, M. (2002). A Ti L-edge X-ray absorption of Ti-silicate glasses. Phys. Chem. Miner. 29, 32–42. doi:10.1007/s002690100208
Kato, Y., Yamazaki, H., Itakura, S., Yoshida, S., and Matsuoka, J. (2011). Load dependence of densification in glass during Vickers indentation test. J. Am. Ceram. Soc. 119, 110–115. doi:10.2109/jcersj2.119.110
Kato, Y., Yamazaki, H., Yoshida, S., and Matsuoka, J. (2010). Effect of densification on crack initiation under Vickers indentation test. J. Non-Cryst. Solids 356, 1768–1773. doi:10.1016/j.jnoncrysol.2010.07.015
Lawn, B., and Marshall, D. (1979). Hardness, toughness, and brittleness: an indentation analysis. J. Am. Ceram. Soc. 62, 347–350. doi:10.1111/j.1151-2916.1979.tb19075.x
Lewandowski, J., Wang, W., and Greer, A. (2005). Intrinsic plasticity or brittleness of metallic glasses. Philos. Mag. Lett. 85, 77–87. doi:10.1080/09500830500080474
Mackenzie, J. D. (1963). High-pressure effects on oxide glasses: I, densification in a rigid state. J. Am. Ceram. Soc. 46, 461–470. doi:10.1111/j.1151-2916.1963.tb13776.x
Mauro, J., Philip, C., Vaughn, D., and Pambianchi, M. (2014). Glass science in the United States: current status and future directions. Int. J. Appl. Glass Sci. 5, 2–15. doi:10.1111/ijag.12058
Necas, D., and Klapetek, P. (2012). Gwyddion: an open-source software for SPM data analysis. Cent. Eur. J. Phys. 10, 181–188. doi:10.2478/s11534-011-0096-2
Nose, T., and Fujii, T. (1988). Evaluation of fracture toughness for ceramic materials by a single-edge-precracked-beam method. J. Am. Ceram. Soc. 71, 328–333. doi:10.1111/j.1151-2916.1988.tb05049.x
Reynard, B., and Webb, S. (1998). High-temperature Raman spectroscopy of Na2TiSi2O7 glass and melt: coordination of Ti4+ and nature of the configurational changes in the liquid. Eur. J. Mineral. 10, 49–58. doi:10.1127/ejm/10/1/0049
Rouxel, T. (2015). Driving force for indentation cracking in glass: composition, pressure and temperature dependence. Phil. Trans. R. Soc. A 373, 20140140. doi:10.1098/rsta.2014.0140
Rouxel, T., Sellappan, P., Celarie, F., Houizot, P., and Sangleboeuf, J. C. (2014). Towards glasses with better indentation cracking resistance. C. R. Mec. 342, 46–51. doi:10.1016/j.crme.2013.10.008
Scannell, G., Barra, S., and Huang, L. (2016). Structure and properties of Na2O-TiO2-SiO2 glasses: role of Na and Ti on modifying the silica network. J. Non-Cryst. Solids 448, 52–61. doi:10.1016/j.jnoncrysol.2016.06.028
Scannell, G., Huang, L., and Rouxel, T. (2015). Elastic properties and indentation cracking behavior of Na2O-TiO2-SiO2 glasses. J. Non-Cryst. Solids 429, 129–142. doi:10.1016/j.jnoncrysol.2015.09.011
Sehgal, J., and Ito, S. (1998). A new low-brittleness glass in the soda-lime-silica glass family. J. Am. Ceram. Soc. 81, 2485–2488. doi:10.1111/j.1151-2916.1998.tb02649.x
Sehgal, J., and Ito, S. (1999). Brittleness of glass. J. Non-Cryst. Solids 253, 126–132. doi:10.1016/S0022-3093(99)00348-8
Sellappan, P., Rouxel, T., Celarie, F., Becker, E., Houizot, P., and Conradt, R. (2013). Composition dependence of indentation deformation and indentation cracking in glass. Acta Mater. 61, 5949–5965. doi:10.1016/j.actamat.2013.06.034
Srawley, J. E. (1976). Wide-range stress intensity factor expressions for ASTM E 399 standard fracture toughness specimens. Int. J. Fract. 12, 475–480.
To, T., Roux-Langlois, C., Celarie, F., and Rouxel, T. (2016). “Determination of the toughness of glass: single edge precracked beam procedure,” in Fractography of Advanced Ceramics; 9–12 October (Košice, Slovakia: Institute of Materials Research, SAS). Presentation.
Wondraczek, L., Mauro, J., Eckert, J., Kuhn, U., Horbach, J., Deubener, J., et al. (2011). Towards ultrastong glasses. Adv. Mater. 23, 4578–4586. doi:10.1002/adma.201102795
Yoshida, S., Sangleboeuf, J.-C., and Rouxel, T. (2007). Indentation-induced densification of soda-lime silicate glass. Int. J. Mater. Res. 98, 360–364. doi:10.3139/146.101478
Keywords: sodium–titanium–silicate glass, crack initiation load, Poisson’s ratio, densification, shear flow
Citation: Scannell G, Laille D, Célarié F, Huang L and Rouxel T (2017) Interaction between Deformation and Crack Initiation under Vickers Indentation in Na2O–TiO2–SiO2 Glasses. Front. Mater. 4:6. doi: 10.3389/fmats.2017.00006
Received: 06 December 2016; Accepted: 28 February 2017;
Published: 24 March 2017
Edited by:
Ashutosh Goel, Rutgers University, USAReviewed by:
Saurabh Kapoor, Aalborg University, DenmarkCopyright: © 2017 Scannell, Laille, Célarié, Huang and Rouxel. This is an open-access article distributed under the terms of the Creative Commons Attribution License (CC BY). The use, distribution or reproduction in other forums is permitted, provided the original author(s) or licensor are credited and that the original publication in this journal is cited, in accordance with accepted academic practice. No use, distribution or reproduction is permitted which does not comply with these terms.
*Correspondence: Liping Huang, aHVhbmdsNUBycGkuZWR1;
Tanguy Rouxel, dGFuZ3V5LnJvdXhlbEB1bml2LXJlbm5lczEuZnI=
Disclaimer: All claims expressed in this article are solely those of the authors and do not necessarily represent those of their affiliated organizations, or those of the publisher, the editors and the reviewers. Any product that may be evaluated in this article or claim that may be made by its manufacturer is not guaranteed or endorsed by the publisher.
Research integrity at Frontiers

Learn more about the work of our research integrity team to safeguard the quality of each article we publish.