 Rui Cui
 Peng Zhang1*
 Ann Holbourn
 Wolfgang Kuhnt
94% of researchers rate our articles as excellent or good
Learn more about the work of our research integrity team to safeguard the quality of each article we publish.
Find out more
ORIGINAL RESEARCH article
Front. Mar. Sci., 02 April 2025
Sec. Global Change and the Future Ocean
Volume 12 - 2025 | https://doi.org/10.3389/fmars.2025.1570375
This article is part of the Research TopicObservations and Reconstruction of the Indo-Pacific Dynamic Environment: Modern and Ancient ComparisonView all 3 articles
Surface hydrology in the tropical eastern Indian Ocean significantly impacts low-latitude climate processes including the Indonesian-Australian Monsoon and the Indian Ocean Dipole. Deciphering the evolution of surface hydrology and driving mechanisms is thus important to better understand low-latitude and global climate change. Here, we present ~206 yr-resolved temperature and salinity records of surface waters spanning the past ~31 kyr, based on δ18O and Mg/Ca ratio of Globigerinoides ruber from Core SO18567 retrieved offshore northwestern Australia in the tropical eastern Indian Ocean. By integrating new records with published paleo-oceanographic and -climatological records, we found that increasing sea surface temperature and decreasing salinity in the tropical eastern Indian Ocean during the Heinrich stadial 1 and the Younger Dryas could be attributed to collapse of the Atlantic Meridional Overturning Circulation (AMOC). Melting of Northern Hemisphere ice sheets would have led to a southward shift of the Intertropical Convergence Zone (ITCZ) and reduced transport of warm surface waters from the low latitudes to the Northern Hemisphere high latitudes. In addition, our results indicate that the onset of the last deglacial warming in low latitudes was linked to weakening of the Hadley circulation and AMOC due to warming of Northern Hemisphere high latitudes, rather than raised global atmospheric CO2 concentration.
The Northern Hemisphere high-latitude region has been widely recognized as a key player in global climate dynamics (Groisman and Soja, 2007; Rind, 2008). This is due to the fact that the Atlantic Meridional Overturning Circulation (AMOC), the key component of the global ocean conveyor belt, exerts a major impact on global climate systems (Broecker, 1991; McManus et al., 2004; Murton et al., 2010). Numerous studies revealed that the onset of the last deglacial warming in low latitudes as well as the occurrence of rapid climate events, such as the Heinrich Stadial 1 (HS1) and Younger Dryas (YD), could be related to Northern Hemisphere high-latitude dynamics (Denton et al., 2010; Muller et al., 2012; Mohtadi et al., 2014; Gibbons et al., 2014; Schröder et al., 2016, 2018; Jackson et al., 2019).
Modern oceanographic studies suggested that the surface hydrology of the tropical eastern Indian Ocean significantly impacts low-latitude climate processes, including the Indonesian-Australian Monsoon (IAM) and Indian Ocean Dipole (IOD) (Kershaw et al., 2003; Abram et al., 2020; Heidemann et al., 2023). The Indonesian Throughflow (ITF), the low-latitude component of the global ocean conveyor belt flowing from the Pacific Ocean through the Indonesian Seas, has its main exits in the tropical eastern Indian Ocean (Gordon, 2005; Oppo and Rosenthal, 2010). Northern Hemisphere high latitudes could, therefore, be influencing surface hydrology in the tropical eastern Indian Ocean by regulating the AMOC and the global ocean conveyor belt. This has been proposed by an increasing number of paleo-oceanographic and -climatological studies. For instance, increased sea surface temperature (SST) and sea surface salinity (SSS) in the Java-Sumatra upwelling region during the HS1 and YD have been linked to weakened AMOC due to melting of Northern Hemisphere ice sheets (Levi et al., 2007; Gibbons et al., 2014; Mohtadi et al., 2010, 2014). Thermocline warming during Heinrich events 3-5 has been linked to transient ITF slowdown due to weakening of the AMOC (Zuraida et al., 2009). However, the influence of the Northern Hemisphere high latitudes on the surface hydrology of the tropical eastern Indian Ocean on millennial timescale is still unclear, due to the scarcity of high-resolution surface hydrological records.
In this study, we present the first high-resolution (~206 years) surface hydrology records spanning the past ~31 kyr from Core SO18567 off northwestern Australia in the tropical eastern Indian Ocean (Figure 1) (Kuhnt et al., 2018). We compared the new records with published records of regional precipitation, AMOC intensity, atmospheric CO2 concentration and Northern Hemisphere high-latitude summer insolation to explore the potential influence of the Northern Hemisphere high latitudes on the surface hydrology of the tropical eastern Indian Ocean on a millennial timescale.
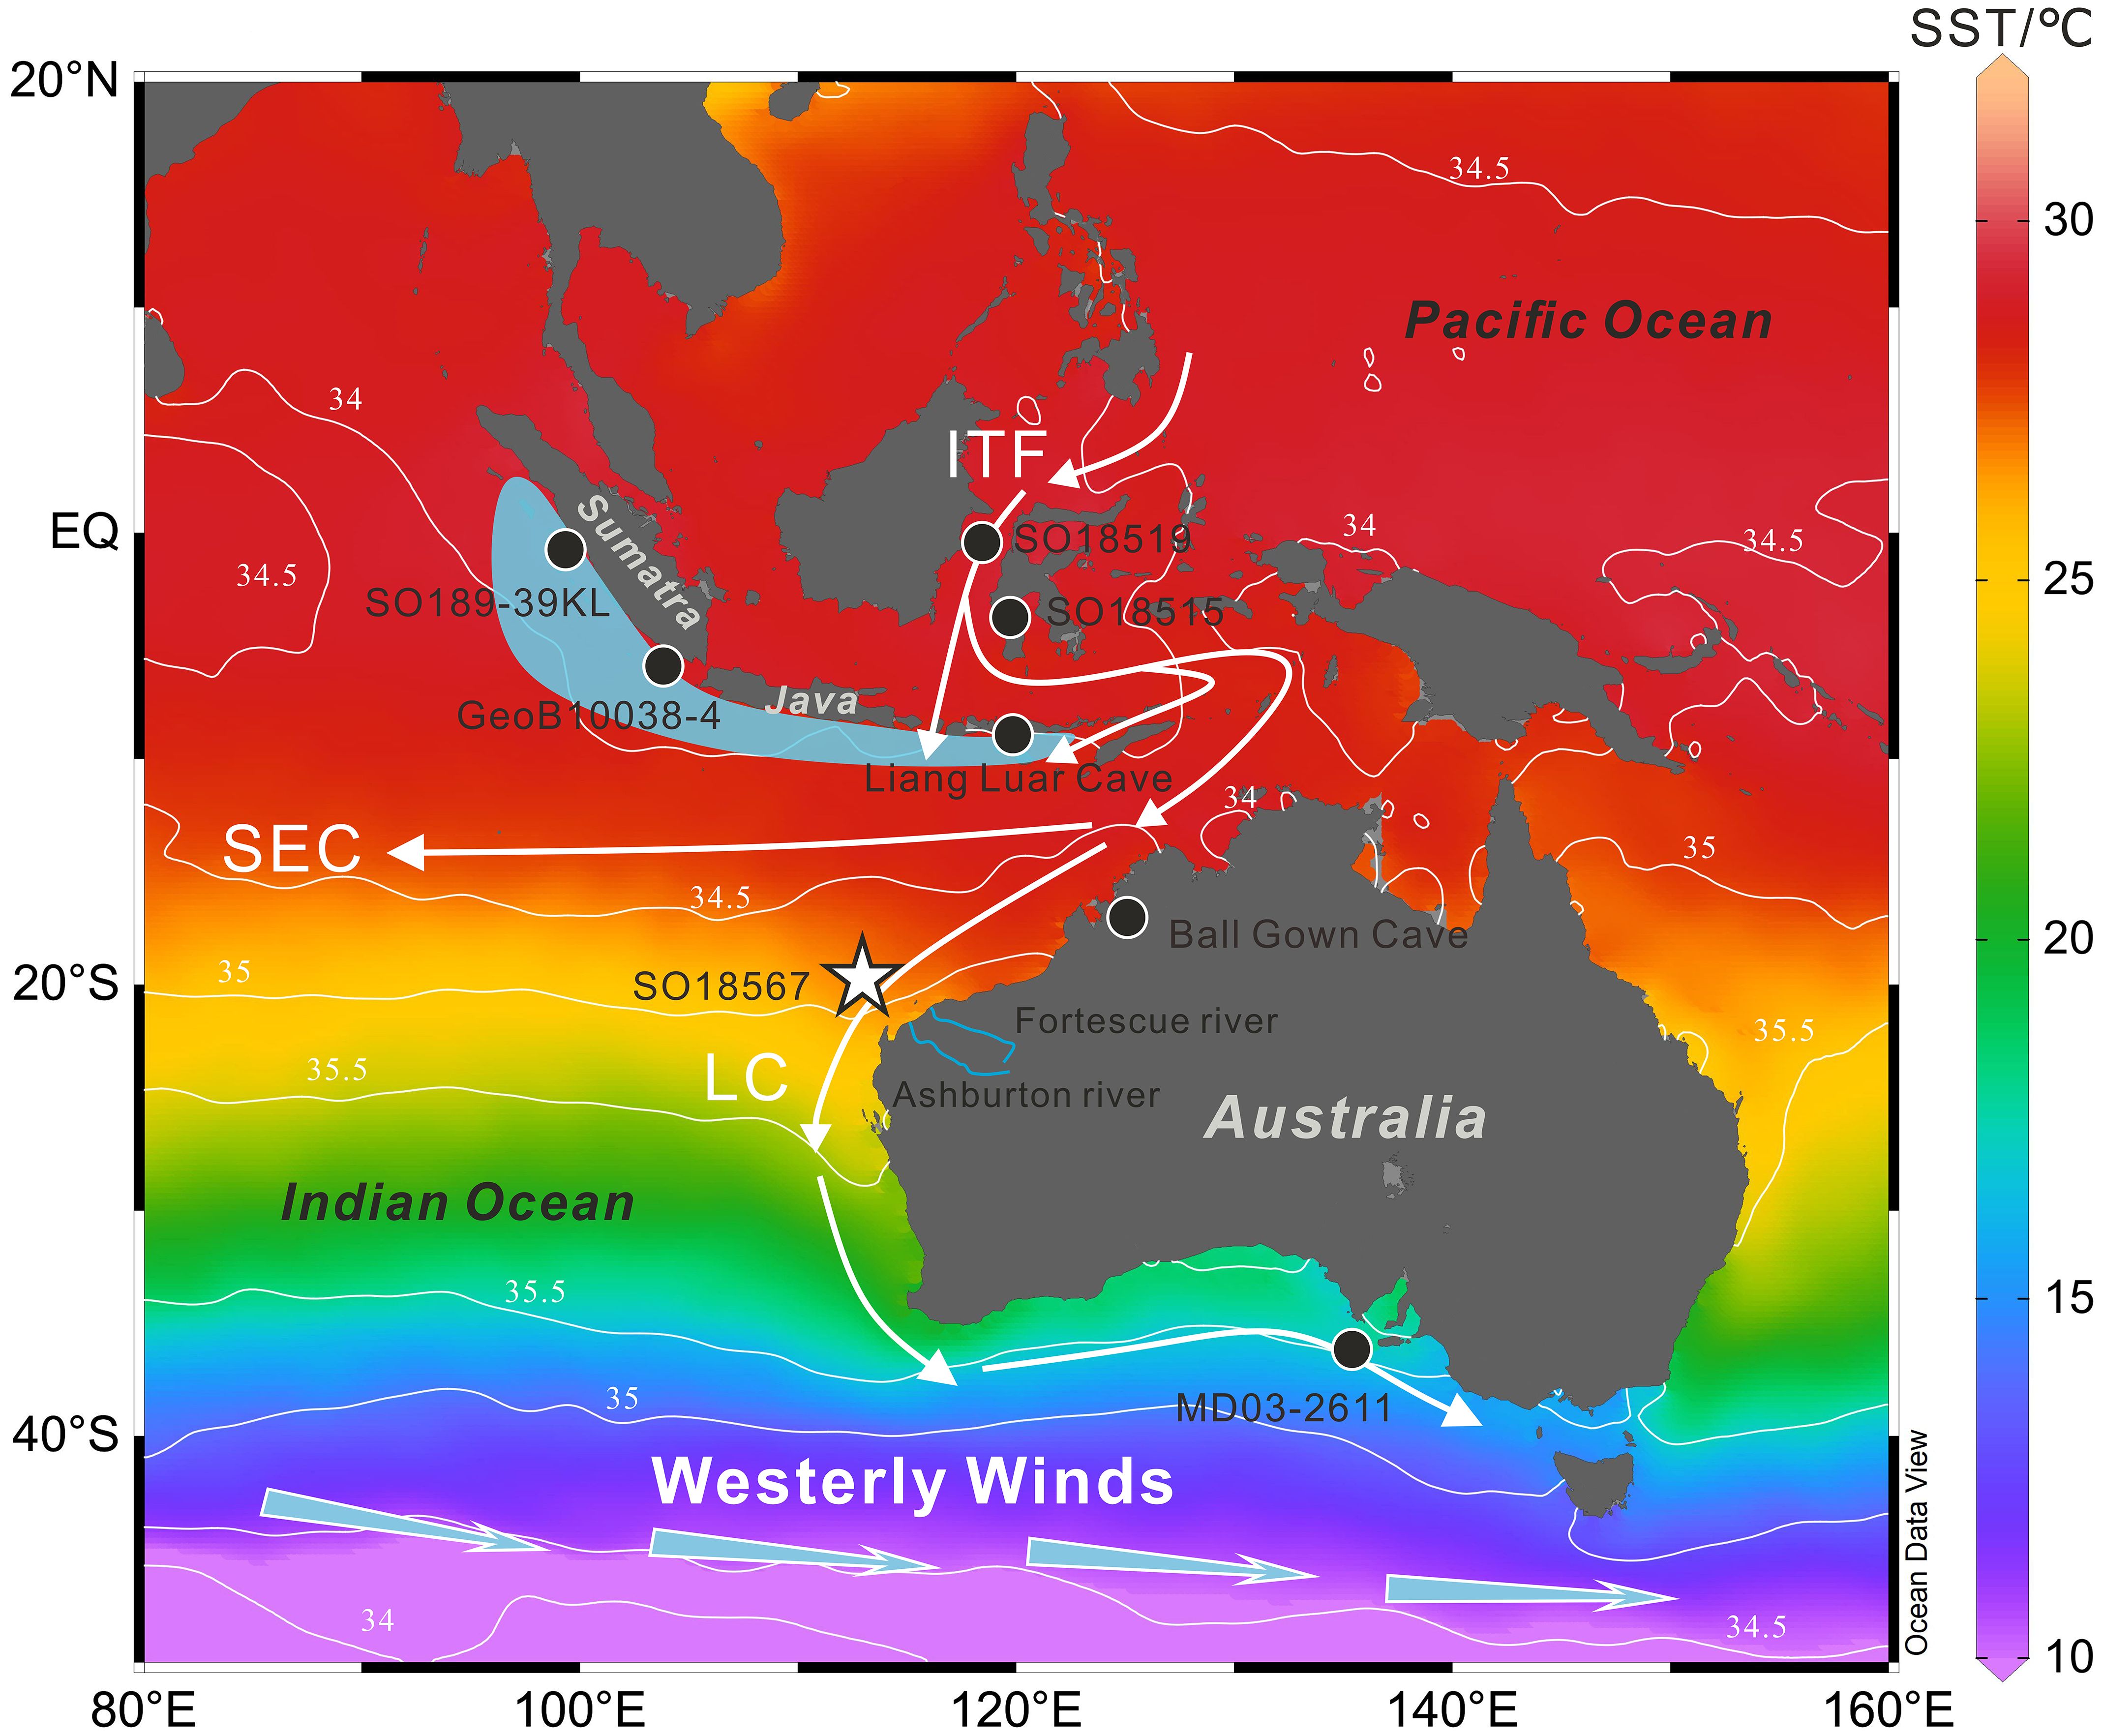
Figure 1. Site map showing annual mean SST and SSS and oceanic-atmospheric circulation. The white star indicates the location of Core SO18567 (this study), the black dots represent the locations of Cores SO189-39KL (Mohtadi et al., 2014), GeoB 10038-4 (Mohtadi et al., 2010), SO18515 (Schröder et al., 2016), SO18519 (Schröder et al., 2018), MD03-2611 (De Deckker et al., 2012) and the locations of the speleothems of Ball Gown Cave in Australia (Denniston et al., 2013) and of Liang Luar Cave in Flores (Ayliffe et al., 2013); Color shadings indicate SST (°C) and white iso-lines show SSS (psu); Light blue arrows represent the Southern Hemisphere westerly winds; Blue lines indicate the Fortescue and Ashburton Rivers in northwestern Australia; White arrows indicate the path of the ITF and its southward extension, the LC; Light blue shading marks the Java-Sumatra upwelling region (Susanto et al., 2001); Temperature and salinity data are from WOA 2023 (Locarnini et al., 2024; Reagan et al., 2024); Base map was plotted using Ocean Data View (https://odv.awi.de, Schlitzer, 2024); SEC, South Equatorial Current; ITF, Indonesian Throughflow; LC, Leeuwin Current.
Modern oceanographic studies show that surface hydrology offshore northwestern Australia is mainly influenced by the Leeuwin Current and the Intertropical Convergence Zone (ITCZ) (Reason et al., 1999; Domingues et al., 2007; Middleton and Bye, 2007; Akhir et al., 2020). After the ITF enters the Indian Ocean, it contributes to the westward flow that eventually returns to the North Atlantic, and also flows southward along the Western Australian margin, forming the Leeuwin Current (Church et al., 1989; Gordon, 2005; Sprintall et al., 2009; Cresswell and Domingues, 2009, 2010; Oppo and Rosenthal, 2010). The Leeuwin Current, the southward extension of the ITF, transports warm and fresh surface waters southward along the margin of Western Australia, thus influencing local SST and SSS (Reason et al., 1999; Middleton and Bye, 2007; De Deckker et al., 2014). In addition, the Leeuwin Current also influences precipitation over Western Australia by supplying a large amount of moisture (Meyers et al., 1995; Domingues et al., 2007; De Deckker et al., 2012).
The ITCZ, which forms by the interaction of trade winds from the two hemispheres, represents the heaviest rainfall belt in the world (Waliser and Gautier, 1993; Adler et al., 2003). The ITCZ migrates towards the north during austral winter and shifts towards the south during austral summer (Donohoe et al., 2013; Schneider et al., 2014). Precipitation over northwestern Australia, located at the southern margin of the ITCZ, is characterized by significant seasonal fluctuations (Reeves et al., 2013; Zhang et al., 2020). Modern observations show that precipitation increases with the southward shift of the ITCZ during austral summer, while the reverse occurs during austral winter (Figures 2a, b) (Kalnay et al., 1996). The river discharge in northwestern Australia is dominated by local precipitation, with high runoff during austral summer (Figures 2c, d).
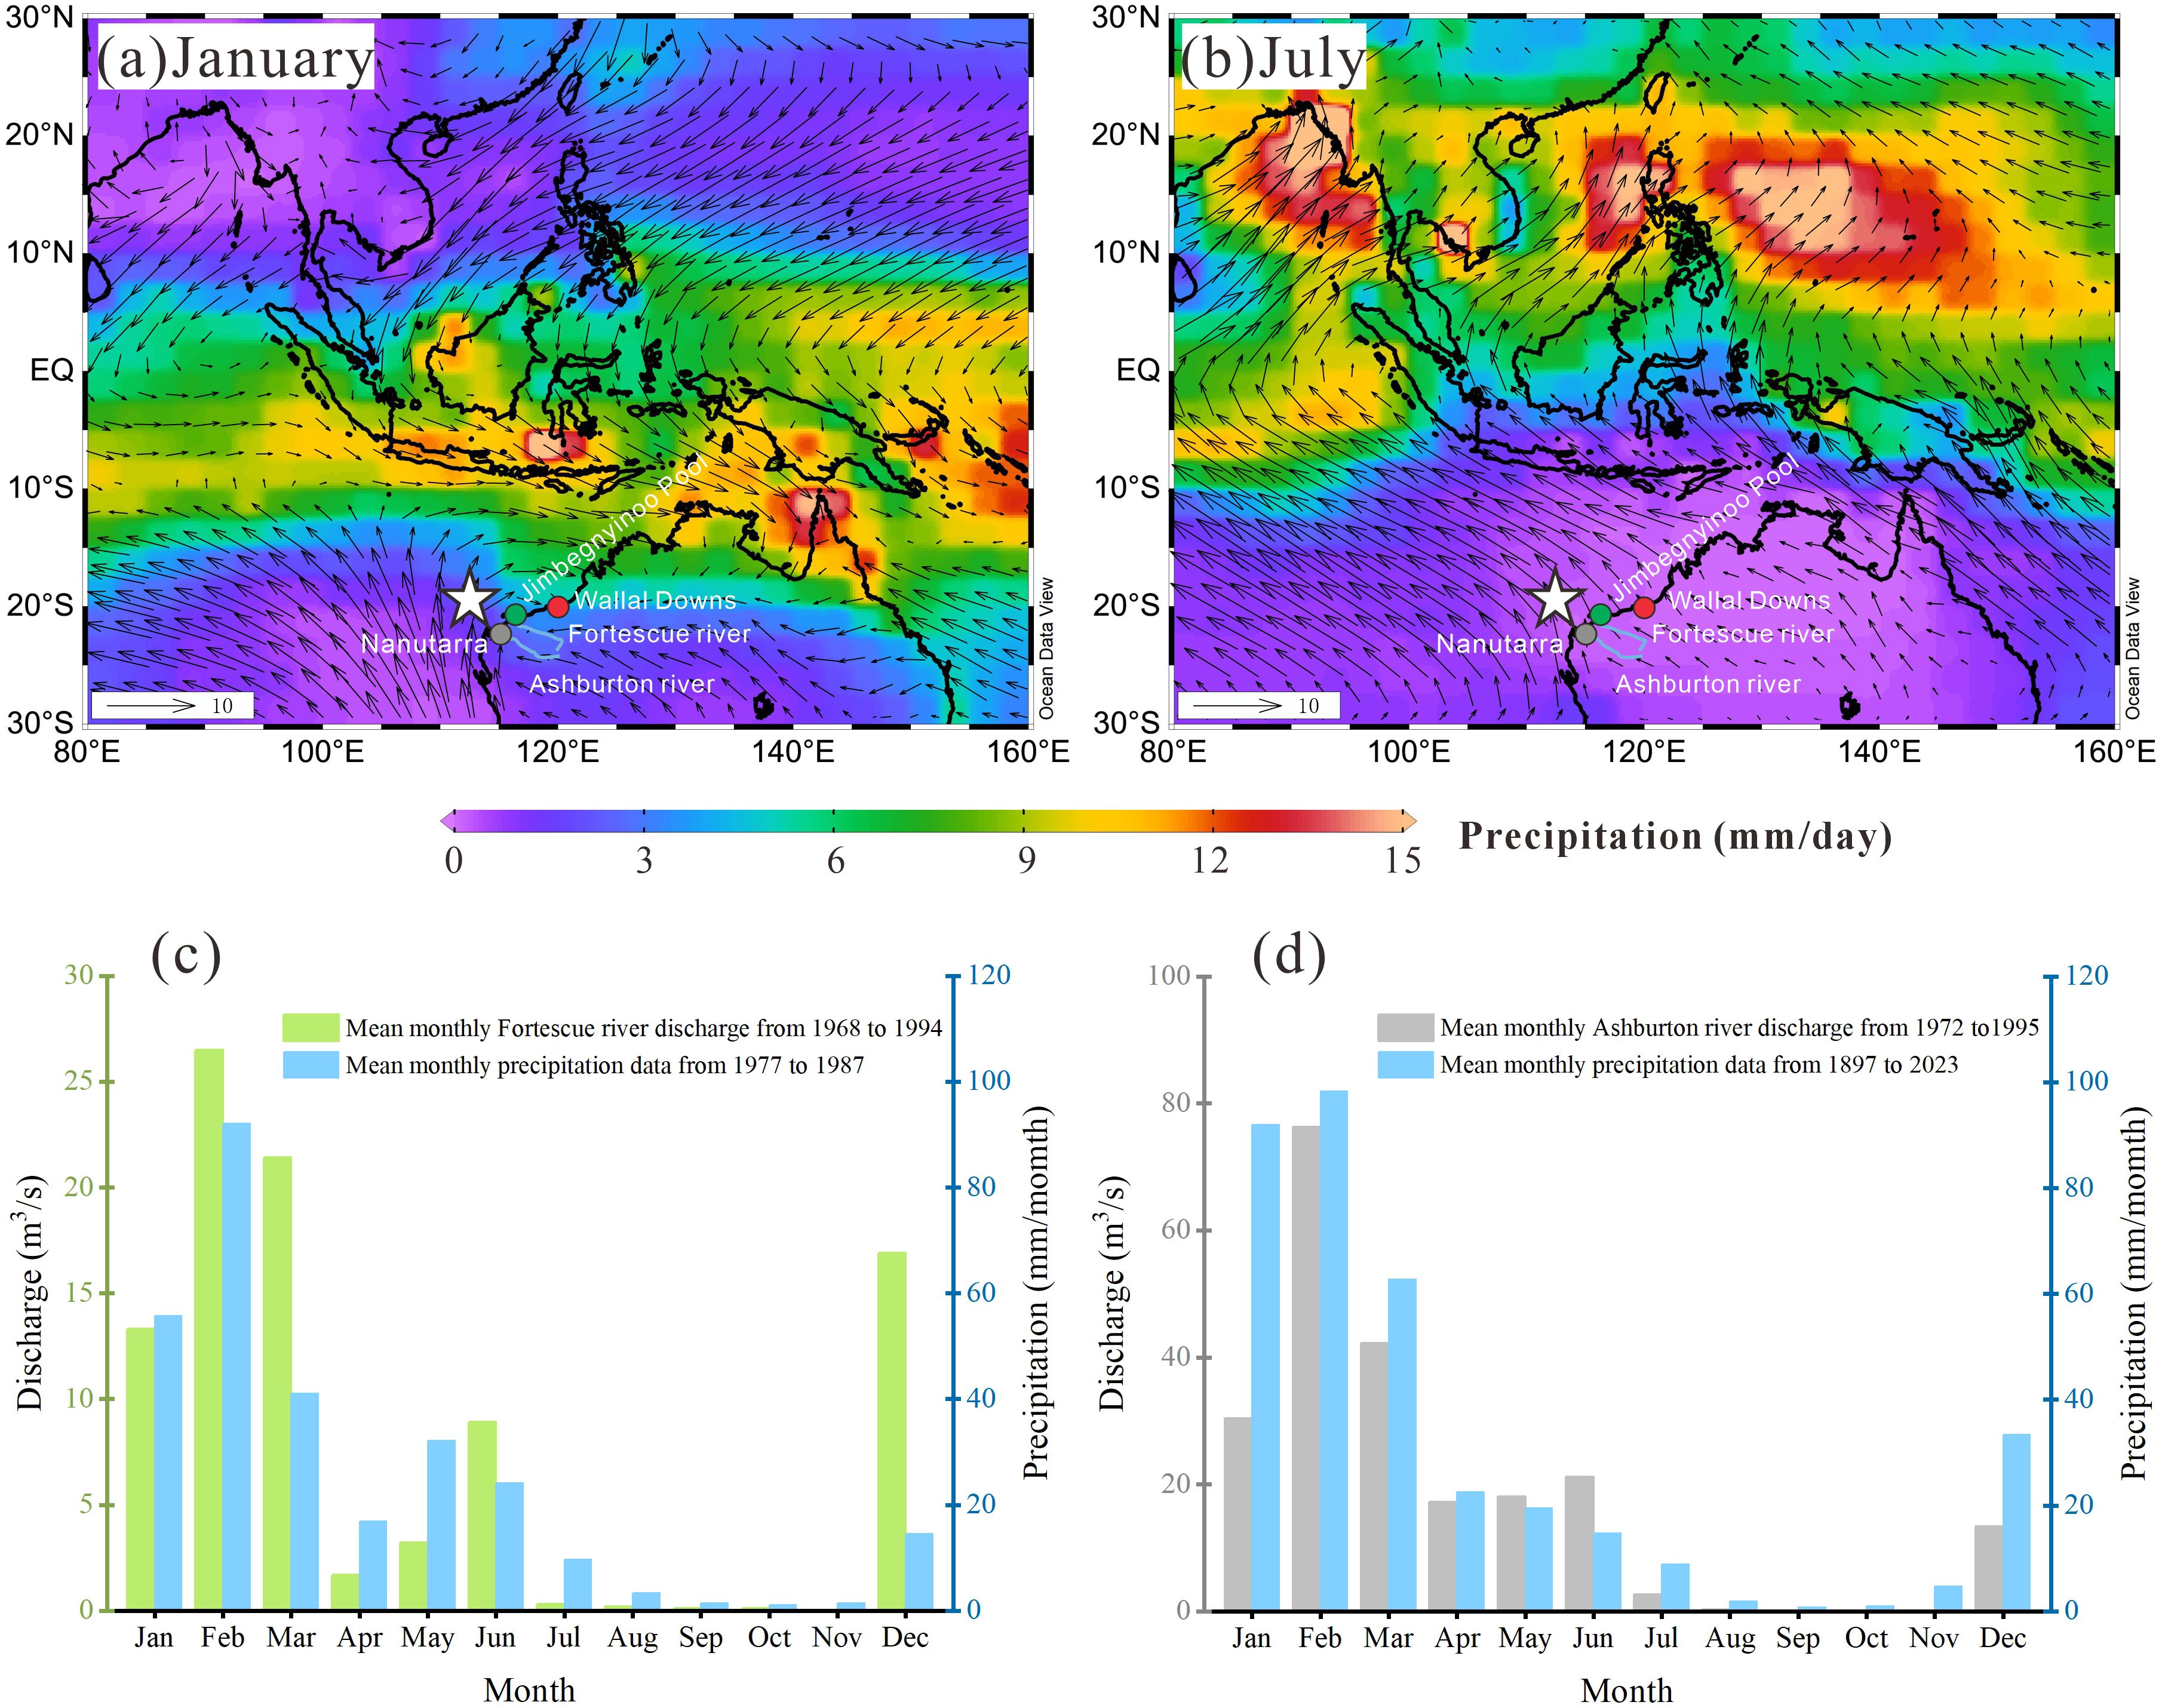
Figure 2. Regional meteorology. Mean precipitation and wind trajectory in the study region during (a) austral summer (January) and (b) austral winter (July); (c) Monthly mean precipitation and discharge of the Fortescue River from Jimbegnyinoo Pool station (21.33°S, 116.16°E); (d) Monthly mean precipitation for northwestern Australia from Wallal Downs station (19.78°S, 120.64°E) and discharge of the Ashburton River from Nanutarra station (22.54°S, 115.5°E). Wind data are from the National Centers for Environmental Prediction (NCEP)/National Center for Atmospheric Research (NCAR) Reanalysis (1981-2010) (https://psl.noaa.gov/) (Kalnay et al., 1996); Precipitation data in (a, b) are derived from the Climate Prediction Center Merged Analysis of Precipitation (1981-2010) (https://psl.noaa.gov/) (Xie and Arkin, 1997); The river discharge data in (c, d) are available at https://gisday.sr.unh.edu/html/Indexes/index_aus.html; Monthly mean precipitation data in (c, d) are from http://www.bom.gov.au/. White stars indicate the location of Core SO18567; Grey, green and red dots in (a, b) indicate stations of Nanutarra, Jimbegnyinoo Pool and Wallal Downs.
Core SO18567 (113.06°E; 19.52°S; water depth: 1130 m) was retrieved off northwestern Australia during R/V Sonne cruise 257 WACHEIO in 2017 (Figure 1) (Kuhnt et al., 2018). A total of 137 sediment samples were taken at 1 cm interval between 11 and 148 cm. The processing of sediment samples was carried out at the Marine Elements Analysis Laboratory of the Department of Geology, Northwest University, China. Samples were weighed, dried in an oven at 55°C, weighed, disaggregated by soaking in water, and then wet sieved over a 63 μm screen. Residues were transferred to filter paper of known weight, dried in an oven at 55°C, weighed and sieved into four size fractions: 63-150 μm, 150-250 μm, 250-355 μm and >355 μm.
Approximately 800 well-preserved tests (around 10 mg) of the planktonic foraminifera Globigeriniodes ruber were picked from the 250-355 µm and >355 μm size fractions for accelerator mass spectrometry (AMS) radiocarbon dating. Samples were analyzed at the Xi’an AMS center at Institute of Earth Environment, Chinese Academy of Sciences, and at the Beta analytic testing laboratory (Table 1). Conventional radiocarbon ages were converted to calendar ages using the Marine Radiocarbon Age Calibration Curve Marine20 (Heaton et al., 2020) with variable reservoir ages correction (ΔR), based on the estimates of Schröder et al. (2016) and Sarnthein et al. (2020).
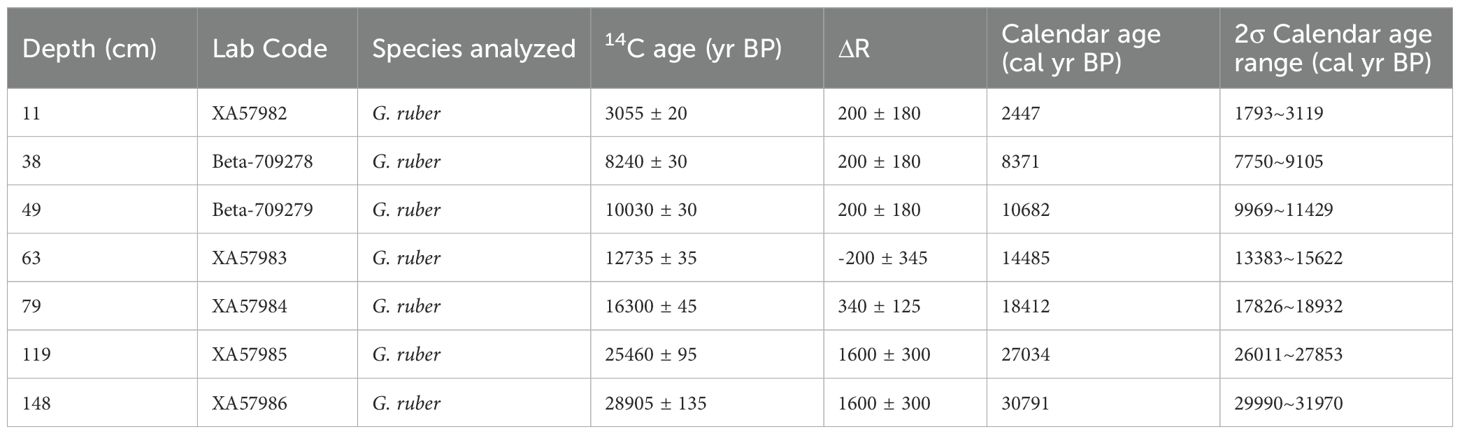
Table 1. Radiocarbon datings from shells of G. ruber in Core SO18567.
For Mg/Ca analysis, approximately 30 tests of G. ruber (white, sensu stricto), recording annual average hydrological conditions of sea surface (0-50m) in the tropical eastern Indian Ocean (Zhang et al., 2019), were picked from the 250-355 μm size fraction. All tests were checked for cement encrustations and infillings and were crushed using smooth glass plates under microscope. Then, crushed tests were cleaned following the procedure with a reductive step (Rosenthal et al., 1997; Martin and Lea, 2002; Barker et al., 2003) and analyzed on an Agilent 5110 inductively coupled plasma optical emission spectrometer in Marine Elements Analysis Laboratory at Department of Geology, Northwest University, China.
The machine drift and precision were monitored by using the certified reference material ECRM 752‐1 (Greaves et al., 2008), which was routinely measured after every eleventh sample. The long-term (2019-2024) precision of the instrument is better than 2%. The average reproducibility of Mg/Ca ratio is ± 0.15 mmol/mol based on 12 randomly selected replicate samples. Fe/Ca, Al/Ca and Mn/Ca were measured with Mg/Ca to evaluate the cleaning efficacy. The non-linear correlation of Fe/Ca, Al/Ca and Mn/Ca with Mg/Ca indicates that the contaminations, including clay, organic matters and metal oxides, were effectively removed. Mg/Ca ratios were converted into SSTs using the multispecies calibrated equation (Anand et al., 2003). The uncertainty (1σ) of SST is ~1.1°C, which was estimated by propagating the errors from Mg/Ca measurements, following the method of Mohtadi et al. (2014).
Approximately 10 tests of G. ruber were picked from the 250-355 μm size fractions and crushed into fragments under a microscope. Crushed tests were cleaned in ethanol in an ultrasonic bath, dried at 55°C and transferred to Kiel IV carbonate device to react with orthophosphoric acid (99% H3PO4) at 70°C for CO2 preparation. The generated CO2 was transferred to Thermo Scientific MAT 253Plus mass spectrometer for stable oxygen isotope analysis in Paleoceanography and Palaeotemperature Laboratory at Department of Geology, Northwest University, China. The precision is better than ±0.09‰ based on performance of the International Atomic Energy Agency (IAEA) 603 carbonate standard materials. Results were calibrated using the IAEA-603 and reported on the Vienna Pee Dee Belemnite (VPDB) scale. Replicate measurements on 10 randomly selected samples show an average reproducibility of ±0.12‰ for δ18O.
Surface water δ18O (δ18Osw) was calculated from paired Mg/Ca-derived temperature and δ18O of G. ruber using the equation (Hut, 1987; Bemis et al., 1998). Local surface water δ18Osw (δ18Osw-c) was calculated by deducting the signal of global ice volume from the δ18Osw (Waelbroeck et al., 2002). The uncertainty (1σ) of δ18Osw-c is ~0.27‰, which was estimated by propagating the errors from δ18O and Mg/Ca measurements, following the method described in Mohtadi et al. (2014).
The RAMPFIT, a general tool for change point detection in paleo-oceanographic and -climatological time series, was utilized to quantify the initial changes in the proxy records (Mudelsee, 2000). RAMPFIT fitting procedure determines the magnitude of the transition by weighted least square regression and detects start and end points by a brute-force search (systematically enumerating all possible candidates) within given parameters. In this process, the time-dependent standard deviation serves as weights for the least square regression. RAMPFIT calculates the uncertainty for the transition timing by employing block bootstrap resampling (Mudelsee, 2000). To obtain the resulting 1σ error, we set the number of replicates of the ramp regression fit to 2000.
The age-depth relationship for Core SO18567 was modeled by the Bacon software (Version 3.3.0, Blaauw and Christen, 2011) based on seven AMS14C ages (Figure 3). The age model shows that sediments between 11 and 148 cm from Core SO18567 retrace the palaeoceanographic history of the northwestern Australian margin between 30.79 and 2.45 ka with a temporal resolution of ~206 yr. Sedimentation rate varies between 3.67 cm/kyr and 7.71 cm/kyr with an average of ~4.85 cm/kyr.
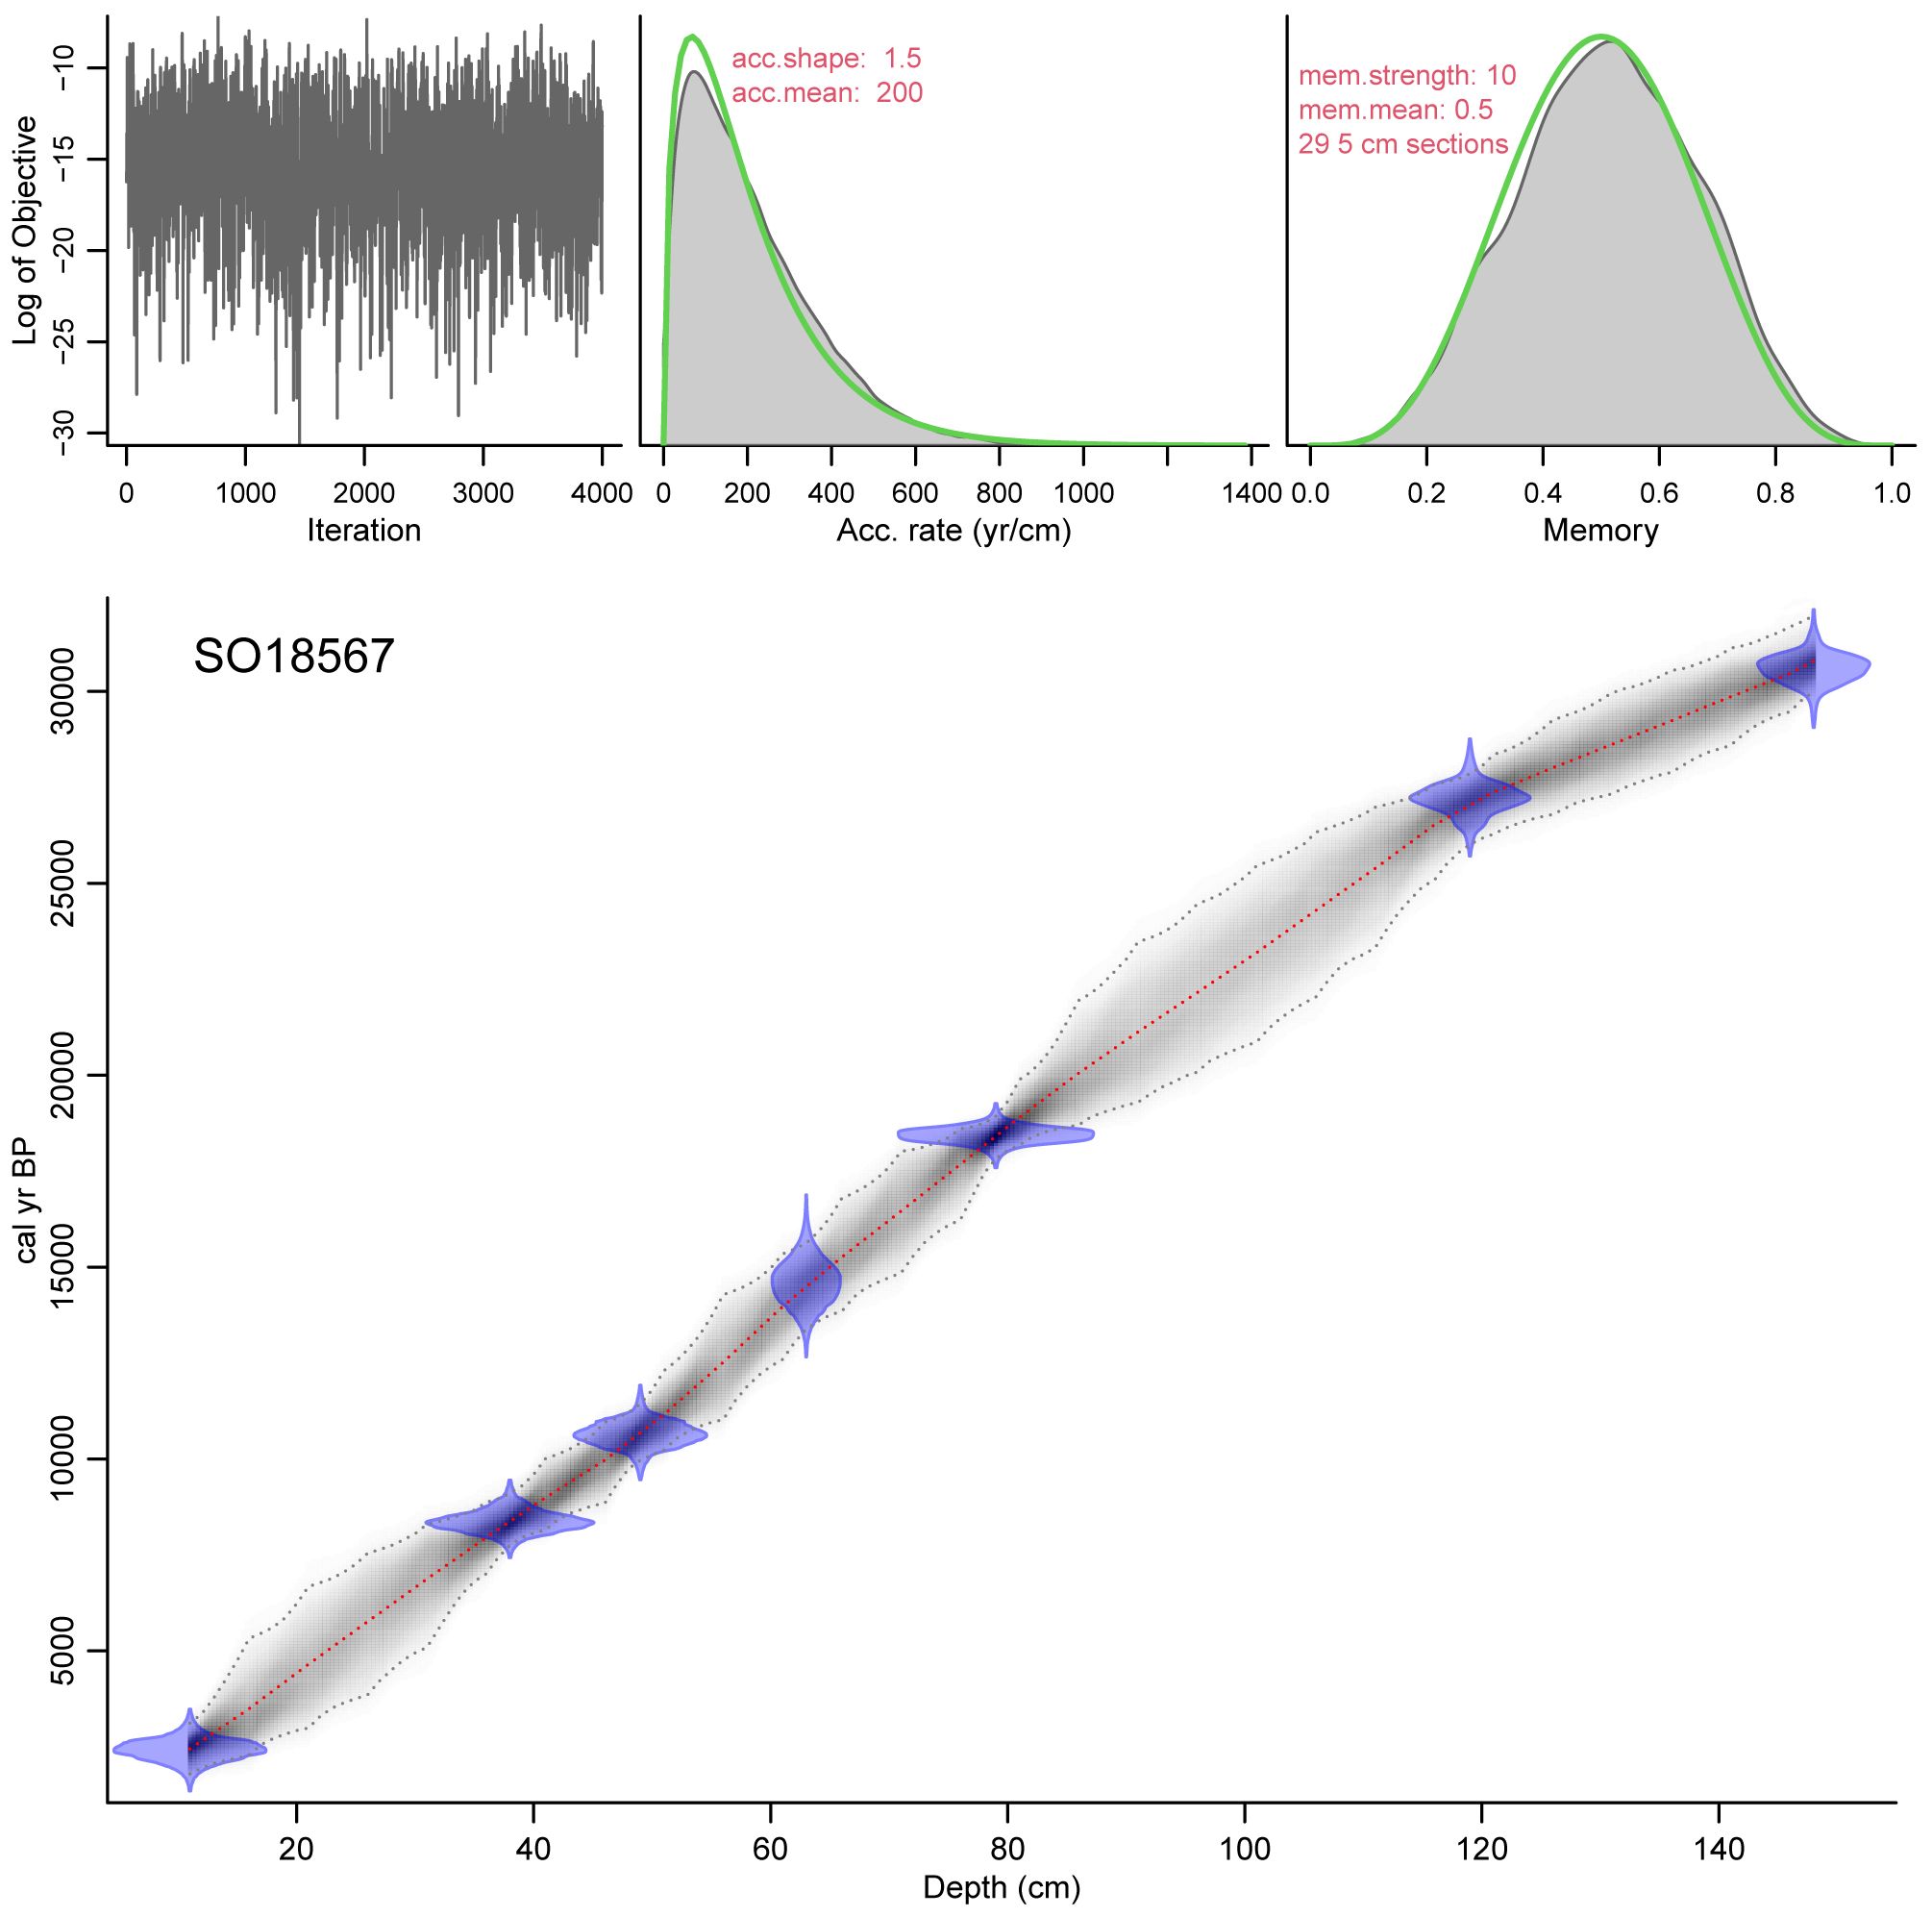
Figure 3. Bacon age-depth model of Core SO18567 (Blaauw and Christen, 2011). acc.shape: shape parameter of accumulation rate; acc.mean: mean of accumulation rate; mem.strength: strength of memory parameter; mem.mean: mean of memory parameter.
G. ruber Mg/Ca varies between 3.22 and 4.52 mmol/mol during the past 31 kyr, equivalent to a SST range of 23.73-27.50°C (Figure 4a). SST is relatively stable at around 24.5°C from 31 to 19 ka. By contrast, there is a rapid increase of SST with a large amplitude variability of 3.5°C between 19 and 11 ka. Meanwhile, SST exhibits two distinct millennial-scale increases at 18-15 ka and 13-11 ka. After 11 ka, SST tends to be stable. The average SST during the Holocene is 26.75°C, which is close to the modern annual average of 26.25°C at the location of Core SO18567 (Locarnini et al., 2024).
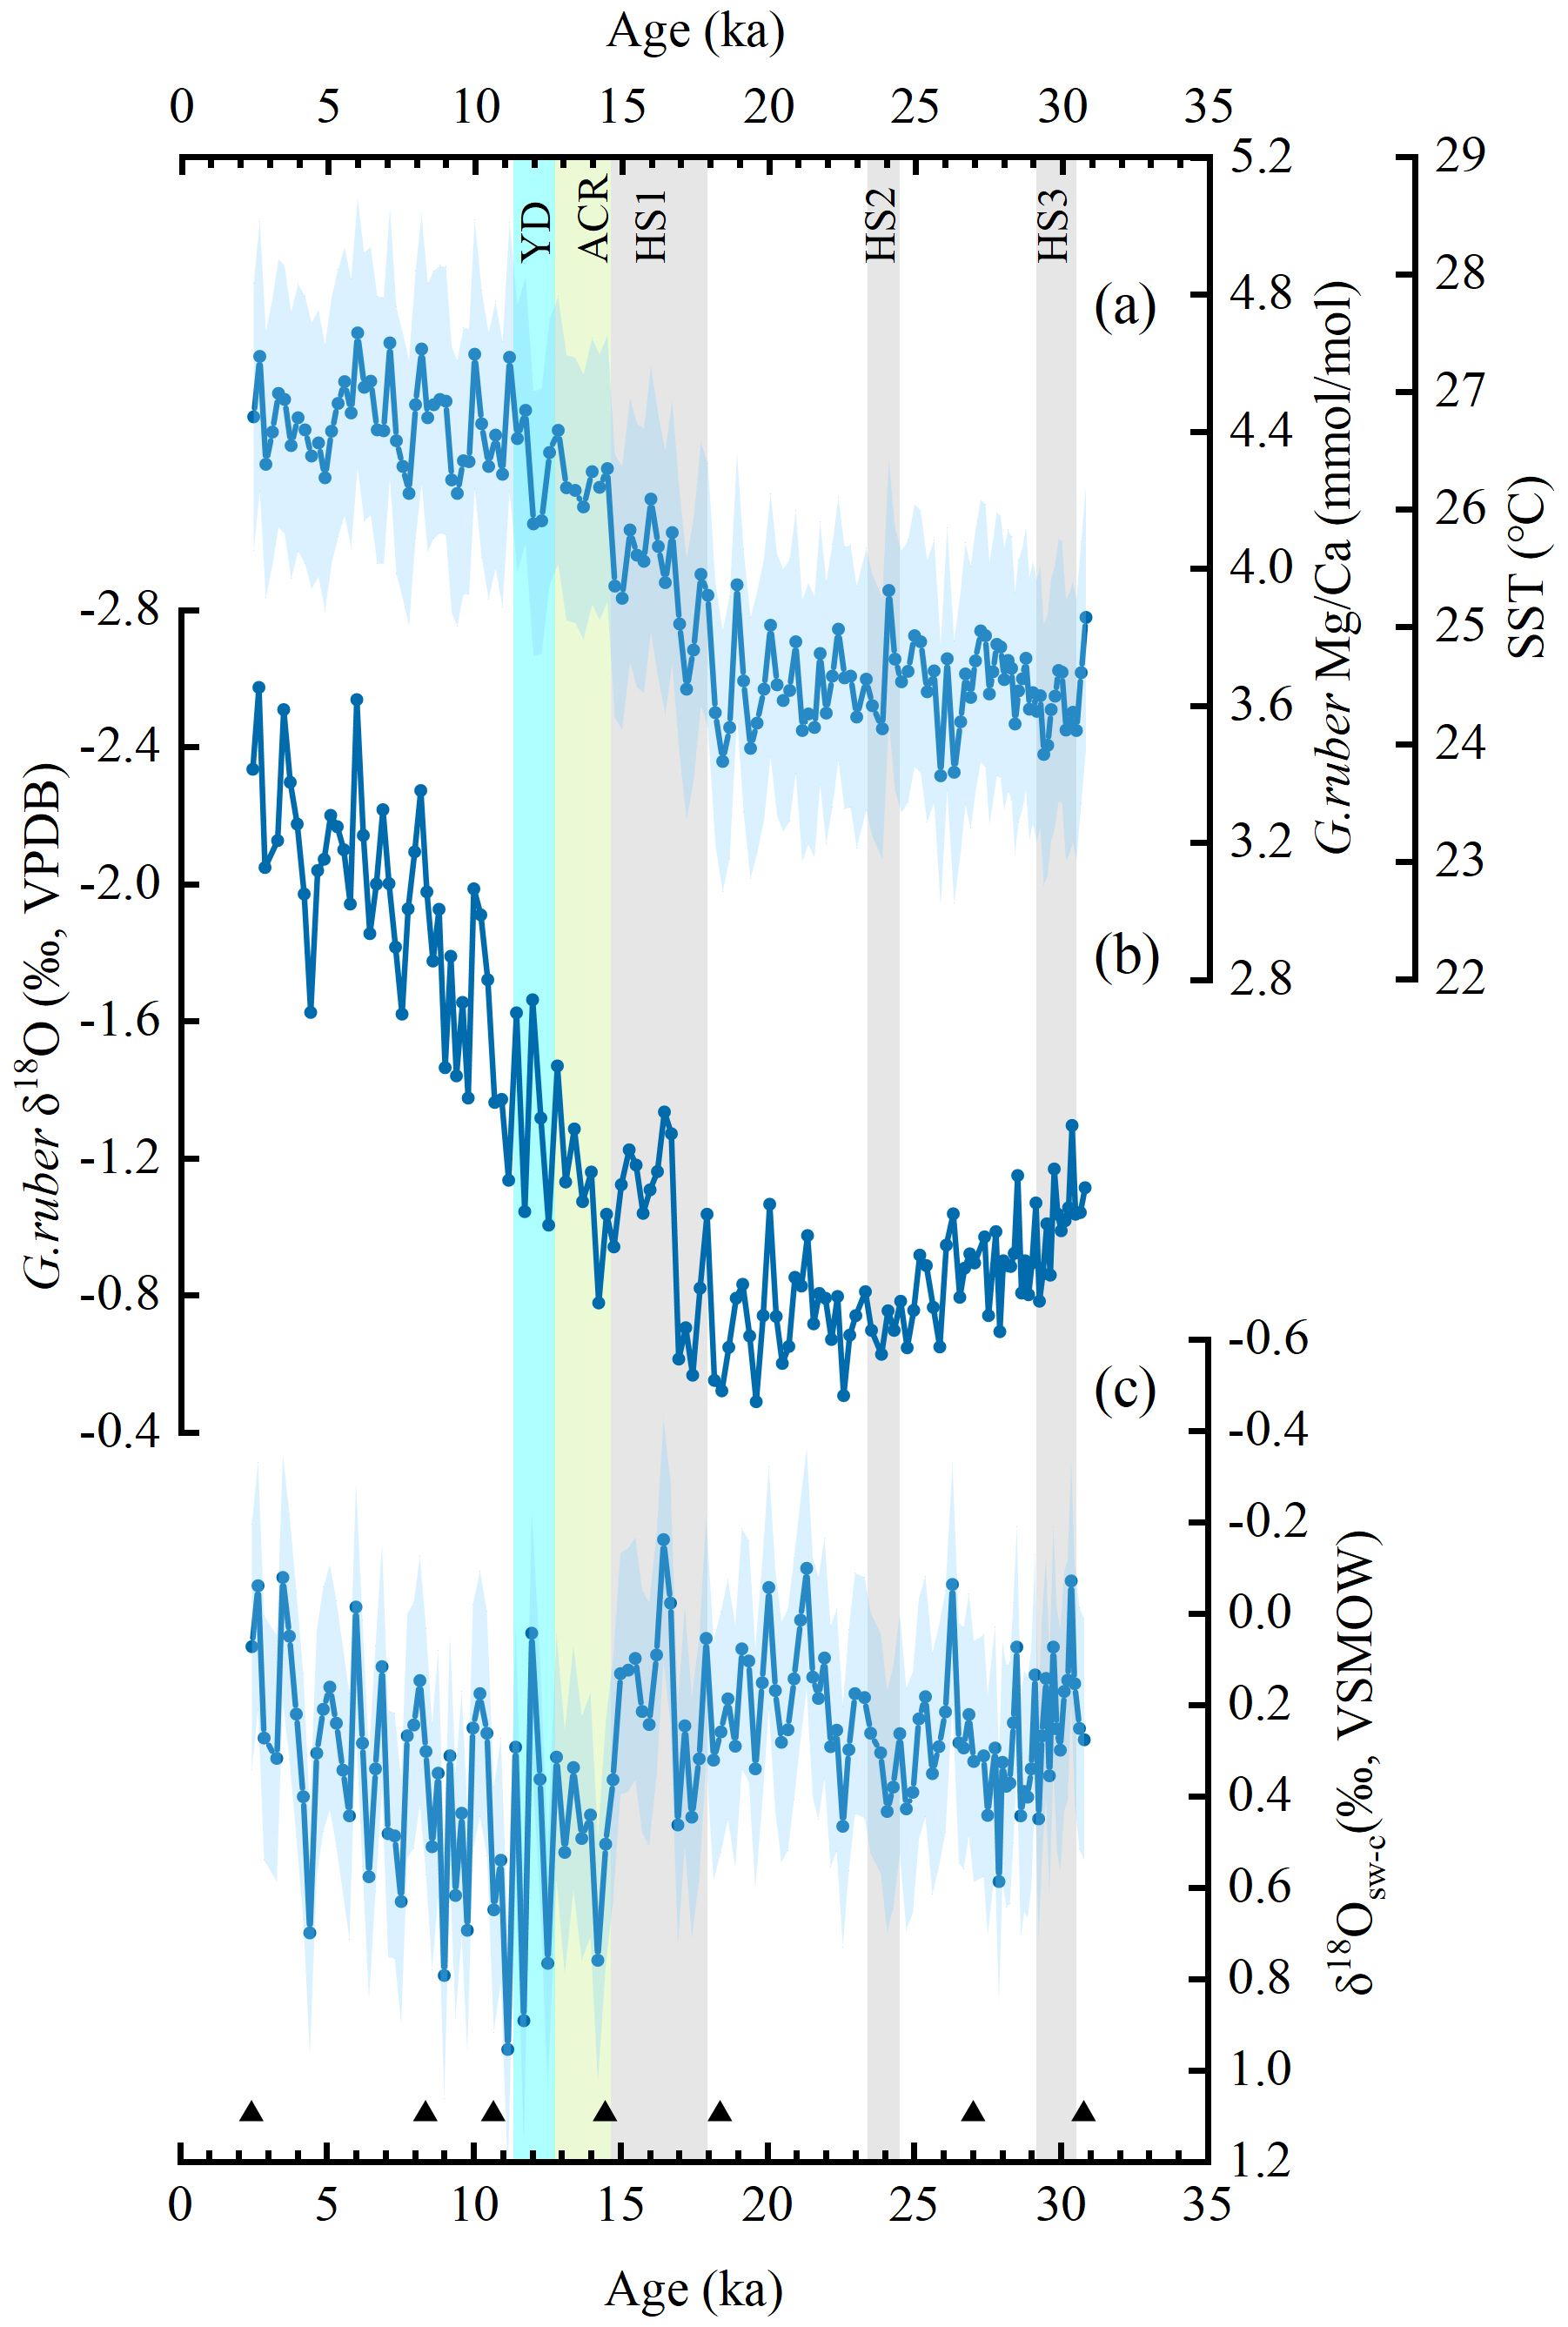
Figure 4. Proxy records of Core SO18567. (a) G ruber Mg/Ca and estimated SST; (b) δ18O of G ruber; (c) Ice volume corrected surface water δ18O (δ18Osw-c). Grey bars indicate the Heinrich Stadial 1 (HS1), HS2 and HS3; Green bar marks the Antarctic Cold Reversal (ACR); Blue bar marks the Younger Dryas (YD); Black triangles indicate the AMS 14C age control points for Core SO18567. Envelopes in (a, c) indicate 1s errors in estimations of SST and δ18Osw-c, equivalent to ~1.1°C and ~0.27‰, respectively.
G. ruber δ18O exhibits a prominent glacial-interglacial contrast with values ranging from -0.49 ‰ to -2.58 ‰ over the studied interval (Figure 4b). δ18O becomes gradually enriched from 31 to 18 ka. From 18 to 11 ka, δ18O becomes rapidly depleted from -0.55‰ to -1.37‰ with two discernible millennial-scale decreases at 18-15 ka and 13-11 ka. After 11 ka, δ18O continues to rapidly decrease from -1.37‰ to -2.58‰ until the late Holocene.
δ18Osw-c ranges from -0.16 ‰ to 0.95 ‰ since 31 ka (Figure 4c). It displays frequent fluctuations between 31 and 18 ka. As for G. ruber δ18O, δ18Osw-c exhibits two distinct millennial-scale decreases at 18-15 ka and 13-11 ka, when it increases from 0.32‰ to 0.95‰. Since 11 ka, it gradually decreases until the late Holocene.
SST and δ18Osw-c at the location of Core SO18567 exhibit two significant millennial-scale oscillations with increased SST and depleted δ18Osw-c at 18-15 ka and 13-11 ka (Figures 5a, d). With respect to SST, similar increases also occur in close by regions, for instance the Java-Sumatra upwelling region (Mohtadi et al., 2010, 2014) and Indonesian seas (Schröder et al., 2016, 2018) (Figures 5b, c). As for δ18Osw-c, a reverse situation happens in these regions, as δ18Osw-c becomes significantly enriched at 18-15 ka and 13-11 ka (Figures 5e, f). In previous studies, δ18Osw-c in the tropical eastern Indian Ocean was used to trace millennial-scale changes in SSS relating to regional precipitation (Levi et al., 2007; Holbourn et al., 2011; Mohtadi et al., 2010, 2014; Gibbons et al., 2014; Pei et al., 2021). Depleted δ18Osw-c offshore northwestern Australia at 18-15 ka and 13-11 ka may therefore reflect declined SSS due to increased regional precipitation (Figure 5d). This is supported by speleothem δ18O records of Ball Gown Cave from northwestern Australia (Denniston et al., 2013) and of Liang Luar Cave from Flores (Griffiths et al., 2009; Ayliffe et al., 2013), which indicate wet conditions at 18-15 ka and 13-11 ka (Figure 6c). By contrast, enriched δ18Osw-c in the Java-Sumatra upwelling region and Indonesian seas during the same time intervals denote increased SSS due to decreased regional precipitation (Figures 5e, f). The two millennial-scale oscillations in SST and δ18Osw-c correspond respectively to HS1 and YD, indicating that the Northern Hemisphere high latitudes may exert an important influence on surface hydrology along the northwestern Australian margin, the Java-Sumatra upwelling region and the Indonesian seas. We note that variations in SST and SSS during the two previous cold events HS2 and HS3, which are also present in our record, are similar to those during HS1 and the YD but less obvious (Figure 3).
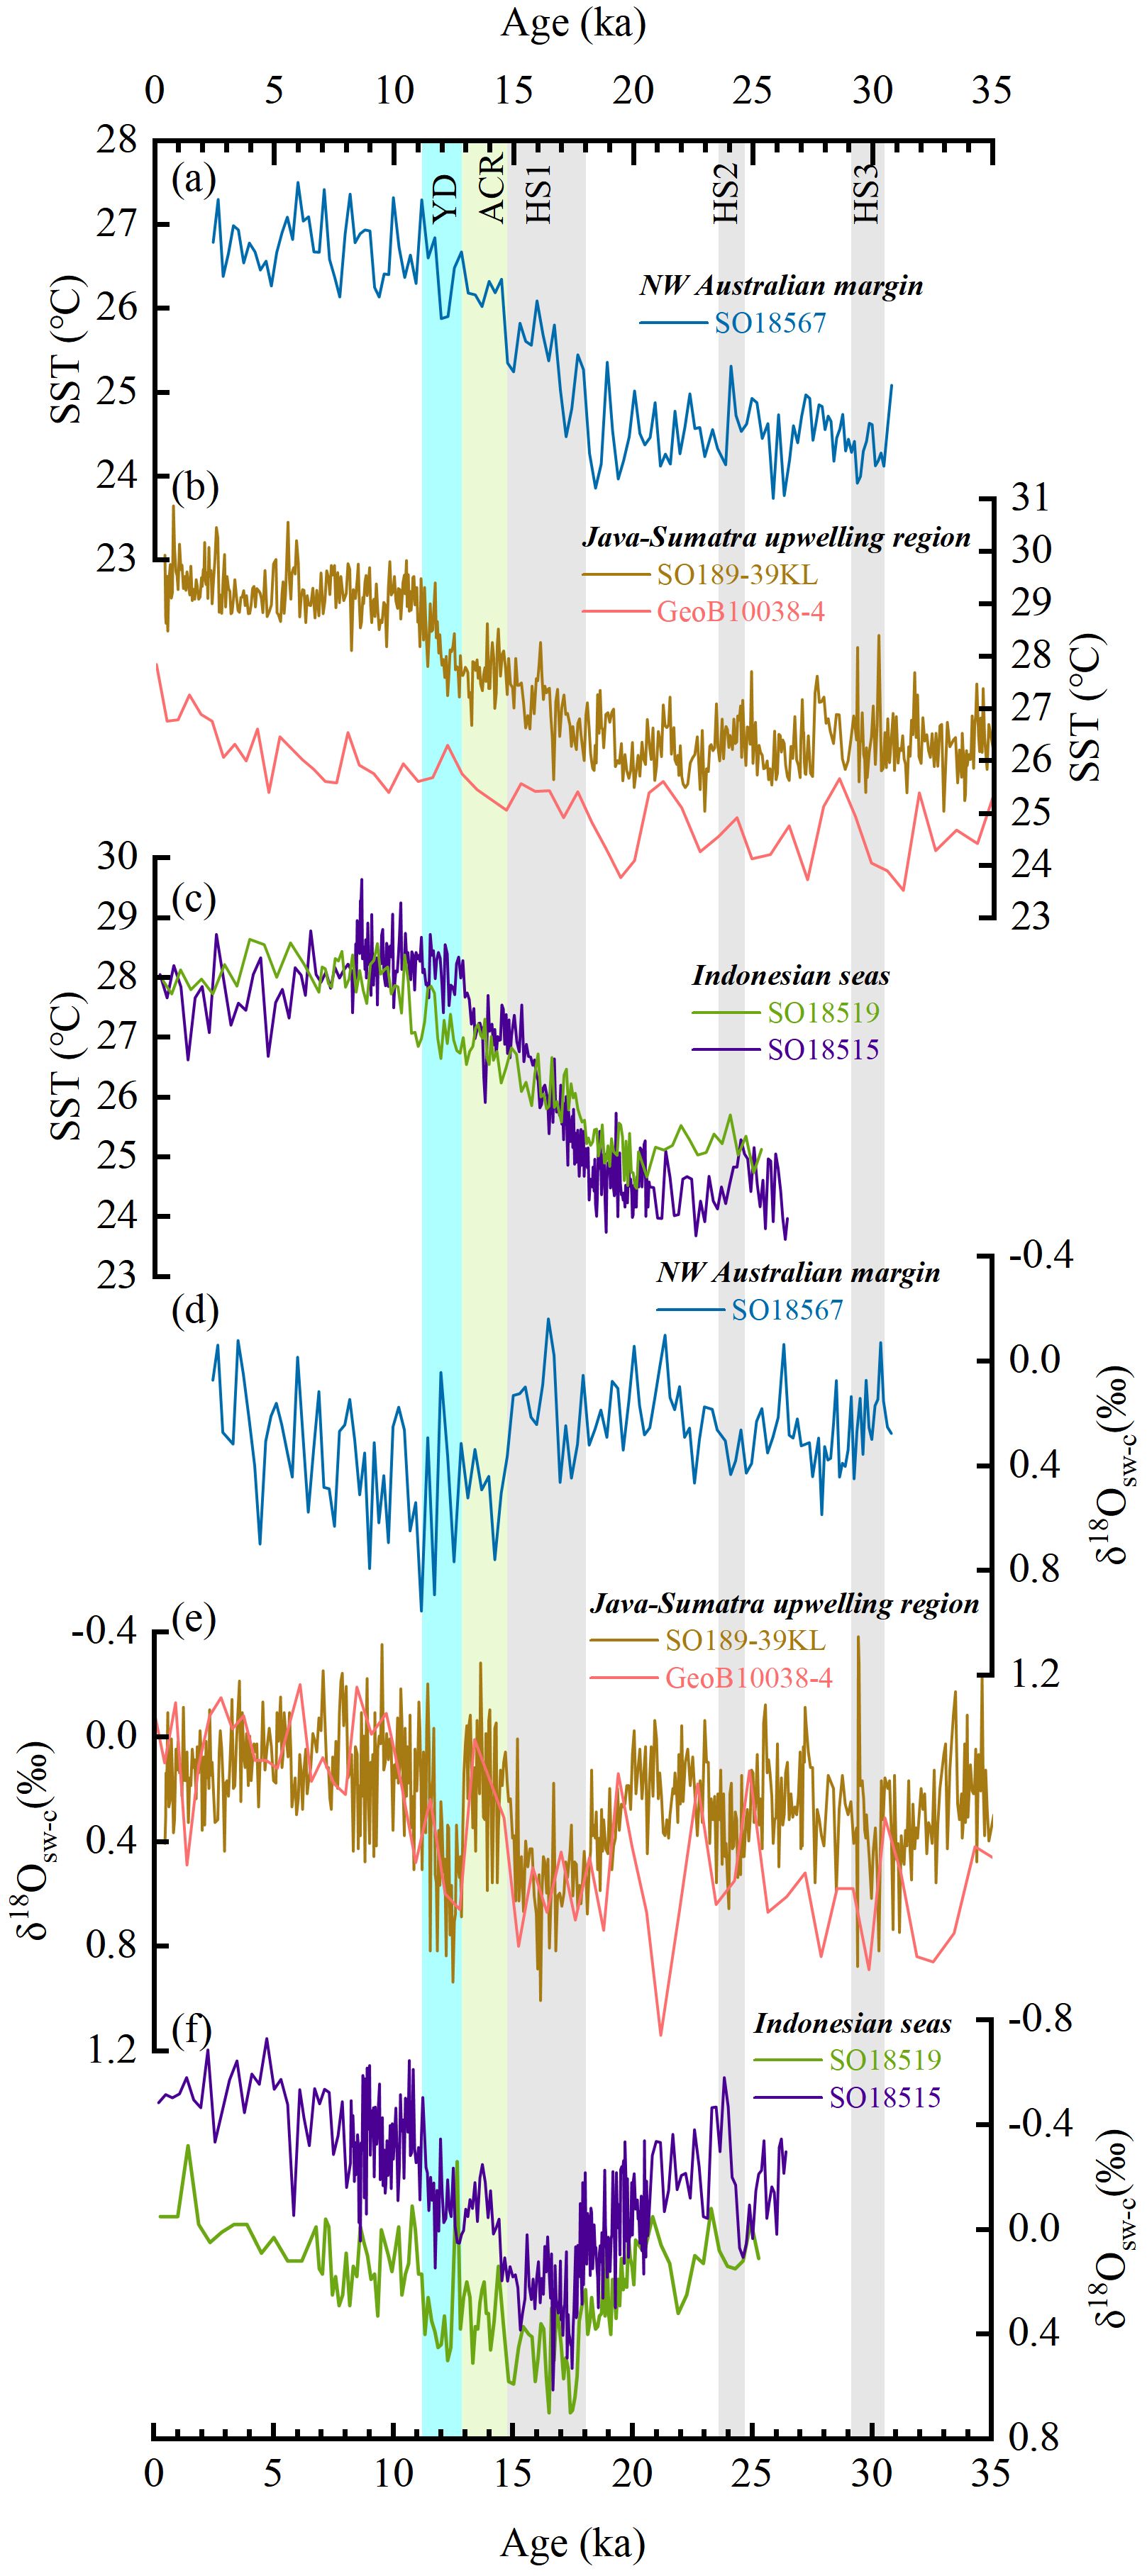
Figure 5. Comparison of SST and surface δ18Osw-c records from northwestern Australian margin, Java-Sumatra upwelling region and Indonesian seas. (a) SST record from Core SO18567 (this study); (b) SST records from Cores SO189-39KL (Mohtadi et al., 2014) and GeoB10038-4 (Mohtadi et al., 2010); (c) SST records from Cores SO18515 (Schröder et al., 2016) and SO18519 (Schröder et al., 2018); (d) Surface δ18Osw-c record from core SO18567 (this study); (e) Surface δ18Osw-c records from Cores SO189-39KL (Mohtadi et al., 2014) and GeoB10038-4 (Mohtadi et al., 2010); (f) Surface δ18Osw-c records from Cores SO18515 (Schröder et al., 2016) and SO18519 (Schröder et al., 2018). Grey bars indicate the HS1, HS2 and HS3; Green bar marks the ACR; Blue bar marks the YD.
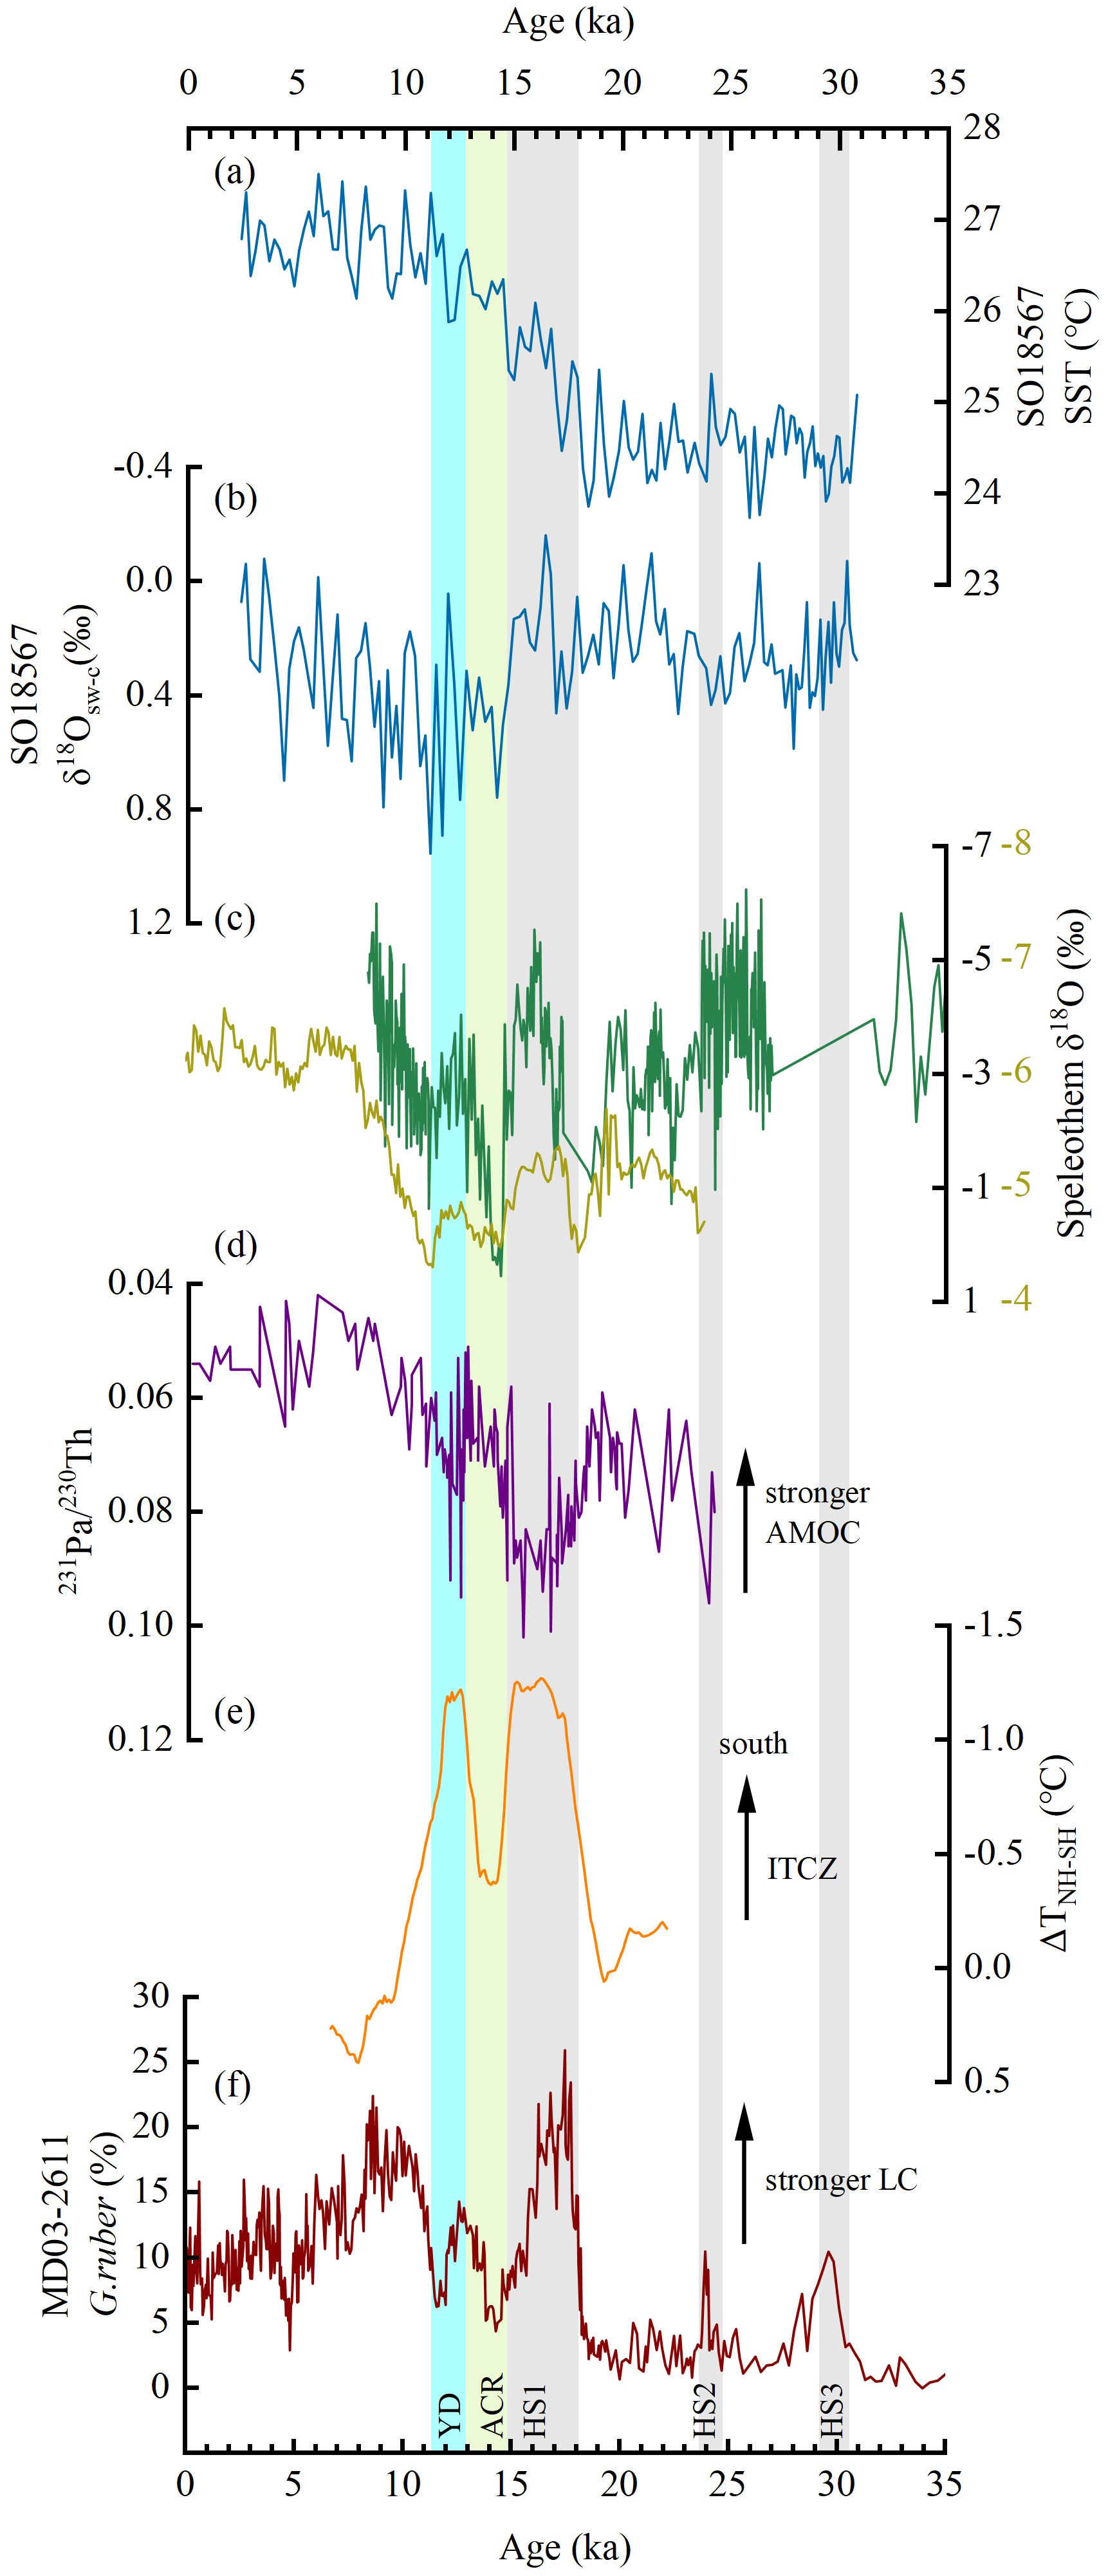
Figure 6. Comparison of SST and surface δ18Osw-c records from Core SO18567 with other paleo-climatological and -oceanographic records. (a) SST record from Core SO18567 (this study); (b) Surface δ18Osw-c record from Core SO18567 (this study); (c) Speleothem δ18O records from Ball Gown Cave (Denniston et al., 2013) and Liang Luar Cave (Ayliffe et al., 2013); (d) North Atlantic sediment 231Pa/230Th composite records from Cores JC094 and EW9209 (Ng et al., 2018); (e) Interhemispheric temperature gradient (ΔTNH-SH) record (Shakun et al., 2012); (f) Relative abundance of G ruber from Core MD03-2611 (De Deckker et al., 2012). Grey bars indicate the HS1, HS2 and HS3; Green bar marks the ACR; Blue bar marks the YD.
The stability of the AMOC depends on thermohaline forcing and the intensity of deepwater formation (Kuhlbrodt et al., 2007; Hofmann and Rahmstorf, 2009). Model studies showed that massive freshwater discharges from icebergs into the North Atlantic due to melting of Northern Hemisphere ice sheets led to reduced deepwater formation, further weakening the AMOC during HS1 and YD (Álvarez-Solas et al., 2011; Marcott et al., 2011; Ng et al., 2018) (Figure 6d). Hence, warm surface waters from the low latitudes were unable to reach the Northern Hemisphere high latitudes via the global ocean conveyor belt during HS1 and YD and would have accumulated in the Southern Hemisphere (Broecker, 1998; Denton et al., 2010; Clark et al., 2012; Shakun et al., 2012). As a result, SST along the northwestern Australian margin, in the Java-Sumatra upwelling region (Mohtadi et al., 2010, 2014) and Indonesian seas (Schröder et al., 2016, 2018) increased (Figures 5a–c). Moreover, the accumulated warm surface waters in the Southern Hemisphere would have increased the interhemispheric temperature gradient (ΔTNH-SH), in turn triggering the southward displacement of the ITCZ during HS1 and YD (Broccoli et al., 2006; Chiang and Friedman, 2012; Shakun et al., 2012; Gibbons et al., 2014) (Figure 6e). Therefore, precipitation decrease in the Java-Sumatra upwelling region and Indonesian seas (Figures 5e, f), while precipitation increased further south, including Flores and northwestern Australian margin (Figures 6b, c). This finding is supported by results from modelling experiments (Mohtadi et al., 2014) (Figure 7). It is worth noting that above-mentioned mechanism could also be used to explain the variations in SST and SSS during HS2 and HS3. Previous studies, however, suggested that AMOC collapse during HS2 and HS3 was less severe than during HS1 and the YD (Lippold et al., 2009; Böhm et al., 2015; Ng et al., 2018), in the Southern Hemisphere, thus leading to less obvious SST increases and SSS decreases.
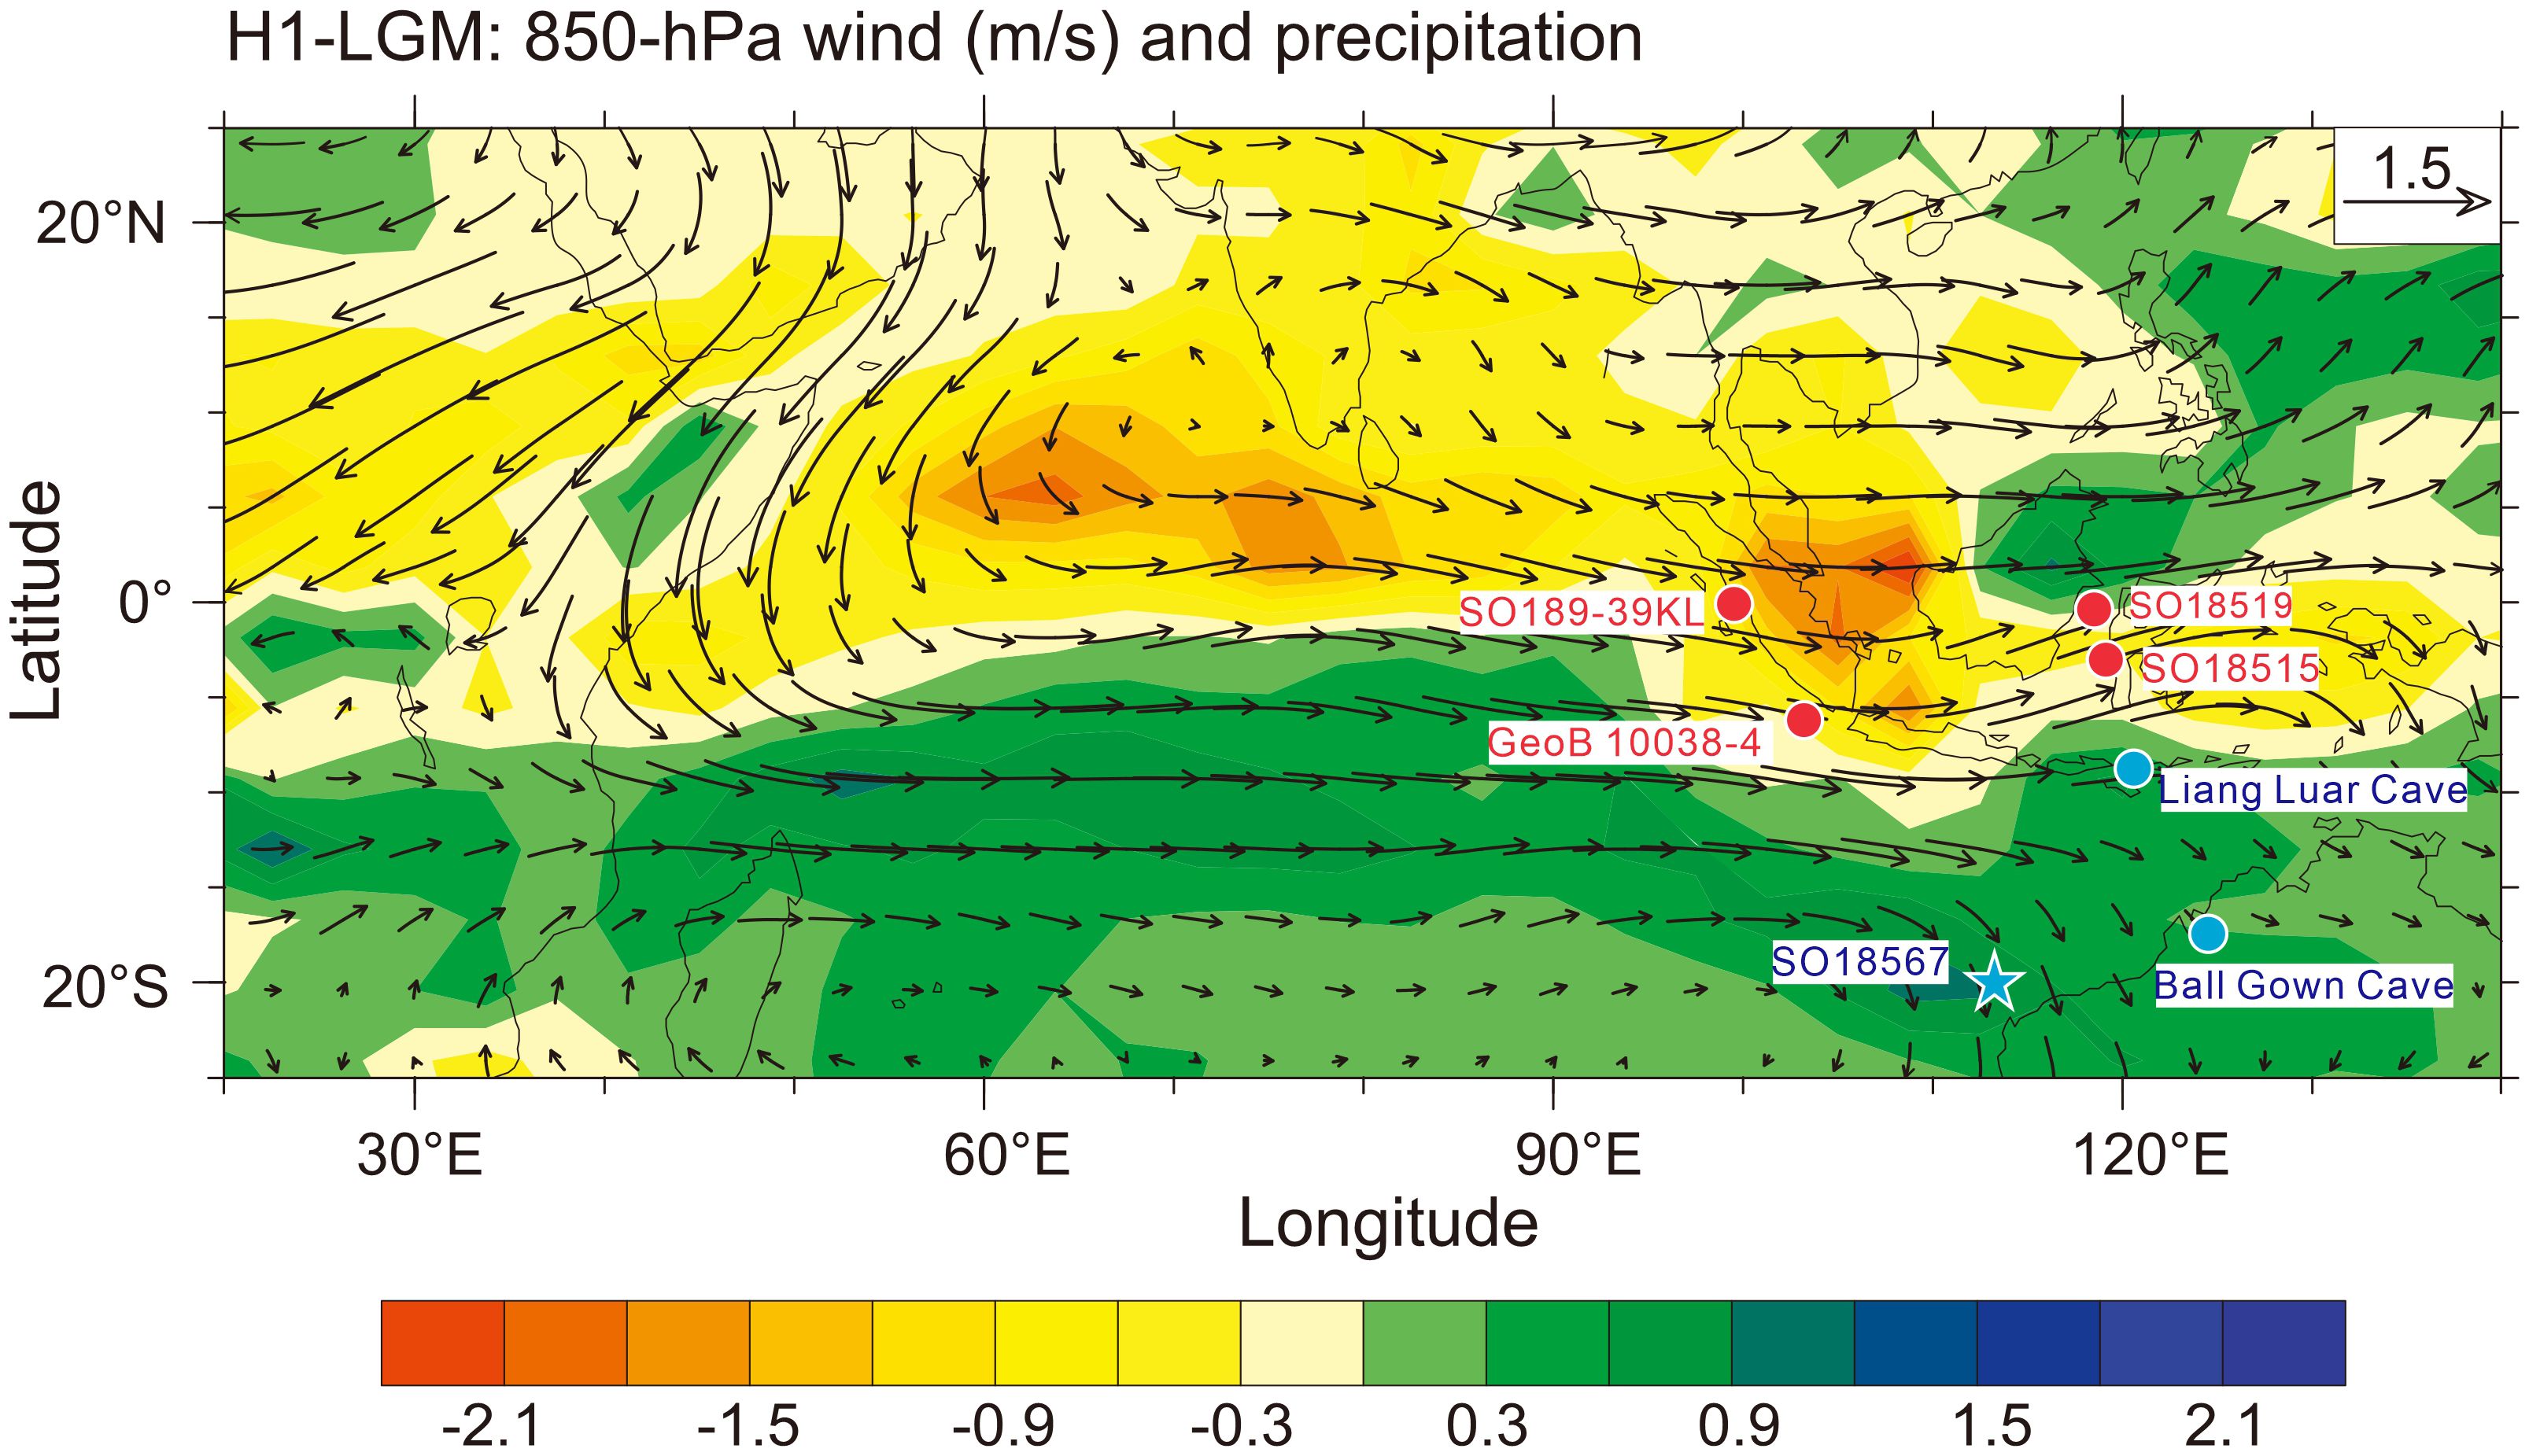
Figure 7. CCSM3 model results of Mohtadi et al. (2014) showing simulated Annual precipitation anomalies during the HS1. Blue symbols show sites indicating wet conditions during HS1 or the YD (Ayliffe et al., 2013; Denniston et al., 2013); and red symbols show sites with dry conditions during HS1 or the YD (Mohtadi et al., 2010, 2014; Schröder et al., 2016, 2018).
Paleoclimate records and model studies pointed out that a weakened AMOC would also result in southward migration of the Southern Hemisphere westerly winds (Lee et al., 2011; Denton et al., 2010; Hong et al., 2019; Perren et al., 2020), in turn promoting strengthening of the Leeuwin Current during HS1 and YD (De Deckker et al., 2012) (Figure 6f). Warmer and less-saline waters would be transported by the Leeuwin Current to our study site, leading to high SST and low SSS (Figures 6a, b). In addition, modern and paleo-oceanographic studies suggested that a strong Leeuwin Current transports moisture to northwestern Australia (Reason et al., 1999; Cresswell and Domingues, 2010; De Deckker et al., 2014; Stuut et al., 2014, 2019; Petrick et al., 2019). Thus, increased precipitation and runoff from the Fortescue and Ashburton Rivers (Figure 1) could also contribute to declined SSS off northwestern Australia during HS1 and YD (Figures 6b, c).
Statistical assessment of SST from Core SO18567 with RAMPFIT reveals that the onset of the last deglacial warming off northwestern Australia occurred at ~18.65 ± 0.33 ka (1σ) (Figure 8c). This is consistent with the results of previous studies from the adjacent regions. For instance, Sarnthein et al. (2011) pointed out that the last deglacial warming in the Timor Sea started at ~18.8 ka. Schröder et al. (2018) found that the initiation time of the last deglacial warming in the Indonesian seas was at ~19.2 ka ± 0.8 ka (1σ). Sea surface temperature stacks also showed that the last deglacial warming in low latitudes started at ~19 ka (Shakun et al., 2012). In contrast, the last deglacial rise in atmospheric CO2 concentration began at ~18.1 ± 0.23 ka (1σ) (Figure 8f) (Marcott et al., 2014). Thus, the CO2 rise obviously lagged the last deglacial warming in low latitudes.
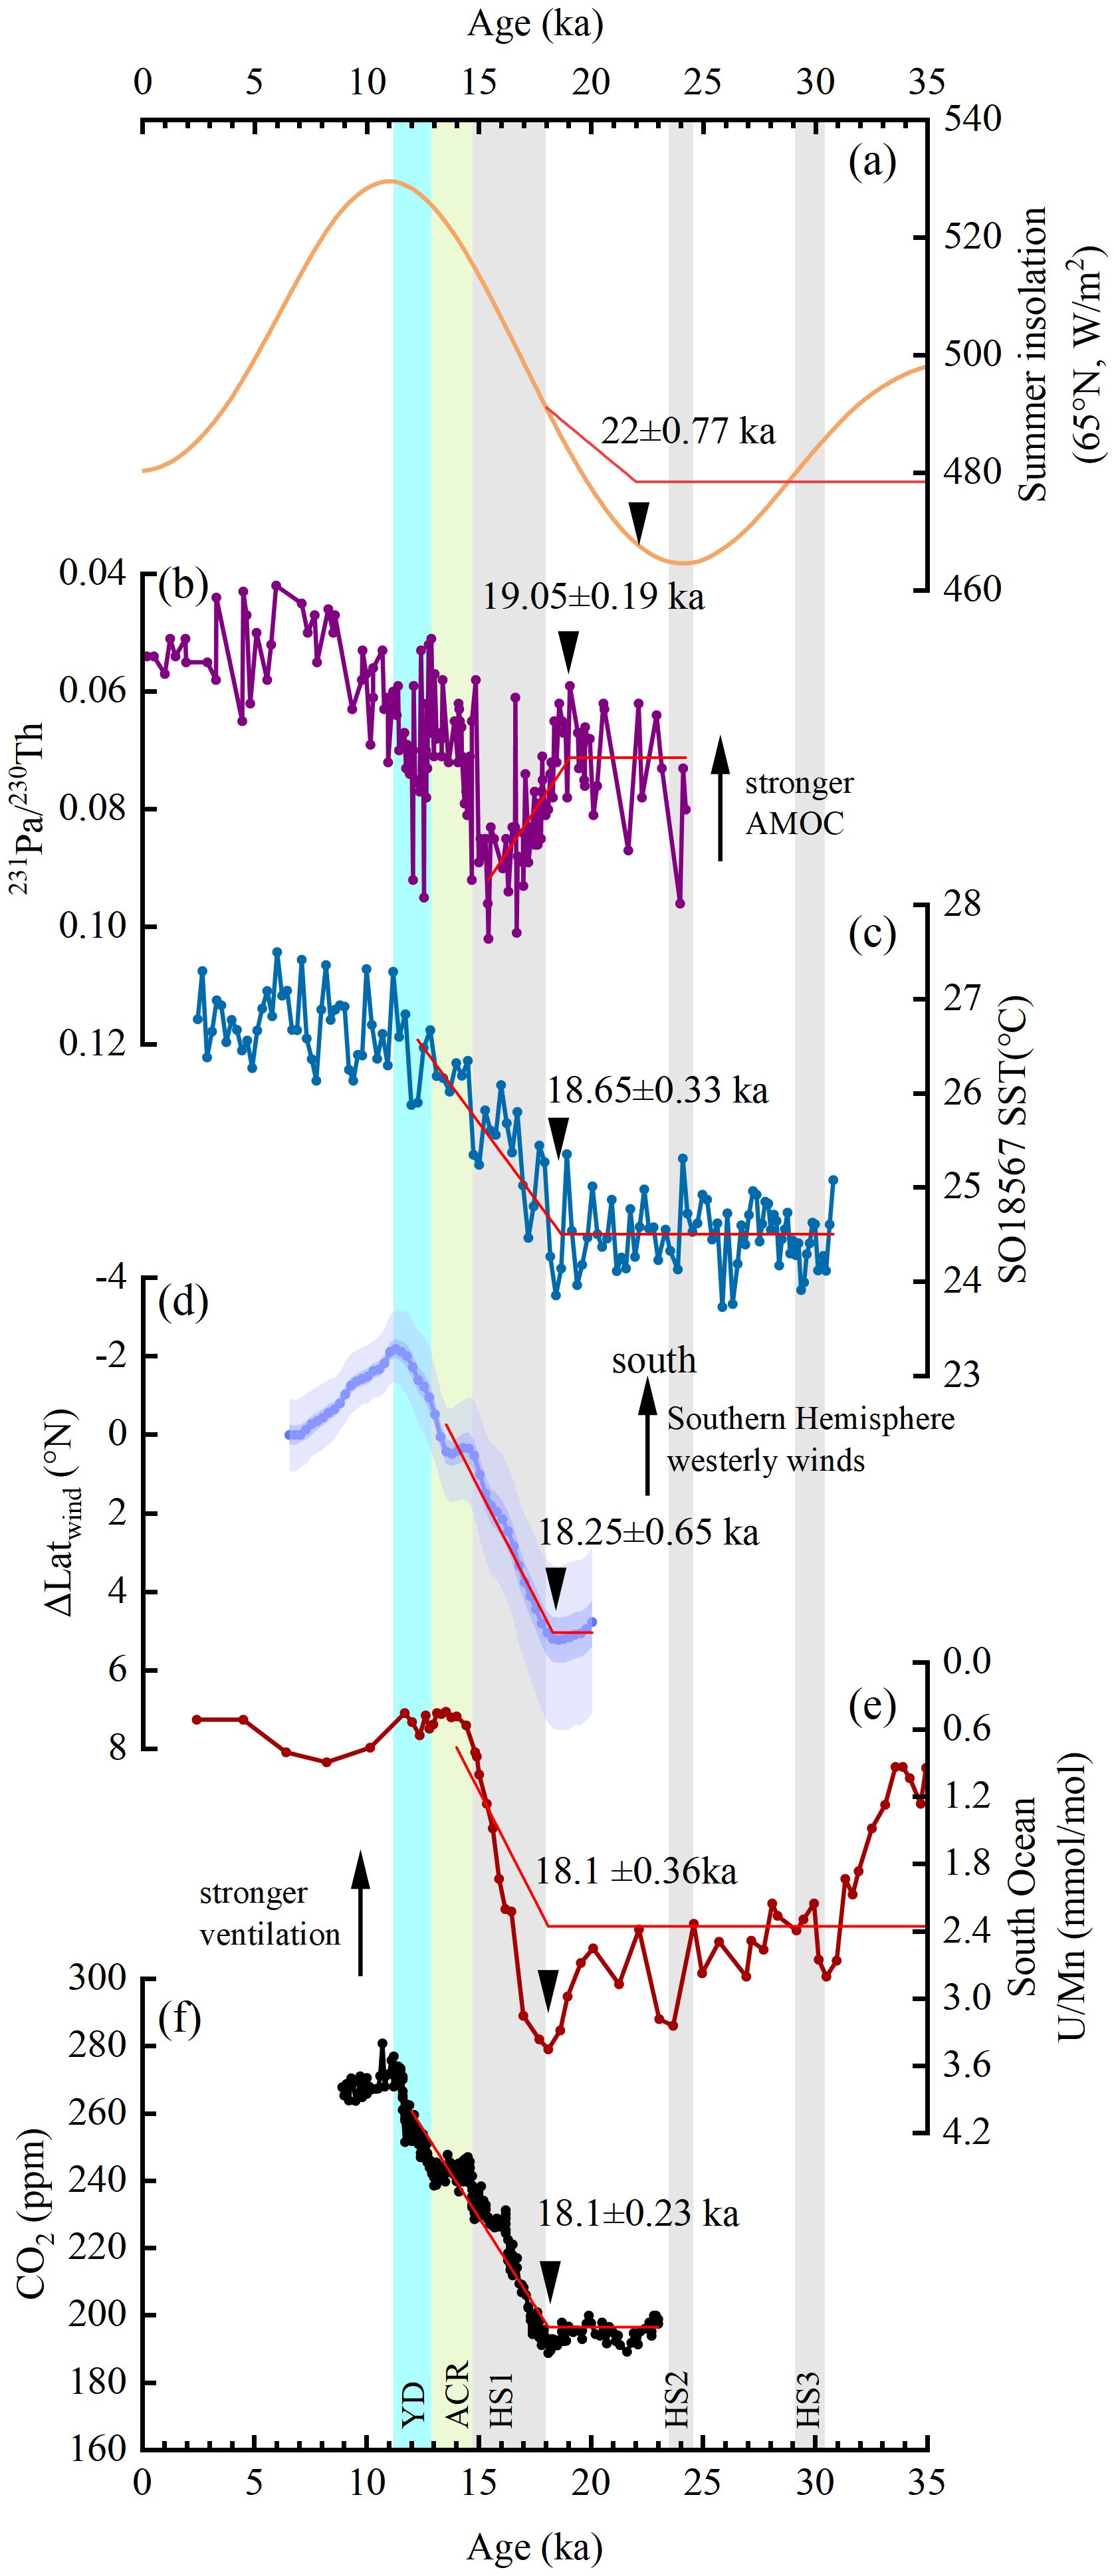
Figure 8. RAMPFIT-derived deglacial change points in various records. (a) 21st June insolation at 65°N (Laskar et al., 2004); (b) North Atlantic sedimentary 231Pa/230Th composite records from Cores JC094 and EW9209 (Ng et al., 2018); (c) SST from Core SO18567 (this study); (d) The latitudinal migration of Southern Hemisphere westerly winds (Gray et al., 2023); (e) Benthic foraminifera U/Mn record from the South Ocean (Gottschalk et al., 2016); (f) Atmospheric CO2 concentration (Marcott et al., 2014). Black triangles indicate statistical change points using RAMPFIT, red lines indicate ramp function fit curves (Mudelsee, 2000). Grey bars indicate the HS1, HS2 and HS3; Green bar marks the ACR; Blue bar marks the YD.
The phase relationships between the last deglacial warming in the low latitudes and the rise in atmospheric CO2 concentration have been widely discussed in previous studies (Stott et al., 2007; Sarnthein et al., 2011; Shakun et al., 2012; Mohtadi et al., 2014; Schröder et al., 2018; Pei et al., 2021). Some studies pointed out that the rise in atmospheric CO2 concentration led the last deglacial warming in low latitudes, suggesting that atmospheric CO2 concentration played a key role in the last deglacial warming in low latitudes (Rosenthal et al., 2003; Stott et al., 2007; Clark et al., 2012; Shakun et al., 2012). Our results show an opposite trend, implying that the last deglacial warming in low latitudes should be ascribed to other factors than the rise of atmospheric CO2 concentration. Paleoclimate records and model studies suggested a potential influence of the Northern Hemisphere high latitudes on the initiation of tropical warming during the last deglaciation (He et al., 2013; Jackson et al., 2019; Pei et al., 2021). Specifically, increased Northern Hemisphere high-latitude summer insolation warmed the Northern Hemisphere high latitudes (Figure 8a), leading to a reduced temperature gradient between the low latitudes and Northern Hemisphere high latitudes, in turn triggering weakening of the Hadley circulation (Jackson et al., 2019). As less heat was transferred from the low latitudes to the Northern Hemisphere high latitudes, this resulted in an earlier start of the last deglacial warming in the low latitudes (Figure 8C). Meanwhile, increased Northern Hemisphere high-latitude summer insolation also led to increased freshwater discharge from icebergs into the North Atlantic along with melting of Northern Hemisphere ice sheets (Clark et al., 2009; Umling et al., 2019) and weakening of the AMOC, which began at ~19.05 ± 0.19 ka (1σ) (Figures 8a, b) (Marcott et al., 2011; Ng et al., 2018). A weakened AMOC would hinder the transport of warm waters from the low latitudes to the Northern Hemisphere high latitudes, further promoting an earlier onset of the last deglacial warming in the low latitudes (Figure 8c).
Some studies suggested that tropical warming could result in a southward shift of Southern Hemisphere westerly winds (Ayliffe et al., 2013; Lee et al., 2011; Ceppi et al., 2013; Yang et al., 2020). The southward shift of Southern Hemisphere westerly winds at ~18.25 ± 0.65 ka (1σ) could be ascribed to the last deglacial warming in low latitudes (Figures 8c, d) (Gray et al., 2023). In addition, the southward shift of Southern Hemisphere westerly winds would have strengthened deep water ventilation in the Southern Ocean (Menviel et al., 2018; Wendt et al., 2024). Benthic foraminiferal U/Mn record from the Southern Ocean indicated that Southern Ocean deep water ventilation started to increase at ~18.1 ± 0.36 ka (1σ), which could be linked to a southward shift of Southern Hemisphere westerly winds (Figures 8d, e) (Gottschalk et al., 2016; Menviel et al., 2018; Wendt et al., 2024). Enhanced Southern Ocean ventilation would have promoted upwelling of carbon-rich waters (Ronge et al., 2016; Menviel et al., 2018; Wendt et al., 2024), releasing more CO2 into atmosphere (Anderson et al., 2009; Tschumi et al., 2011; Marcott et al., 2014). As a consequence, it has been proposed that atmospheric CO2 concentration began to rise at ~18.1 ± 0.23 ka (1σ) (Figure 8f v) and that subsequently CO2 became the dominant driver of global warming in the last deglaciation (Shakun et al., 2012). Following this argument, the earlier onset of the last deglacial warming in the low latitudes prior to the rise in atmospheric CO2 concentration can be explained.
In this study, we reconstructed millennial-scale records of SST and SSS in the tropical eastern Indian Ocean during the past ~31 kyr by analyzing Mg/Ca ratios and δ18O of the surface-dwelling foraminiferal species G. ruber from Core SO18567. By comparing these new data with published records, we found that the SST rise and SSS decline in the tropical eastern Indian Ocean could be ascribed to weakening of the AMOC due to melting of Northern Hemisphere ice sheets during HS1 and YD. Furthermore, our results indicate that the onset of the last deglacial warming in the low latitudes was likely induced by weakening of the Hadley circulation and AMOC due to warming of the North Hemisphere high latitudes. The last deglacial warming in low latitudes would have subsequently triggered a southward shift of Southern Hemisphere westerly winds, leading to enhanced ventilation of the Southern Ocean, which in turn would have caused a rise of atmospheric CO2 concentration.
The raw data supporting the conclusions of this article will be made available by the authors, without undue reservation.
RC: Formal Analysis, Investigation, Methodology, Visualization, Writing – original draft, Writing – review & editing. PZ: Funding acquisition, Methodology, Project administration, Resources, Supervision, Validation, Writing – original draft, Writing – review & editing. JX: Supervision, Validation, Writing – review & editing. AH: Supervision, Validation, Writing – review & editing. WK: Supervision, Validation, Writing – review & editing.
The author(s) declare that financial support was received for the research and/or publication of this article. This work was supported by the National Natural Science Foundation of China (grant number 42176076), the National Key Research and Development Program of China (grant number 2023YFF0803900), the State Key Laboratory of Marine Geology, Tongji University (grant number MGK202402) and the Youth Innovation Team of Shaanxi Universities.
We appreciate the shipboard members and crew of the cruise SO257 WACHEIO for their support in retrieving sediment cores. We are grateful to Renjie Pei for sampling Core SO18567. We thank two reviewers for constructive comments that helped us to improve the manuscript.
The authors declare that the research was conducted in the absence of any commercial or financial relationships that could be construed as a potential conflict of interest.
The author(s) declare that no Generative AI was used in the creation of this manuscript.
All claims expressed in this article are solely those of the authors and do not necessarily represent those of their affiliated organizations, or those of the publisher, the editors and the reviewers. Any product that may be evaluated in this article, or claim that may be made by its manufacturer, is not guaranteed or endorsed by the publisher.
Abram N. J., Hargreaves J. A., Wright N. M., Thirumalai K., Ummenhofer C. C., England M. H. (2020). Palaeoclimate perspectives on the Indian ocean dipole. Quaternary Sci. Rev. 237. doi: 10.1016/j.quascirev.2020.106302
Adler R. F., Huffman G. J., Chang A., Ferraro R., Xie P.-P., Janowiak J., et al. (2003). The version-2 global precipitation climatology project (GPCP) monthly precipitation analysis, (1979–present). J. Hydrometeorology 4, 1147–1167. doi: 10.1175/1525-7541(2003)004<1147:TVGPCP>2.0.CO;2
Akhir M. F., Pattiaratchi C., Meuleners M. (2020). Dynamics and seasonality of the Leeuwin Current and the surrounding counter-current system in the region south of Western Australia. J. Mar. Sci. Eng. 8, 552. doi: 10.3390/jmse8080552
Álvarez-Solas J., Montoya M., Ritz C., Ramstein G., Charbit S., Dumas C., et al. (2011). Heinrich event 1: an example of dynamical ice-sheet reaction to oceanic changes. Climate Past 7, 1297–1306. doi: 10.5194/cp-7-1297-2011
Anand P., Elderfield H., Conte M. H. (2003). Calibration of Mg/Ca thermometry in planktonic foraminifera from a sediment trap time series. Paleoceanography 18. doi: 10.1029/2002PA000846
Anderson R. F., Ali S., Bradtmiller L. I., Nielsen S. H. H., Fleisher M. Q., Anderson B. E., et al. (2009). Wind-driven upwelling in the Southern Ocean and the deglacial rise in atmospheric CO2. Science 323 (5920), 1443–1448. doi: 10.1126/science.116744
Ayliffe L. K., Gagan M. K., Zhao J., Drysdale R. N., Hellstrom J. C., Hantoro W. S., et al. (2013). Rapid interhemispheric climate links via the Australasian monsoon during the last deglaciation. Nat. Commun. 4, 2908. doi: 10.1038/ncomms3908
Barker S., Greaves M., Elderfield H. (2003). A study of cleaning procedures used for foraminiferal Mg/Ca paleothermometry. Geochemistry Geophysics Geosystems 4. doi: 10.1029/2003GC000559
Bemis B. E., Spero H. J., Bijma J., Lea D. W. (1998). Reevaluation of the oxygen isotopic composition of planktonic foraminifera: Experimental results and revised paleotemperature equations. Paleoceanography 13, 150–160. doi: 10.1029/98PA00070
Blaauw M., Christen J. A. (2011). Flexible paleoclimate age-depth models using an autoregressive gamma process. Bayesian Anal. 6, 457–474. doi: 10.1214/11-BA618
Böhm E., Lippold J., Gutjahr M., Frank M., Blaser P., Antz B., et al. (2015). Strong and deep Atlantic meridional overturning circulation during the last glacial cycle. Nature 517, 73–76. doi: 10.1038/nature14059
Broccoli A. J., Dahl K. A., Stouffer R. J. (2006). Response of the ITCZ to northern hemisphere cooling. Geophysical Res. Lett. 33, L01702. doi: 10.1029/2005GL024546
Broecker W. S. (1991). The great ocean conveyor. Oceanography 4, 79–89. doi: 10.5670/oceanog.1991.07
Broecker W. S. (1998). Paleocean circulation during the Last Deglaciation: A bipolar seesaw? Paleoceanography 13, 119–121. doi: 10.1029/97pa03707
Ceppi P., Hwang Y.-T., Liu X., Frierson D. M. W., Hartmann D. L. (2013). The relationship between the ITCZ and the Southern Hemispheric eddy-driven jet. J. Geophysical Research: Atmospheres 118, 5136–5146. doi: 10.1002/jgrd.50461
Chiang J. C. H., Friedman A. R. (2012). Extratropical cooling, interhemispheric thermal gradients, and tropical climate change. Annu. Rev. Earth Planetary Sci. 40, 383–412. doi: 10.1146/annurev-earth-042711-105545
Church J. A., Cresswell G. R., Godfrey J. S. (1989). “The leeuwin current,” in Poleward flows along eastern boundaries. (New York, NY: Springer), 230–254. doi: 10.1007/978-1-4613-8963-7_16
Clark P. U., Shakun J. D., Baker P. A., Bartlein P. J., Brewer S., Brook E., et al. (2012). Global climate evolution during the last deglaciation. Proc. Natl. Acad. Sci. 109, E1134–E1142. doi: 10.1073/pnas.1116619109
Clark P. U., Dyke A. S., Shakun J. D., Carlson A. E., Clark J.,, Wolfarth B., et al. (2009). The Last Glacial Maximum. Science 325(5941):710–714. doi: 10.1126/science.1172873
Cresswell G. R., Domingues C. M. (2009). The leeuwin current south of western Australia. J. R. Soc. Western Aust. 92, 83–100.
Cresswell G., Domingues C. (2010). “Leeuwin current,” in Encyclopedia of ocean sciences. (Amsterdam: Elsevier), 444–454. doi: 10.1016/B978-012374473-9.00597-X
De Deckker P., Barrows T. T., Rogers J. (2014). Land-sea correlations in the Australian region: Post-glacial onset of the monsoon in northwestern Western Australia. Quaternary Sci. Rev. 105, 181–194. doi: 10.1016/j.quascirev.2014.09.030
De Deckker P., Moros M., Perner K., Jansen E.. (2012). Influence of the tropicsand southern westerlies on glacial interhemispheric asymmetry. Nat. Geosci. 5, 266–269. doi: 10.1038/NGEO1431
Denniston R. F., Wyrwoll K.-H., Asmerom Y., Polyak V. J., Humphrey W. F., Cugley J., et al. (2013). North Atlantic forcing of millennial-scale Indo-Australian monsoon dynamics during the last glacial period. Quaternary Sci. Rev. 72, 159–168. doi: 10.1016/j.quascirev.2013.04.012
Denton G. H., Anderson R. F., Toggweiler J. R., Edwards R. L., Schaefer J. M., Putnam A. E. (2010). The last glacial termination. Science 328, 1652–1656. doi: 10.1126/science.1184119
Domingues C. M., Maltrud M. E., Wijffels S. E., Church J. A., Tomczak M. (2007). Simulated Lagrangian pathways between the Leeuwin Current System and the upper ocean circulation of the southeast Indian Ocean. Deep Sea Res. Part II 54, 797–817. doi: 10.1016/j.dsr2.2006.10.003
Donohoe A., Marshall J., Ferreira D., Mcgee D. (2013). The relationship between ITCZ location and cross equatorial atmospheric heat transport; from the seasonal cycle to the Last Glacial Maximum. J. Climate 26, 3597–3618. doi: 10.1175/JCLI-D-12-00467.1
Gibbons F. T., Oppo D. W., Mohtadi M., Rosenthal Y., Cheng J., Liu Z., et al. (2014). Deglacial δ18O and hydrologic variability in the tropical Pacific and Indian oceans. Earth Planetary Sci. Lett. 387, 240–251. doi: 10.1016/j.epsl.2013.11.032
Gordon A. L. (2005). Oceanography of the Indonesian seas and their throughflow. Oceanography 18, 14–27. doi: 10.5670/oceanog.2005.01
Gottschalk J., Skinner L. C., Lippold J., Vogel H., Frank N., Jaccard S. L., et al. (2016). Biological and physical controls in the Southern Ocean on past millennial-scale atmospheric CO2 changes. Nat. Commun. 7, 11539. doi: 10.1038/ncomms11539
Gray W. R., de Lavergne C., Wills R. C. J., Menviel L., Spence P., Holzer M., et al. (2023). Poleward shift in the Southern Hemisphere westerly winds synchronous with the deglacial rise in CO2. Paleoceanography Paleoclimatology 38, e2023PA004666. doi: 10.1029/2023PA004666
Greaves M., Caillon N., Rebaubier H., Bartoli G., Bohaty S., Cacho I., et al. (2008). Interlaboratory comparison study of calibration standards for foraminiferal Mg/Ca thermometry. Geochemistry Geophysics Geosystems 9, 1–27. doi: 10.1029/2008GC001974
Griffiths M. L., Drysdale R. N., Gagan M. K., Zhao J.-X., Ayliffe L. K., Hellstrom J., et al. (2009). Increasing Australian-Indonesian monsoon rainfall linked to early Holocene sea-level rise. Nat. Geosci. 2, 636–639. doi: 10.1038/ngeo605
Groisman P., Soja A. (2007). Northern Hemisphere high latitude climate and environmental change. Environ. Res. Lett. 2, 45008. doi: 10.1088/1748-9326/2/4/045008
He F., Shakun J. D., Clark P. U., Carlson A. E., Liu Z., Otto-Bliesner B. L., et al. (2013). Northern Hemisphere forcing of Southern Hemisphere climate during the last deglaciation. Nature 494, 81–85. doi: 10.1038/nature11822
Heaton T. J., Köhler P., Butzin M., Bard E., Reimer R. W., Austin W. E. N., et al. (2020). Marine20-the marine radiocarbon age calibration curve (0-55000 cal BP). Radiocarbon 62, 779–820. doi: 10.1017/RDC.2020.68
Heidemann H., Cowan T., Henley B. J., Ribbe J., Freund M., Power S. (2023). Variability and long-term change in Australian monsoon rainfall: A review. WIREs Climate Change 14, e823. doi: 10.1002/wcc.823
Hofmann M., Rahmstorf S. (2009). On the stability of the Atlantic meridional overturning circulation. Proc. Natl. Acad. Sci. U.S.A. 106, 20584–20589. doi: 10.1073/pnas.0909146106
Holbourn A., Kuhnt W., Xu J. (2011). Indonesian Throughflow variability during the last 140 ka: the Timor Sea outflow. Geological Society London Special Publications 355, 283–303. doi: 10.1144/SP355.14
Hong B., Rabassa J., Uchida M., Hong Y., Peng H., Ding H., et al. (2019). Response and feedback of the Indian summer monsoon and the Southern Westerly Winds to a temperature contrast between the hemispheres during the last glacial–interglacial transitional period. Earth-Science Rev. 197, 102917. doi: 10.1016/j.earscirev.2019.102917
Hut G. (1987). Consultants’ group meeting on stable isotope reference samples for geochemical and hydrological investigations. Int. Atomic Energy Agency (IAEA).
Jackson M. S., Kelly M. A., Russell J. M., Doughty A. M., Howley J. A., Chipman J. W., et al. (2019). High-latitude warming initiated the onset of the last deglaciation in the tropics. Sci. Adv. 5, eaaw2610. doi: 10.1126/sciadv
Kalnay E., Kanamitsu M., Kistler R., Collins W., Deaven D., Gandin L., et al. (1996). The NCEP/NCAR 40-year reanalysis project. Bull. Am. Meteorological Soc. 77, 437–471. doi: 10.1175/1520-0477(1996)077<0437:TNYRP>2.0.CO;2
Kershaw A. P., van der Kaars S., Moss P. T. (2003). Late Quaternary Milankovitch-scale climatic change and variability and its impact on monsoonal Australasia. Mar. Geology 201, 81–95. doi: 10.1016/S0025-3227(03)00210-X
Kuhlbrodt T., Griesel A., Montoya M., Levermann A., Hofmann M., Rahmstorf S. (2007). On the driving processes of the Atlantic meridional overturning circulation. Rev. Geophysics 45, RG2001. doi: 10.1029/2004rg000166
Kuhnt W., Holbourn A., Schönfeld J., Lindhorst K., Gallagher S., Keep M., et al. (2018). Cruise report sonne 257, WACHEIO - western Australian climate history from eastern Indian ocean sediment archives, darwin - fremantle, may 12, 2017-june 04, 2017.
Laskar J., Robutel P., Joutel F., Gastineau M., Correia A. C. M., Levrard B. (2004). A long-term numerical solution for the insolation quantities of the Earth. Astronomy Astrophysics 428, 261–285. doi: 10.1051/0004-6361:20041335
Lee S.-Y., Chiang J. C. H., Matsumoto K., Tokos K. S. (2011). Southern Ocean wind response to North Atlantic cooling and the rise in atmospheric CO2: Modeling perspective and paleoceanographic implications. Paleoceanography 26, PA1214. doi: 10.1029/2010PA002004
Levi C., Labeyrie L., Bassinot F., Guichard F., Cortijo E., Waelbroeck C., et al. (2007). Low-latitude hydrological cycle and rapid climate changes during the last deglaciation. Geochemistry Geophysics Geosystems 8. doi: 10.1029/2006GC001514
Lippold J., Grützner J., Winter D., Lahaye Y., Mangini A., Christl M. (2009). Does sedimentary 231Pa/230Th from the Bermuda Rise monitor past Atlantic Meridional Overturning Circulation? Geophysical Res. Lett. 36. doi: 10.1029/2009gl038068
Locarnini R. A., Mishonov A. V., Baranova O. K., Reagan J. R., Boyer T. P., Seidov D., et al. (2024). “World ocean atlas 2023, volume 1: temperature,” in NOAA atlas NESDIS 89. (Silver Spring, MD: National Oceanic and Atmospheric Administration (NOAA)). doi: 10.25923/54bh-1613
Marcott S. A., Bauska T. K., Buizert C., Steig E. J., Rosen J. L., Cuffey K. M., et al. (2014). Centennial-scale changes in the global carbon cycle during the last deglaciation. Nature 514, 616–619. doi: 10.1038/nature13799
Marcott S. A., Clark P. U., Padman L., Klinkhammer G. P., Springer S. R., Liu Z., et al. (2011). Ice-shelf collapse from subsurface warming as a trigger for Heinrich events. Proc. Natl. Acad. Sci. 108, 13415–13419. doi: 10.1073/pnas.1104772108
Martin P. A., Lea D. W. (2002). A simple evaluation of cleaning procedures on fossil benthic foraminiferal Mg/Ca. Geochemistry Geophysics Geosystems 3. doi: 10.1029/2001GC000280
McManus J. F., Francois R., Gherardi J.-M., Keigwin L. D., Brown-Leger S. (2004). Collapse and rapid resumption of Atlantic meridional circulation linked to deglacial climate changes. Nature 428, 834–837. doi: 10.1038/nature02494
Menviel L., Spence P., Yu J., Chamberlain M. A., Matear R. J., Meissner K. J., et al. (2018). Southern Hemisphere westerlies as a driver of the early deglacial atmospheric CO2 rise. Nat. Commun. 9, 2503. doi: 10.1038/s41467-018-04876-4
Meyers G., Bailey R. J., Worby A. P. (1995). Geostrophic transport of Indonesian throughflow. Deep Sea Res. Part I: Oceanographic Res. Papers 42, 1163–1174. doi: 10.1016/0967-0637(95)00037-7
Middleton J. F., Bye J. A. T. (2007). A review of the shelf-slope circulation along Australia’s southern shelves: Cape Leeuwin to Portland. Prog. Oceanography 75, 1–41. doi: 10.1016/j.pocean.2007.07.001
Mohtadi M., Prange M., Oppo D. W., De-Pol-Holz R., Merkel U., Zhang X., et al. (2014). North Atlantic forcing of tropical Indian Ocean climate. Nature 509, 76–80. doi: 10.1038/nature13196
Mohtadi M., Steinke S., Lückge A., Groeneveld J., Hathorne E. C. (2010). Glacial to Holocene surface hydrography of the tropical eastern Indian Ocean. Earth Planetary Sci. Lett. 292, 89–97. doi: 10.1016/j.epsl.2010.01.024
Mudelsee M. (2000). Ramp function regression: A tool for quantifying climate transitions. Comput. Geosciences 26, 293–307. doi: 10.1016/S0098-3004(99)00141-7
Muller J., McManus J. F., Oppo D. W., Francois R. (2012). Strengthening of the Northeast Monsoon over the Flores Sea, Indonesia, at the time of Heinrich event 1. Geology 40, 635–638. doi: 10.1130/G32878.1
Murton J. B., Bateman M. D., Dallimore S. R., Teller J. T., Yang Z. R. (2010). Identification of Younger Dryas outburst flood path from Lake Agassiz to the Arctic Ocean. Nature 464, 740–743. doi: 10.1038/nature08954
Ng H. C., Robinson L. F., McManus J. F., Mohamed K. J., Jacobel A. W., Ivanovic R. F., et al. (2018). Coherent deglacial changes in western Atlantic Ocean circulation. Nat. Commun. 9, 2947. doi: 10.1038/s41467-018-05312-3
Oppo D. W., Rosenthal Y. (2010). The great indo-pacific communicator. Science 328, 1492–1494. doi: 10.1126/science.1187273
Pei R., Kuhnt W., Holbourn A., Jöhnck J., Hingst J., Beil S., et al. (2021). Evolution of sea surface hydrology along the western Australian margin over the past 450 kyr. Paleoceanography Paleoclimatology 36, e2021PA004222. doi: 10.1029/2021PA004222
Perren B. B., Hodgson D. A., Roberts S. J., Sime L., Van Nieuwenhuyze W., Verleyen E., et al. (2020). Southward migration of the Southern Hemisphere westerly winds corresponds with warming climate over centennial timescales. Commun. Earth Environ. 1, 58. doi: 10.1038/s43247-020-00059-6
Petrick B., Martínez-García A., Auer G., Reuning L., Auderset A., Deik H., et al. (2019). Glacial Indonesian Throughflow weakening across the Mid-Pleistocene Climatic Transition. Sci. Rep. 9, 16995. doi: 10.1038/s41598-019-53382-0
Reagan J. R., Seidov D., Wang Z., Dukhovskoy D., Boyer T. P., Locarnini R. A., et al. (2024). “World ocean atlas 2023, volume 2: salinity,” in NOAA atlas NESDIS 90. (Silver Spring, MD: National Oceanic and Atmospheric Administration (NOAA)). doi: 10.25923/70qt-9574
Reason C. J. C., Gamble D., Pearce A. F. (1999). The Leeuwin Current in the Parallel Ocean Climate Model and applications to regional meteorology and fisheries. Meteorological Appl. 6, 211–225. doi: 10.1017/S1350482799001255
Reeves J. M., Bostock H. C., Ayliffe L. K., Barrows T. T., De Deckker P., Devriendt L. S., et al. (2013). Palaeoenvironmental change in tropical Australasia over the last 30,000 years - a synthesis by the OZ-INTIMATE group. Quaternary Sci. Rev. 74, 97–114. doi: 10.1016/j.quascirev.2012.11.027
Rind D. (2008). The consequences of not knowing low- and high-latitude climate sensitivity. Bull. Am. Meteorological Soc. 89, 855–864. doi: 10.1175/2007BAMS2520.1
Ronge T. A., Tiedemann R., Lamy F., Köhler P., Alloway B. V., De-Pol-Holz R., et al. (2016). Radiocarbon constraints on the extent and evolution of the South Pacific glacial carbon pool. Nat. Commun. 7, 11487. doi: 10.1038/ncomms11487
Rosenthal Y., Boyle E. A., Slowey N. (1997). Temperature control on the incorporation of magnesium, strontium, fluorine, and cadmium into benthic foraminiferal shells from little Bahama Bank: Prospects for thermocline paleoceanography. Geochimica Cosmochimica Acta 61, 3633–3643. doi: 10.1016/S0016-7037(97)00181-6
Rosenthal Y., Oppo D. W., Linsley B. K. (2003). The amplitude and phasing of climate change during the last deglaciation in the Sulu Sea, western equatorial Pacific. Geophysical Res. Lett. 30, 1428. doi: 10.1029/2002GL016612
Sarnthein M., Grootes P. M., Holbourn A., Kuhnt W., Kühn H. (2011). Tropical warming in the Timor Sea led deglacial Antarctic warming and atmospheric CO2 rise by more than 500 yr. Earth Planetary Sci. Lett. 302, 337–348. doi: 10.1016/j.epsl.2010.12.021
Sarnthein M., Küssner K., Grootes P. M., Ausin B., Eglinton T., Muglia J., et al. (2020). Plateaus and jumps in the atmospheric radiocarbon record – potential origin and value as global age markers for glacial-to-deglacial paleoceanography, a synthesis. Climate Past 16, 2547–2571. doi: 10.5194/cp-16-2547-2020
Schlitzer R. (2024). Ocean data view. Available online at: https://odv.awi.de (Accessed March 16, 2025).
Schneider T., Bischoff T., Haug G. H. (2014). Migrations and dynamics of the intertropical convergence zone. Nature 513, 45–53. doi: 10.1038/nature13636
Schröder J. F., Holbourn A., Kuhnt W., Küssner K. (2016). Variations in sea surface hydrology in the southern Makassar Strait over the past 26 kyr. Quaternary Sci. Rev. 154, 143–156. doi: 10.1016/j.quascirev.2016.10.018
Schröder J. F., Kuhnt W., Holbourn A., Beil S., Zhang P., Hendrizan M., et al. (2018). Deglacial warming and hydroclimate variability in the central Indonesian archipelago. Paleoceanography Paleoclimatology 33, 974–993. doi: 10.1029/2018PA003323
Shakun J. D., Clark P. U., He F., Marcott S. A., Mix A. C., Liu Z., et al. (2012). Global warming preceded by increasing carbon dioxide concentrations during the last deglaciation. Nature 484, 49–54. doi: 10.1038/nature10915
Sprintall J., Wijffels S. E., Molcard R., Jaya I. (2009). Direct estimates of the Indonesian Throughflow entering the Indian Ocean: 2004-2006. J. Geophysical Res. 114, C07001. doi: 10.1029/2008JC005257
Stott L., Timmermann A., Thunell R. (2007). Southern Hemisphere and deep-sea warming led deglacial atmospheric CO2 rise and tropical warming. Science 318(5849):435–438. doi: 10.1126/science.1143791
Stuut J.-B. W., De Deckker P., Saavedra-Pellitero M., Bassinot F., Drury A. J., Walczak M. H., et al. (2019). A 5.3-million-year history of monsoonal precipitation in northwestern Australia. Geophysical Res. Lett. 46, 6946–6954. doi: 10.1029/2019GL083035
Stuut J. W., Temmesfeld F., De Deckker P. (2014). A 550 ka record of aeolian activity near North West Cape, Australia: inferences from grain-size distributions and bulk chemistry of SE Indian Ocean deep-sea sediments. Quaternary Sci. Rev. 83, 83–94. doi: 10.1016/j.quascirev.2013.11.003
Susanto R D, Gordon A L, Zheng Quanan (2001). Upwelling along the coasts of Java and Sumatra and its relation to ENSO. Geophy Res Lett 28(8):1599–1602. doi: 10.1029/2000GL011844
Tschumi T., Joos F., Gehlen M., Heinze C. (2011). Deep ocean ventilation, carbon isotopes, marine sedimentation and the deglacial CO2 rise. Climate Past 7, 771–800. doi: 10.5194/cp-7-771-2011
Umling N. E., Oppo D. W., Chen P., Yu J., Liu Z., Yan M., et al. (2019). Atlantic circulation and ice sheet influences on upper South Atlantic temperatures during the last deglaciation. Paleoceanography Paleoclimatology 34, 990–1005. doi: 10.1029/2019PA003558
Waelbroeck C., Labeyrie L., Michel E., Duplessy J. C., McManus J. F., Lambeck K., et al. (2002). Sea-level and deep water temperature changes derived from benthic foraminifera isotopic records. Quaternary Sci. Rev. 21, 295–305. doi: 10.1016/S0277-3791(01)00101-9
Waliser D. E., Gautier C. (1993). A satellite-derived climatology of the ITCZ. J. Climate 6, 2162–2174. doi: 10.1175/1520-0442(1993)006<2162:ASDCOT>2.0.CO;2
Wendt K. A., Nehrbass-Ahles C., Niezgoda K., Noone D., Kalk M., Menviel L., et al. (2024). Southern Ocean drives multidecadal atmospheric CO2 rise during Heinrich Stadials. Proc. Natl. Acad. Sci. 121, e2319652121. doi: 10.1073/pnas.2319652121
Xie P., Arkin P. A. (1997). Global precipitation: a 17-year monthly analysis based on gauge observations, satellite estimates, and numerical model outputs. Bull. Am. Meteorological Soc. 78, 2539–2558. doi: 10.1175/1520-0477(1997)078<2539:GPAYMA>2.0.CO;2
Yang H., Lohmann G., Lu J., Gowan E. J., Shi X., Liu J., et al. (2020). Tropical expansion driven by poleward advancing midlatitude meridional temperature gradients. J. Geophysical Research: Atmospheres 125, e2020JD033158. doi: 10.1029/2020JD033158
Zhang P., Xu J., Holbourn A., Kuhnt W., Beil S., Li T., et al. (2020). Indo-pacific hydroclimate in response to changes of the intertropical convergence zone: discrepancy on precession and obliquity bands over the last 410 kyr. J. Geophysical Research: Atmospheres 125, e2019JD032125. doi: 10.1029/2019JD032125
Zhang P., Zuraida R., Rosenthal Y., Holbourn A., Kuhnt W., Xu J. (2019). Geochemical characteristics from tests of four modern planktonic foraminiferal species in the Indonesian Throughflow region and their implications. Geosci. Front. 10, 505–516. doi: 10.1016/j.gsf.2018.01.011
Keywords: foraminifera, Mg/Ca ratio and δ18O, Northwestern Australia, Northern Hemisphere high latitudes, millennial timescale
Citation: Cui R, Zhang P, Xu J, Holbourn A and Kuhnt W (2025) Millennial-scale surface hydrological variability in the tropical eastern Indian Ocean linked to Northern Hemisphere high latitudes. Front. Mar. Sci. 12:1570375. doi: 10.3389/fmars.2025.1570375
Received: 03 February 2025; Accepted: 07 March 2025;
Published: 02 April 2025.
Edited by:
Zhaojie Yu, Chinese Academy of Sciences (CAS), ChinaReviewed by:
Yang Zhang, Ocean University of China, ChinaCopyright © 2025 Cui, Zhang, Xu, Holbourn and Kuhnt. This is an open-access article distributed under the terms of the Creative Commons Attribution License (CC BY). The use, distribution or reproduction in other forums is permitted, provided the original author(s) and the copyright owner(s) are credited and that the original publication in this journal is cited, in accordance with accepted academic practice. No use, distribution or reproduction is permitted which does not comply with these terms.
*Correspondence: Peng Zhang, enAxM0Bmb3htYWlsLmNvbQ==
Disclaimer: All claims expressed in this article are solely those of the authors and do not necessarily represent those of their affiliated organizations, or those of the publisher, the editors and the reviewers. Any product that may be evaluated in this article or claim that may be made by its manufacturer is not guaranteed or endorsed by the publisher.
Research integrity at Frontiers
Learn more about the work of our research integrity team to safeguard the quality of each article we publish.