Abstract
Assessing the current forces exerted on a semi-submersible truss fish cage is crucial for understanding drag force distribution and ensuring the structural safety. The present study employs computational fluid dynamics (CFD) methods and porous media theory to predict the drag forces on a semi-submersible truss fish cage, providing a detailed description of the magnitude and distribution patterns of drag forces on the plane nets, pontoons, columns, and braces. Results indicate that the side plane nets bear the highest forces, contributing 24.3% of the total force. The pontoons and thick columns are the next most affected, contributing 18.7% and 13.8% of the total force, respectively, while the middle cross braces bear the least force at 3.7%. A decrease in current speed leads to reduced drag forces on the downstream side plane nets, columns, pontoons, and braces. However, the projected area of each component in the current direction is a critical factor influencing changes in drag forces. Additionally, the torque generated by the drag forces on the semi-submersible truss fish cage is examined. Center position of the torque can alter the torque direction exerted on the truss net cage, and the transition occurs between 18 cm and 19 cm. The present investigation provides a comprehensive evaluation of the drag force distribution on the semi-submersible truss fish cage, which is significant practical engineering implications.
1 Introduction
In recent decades, aquaculture has developed rapidly, providing essential food and nutrients. According to the Food and Agriculture Organization of the United Nations (FAO), aquaculture production reached 94.4 million tons (Figure 1), surpassing capture fisheries at 51% of total aquatic animal output, with 57% intended for human consumption (FAO, 2024). By 2022, global production rose to 130.9 million tons, a 6.6% increase from 2020, reflecting a steady growth trend. Deep-sea aquaculture, with its large capacity, resilience, and efficient use of open sea areas, plays a key role in sustainable fisheries, addressing coastal resource shortages and pollution.
Figure 1
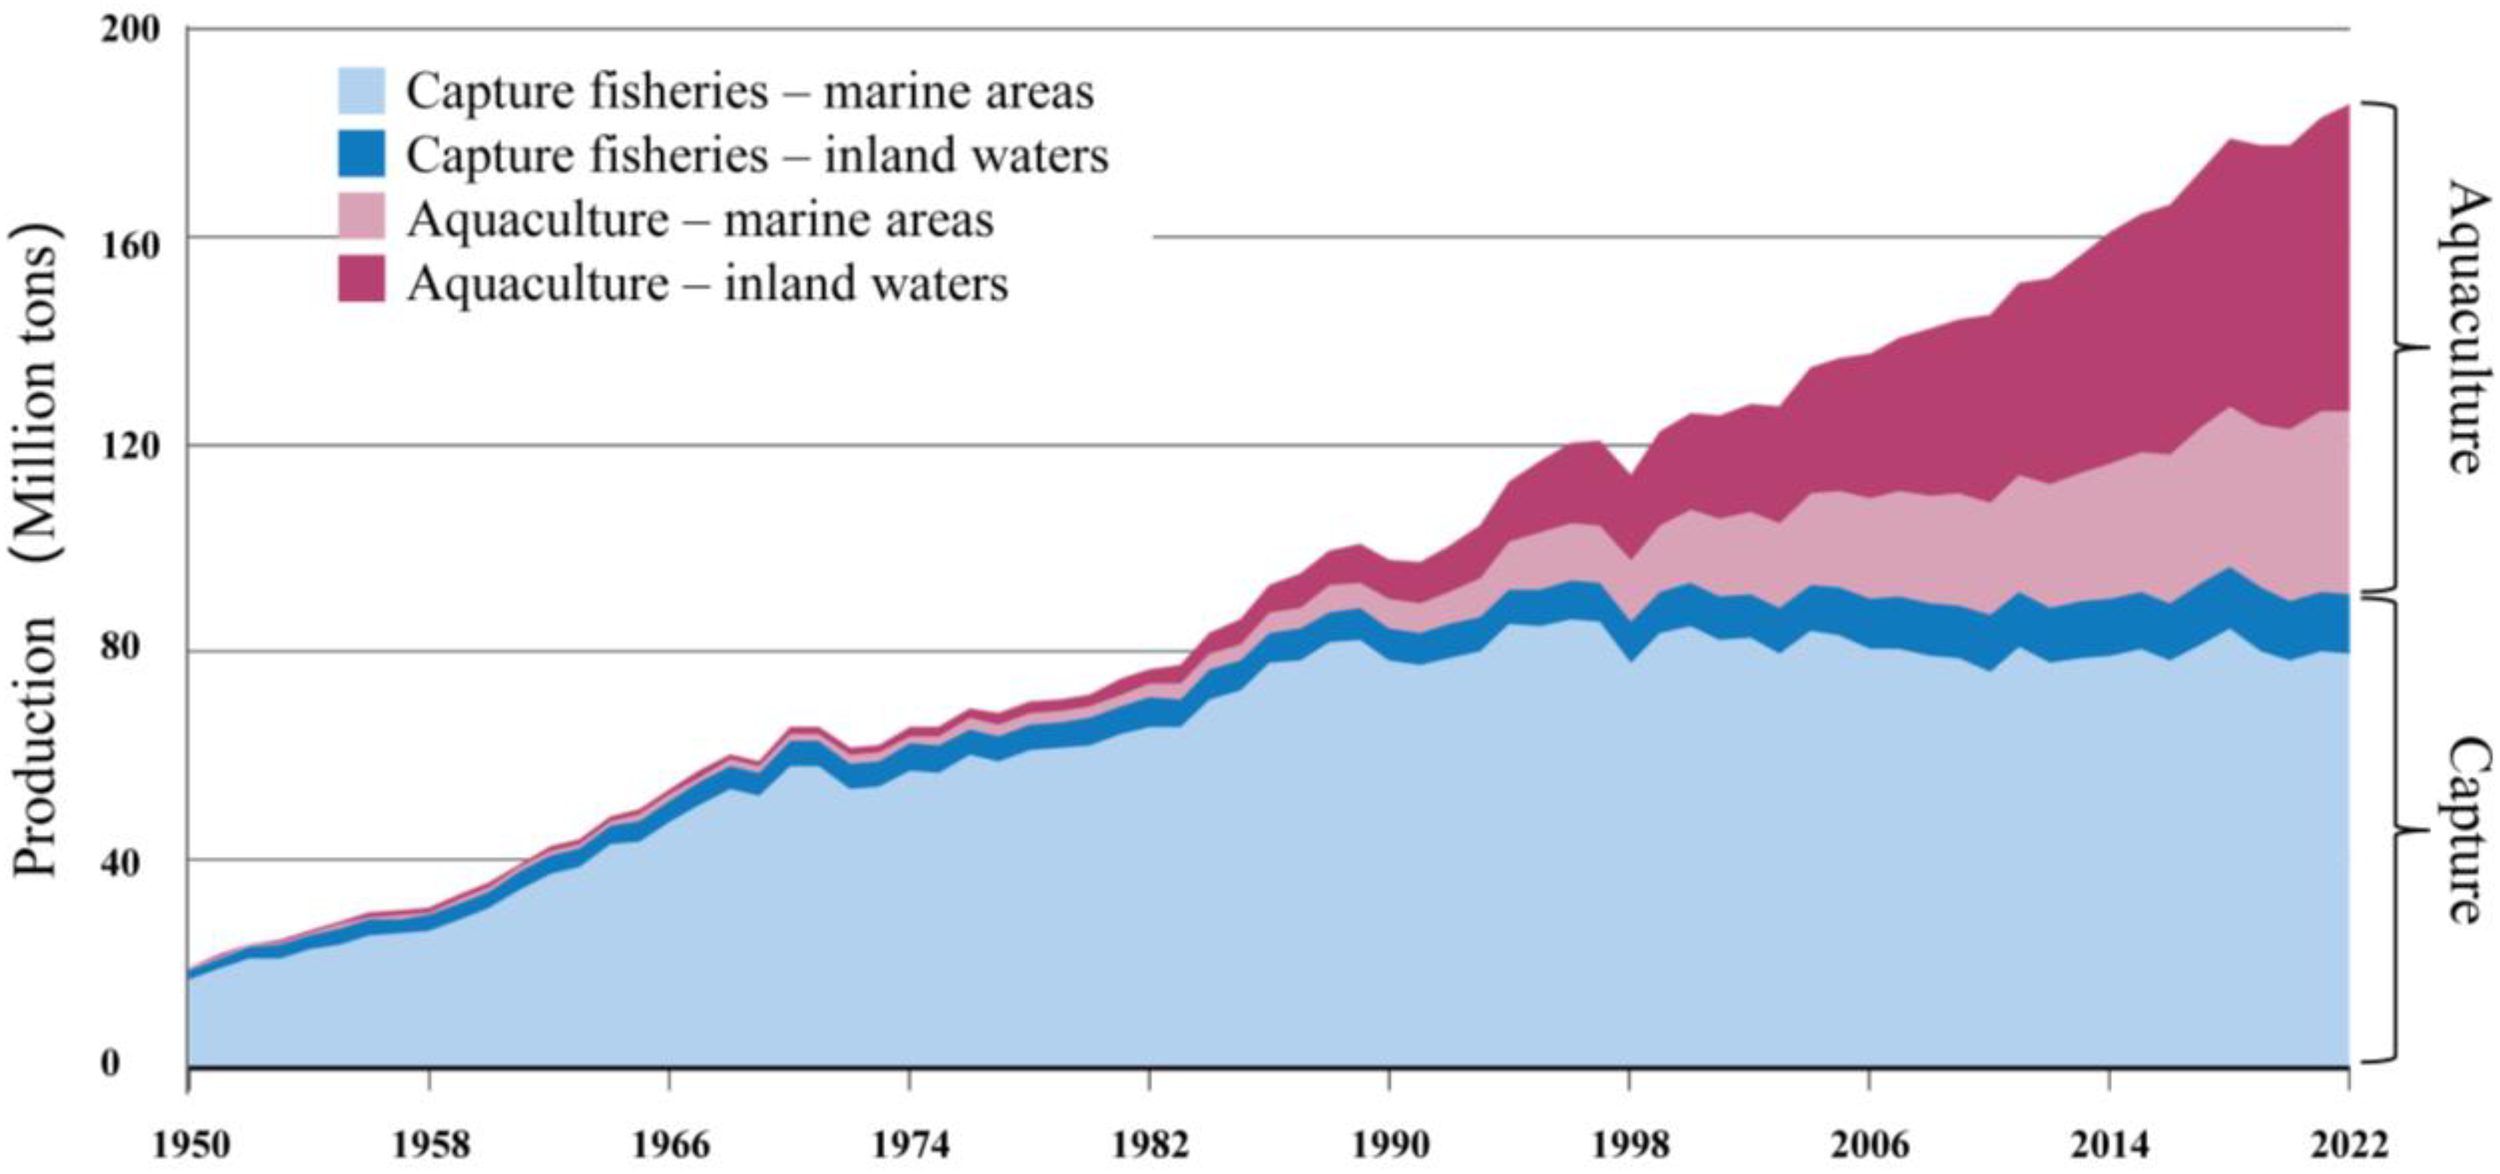
Production of the capture fisheries and aquaculture in the world (FAO, 2024).
As marine aquaculture progresses from nearshore to open sea environments, the development of aquaculture equipment deserves attention, particularly the structural resilience to withstand currents and waves, which is of paramount importance. Facing a harsh marine environment in open sea, ensuring the safety of net cage structures is crucial for the success of aquaculture operations. At present, the development of deep-sea aquaculture equipment is the fastest in Norway and China (Figure 2), such as OceanFarm1, Shenlan 1, Dehai 1 and other large truss net cages in China and Norway (Chu et al., 2020; Xu and Qin, 2020). The characteristics of these aquaculture equipment are that they have a rigid frame system, which not only ensures sufficient aquaculture space, but also provides the ability to resist environmental loads. However, research on the aquaculture equipment predominantly focuses on the hydrodynamic characteristics of the overall structure, including motion, mooring forces, and flow field distribution, while lacking analysis of the local loads exerted on the truss net cage. By analyzing the current forces on local structures, such as plane nets, pontoons, columns and braces, we can understand the pattern of drag forces on the aquaculture equipment and the changes in drag forces due to attenuation of current speed, which provides valuable insights for the design and optimization of net cage structures.
Figure 2
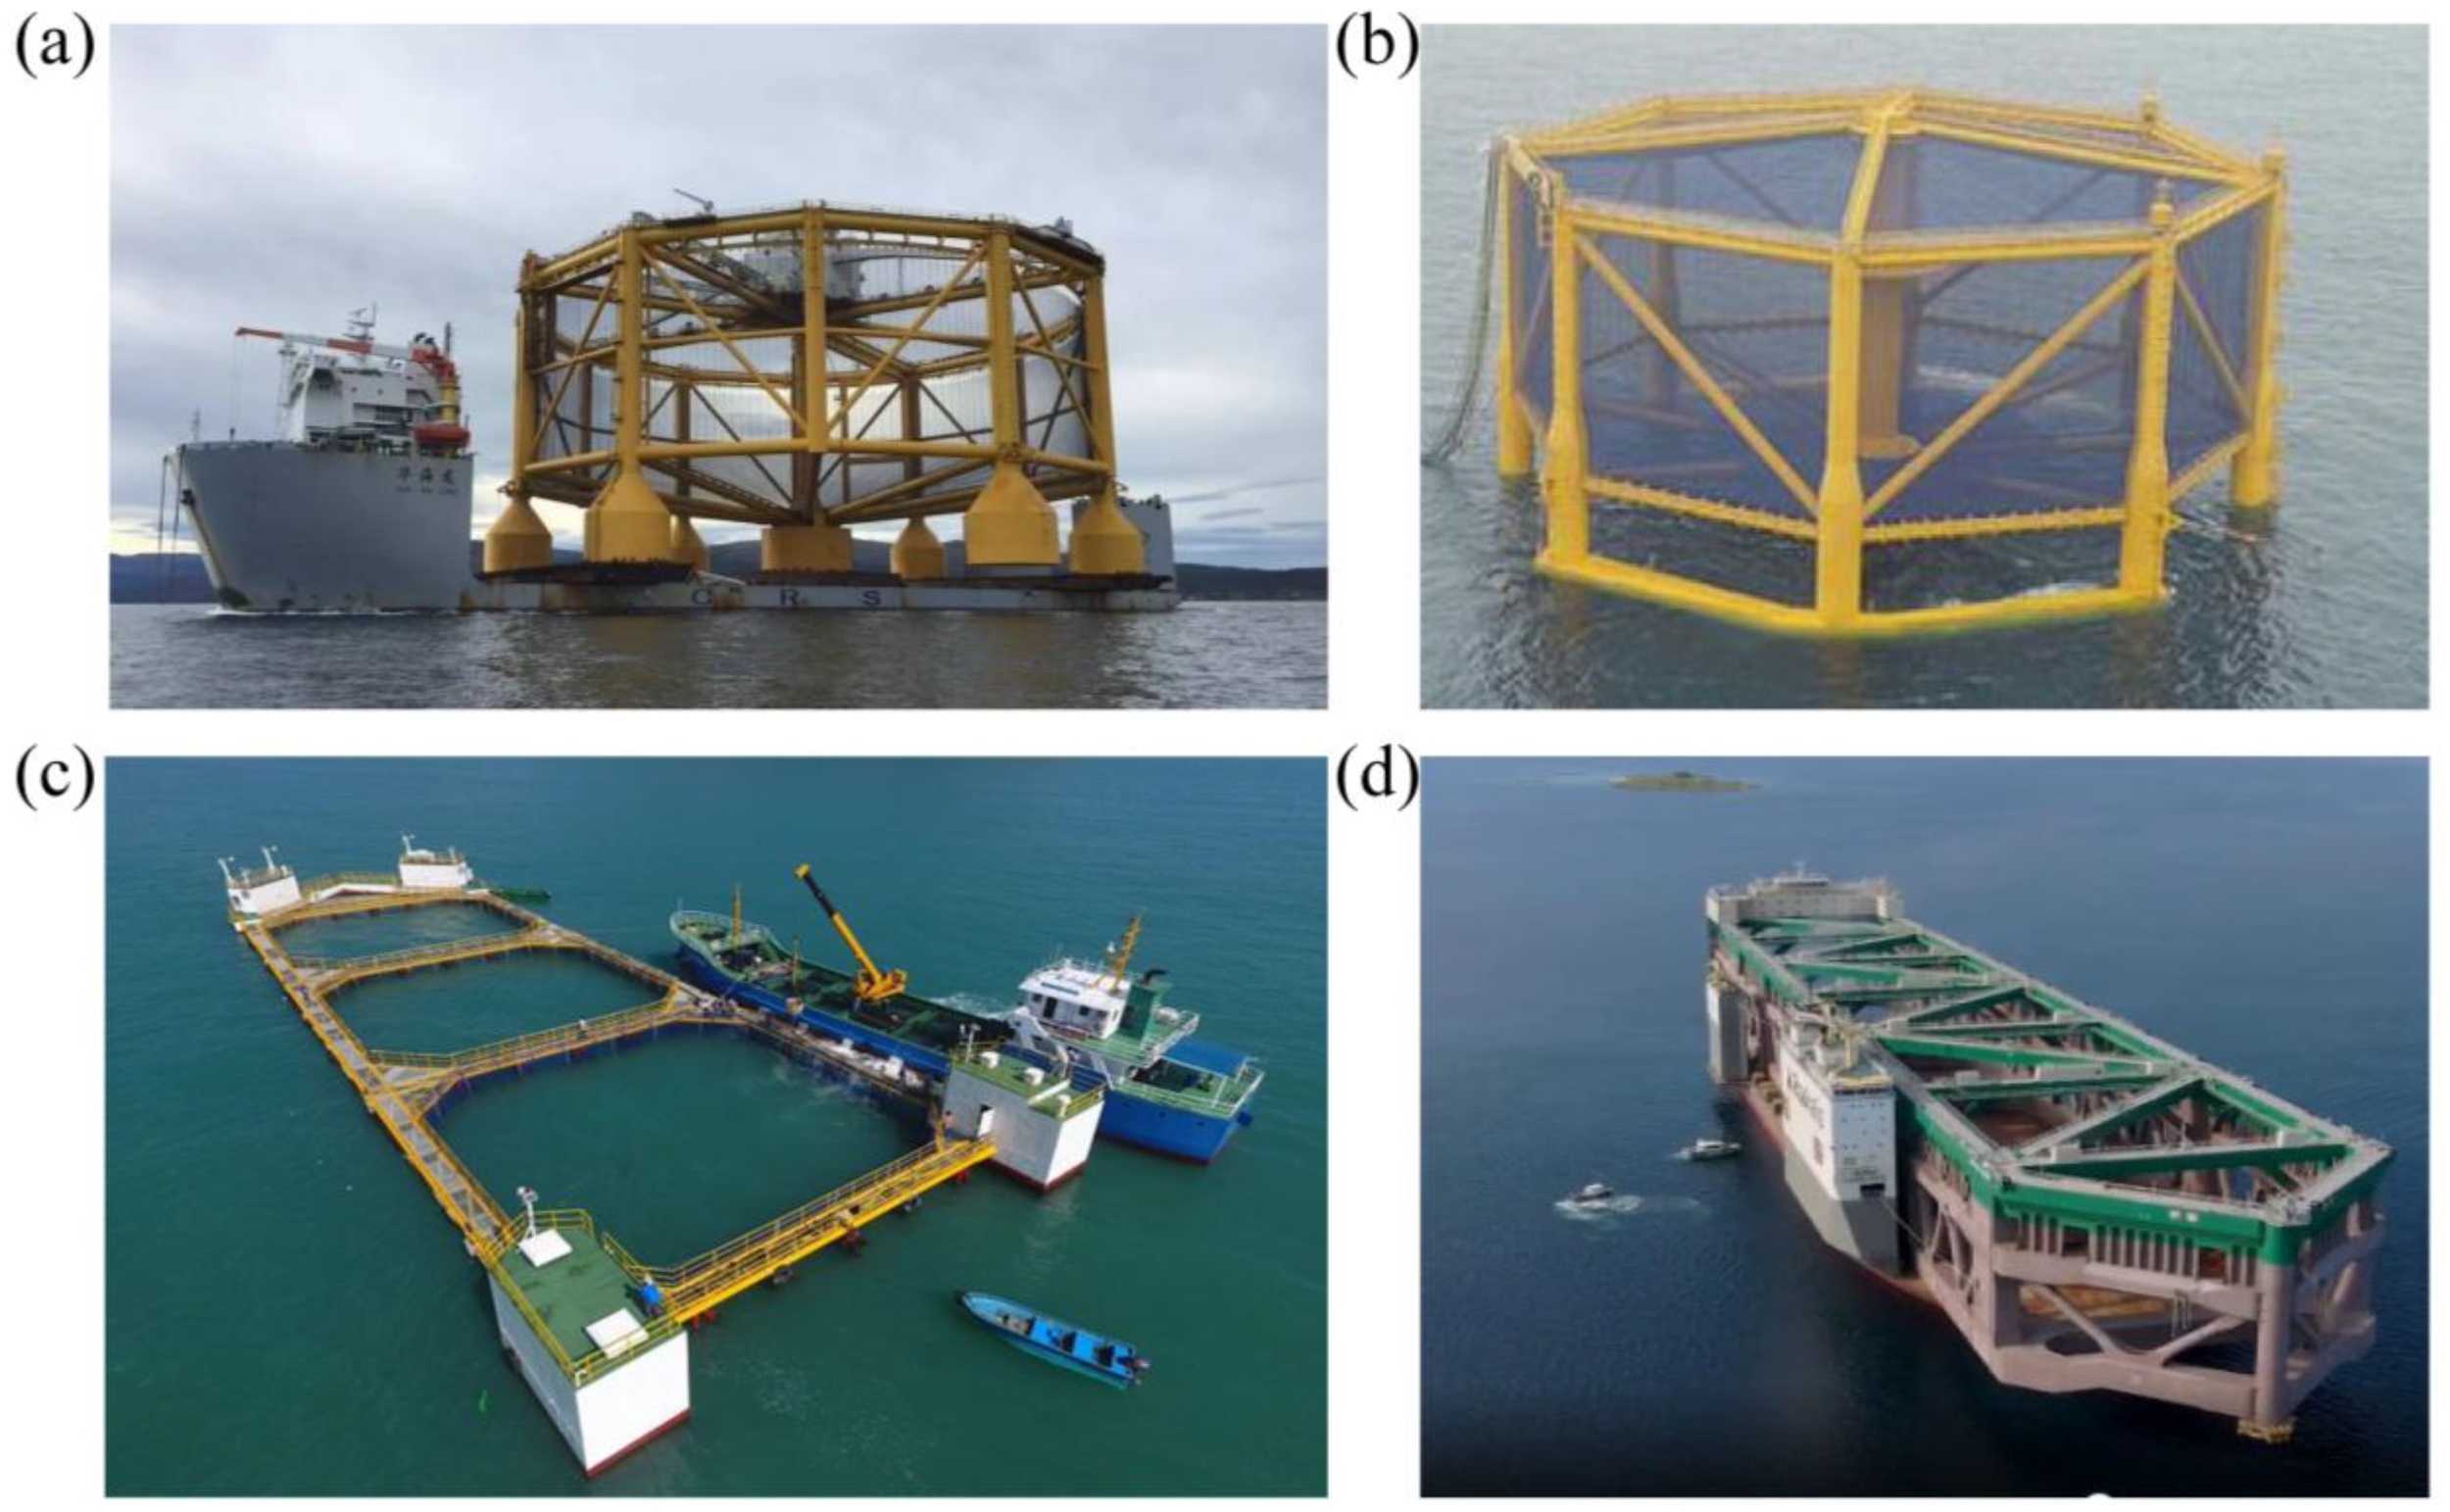
Type of the large truss net cage: (a) Ocean farm 1, (b) Shenlan 1, (c) Dehai 1 and (d) JOSTEIN ALBERT.
Existing research on the drag force acting on the aquaculture net cages primarily focuses on the following three aspects: (1) Physical model experiments enable the direct measurement of drag force acting on a single net panel or the entire net cage, thereby revealing the drag force variation under different inflow velocities (Chen et al., 2024; Guo et al., 2023; Huang et al., 2020; Kristiansen et al., 2015; Kristiansen and Faltinsen, 2015; Zhao et al., 2015). This method provides accurate drag force data and serves as a basis for parameter determination and validation in subsequent numerical simulations. However, the limitations of experimental facilities, as well as the complexity of setup and data acquisition, restrict further in-depth investigations into the drag force of net cages. (2) The semi-theoretical and semi-empirical Morison equation is widely used to calculate the drag force and the drag coefficient can be obtained through physical model experiments or empirical formulas (Huang et al., 2018; Li et al., 2013; Liu and Liu, 2024; Tsukrov et al., 2003; Xie et al., 2023; Zhao et al., 2013b). Numerical simulation methods, including the lumped mass method, finite element method, and boundary element method, are then employed to compute the drag force acting on net panels or net cages. Although this approach allows for relatively efficient calculations, it relies on empirical parameters or experimental data, making it difficult to accurately account for the effects of localized flow velocity variations on the forces exerted on the net cage. (3) As the computational performance improves, the use of computational fluid dynamics methods (CFD) to calculate drag force on net cages has become increasingly prevalent. While direct CFD simulations of net structures are feasible, the fine-scale structure of the net panels leads to an exponential increase in the number of computational grids, resulting in extensive computational costs and long simulation times (Tang et al., 2017). In recent years, numerous researchers have incorporated the porous media model into CFD simulations by introducing source terms into the momentum equation, thereby enabling the prediction of drag force on net cages with significantly improved computational efficiency (Bi et al., 2018; Liu et al., 2021; Zhao et al., 2013a).
Although the aforementioned literature has comprehensively covered the drag force aspects of net cage, it lacks more in-depth mechanistic research, especially in terms of the pattern of the current load exerted on the components of truss net cage. When water flows through net cages, there is a velocity decay, meaning that truss net cages have a blocking consequence on the current. Consequently, the decay in current speed inevitably leads to changes in current load downstream of the truss net cage. Existing studies have applied the finite element method and lumped mass method to calculate the forces on the net cages, but these methods, based on the Morrison equation, cannot accurately account for the impact of flow variations on the main structure. Instead, they rely on simple semi-theoretical and semi-empirical coefficients. Furthermore, directly using the CFD method to calculate the current load pattern on the truss net cage is impractical. The reason is that the net structure is small and numerous, resulting in the number of grids in the calculation domain exceeding 100 million. Existing normal computing equipment cannot handle this, leading to severely reduced calculation efficiency. The novelty of the present study lies in the application of the CFD approach, integrated with a porous media model, to predict the drag force of local structures in semi-submersible truss fish cage. This numerical model accounts for the influence of flow field variations on drag force, as well as the mutual interactions among structural components, including columns and nets, in the three-dimensional space. Furthermore, it successfully computes the drag force acting on both small structural elements (such as nets and columns) and larger components (such as pontoons).
The present study mainly consists of five parts. Section 1 outlines the background and significance of the present investigation. Section 2 presents the semi-submersible truss fish cage model and numerical method. Section 3 details the verification process through numerical and experimental comparisons. Section 4 discusses the numerical simulation results, including the pattern of drag force exerted on the plane nets and frame, and the torque exerted on the truss net cage. Section 5 provides the final conclusion.
2 Numerical methods
Semi-submersible truss fish cages serve as the research object, with an analysis of drag force on plane nets, columns, pontoons, and braces under working draught conditions from a localized perspective. The computational fluid dynamics (CFD) method and porous media theory are applied in the present study, with the SST k-ω turbulence equation used to describe water flow. To facilitate data exchange between the porous media and current, the boundary where the plane nets contact the water is defined as an interior surface. The discretized governing equations are solved to obtain the ultimate information on current speed, pressure, and drag force exerted on the truss net cage.
2.1 Governing equations
The study of fluid dynamics is primarily based on the following important assumptions in present research. First, the fluid is considered a continuum. Second, all fields (such as velocity field and pressure field) are differentiable. In addition, the fluid is regarded as a Newtonian fluid and is incompressible, meaning its density does not change over time. Based on these assumptions, the continuity equation and the momentum equation are used to describe the motion of the fluid inside and around the truss net cage (Patursson et al., 2010), as shown in Equations (1) and (2) below:
where is the fluid density, is the time, and are the mean current speed, respectively, and are the three direction coordinates, including , and , respectively, is the mean fluid pressure, and are the fluid kinematic viscosity and the fluid eddy kinematic viscosity, respectively, is the gravity accelerate and is the source term of the momentum equation.
To solve for current speed and drag force, it is necessary to further obtain the fluid eddy viscosity, and complete the closure of the continuity and momentum equations. In the present study, the shear stress transport k-omega turbulence model (SST k-ω) is applied to describe the current and the specific Equations (3–5) can be presented as follow:
where is a constant, is the turbulent kinetic energy, is the turbulent dissipation rate, is the absolute value of the vorticity, is the second blending function, is the stress, is a constant, = is dynamic viscosity, is the turbulent Prandtl numbers for , is eddy viscosity, is the function of and , is the coefficient of thermal expansion, is the turbulent Prandtl numbers for , is a blending function, is a constant.
To simulate the plane nets, the present study uses a porous media region to replace the plane nets (Figure 3), achieving the nets ability to obstruct and allow water flow. The impact of the plane nets on the water is incorporated into the source term of the momentum equation. The porous media theory is applied and the specific Equation (6) is as follows:
Figure 3
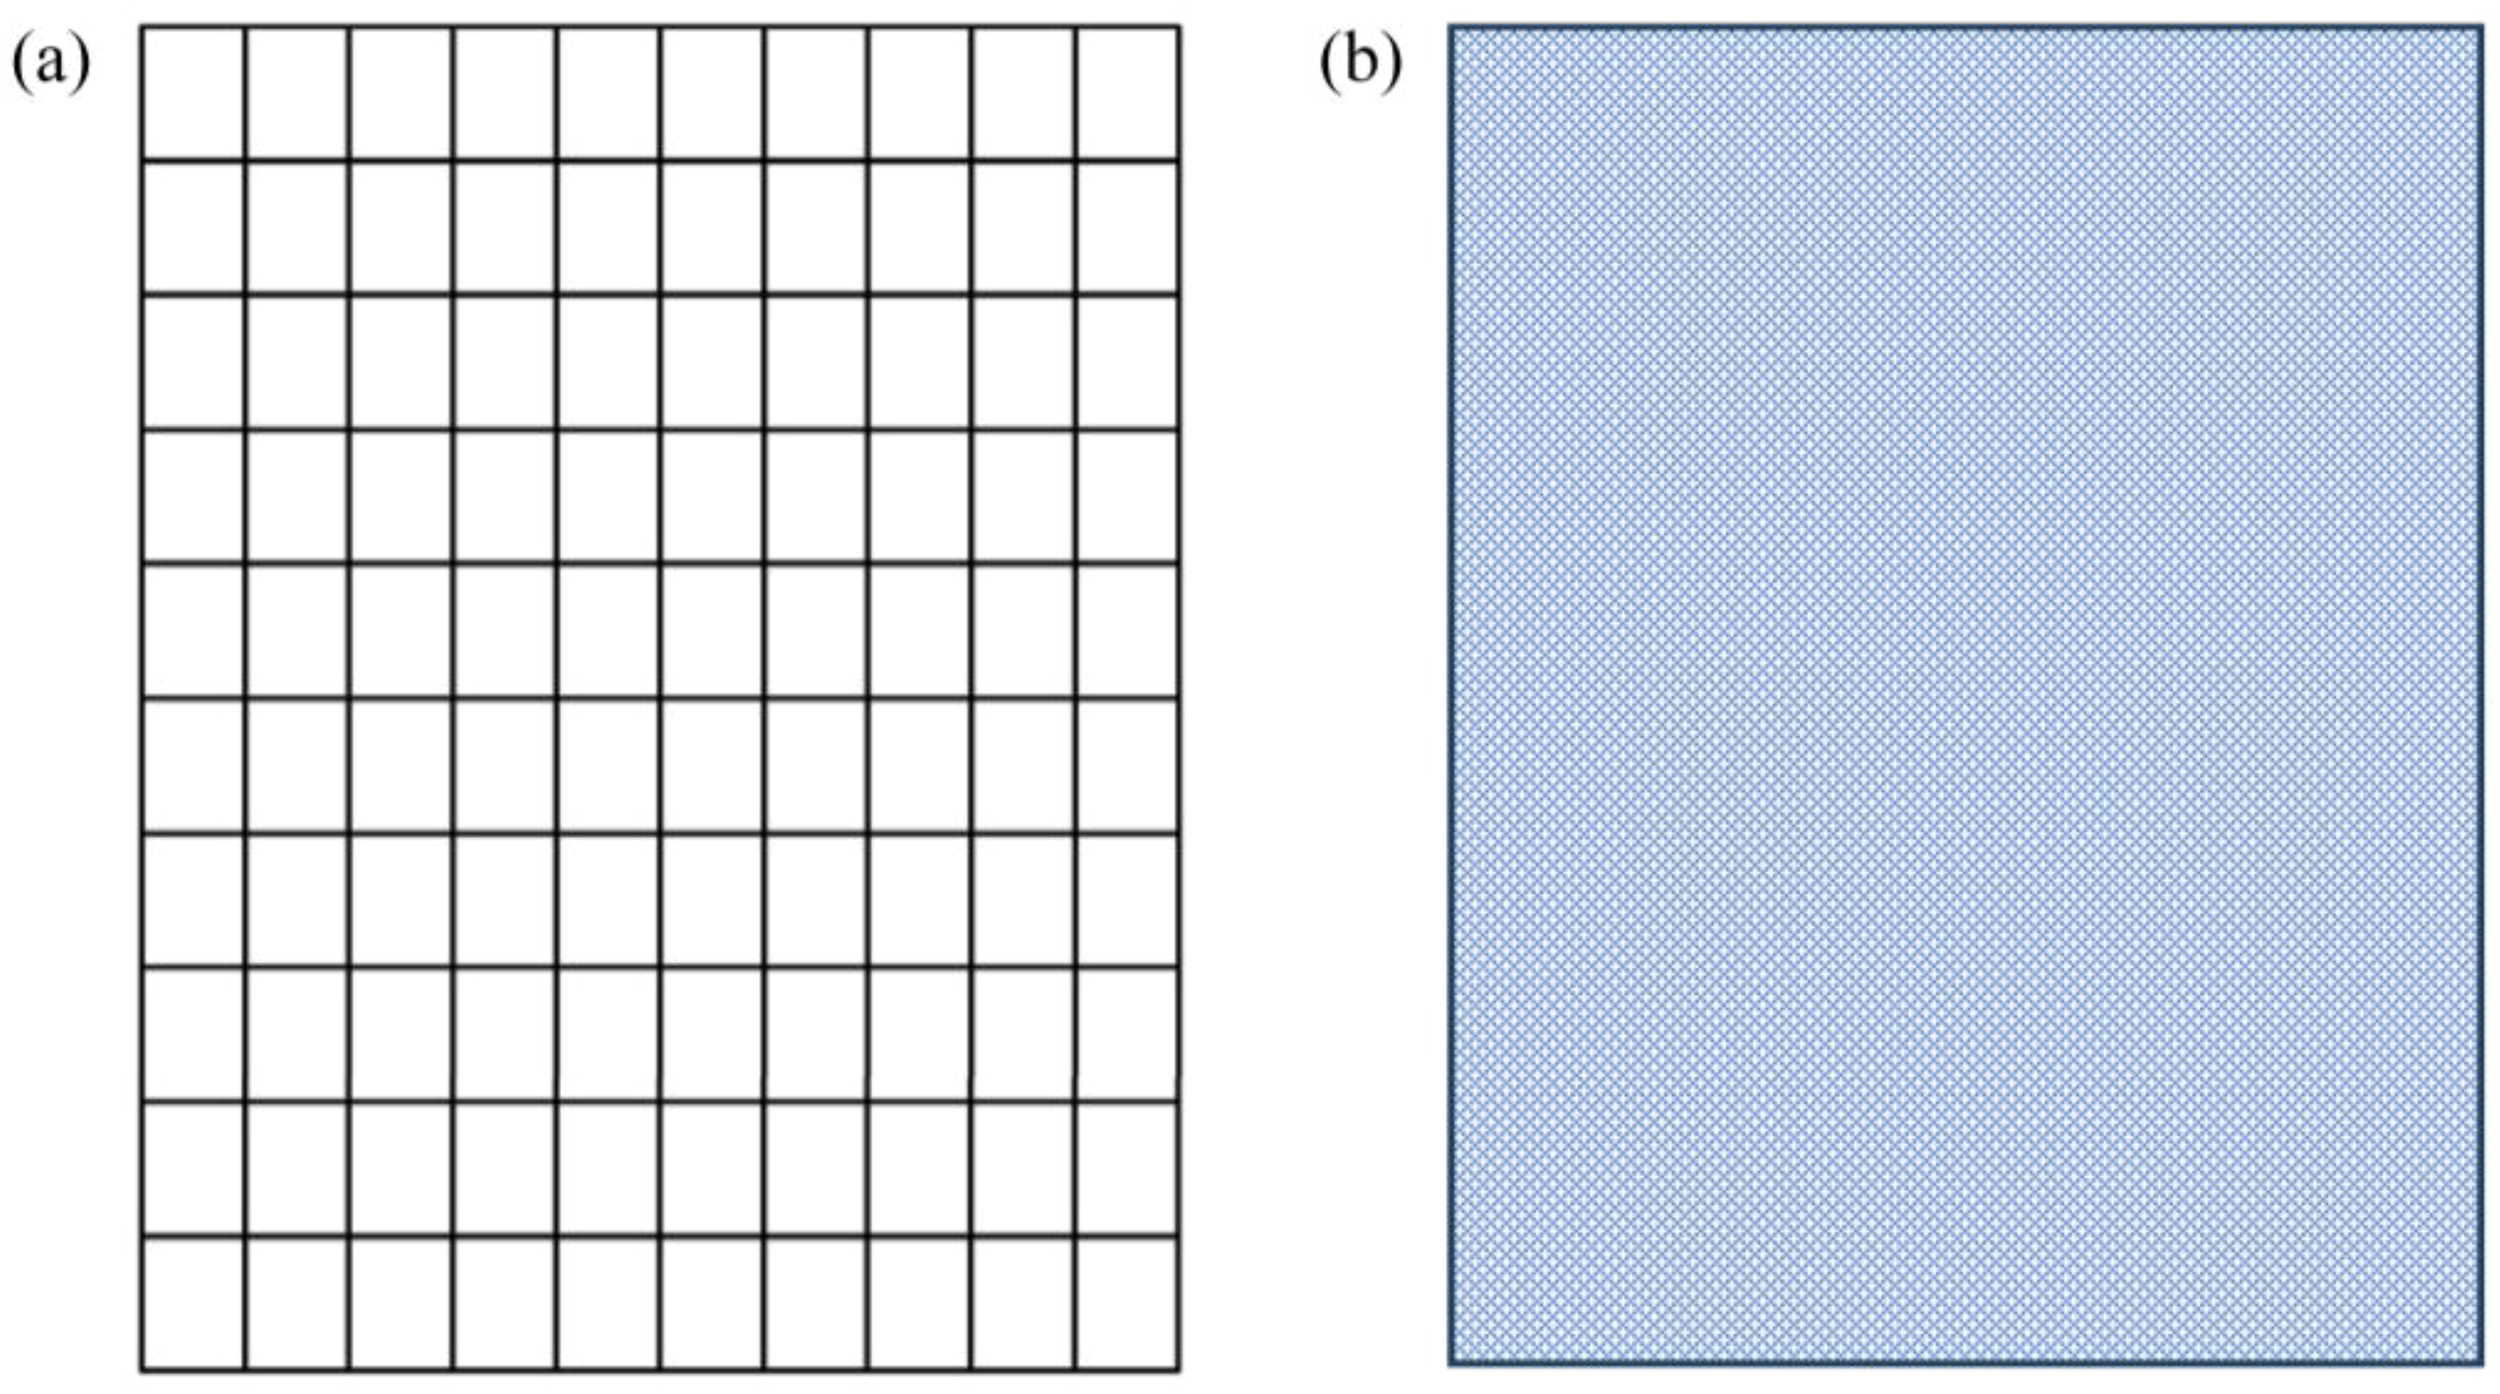
The simulation of the fish plane nets: (a) the real fish plane nets and (b) the porous media region.
where is the viscous resistance coefficient and is the inertial resistance coefficient.
The resistance coefficient is calculated by the Loland (1993)Equations (7, 8), which is as follows:
where is the drag coefficient of the fish net, is the lift coefficient of the fish net, , is the attack angle, and is the plane net solidity.
2.2 Computational domain grids
In the present study, the computational domain is 10 m long, 2 m wide, and 1 m high, and detailed geometric dimensions of the semi-submersible truss fish cage can be obtained from the reference of Liu et al. (2021). Given the complexity of the semi-submersible truss fish cage, a regional meshing strategy is employed. Hexahedral orthogonal grids with a dimension of 0.1 m are used in the inlet (Zone1) and outlet zones (Zone3) to minimize the number of grids (Figure 4). Tetrahedral grids with a minimum dimension of 2.5 mm are implemented in the region containing the truss net cage (Zone 2) to conform to the boundaries of columns, pontoons, braces, and plane nets, preserving geometric features. The porous media region is divided into 2 layers of tetrahedral grids with a dimension of 2.5 mm along the thickness direction. The computational domain employs a grid growth rate of 1.2 to seamlessly connect fluid domain boundaries with the porous media region, reducing computational load and enhancing efficiency.
Figure 4
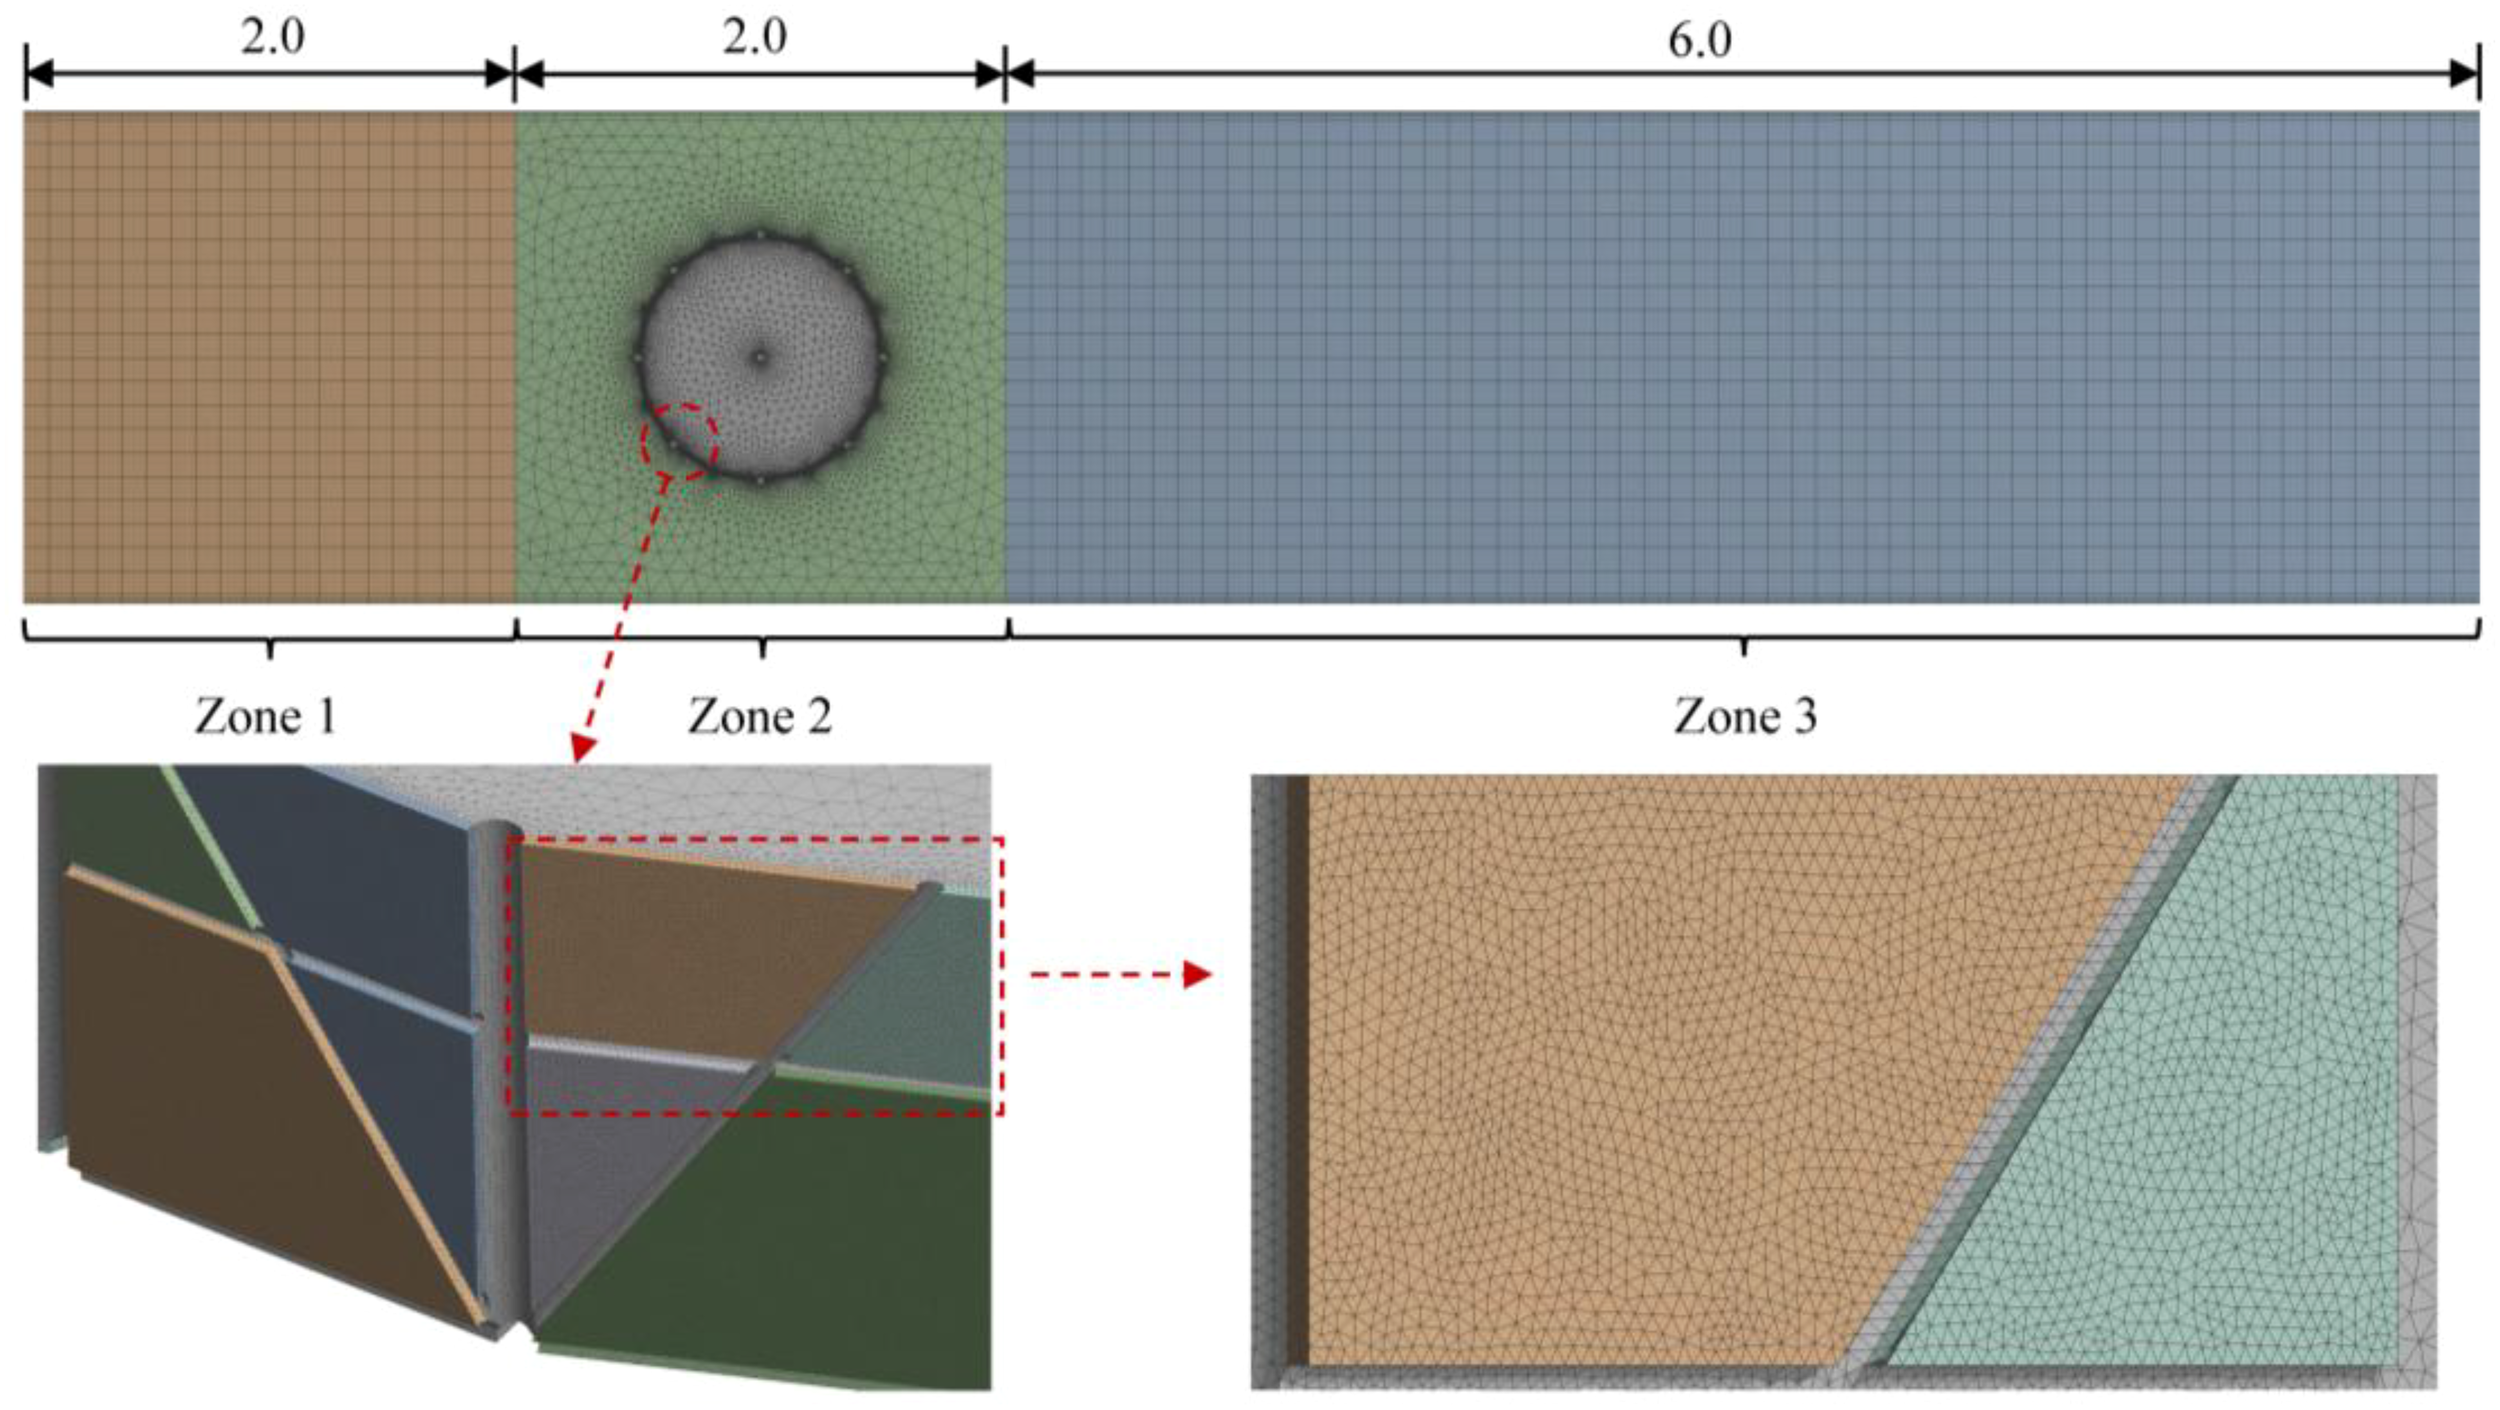
Grids of fluid domain and porous media domain (unit: m).
The grid independence has a significant impact on the convergence and accuracy of the numerical calculation results. This study analyzes the influence of three grid sizes, 1.3 mm, 1.6 mm and 2.5 mm, on the current speed. The flow velocity change is measured at z = 25 cm along the flow direction. The results show that the change of the grid based on the minimum geometric size has little effect on the current speed pattern results and all converge (Figure 5). Therefore, to minimize the amount of calculation and enhance the processing performance, the grid of 2.5 mm is selected to divide the computational domain.
Figure 5
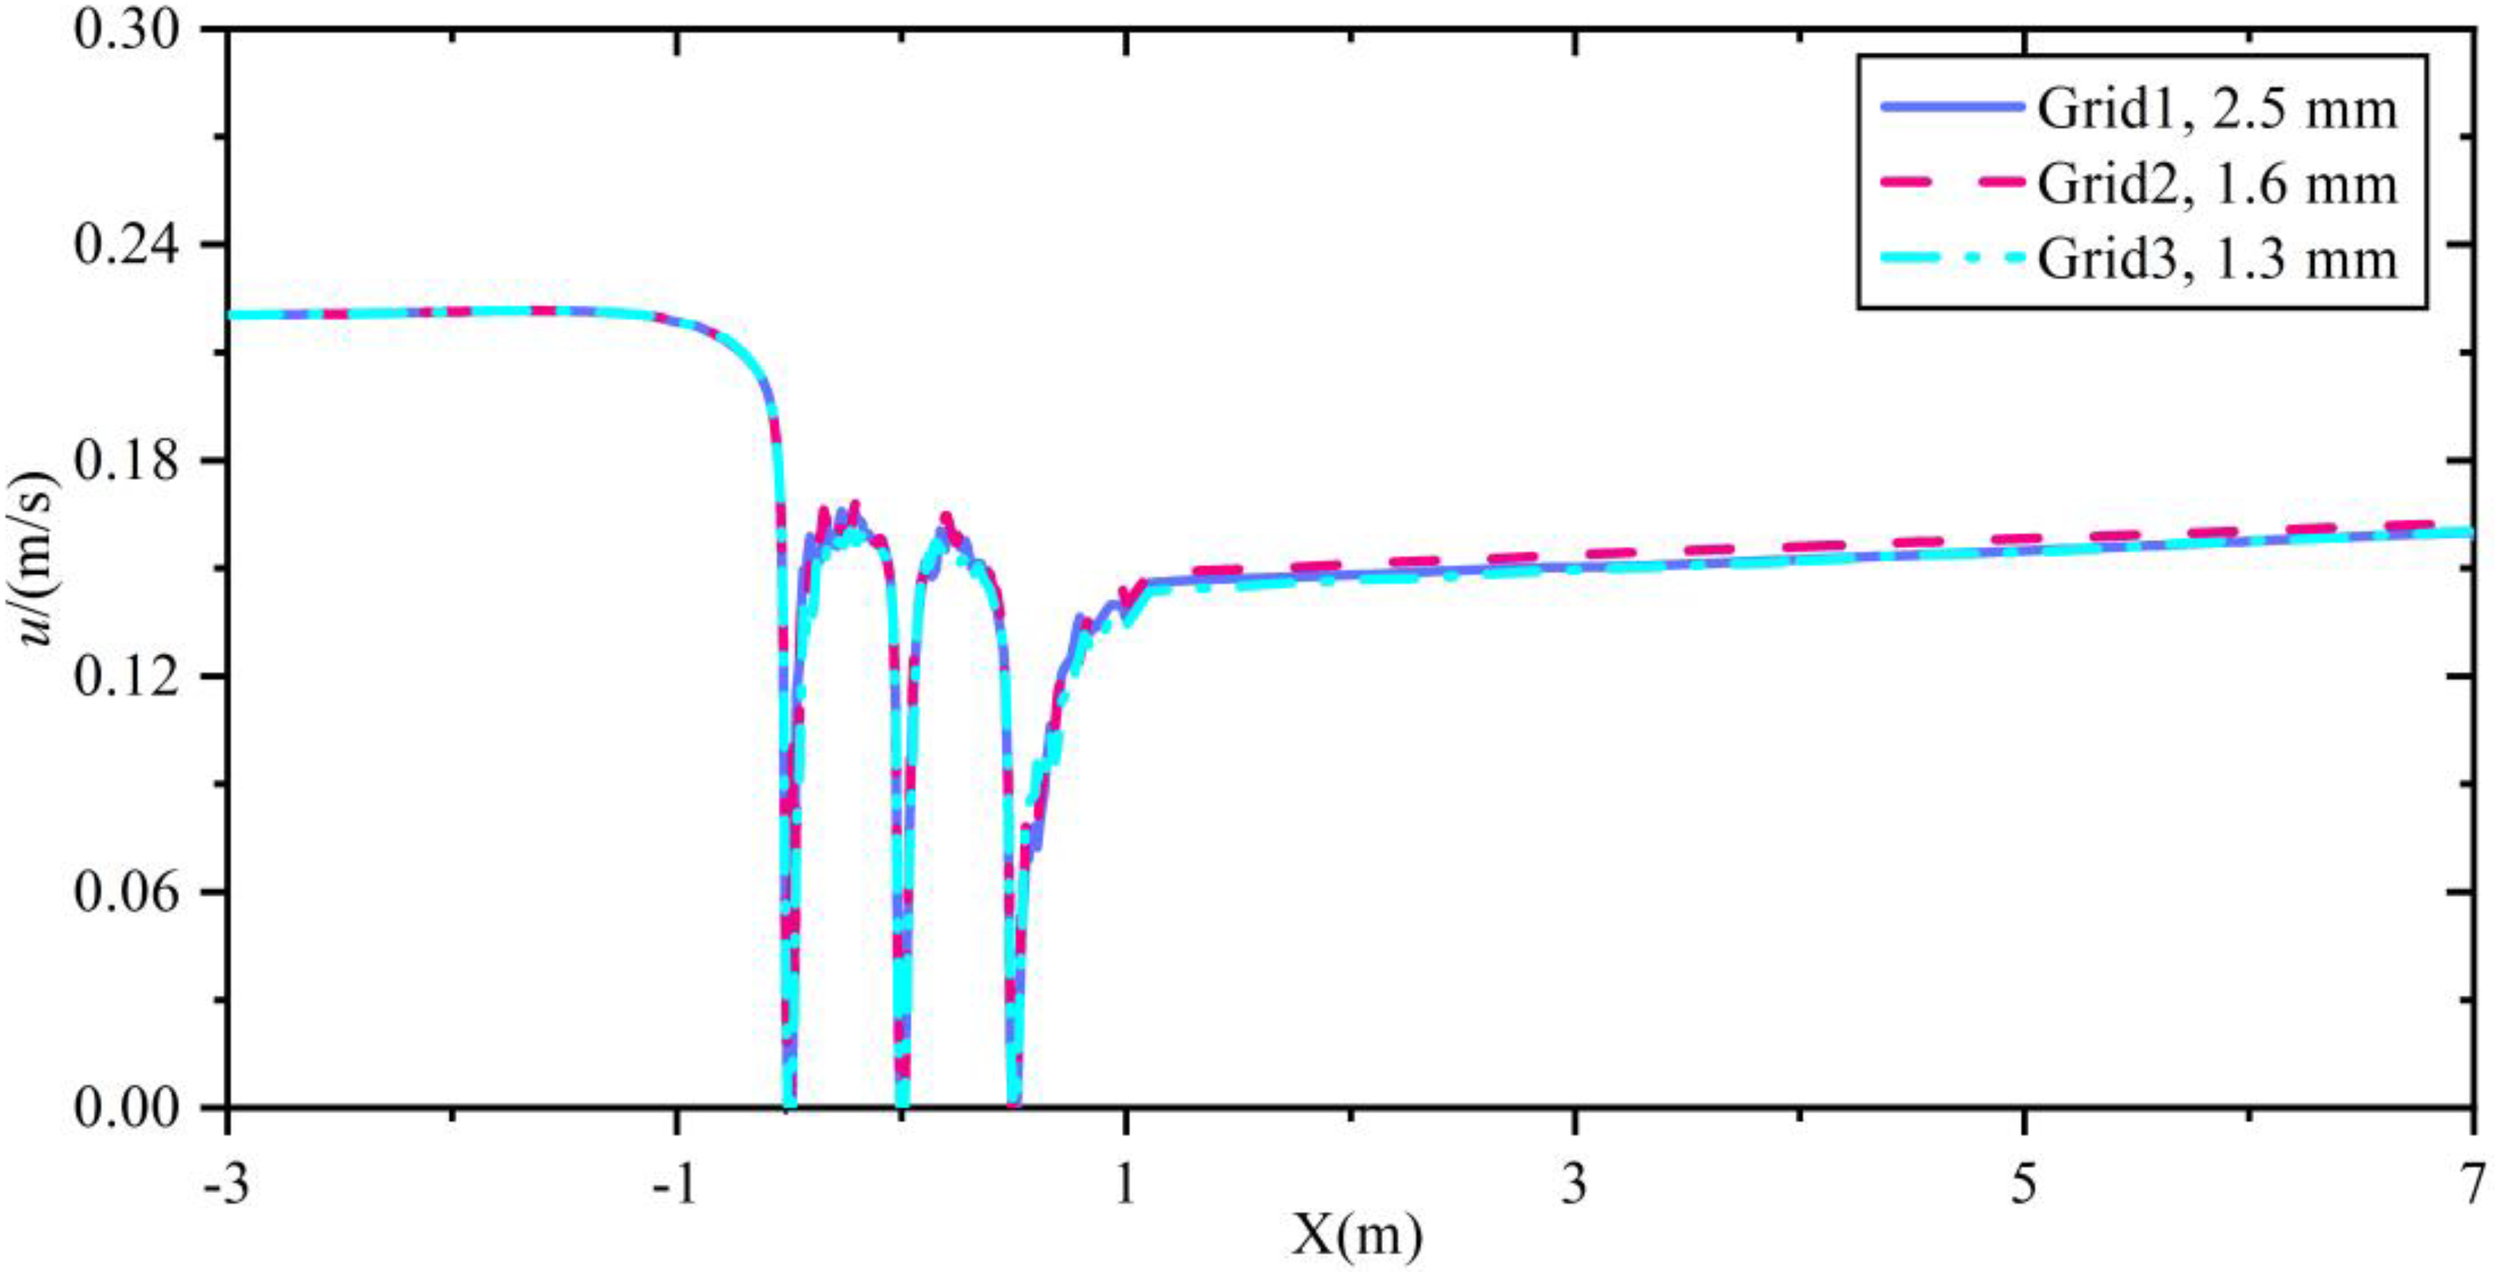
Influence of grid independence on calculation results.
2.3 Boundary and solution settings
To clarify the subsequent description of drag forces on each component, the semi-submersible truss fish cage components are detailed as follows: Side plane nets (Spun), Bottom plane nets (Bun), Pontoon (P), Thick column (Tkc), Thin column (Tnc), Lower diagonal brace (Ldb), Middle diagonal brace (Mdb), Lower cross brace (Lcb), Middle cross brace (Mcb) and Upper cross brace (Ucb) (Figure 6). The pontoons, thick columns, and thin columns are labeled clockwise, with numbers from 1 to 8. The central pontoon and column are labeled as number 9. Additionally, side plane nets, bottom plane nets, lower diagonal braces, middle diagonal braces, lower cross braces, and middle cross braces are labeled clockwise from 1 to 16 (Figure 7). Abbreviations can be used in subsequent descriptions of drag forces on each component.
Figure 6
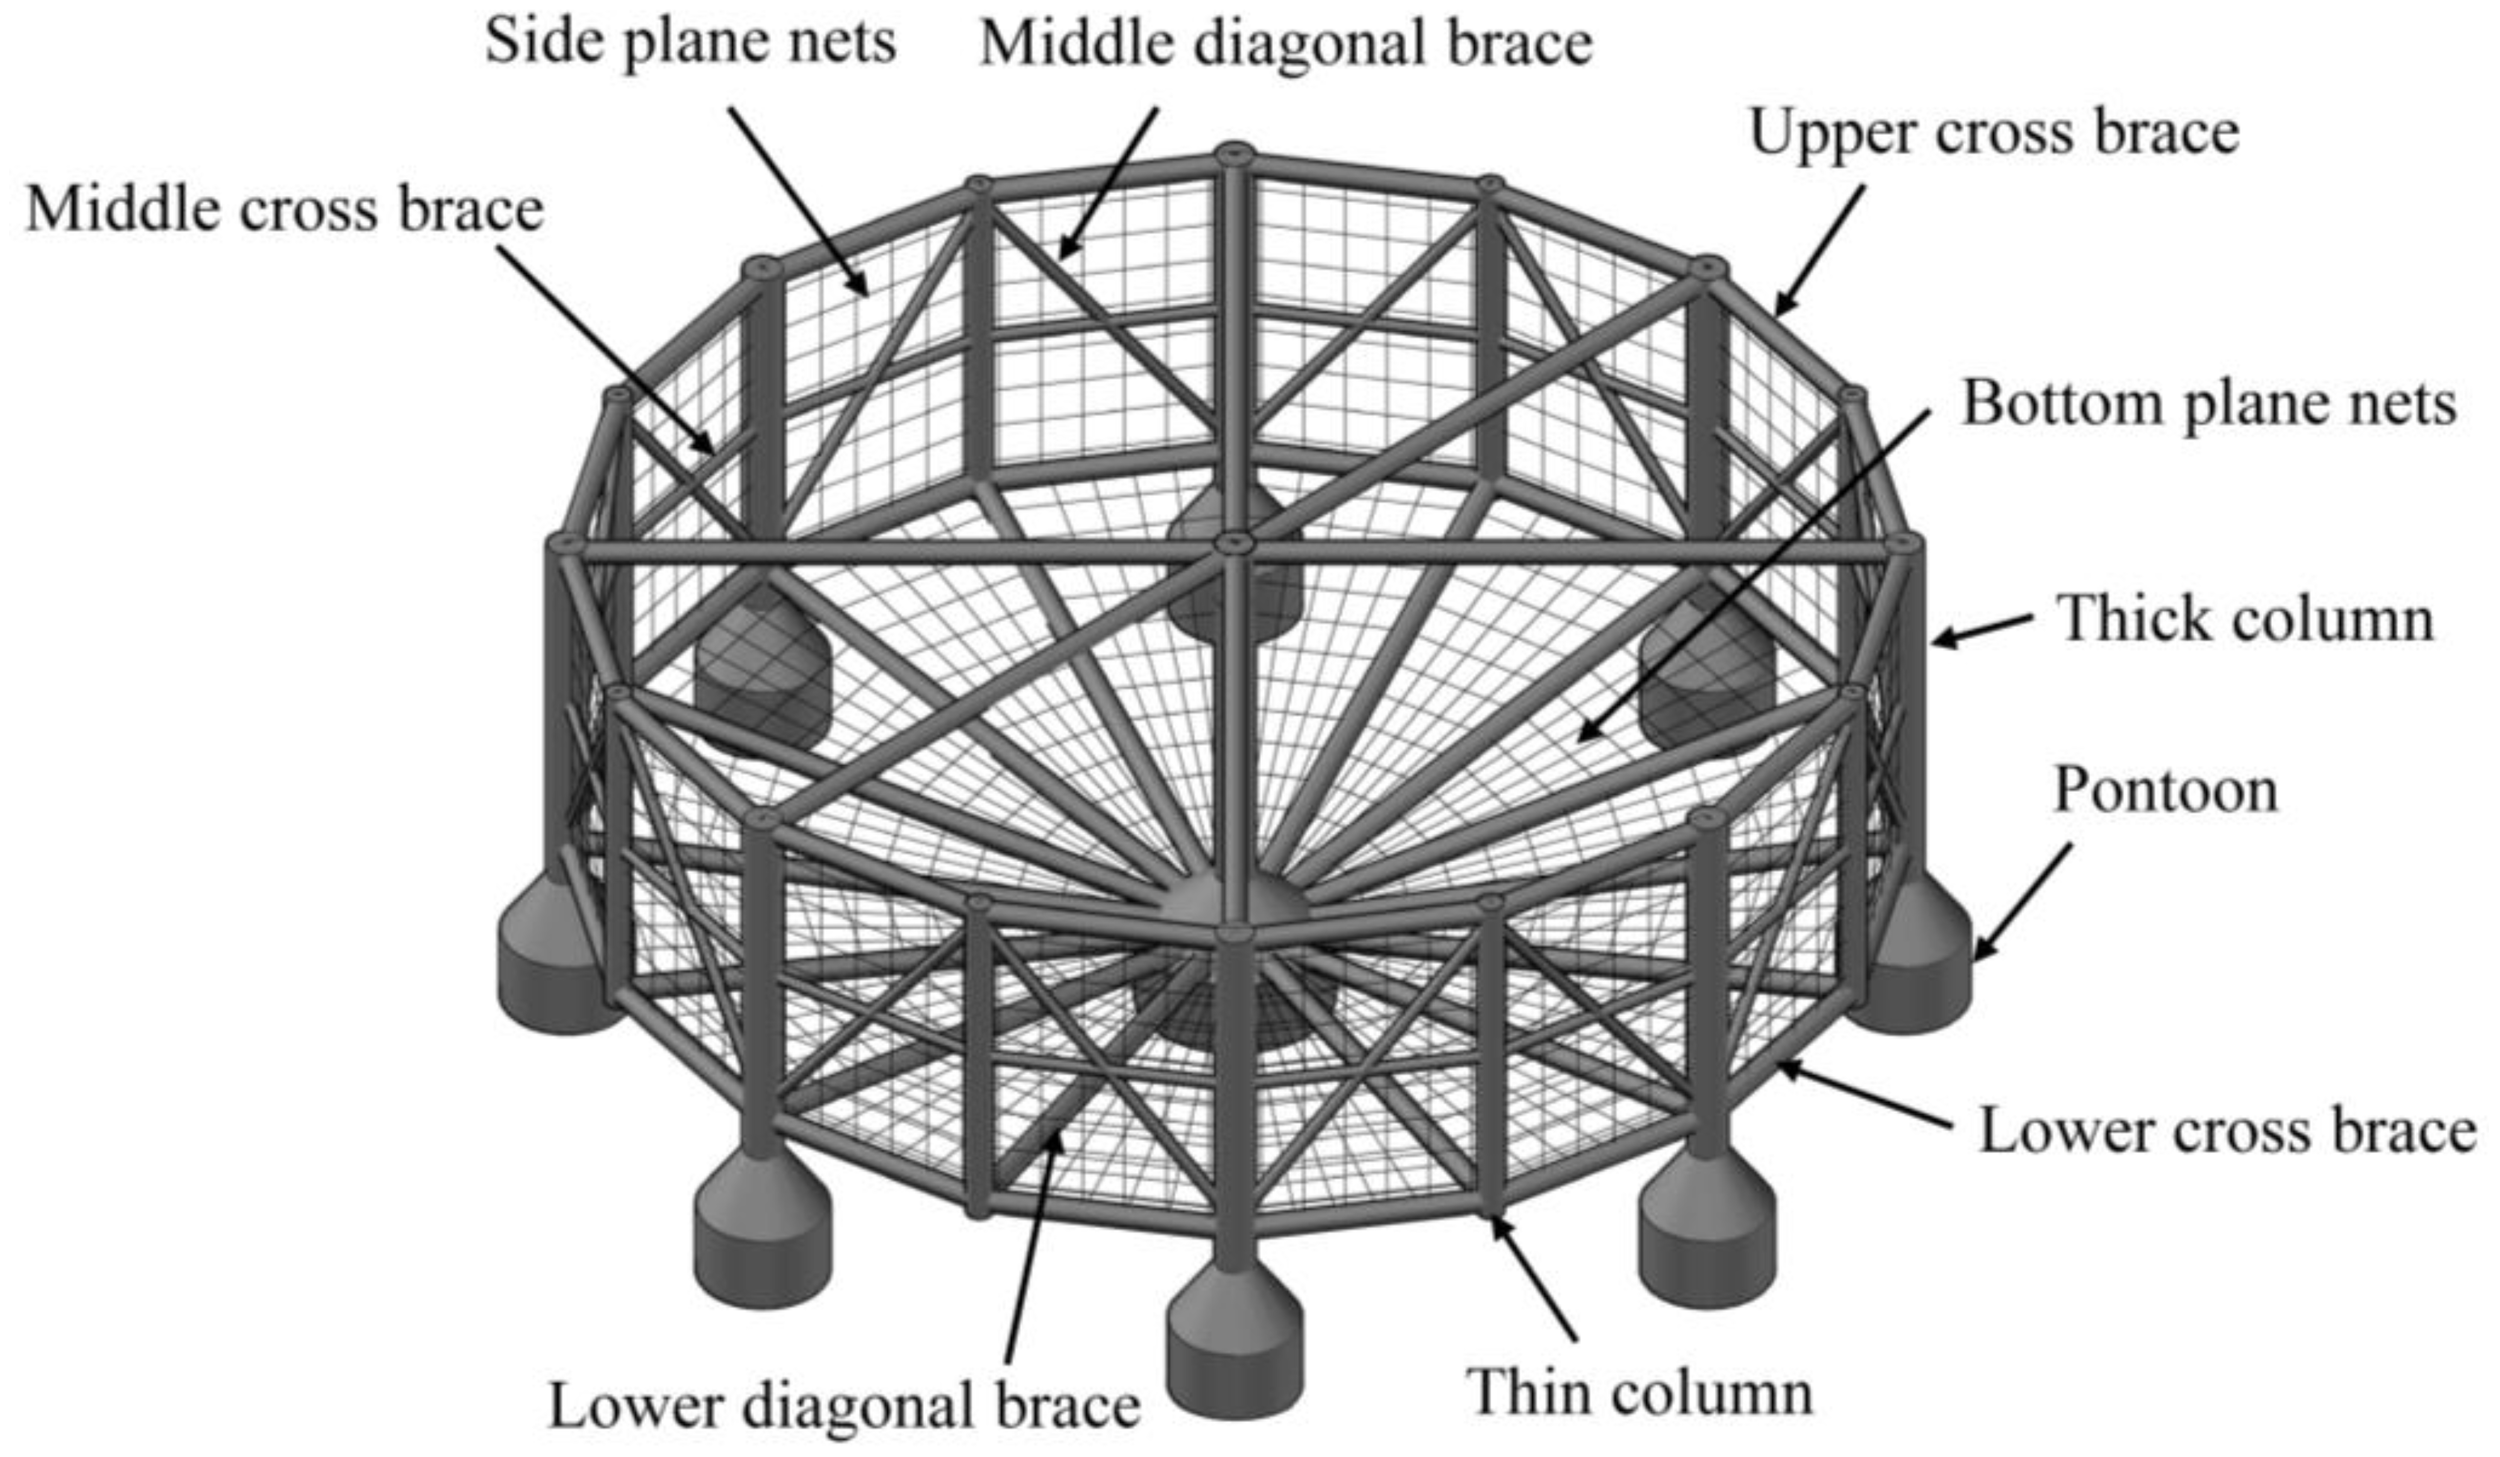
Schematic diagram of the structure of a semi-submersible truss fish cage.
Figure 7
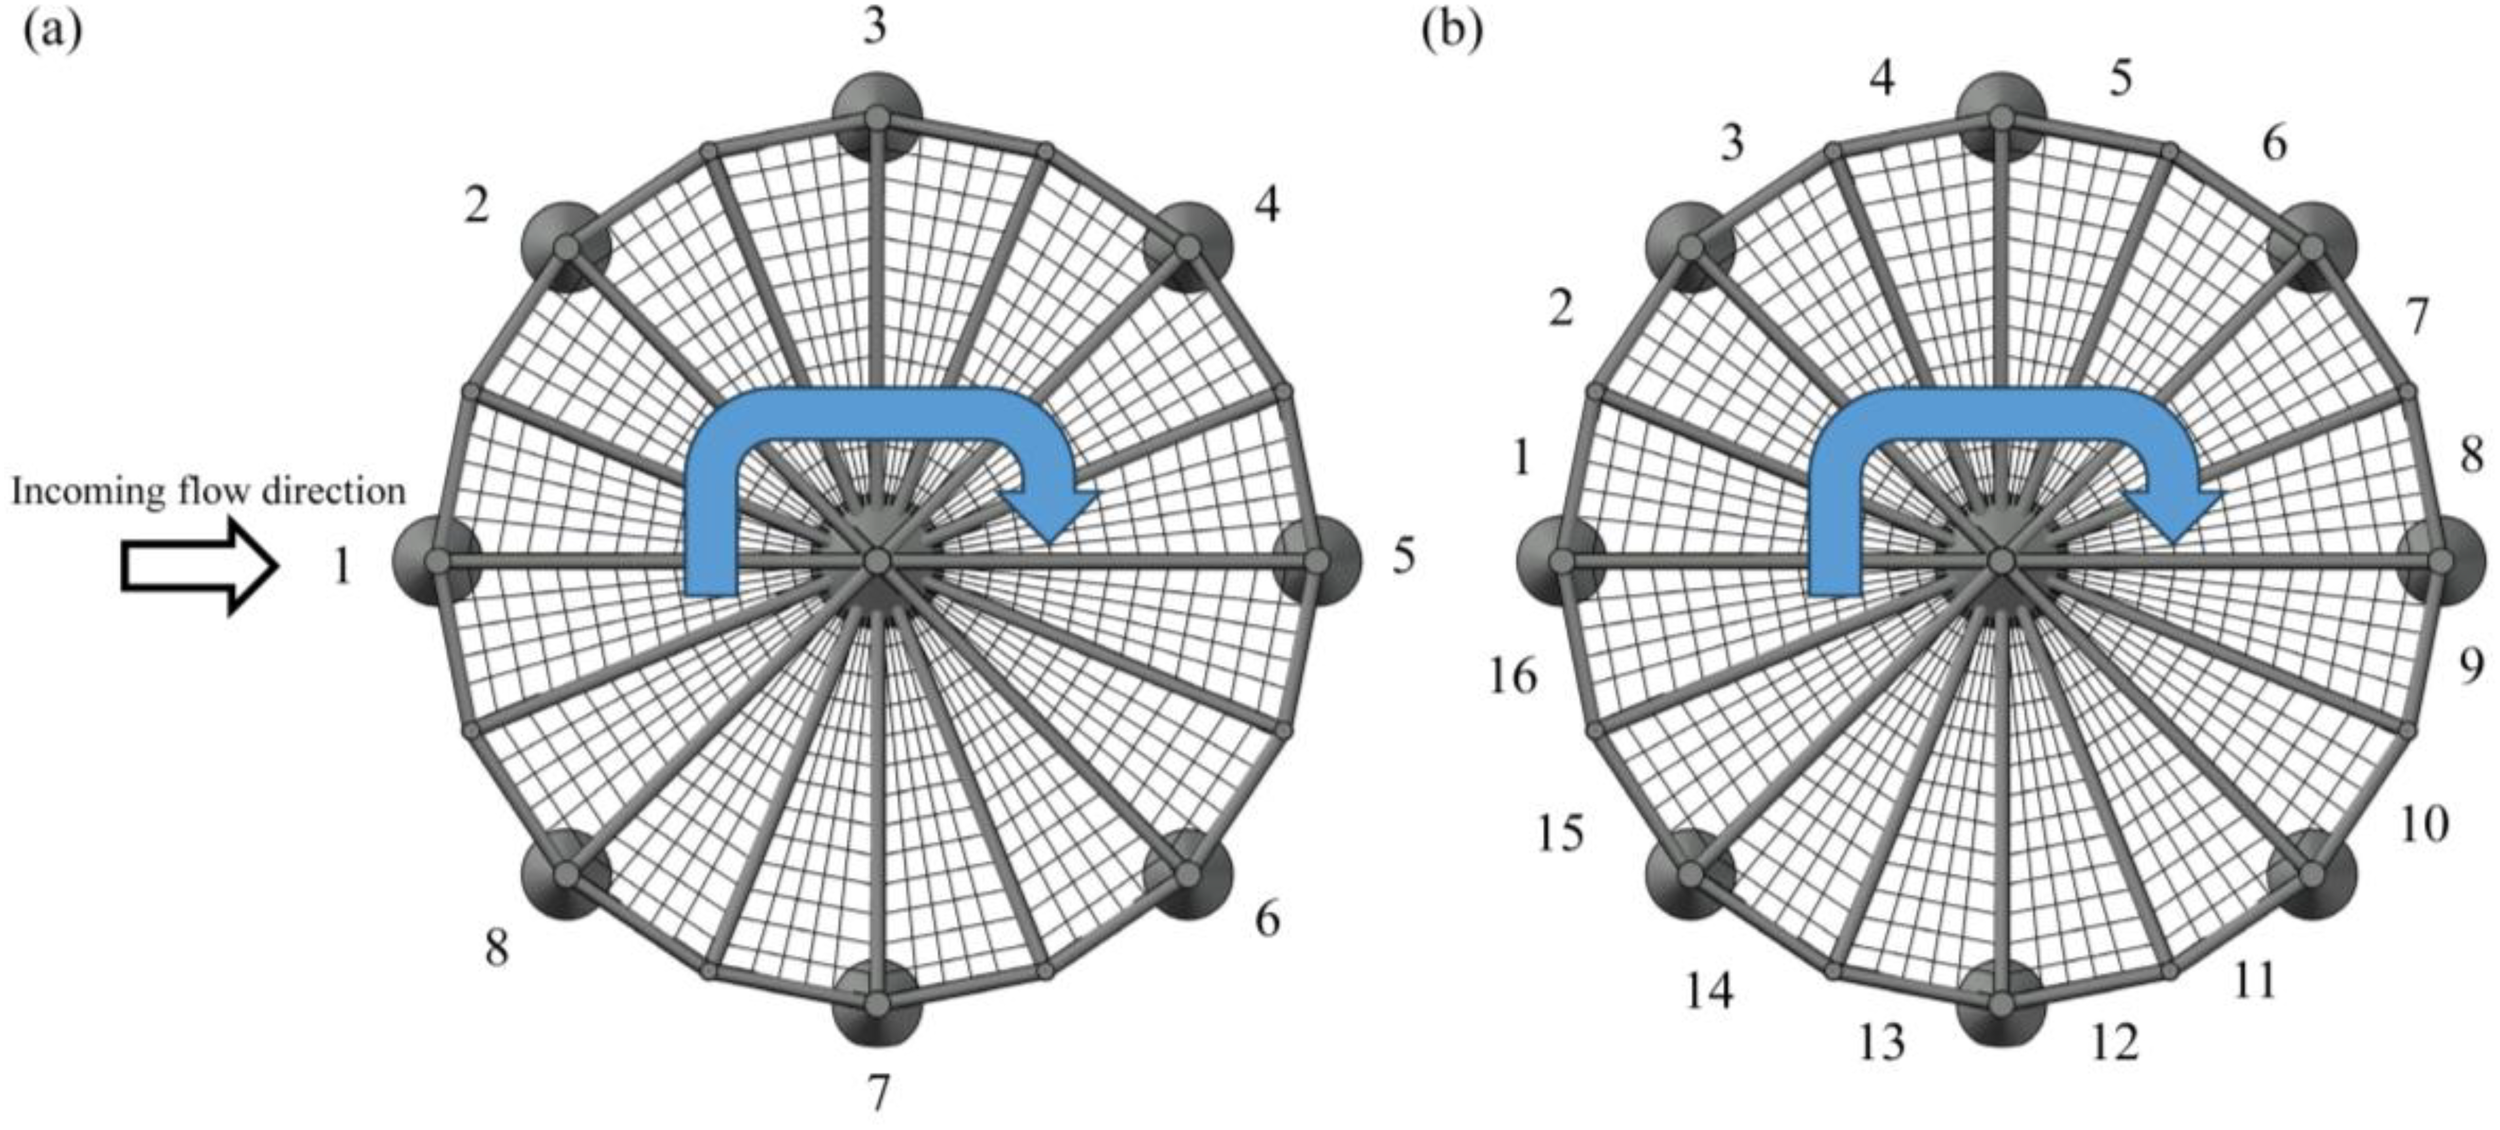
Semi-submersible truss fish cage component numbers and sequence: (a) Pontoons and columns and (b) Bottom plane nets, side plane nets and braces.
The coordinate system is positioned at the center of the semi-submersible truss fish cage, with the x-axis oriented in the incident current direction, adhering to the right-hand rule. Right and left boundaries are defined as velocity inlets and outflows, respectively, in a numerical flume. A zero shear force wall boundary condition is used to model the free surface. A stationary wall boundary condition without slip defines the side and bottom boundaries of the flume, as well as the main frame, as depicted in Figure 8. The governing equations, discretized via the finite volume method, are solved using the SIMPLEC algorithm within a 3D pressure-based solver framework implemented in CFD software. A second-order upwind scheme is used for discretizing pressure, momentum, turbulent kinetic energy, and specific dissipation rate. The simulation achieves convergence when all residuals fall below 0.001. The total number of grids is 9,345,381. The numerical simulation is conducted for 120 seconds with a time step of 0.005 s. The computations are performed on a Dell T7920 workstation equipped with 128 GB of RAM, an NVIDIA T600 4 GB graphics card, and an Intel Xeon Gold 6242R CPU with 16 cores and 32 threads, operating at a clock speed of 3.1 GHz.
Figure 8
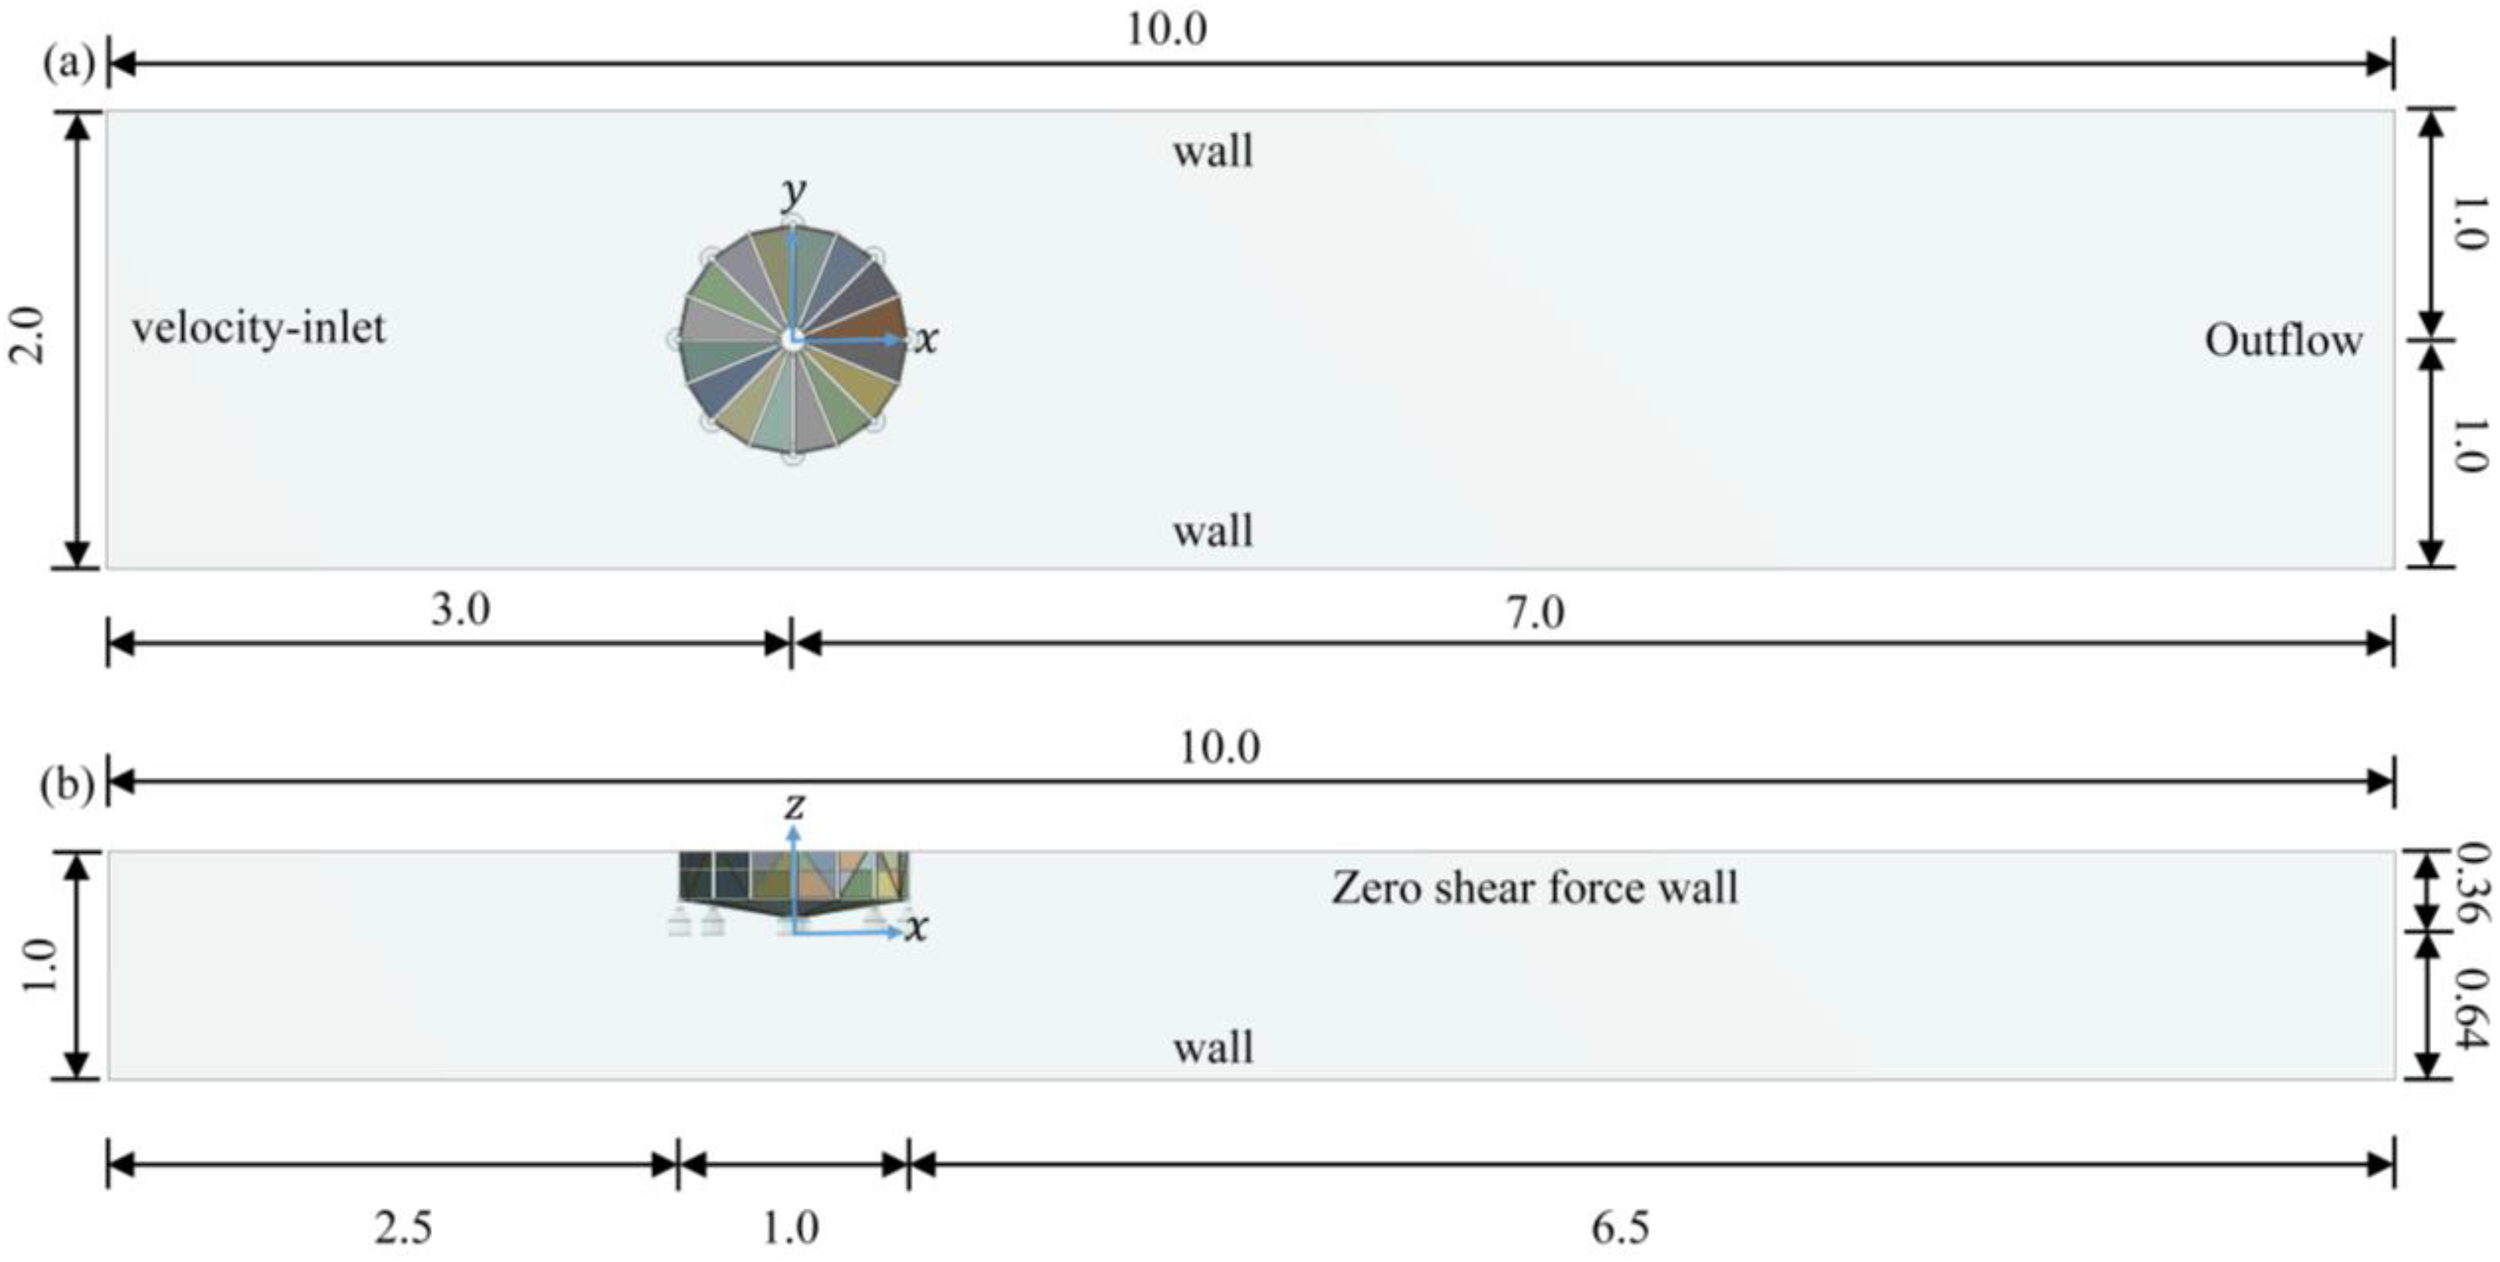
Boundary condition settings for the computational domains: (a) plan view and (b) elevation view (unit: m).
3 Experimental verifications
The present study adopts the gravity similarity criterion and the geometric scale is 1:120 and the net uses the variable scale gravity similarity criterion, with a mesh size and net diameter ratio of 40:8 (Zhao et al., 2019). The semi-submersible truss fish cage model is 0.41 m high and 1.0 m in diameter. The detailed structural dimensions are shown in Table 1. Experimental validation of the numerical model was performed in a wave-current flume at the State Key Laboratory of Coastal and Offshore Engineering, Dalian University of Technology, Dalian, China., to verify its rationality and accuracy. The present study considers the current forces exerted on a semi-submersible truss fish cage with a working draught of 36 cm in a 1.0 m deep flume. Four incident flow velocities were selected for validation, and their corresponding model values and prototype values are shown in Table 2. The porous medium has a thickness of 5 mm, with two layers of tetrahedral grids arranged along the thickness direction to better connect the plane nets and the column boundaries. A temporal interval of 0.005 s is utilized, and the calculation runs for 120 seconds to achieve stability. The comparison of current load exerted on the truss net cage between numerical simulation and experiment is depicted in Figure 9.
Table 1
| Component | Parameter | Model value (m) | Prototype value (m) |
|---|---|---|---|
| Pontoon | Height | 0.110 | 13.2 |
| Diameter | 0.100 | 12.0 | |
| Thick column | Height | 0.300 | 36.0 |
| Diameter | 0.030 | 3.6 | |
| Thin column | Height | 0.280 | 33.6 |
| Diameter | 0.020 | 2.4 | |
| Inclined column | Length | 0.300 | 36.0 |
| Diameter | 0.008 | 0.96 | |
| Bottom brace | Length | 0.500 | 60.0 |
| Diameter | 0.016 | 1.92 | |
| Net system | Net diameter | 0.0006 | 0.00375 |
| Mesh size | 0.008 | 0.05 |
Geometric dimensions of truss net cage.
Table 2
| Model value (m/s) | Prototype value (m/s) |
|---|---|
| 0.0571 | 0.6255 |
| 0.1033 | 1.1315 |
| 0.1519 | 1.6639 |
| 0.2204 | 2.4143 |
Incident current speed value.
Figure 9
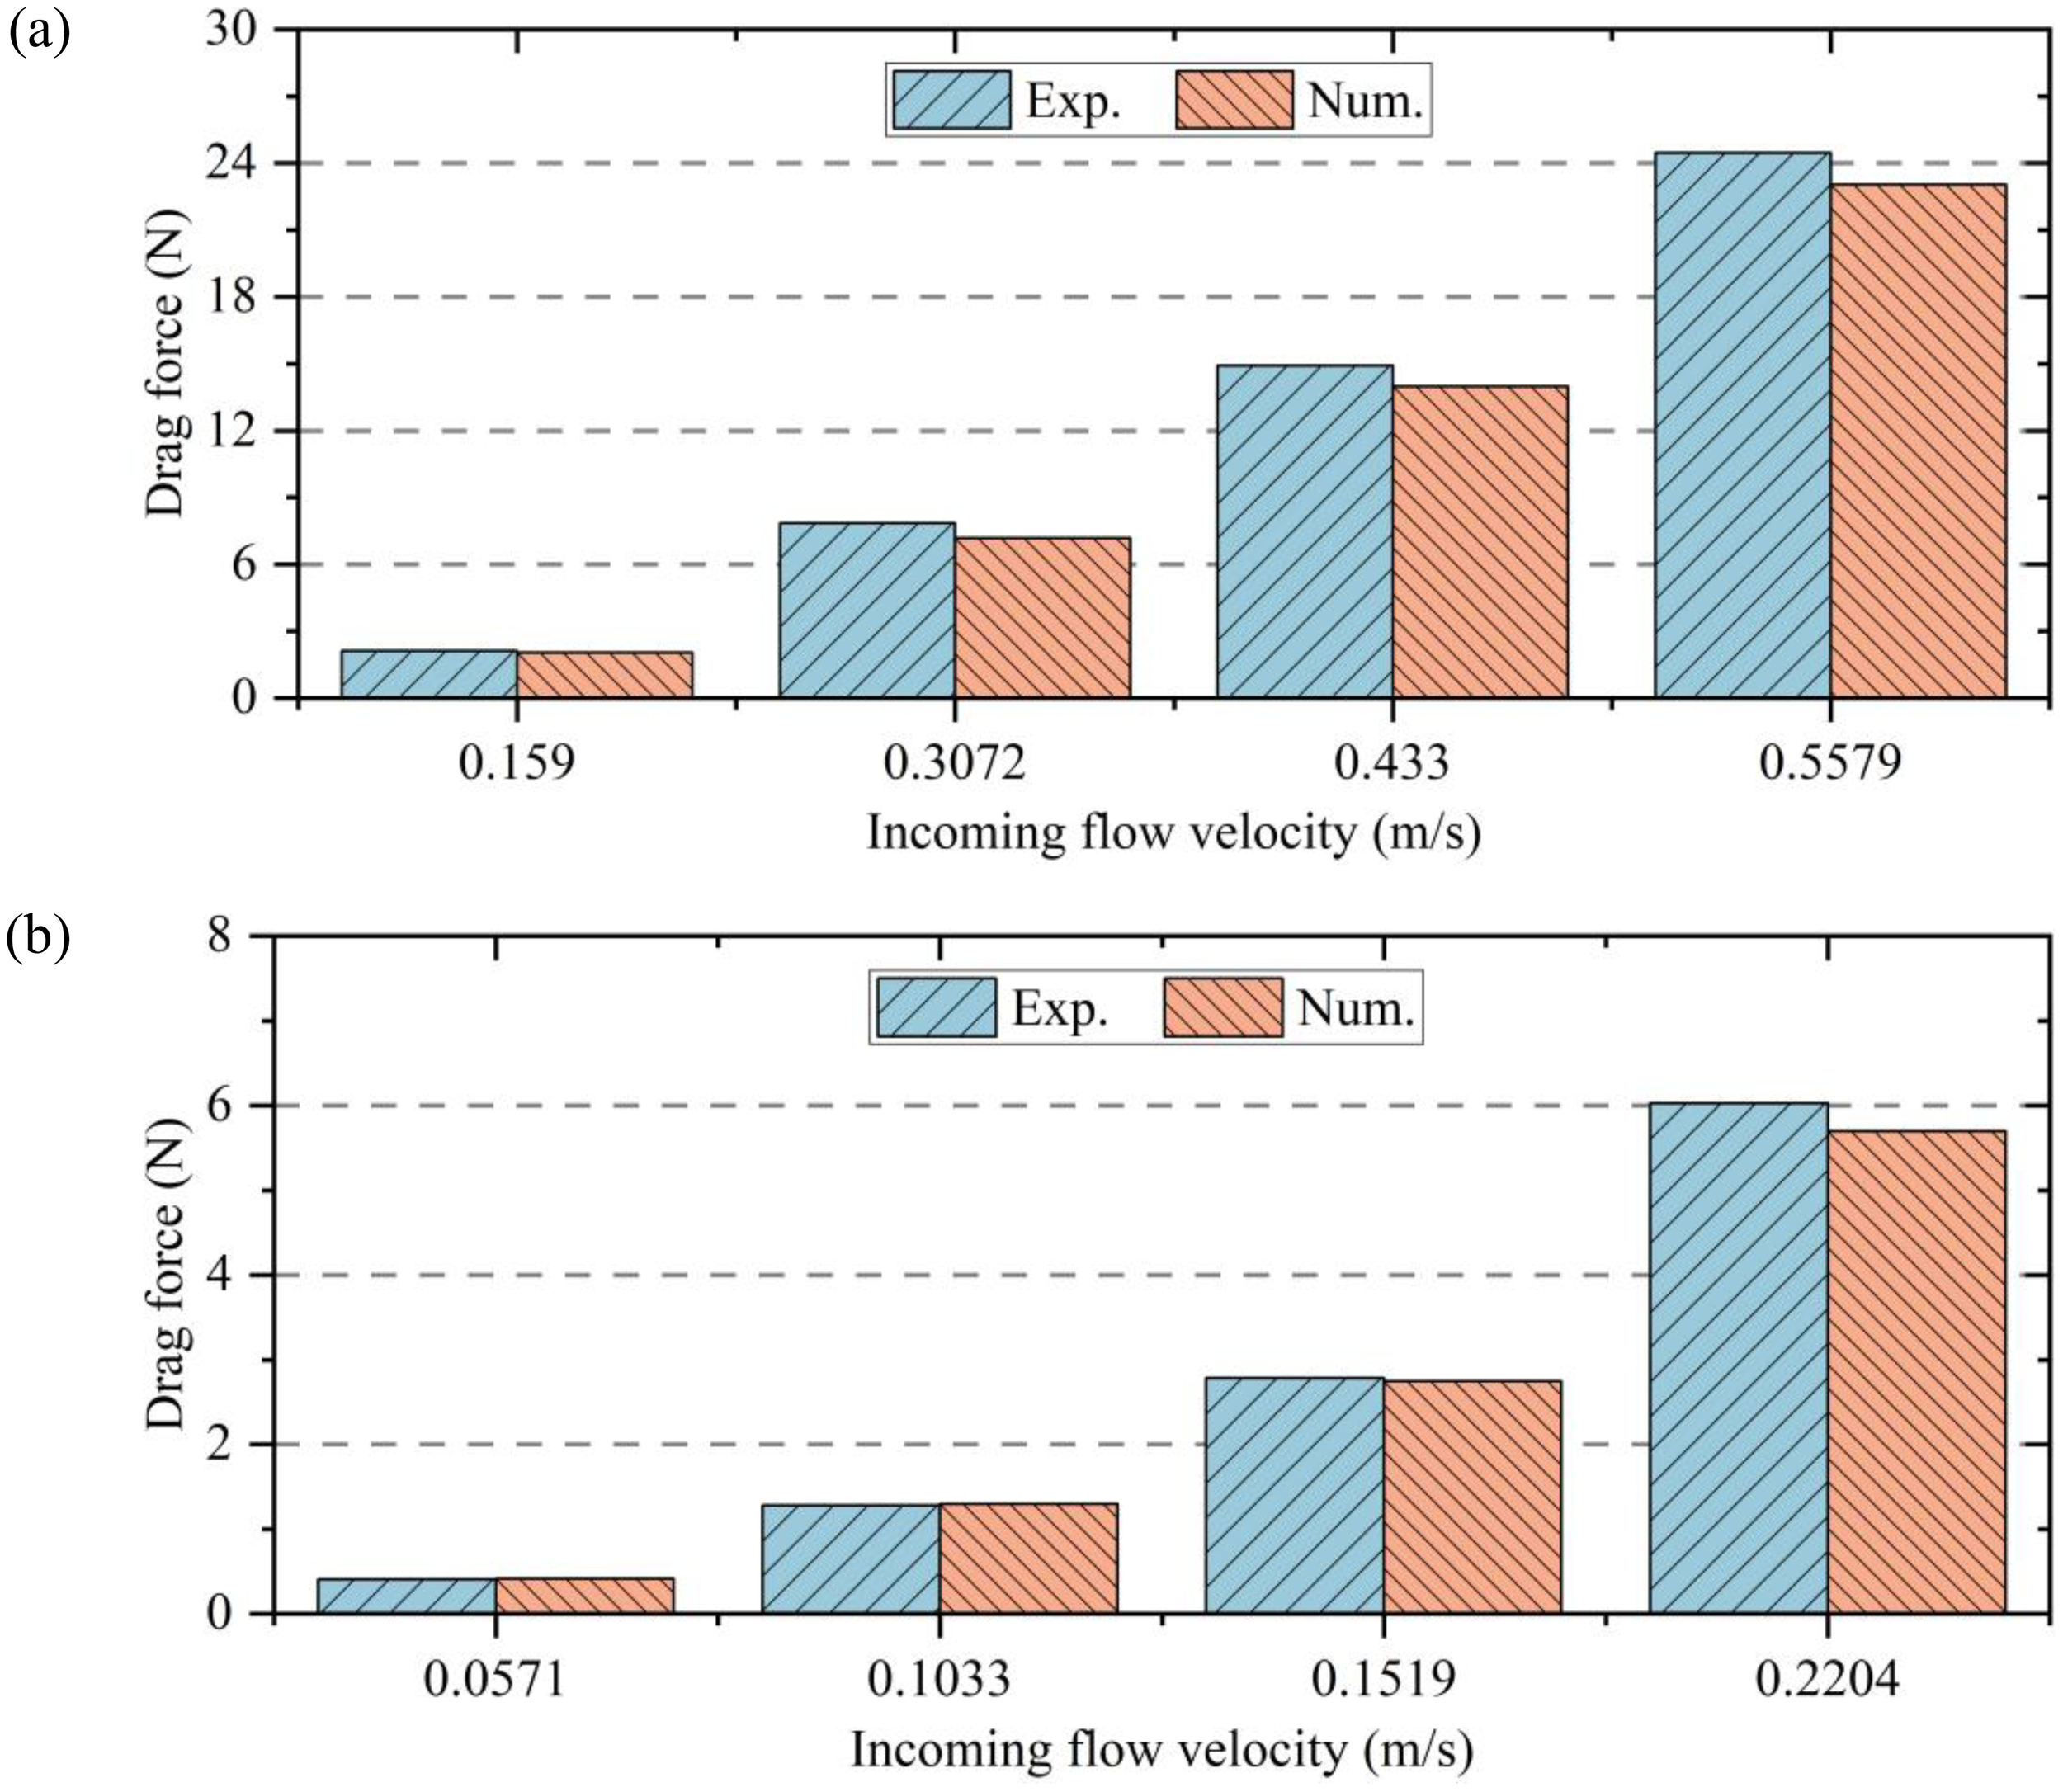
The comparison of drag force exerted on the semi-submersible truss fish cage between numerical simulation and experiment: (a) single plane nets and (b) semi-submersible truss fish cage.
It can be observed from Figures 9a, b that the numerical simulation results approximate the experimental data for the single plane nets and semi-submersible truss fish cage. The average relative errors are 6.10% (single plane nets) and 2.61% (semi-submersible truss fish cage), respectively. The results of the numerical simulation lie within a valid range. This numerical model can be used for further numerical simulation studies to provide support for understanding the pattern of drag forces exerted on various components of the semi-submersible truss fish cage.
4 Results and discussions
4.1 Drag force acting on the plane nets
Currently, a majority of researchers emphasize the overall loading on the net cages, neglecting the current load exerted on individual fishing plane nets, resulting in a lack of understanding of the current load on single plane nets within the truss net cage in current. This oversight hinders accurate identification of maximum loading areas on net cages and limits the ability to predict or prevent damage to plane nets. To address these challenges, the present section examines the current load exerted on individual plane nets of the truss net cage, comprising the side plane nets and bottom plane nets, and analyzes the variation patterns of current load at different positions. Additionally, this study accounts for the blocking consequence of plane nets on the current, which reduces current speed and alters current load on the downstream side, aligning more closely with actual loading conditions of truss net cages. In the following study, the incident current speed of 0.2204 m/s is selected and applied to analyze the distribution of current load exerted on the semi-submersible truss fish cage.
Figure 10 illustrates the distribution of current loads on the side plane nets of the semi-submersible truss fish cage. It can be observed from Figure 10 that the current load is greatest on the upstream side plane nets, specifically Spn1 and Spn16. Along the current direction, the drag force gradually decreases, reaching its minimum at Spn5 and Spn12. Thereafter, it increases again, peaking at Spn8 and Spn9. Overall, the current load on the side plane nets shows a symmetrical pattern along the incoming current direction (0°- 180°line), with peak drag force values appearing on both sides and troughs in the middle. Calculations show that the current load on the upstream side plane net (Spn1) is 3.5 times that on Spn5, indicating that the upstream side plane nets endure substantial current load and thus face a higher risk of damage. By comparison, the current load on the downstream side plane nets (Spn8) is approximately 76.3% of that on the upstream side plane nets (Spn1), reflecting a 23.7% decay. The blocking consequence of the upstream plane nets on the current results in a decreased current speed on the downstream side, leading to reduced current load on the downstream side plane nets.
Figure 10
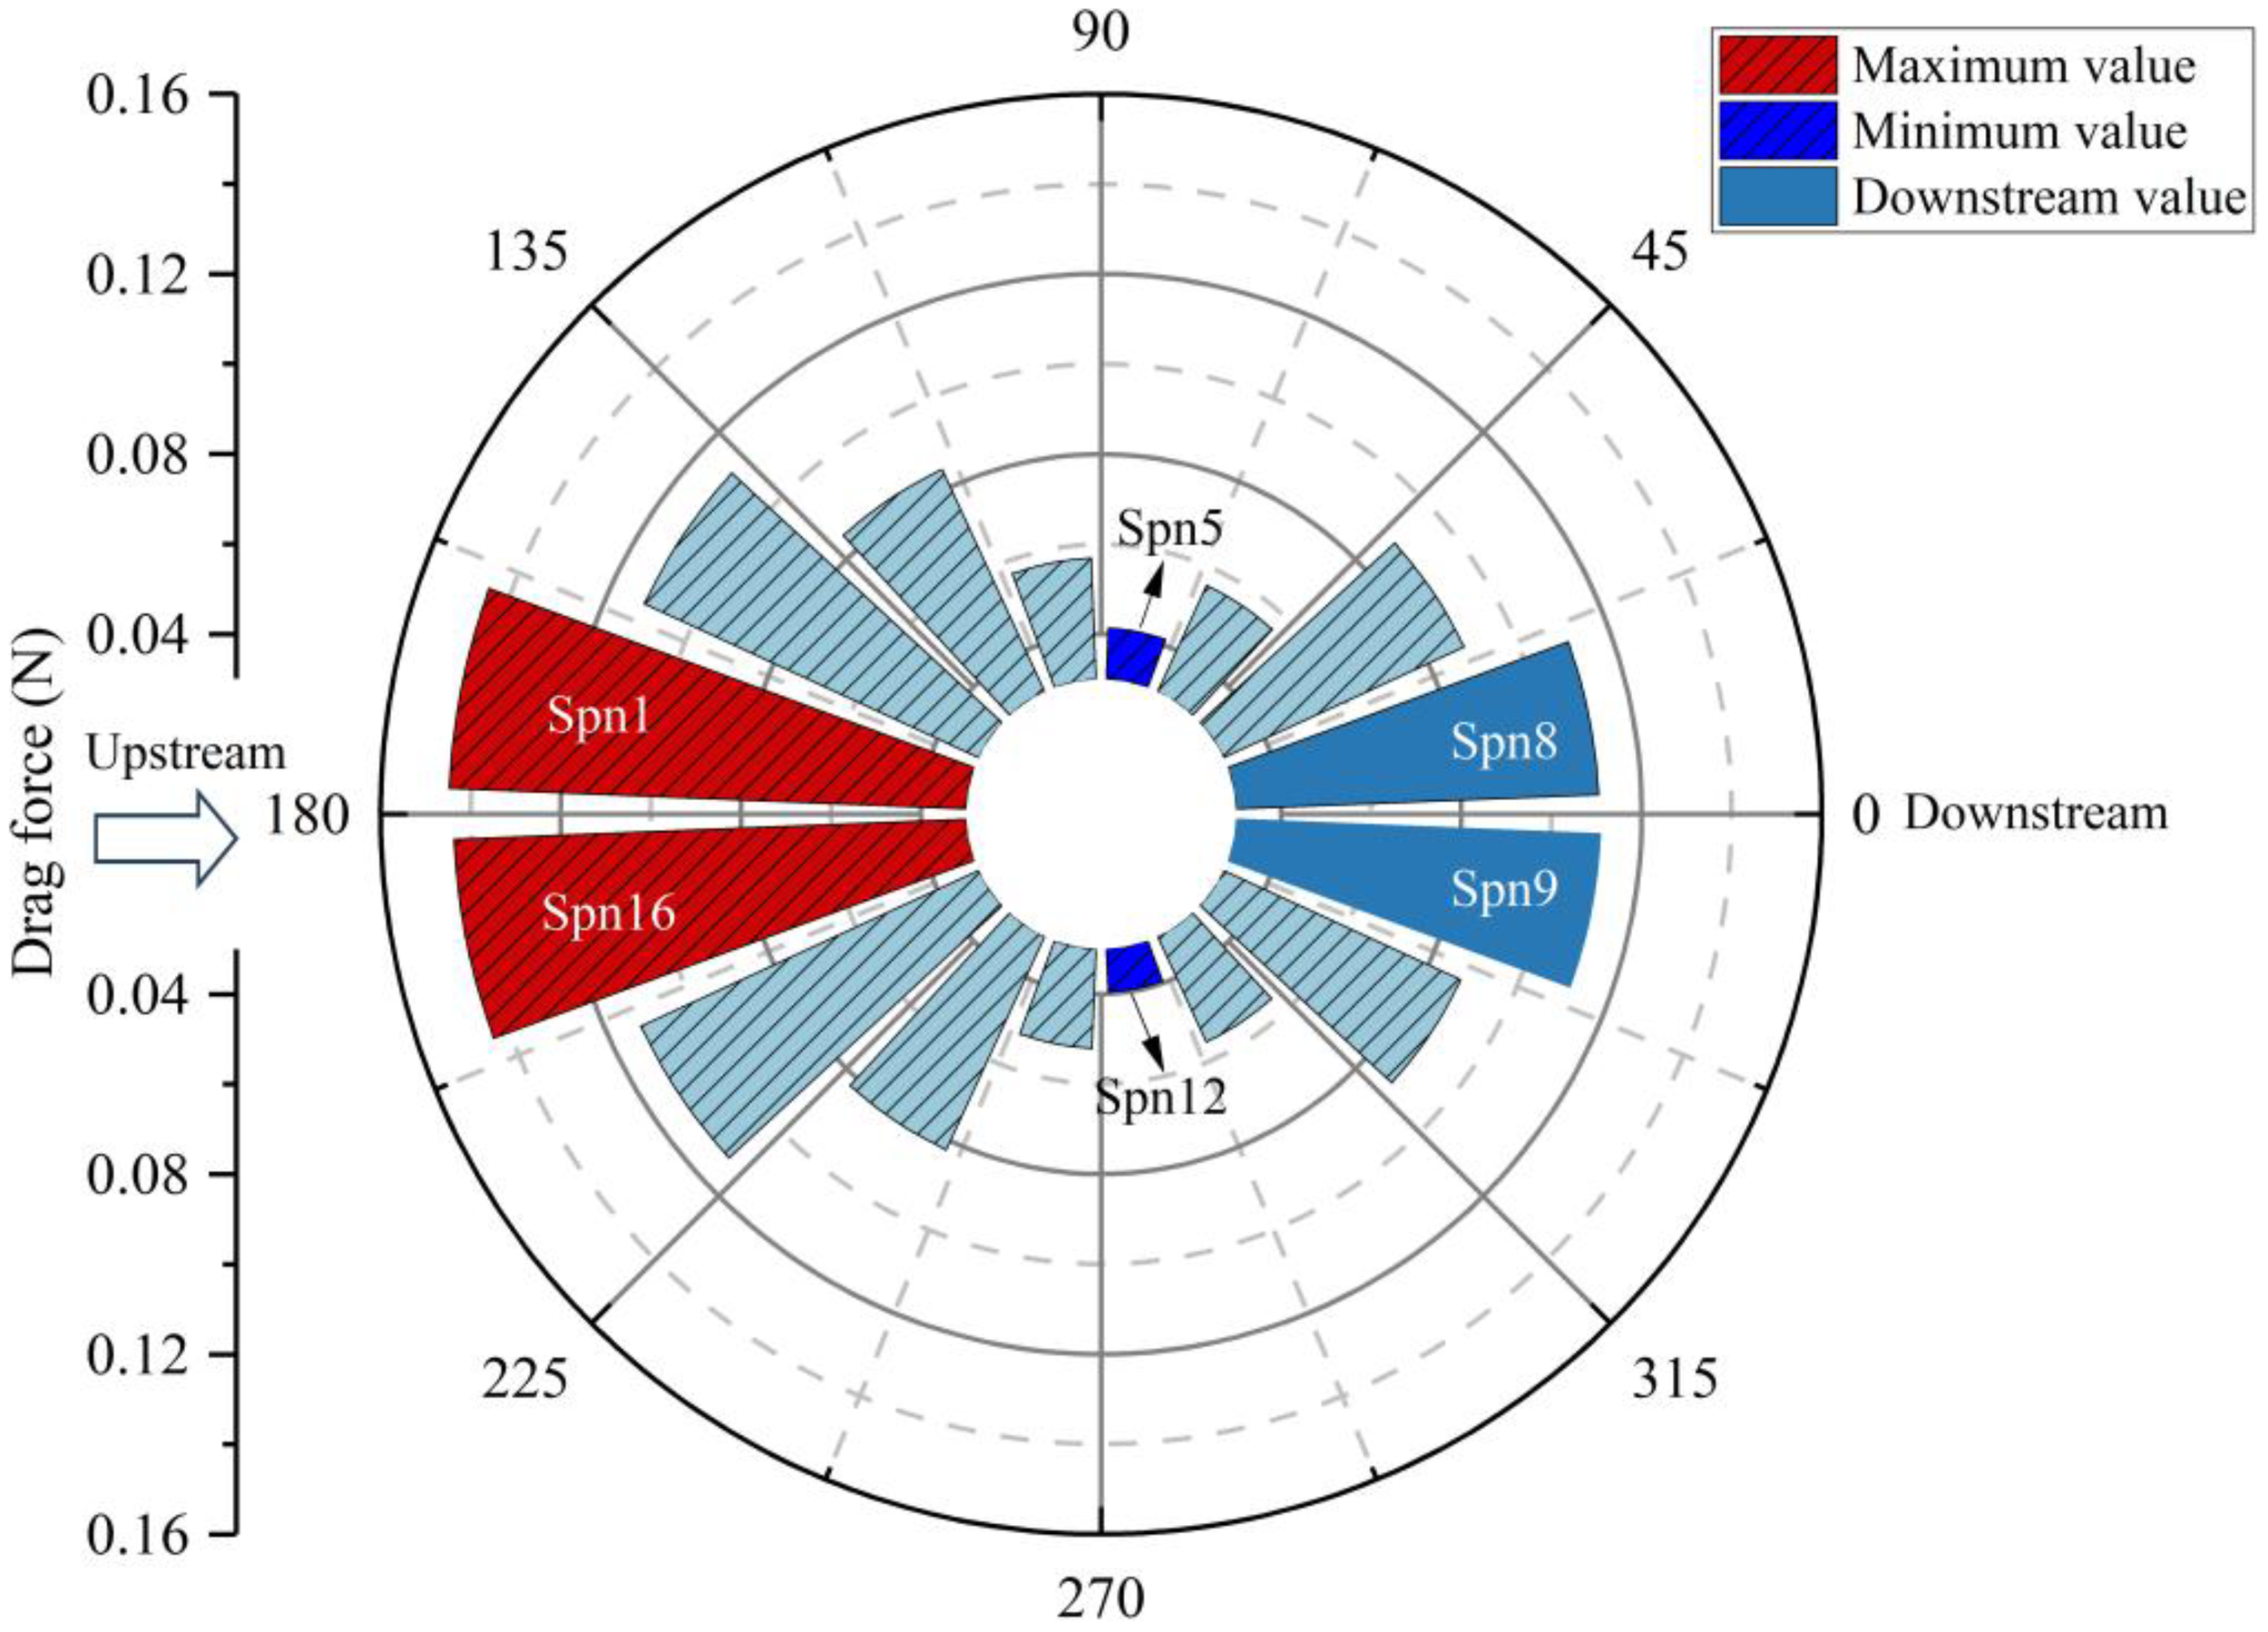
Drag force exerted on the side plane nets of the truss net cage.
Figure 11 displays the distribution of current loads on the bottom plane nets of the semi-submersible truss fish cage. On the upstream side of the truss net cage, the current load does not reach a peak value (Bpn1 and Bpn16). Instead, the maximum current load is observed at Bpn2 and Bpn15. The variation in current load along the current direction does not show a consistently increasing or decreasing trend, and the pattern of variation is not obvious. Additionally, the minimum drag force is found on the downstream side of the truss net cage (Bpn7 and Bpn8). Overall, the current load on the upstream and downstream sides of the bottom net is relatively small, while it is larger on the lateral sides of the bottom plane nets (Bpn2 and Bpn15). Quantitative analysis reveals that the current load on Bpn2 is 2.2 times that exerted on Bpn7. The arrangement of the bottom plane nets and the attenuation of current speed have a significant impact on the current load on the downstream side of the plane nets. The current load on Bpn2 accounts for approximately 9.4% of the total current load on the entire bottom plane nets, indicating that the strength of the plane nets at this position warrants particular attention. However, the current load on the bottom plane nets is 40.9% of that on the side plane nets. The side plane nets bear the majority of the current load, while the bottom plane nets experiences relatively less current load. Nonetheless, both are crucial in preventing farmed fish from escaping.
Figure 11
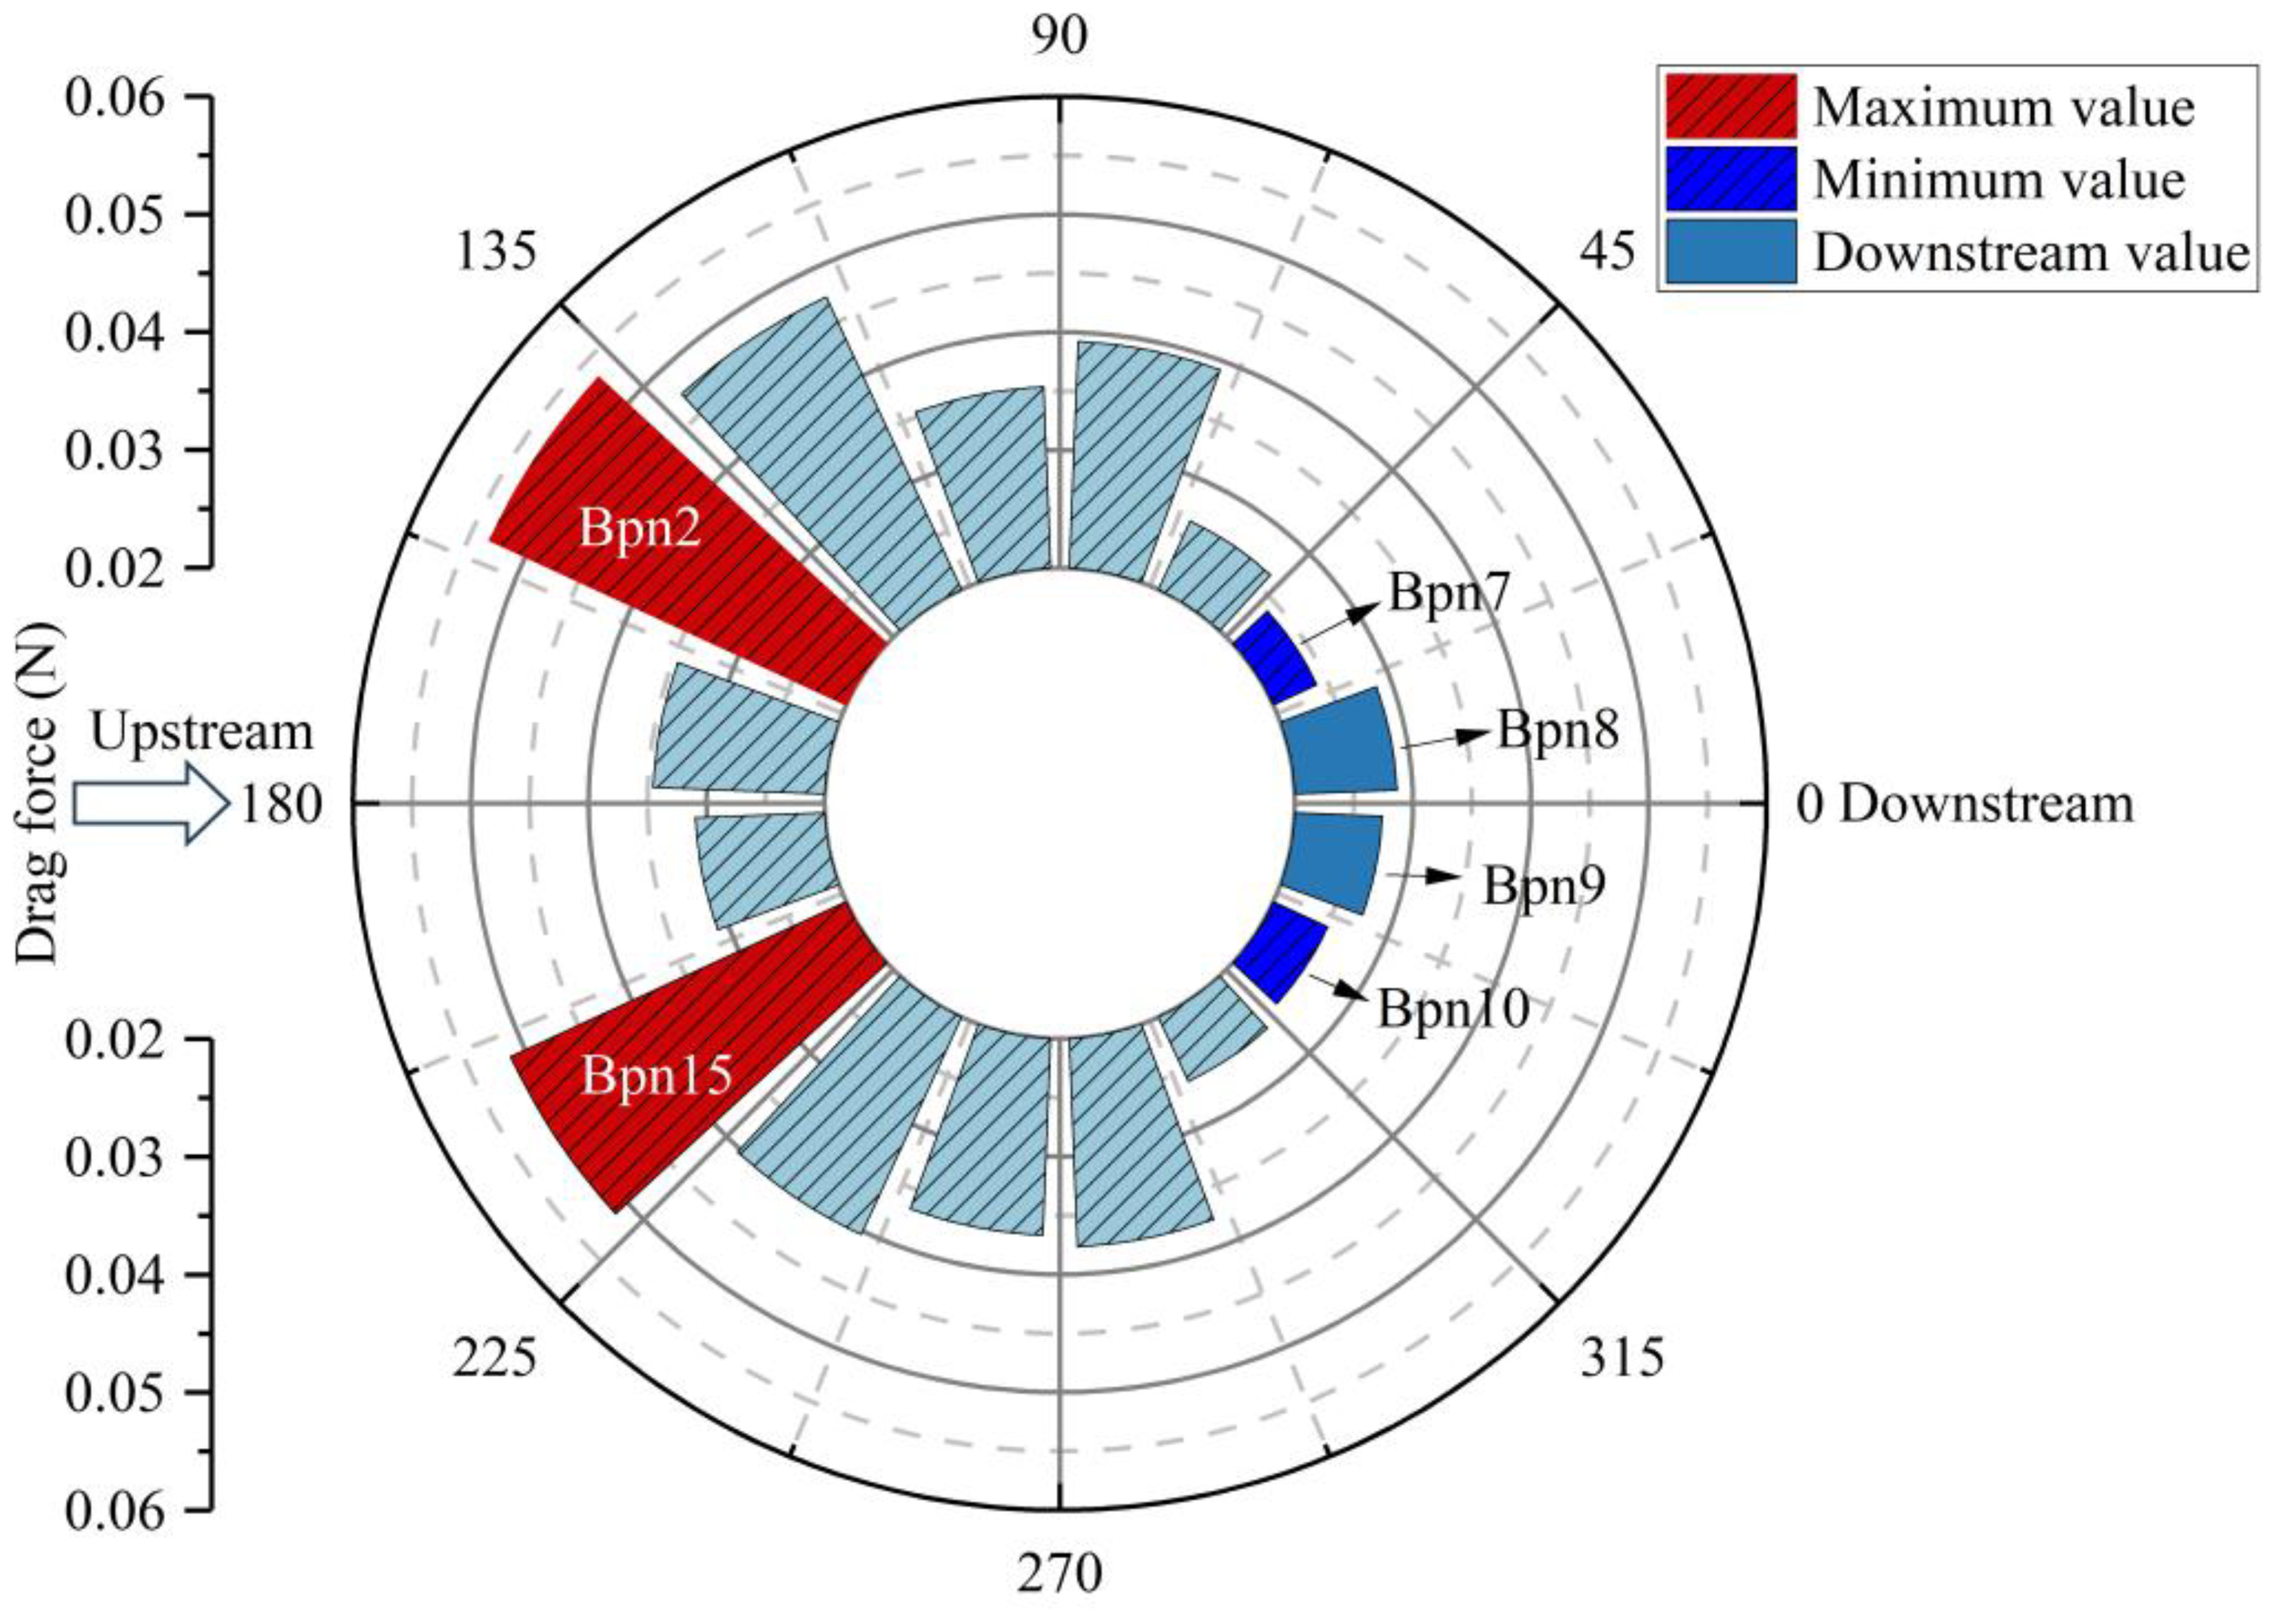
Drag force exerted on the bottom plane nets of the truss net cage.
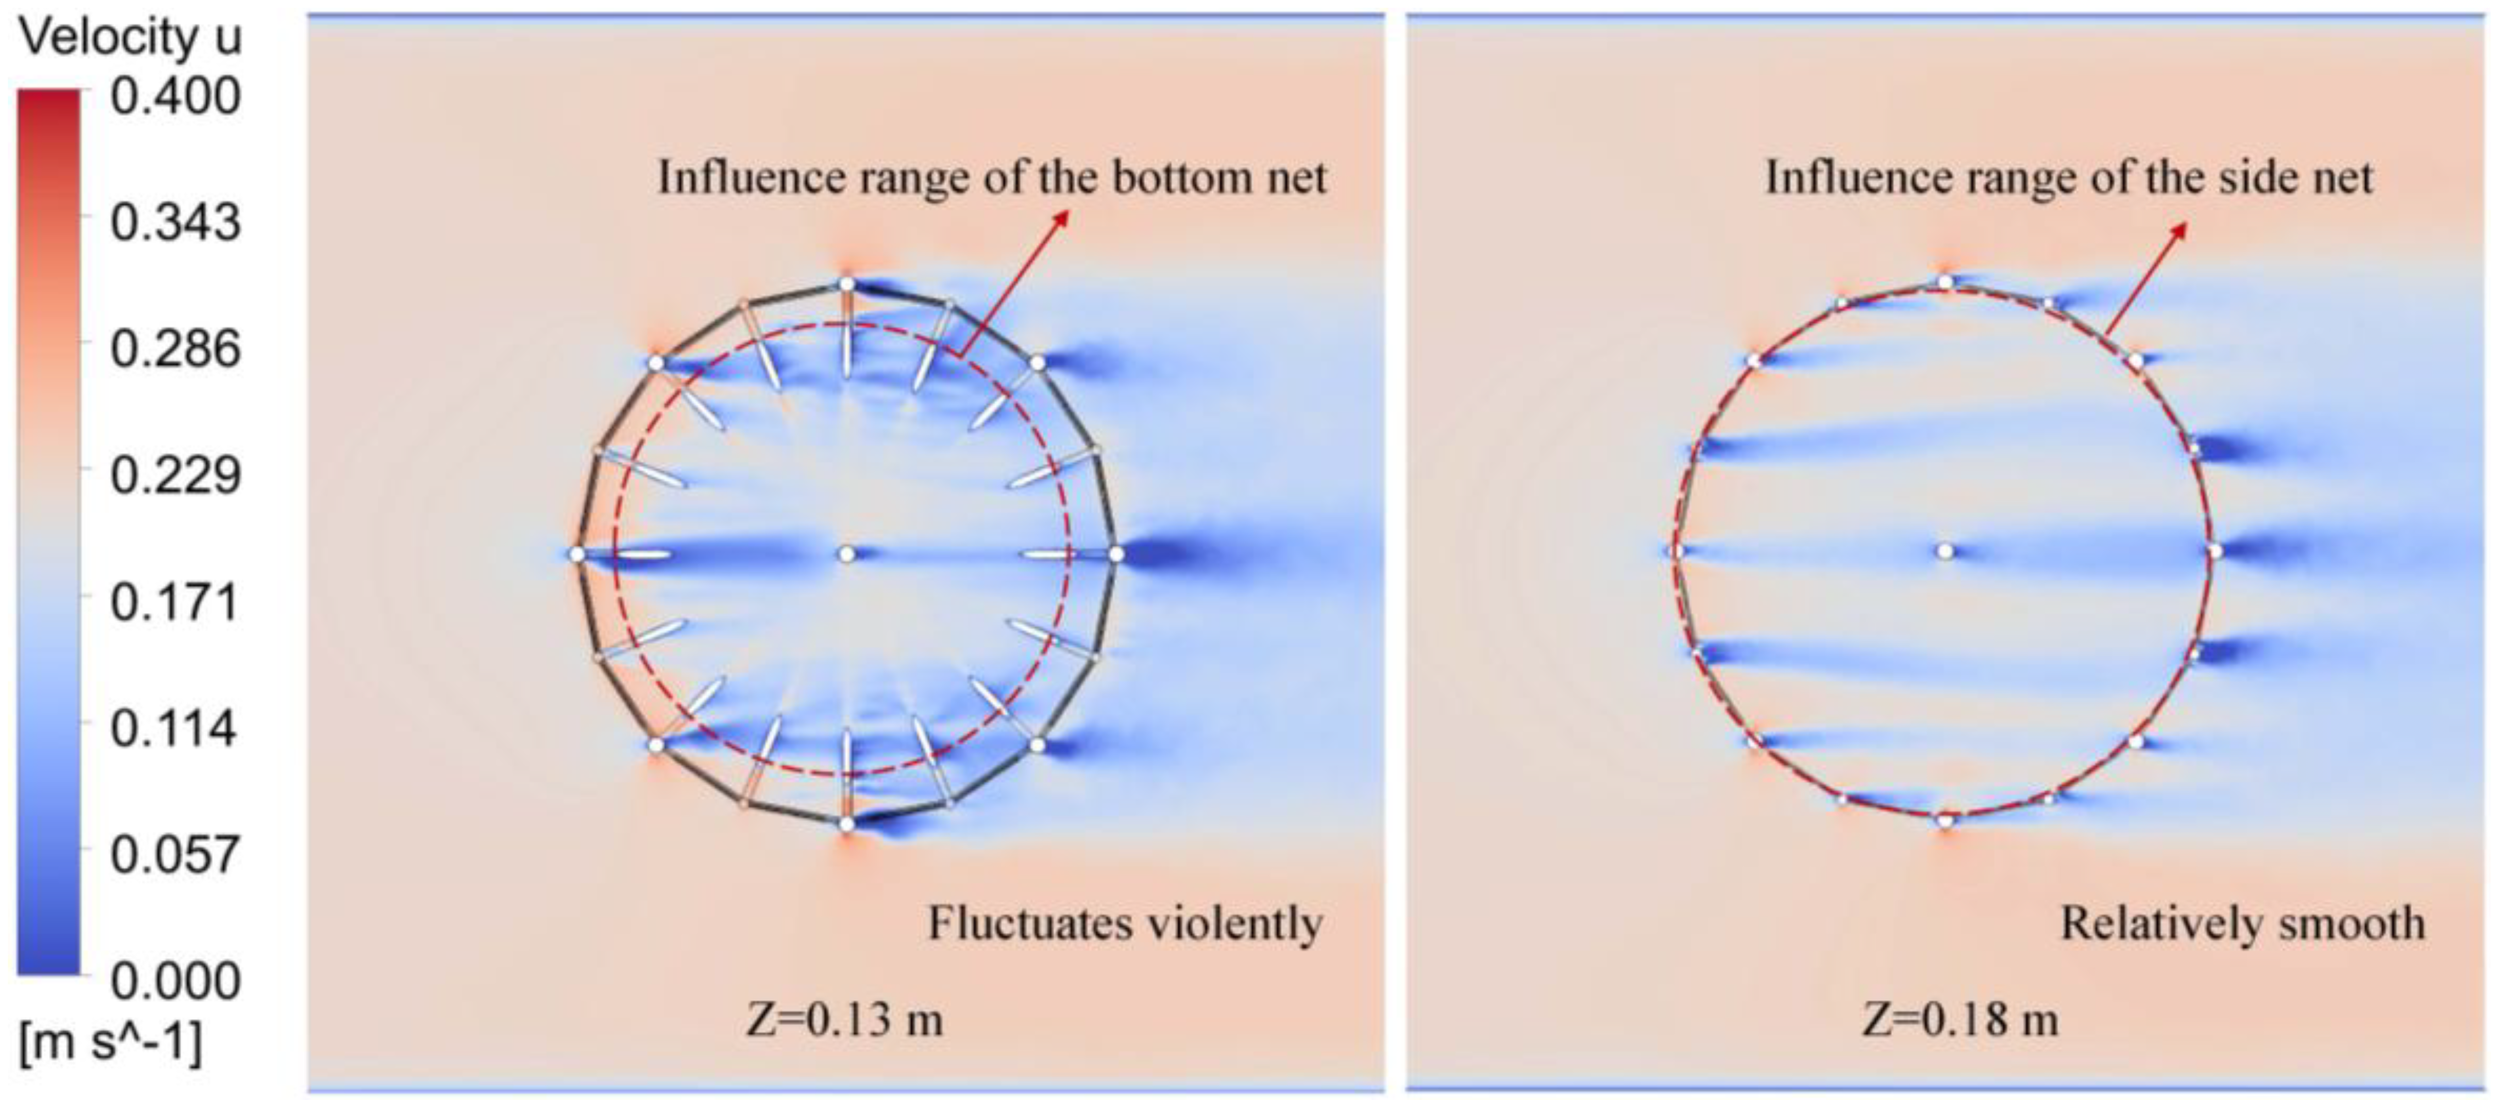
Moreover, it can be observed that although the net cage structure is symmetrical, the drag force acting on local structures exhibits asymmetry. As shown in Figure 11, the drag force acting on Bpn1 and Bpn16 is not identical. To explain this phenomenon, Figure 12 presents the flow velocity distribution in the x-y section at z = 0.13 m and z = 0.18 m. By examining the velocity contours in Figure 12, it can be seen that the isoline of 0.1 m/s and 0.2 m/s do not exhibit symmetrical distribution. This asymmetry in flow velocity distribution leads to variations in the conversion between kinetic and pressure energy, ultimately resulting in asymmetric drag force at symmetric positions.
Figure 12
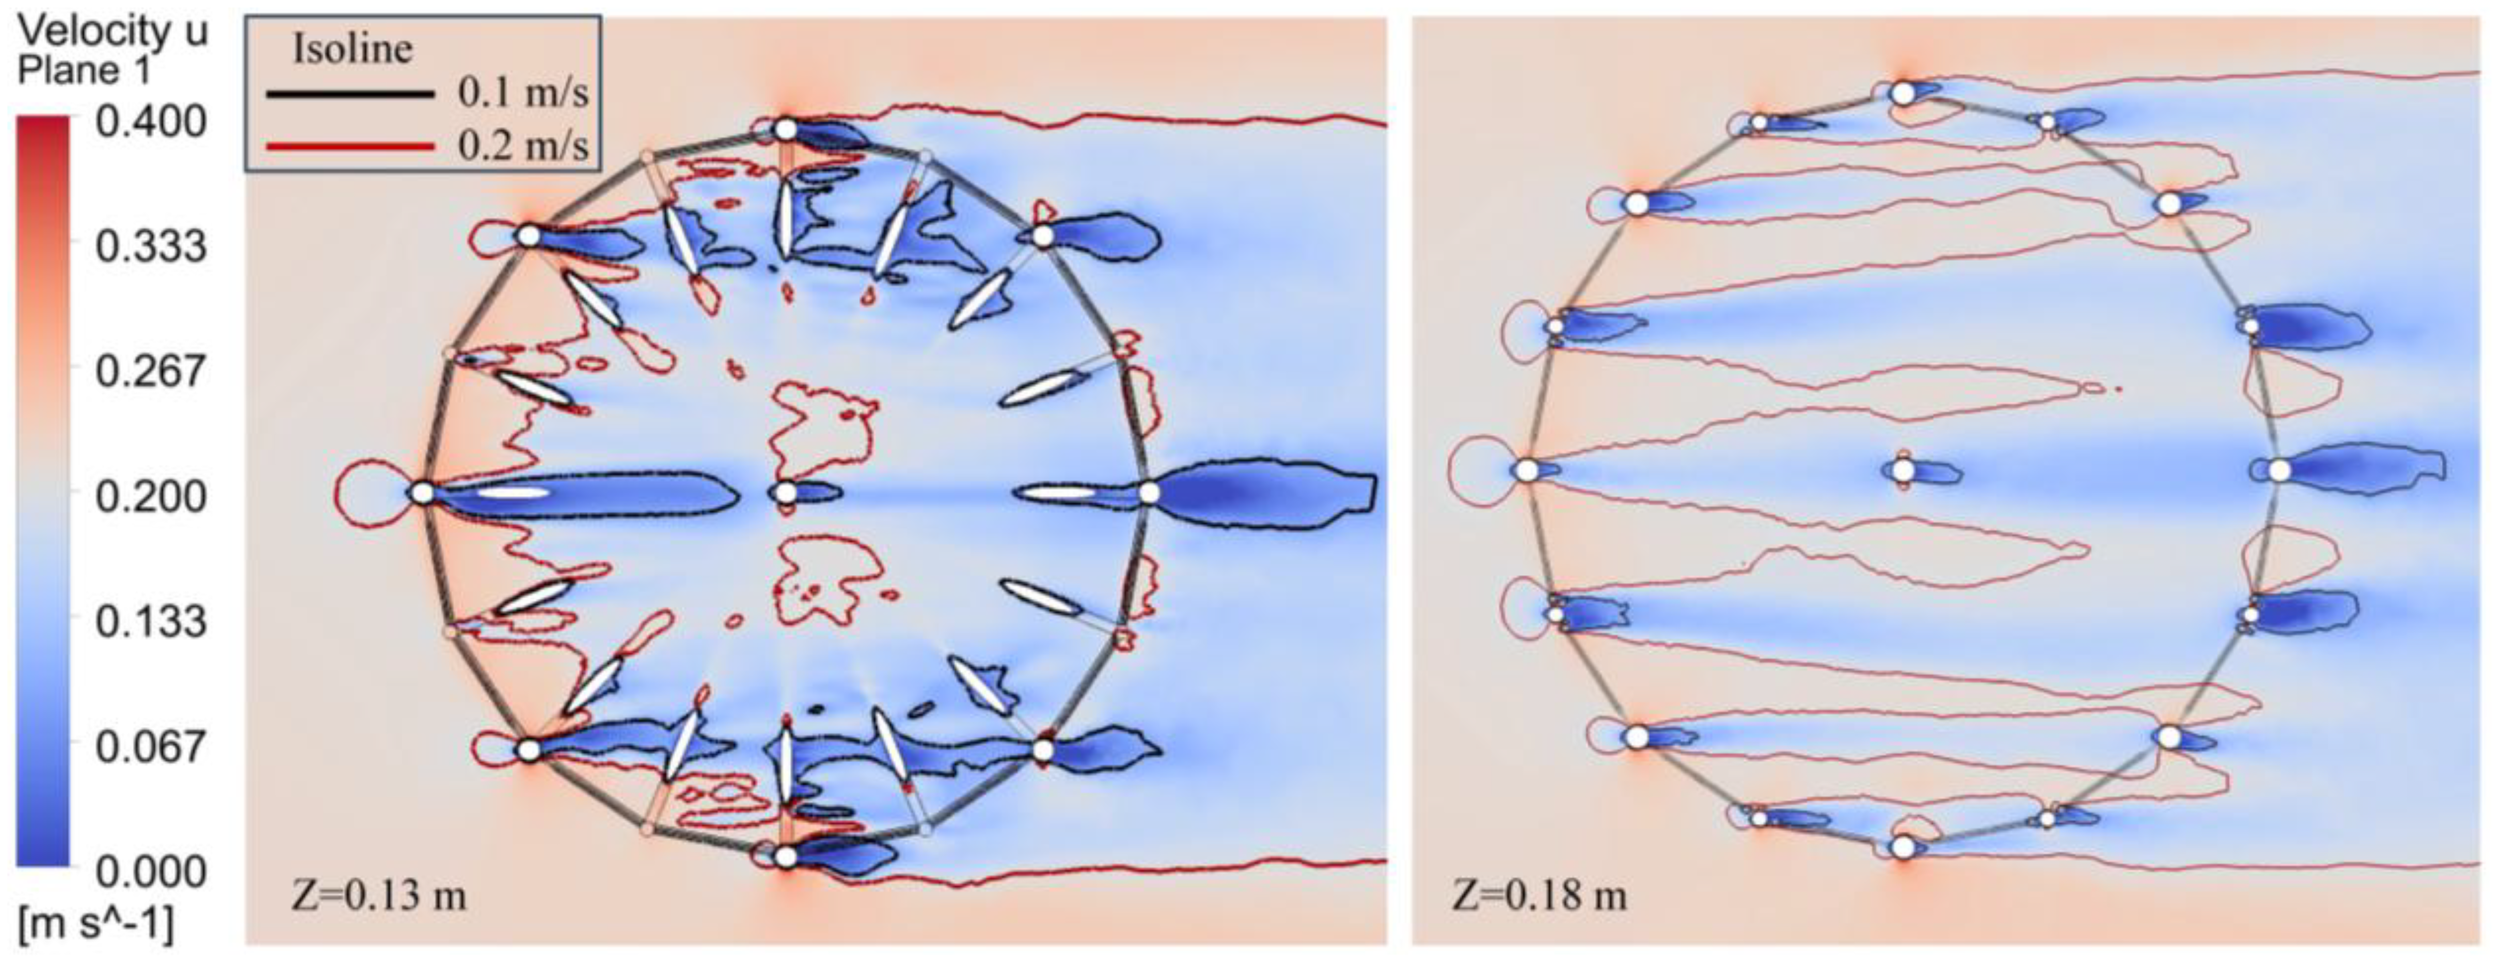
Flow velocity distribution and isoline at x-y section.
4.2 Drag force acting on the frame
The present section primarily analyzes the drag forces exerted on the main frame of the truss net cage, including the pontoons, columns, and braces. A detailed examination of the current loads on each component of the main frame helps to understand the distribution of current load, especially identifying the locations of maximum current loads, which is critically important for informing future optimization of the truss net cage structure.
Figure 13 shows the distribution of drag forces on the pontoons, excluding the central pontoon. It is evident that the current load is greatest on the upstream pontoon (P1), while the current load on the downstream side pontoon is the smallest (P5) with a significant attenuation observed. Calculations reveal that the current load on the upstream pontoons (P1) is 2.1 times that on the downstream side (P5). The current load exerted on the pontoons decreases gradually along the direction of the incident current, reaching a minimum at P5. Furthermore, we observe that although the current load on P1 is the greatest, the current loads on P2 and P3 only decrease slightly, with no significant changes. It is owing to that P1, P2 and P3 are directly impacted by the incident current without being obstructed by the fish plane nets or frame (Figure 7), which results in no significant decay in the current loads exerted on P2, P3, P7 and P8. Additionally, the current load exerted on the central pontoon of the truss net cage is 0.157 N, which is slightly larger than the current load on the upstream side pontoon (P1). The phenomenon is due to the larger diameter of the central pontoon compared to the peripheral pontoon (P1), resulting in a larger projection area. Therefore, the attenuation of the current does not cause the current load on the central pontoon to be lower than that on P1.
Figure 13
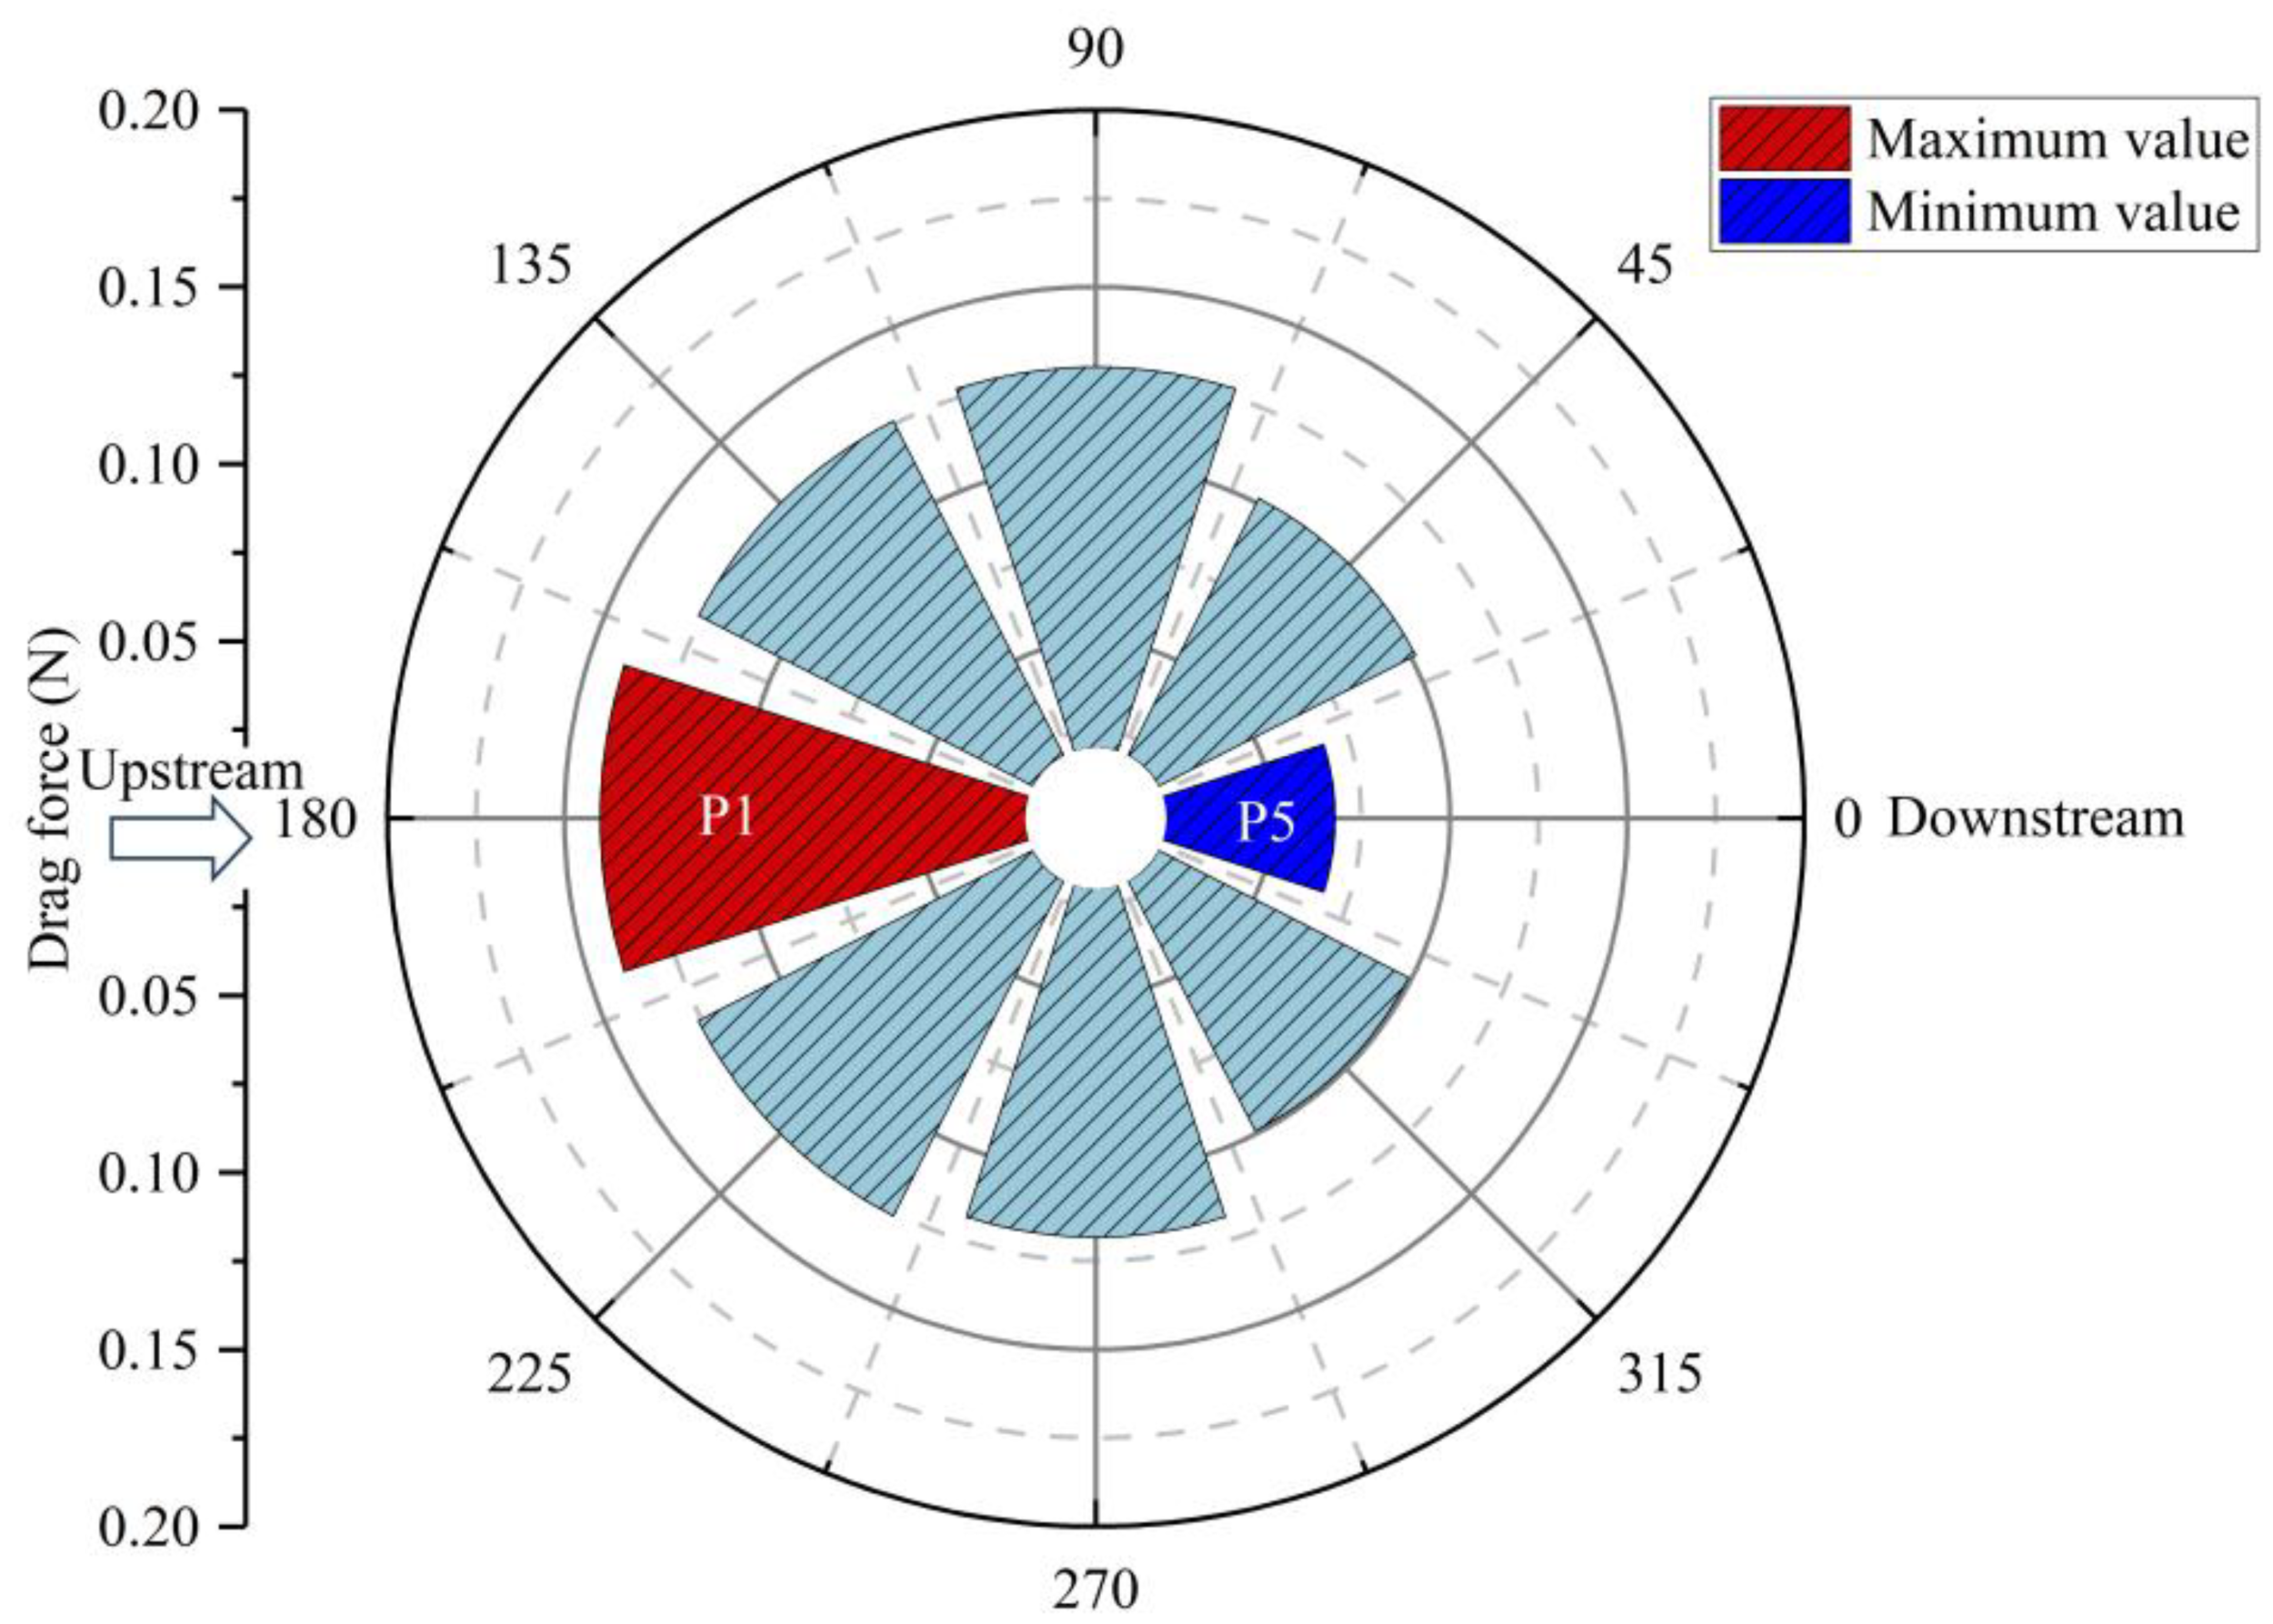
Drag force exerted on the pontoons of the truss net cage.
Figures 14a, b illustrate the current loads pattern on the thick and thin columns of the truss net cage, respectively. The key observations are as follows: (1) The current load is greatest on the upstream side of the thick column (Tkc1), showing a significant decreasing trend along the direction of the incident current. It is calculated that the current load on the upstream side (Tkc1) is 1.8 times that on the downstream side (Tkc5). (2) As for the thin columns, the maximum current loads occur on the upstream side (Tnc1 and Tnc8), while the minimum current loads appear on the perpendicular to the incident current direction (Tnc3 and Tnc6), rather than on the trailing side. The current load on the Tnc1 is 2.2 times that on Tnc3. (3) The current load on the upstream side of the thick column (Tkc1) is significantly greater than that on the upstream side of the thin column (Tnc1), by approximately 1.7 times. However, both exhibit a similar phenomenon, displaying a symmetrical pattern along the incident current direction. Furthermore, it is observed that the maximum current load occurs on the upstream side, while the minimum current load is found near the downstream position, though not at the 0°location. The results indicate that while the maximum current load on the upstream side warrants attention, the current loads on the trailing side are also significant and cannot be overlooked for ensuring structural safety. (4) It is an interesting phenomenon that the current load exerted on the thick and thin columns exhibit dramatic changes along the incident current direction, which is different from the current load exerted on the pontoons. As depicted in Figures 6, 7, the pontoons are located independently at the bottom of the truss net cage, with minimal influence from other components. In contrast, the thick and thin columns are located in the middle of the truss net cage, where they are affected by the aquaculture structure, leading to significant variations in current loads along the current direction. Additionally, we observe that along the incident current direction, the current loads on the thick columns generally show a decreasing trend, while the current loads on the thin columns reach their minimum values laterally. It is because the current loads on the thick columns are significantly affected by the overall current speed decay. In contrast, the thin columns are influenced not only by the overall current speed decay but also by the nearby columns and braces at the Tnc2 and Tnc3 positions, resulting in lower current loads compared to the upstream side (Tnc1) and the downstream side (Tnc4).
Figure 14
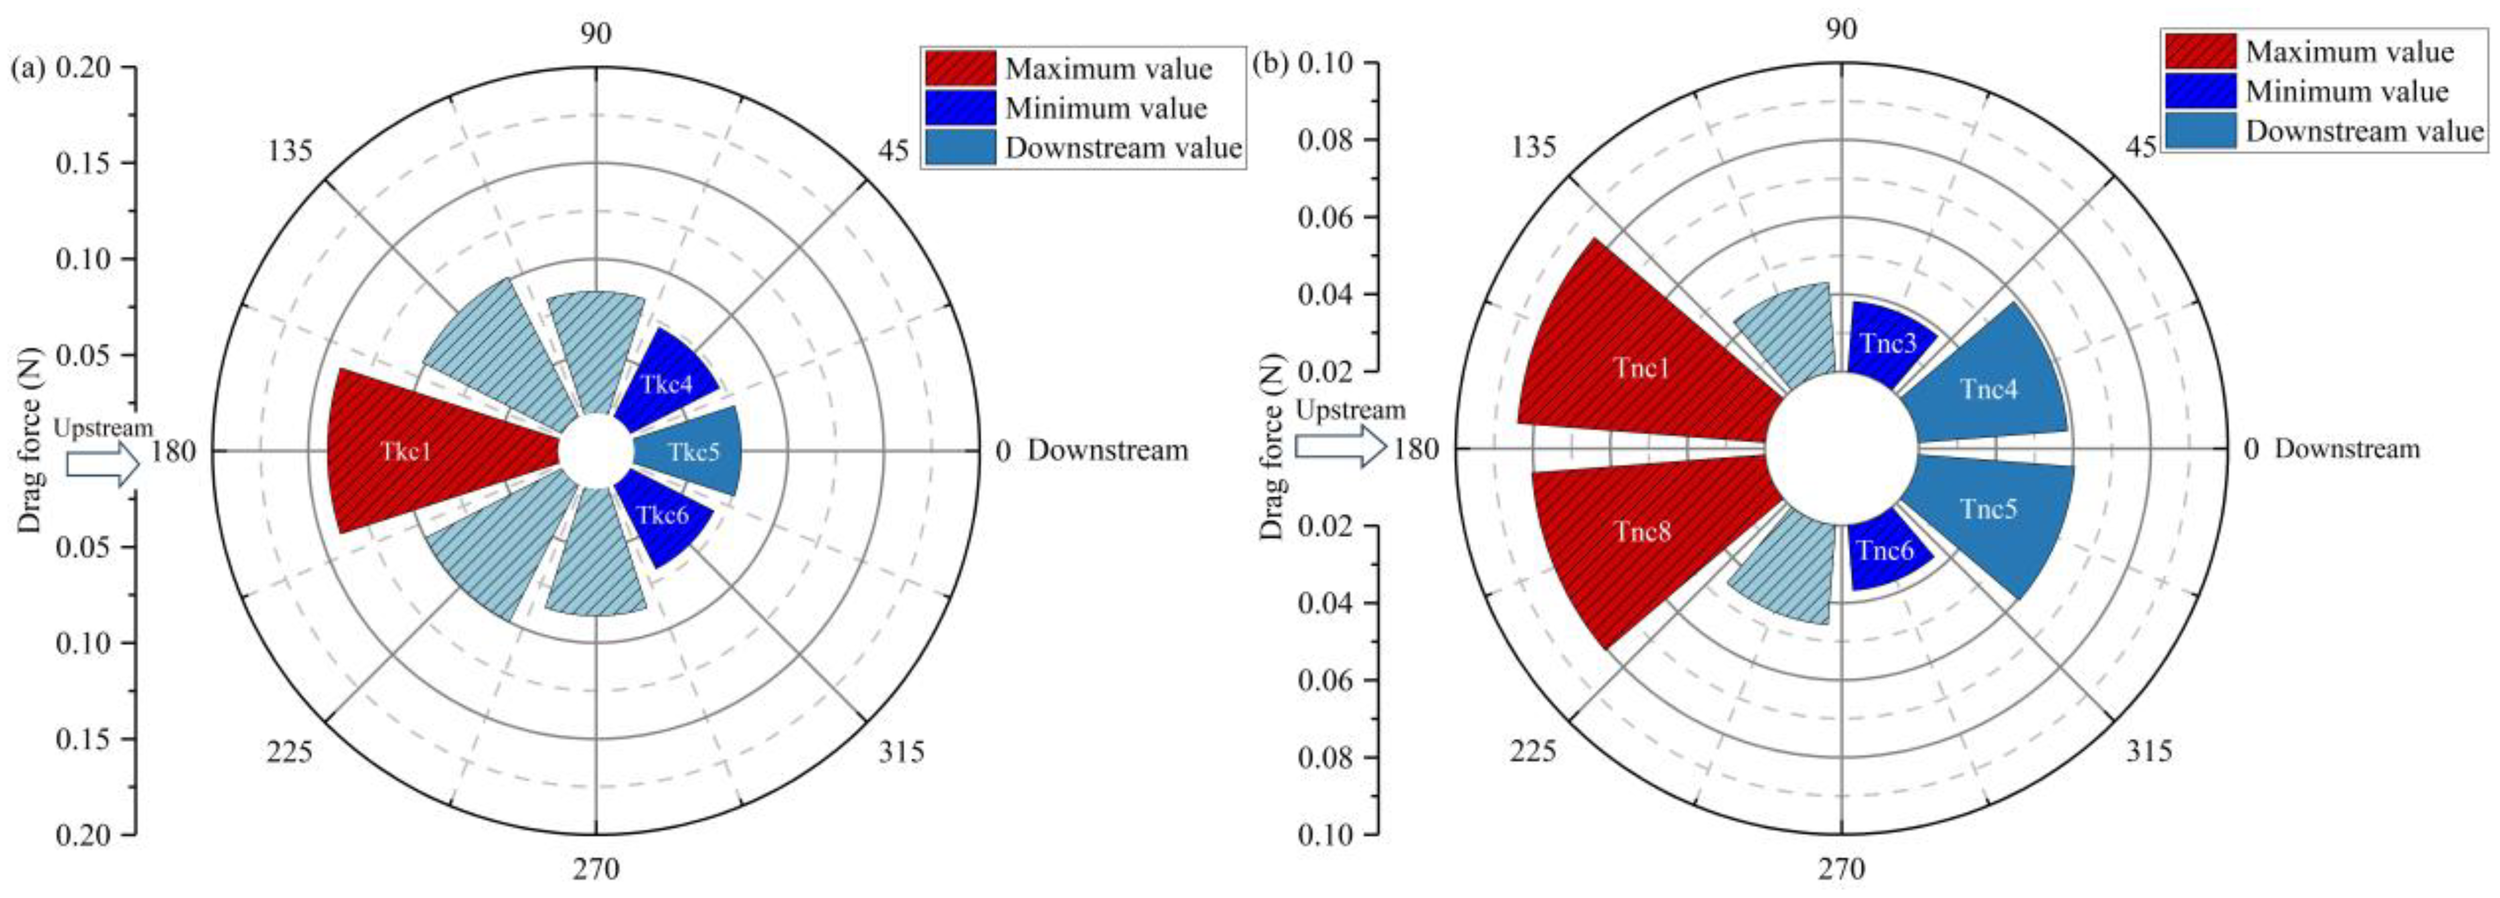
Drag force exerted on the columns: (a) thick columns and (b) thin columns.
Figure 15 depicts the current loads exerted on different parts of truss net cage, including lower diagonal braces, lower cross braces, middle diagonal braces, and middle cross braces. The results indicate that the maximum current load on the lower diagonal braces occurs when the lower diagonal braces are oriented perpendicular to the incident current direction (Ldb5 and Ldb13), whereas the minimum force is observed on the upstream and downstream sides (Ldb1 and Ldb9). In contrast, the maximum current loads exerted on the lower cross braces, middle diagonal braces, and middle cross braces are found on the upstream side (Lcb1, Mdb1 and Mcb1), while the minimum forces are observed when these braces are perpendicular to the incident current direction (Lcb4, Lcb5, Mdb4, Mdb5, Mcb4 and Mcb5). Owing to the attenuation of the current speed, the current loads on the downstream side of the truss net cage are significantly smaller than those on the upstream side, with decays of 642.2%, 20.6%, 27.3%, and 28.1%, respectively. Observing the arrangement of these four structural components in relation to the incident current direction reveals that the length direction of the upstream lower diagonal braces (Ldb1) aligns with the incident current direction, resulting in the smallest projected area and thus the least current load (Figure 16). Conversely, when the orientation is perpendicular to the incident current direction, the projected area is maximized, resulting in the highest current load. Contrary to the variation in current loads on the lower diagonal braces, the lower cross braces, middle diagonal braces, and middle cross braces exhibit maximum current loads on the upstream side, where the projected area along the incident current direction is largest, and minimum forces perpendicular to the incident current direction.
Figure 15

Drag force exerted on the braces: (a) lower diagonal braces, (b) lower cross braces, (c) middle diagonal brace and (d) middle cross braces.
Figure 16
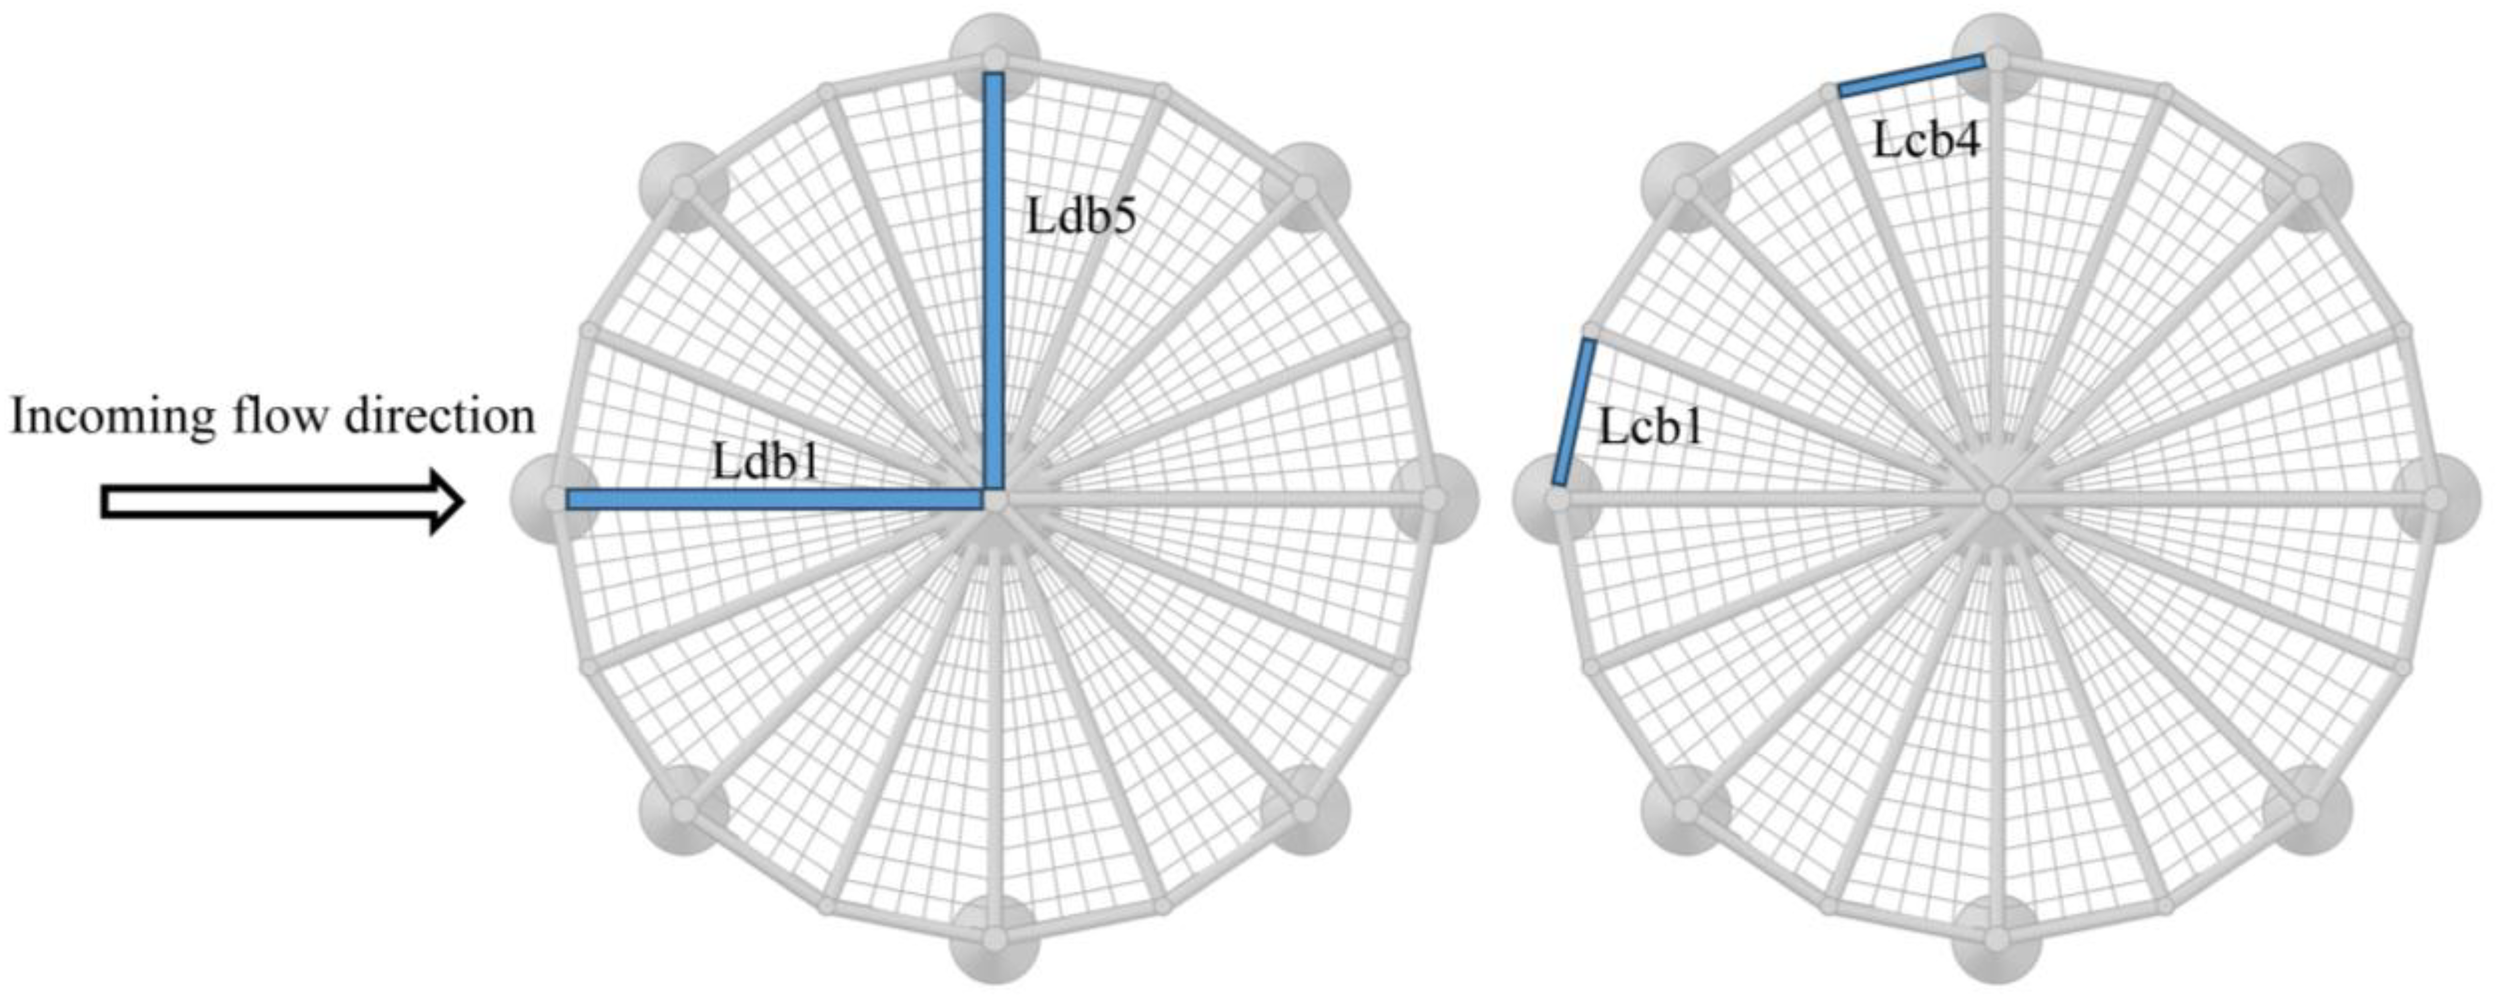
Incident current direction and braces arrangement, such as lower diagonal braces and lower cross braces.
4.3 Discussion of drag force and torque acting on the aquaculture platform
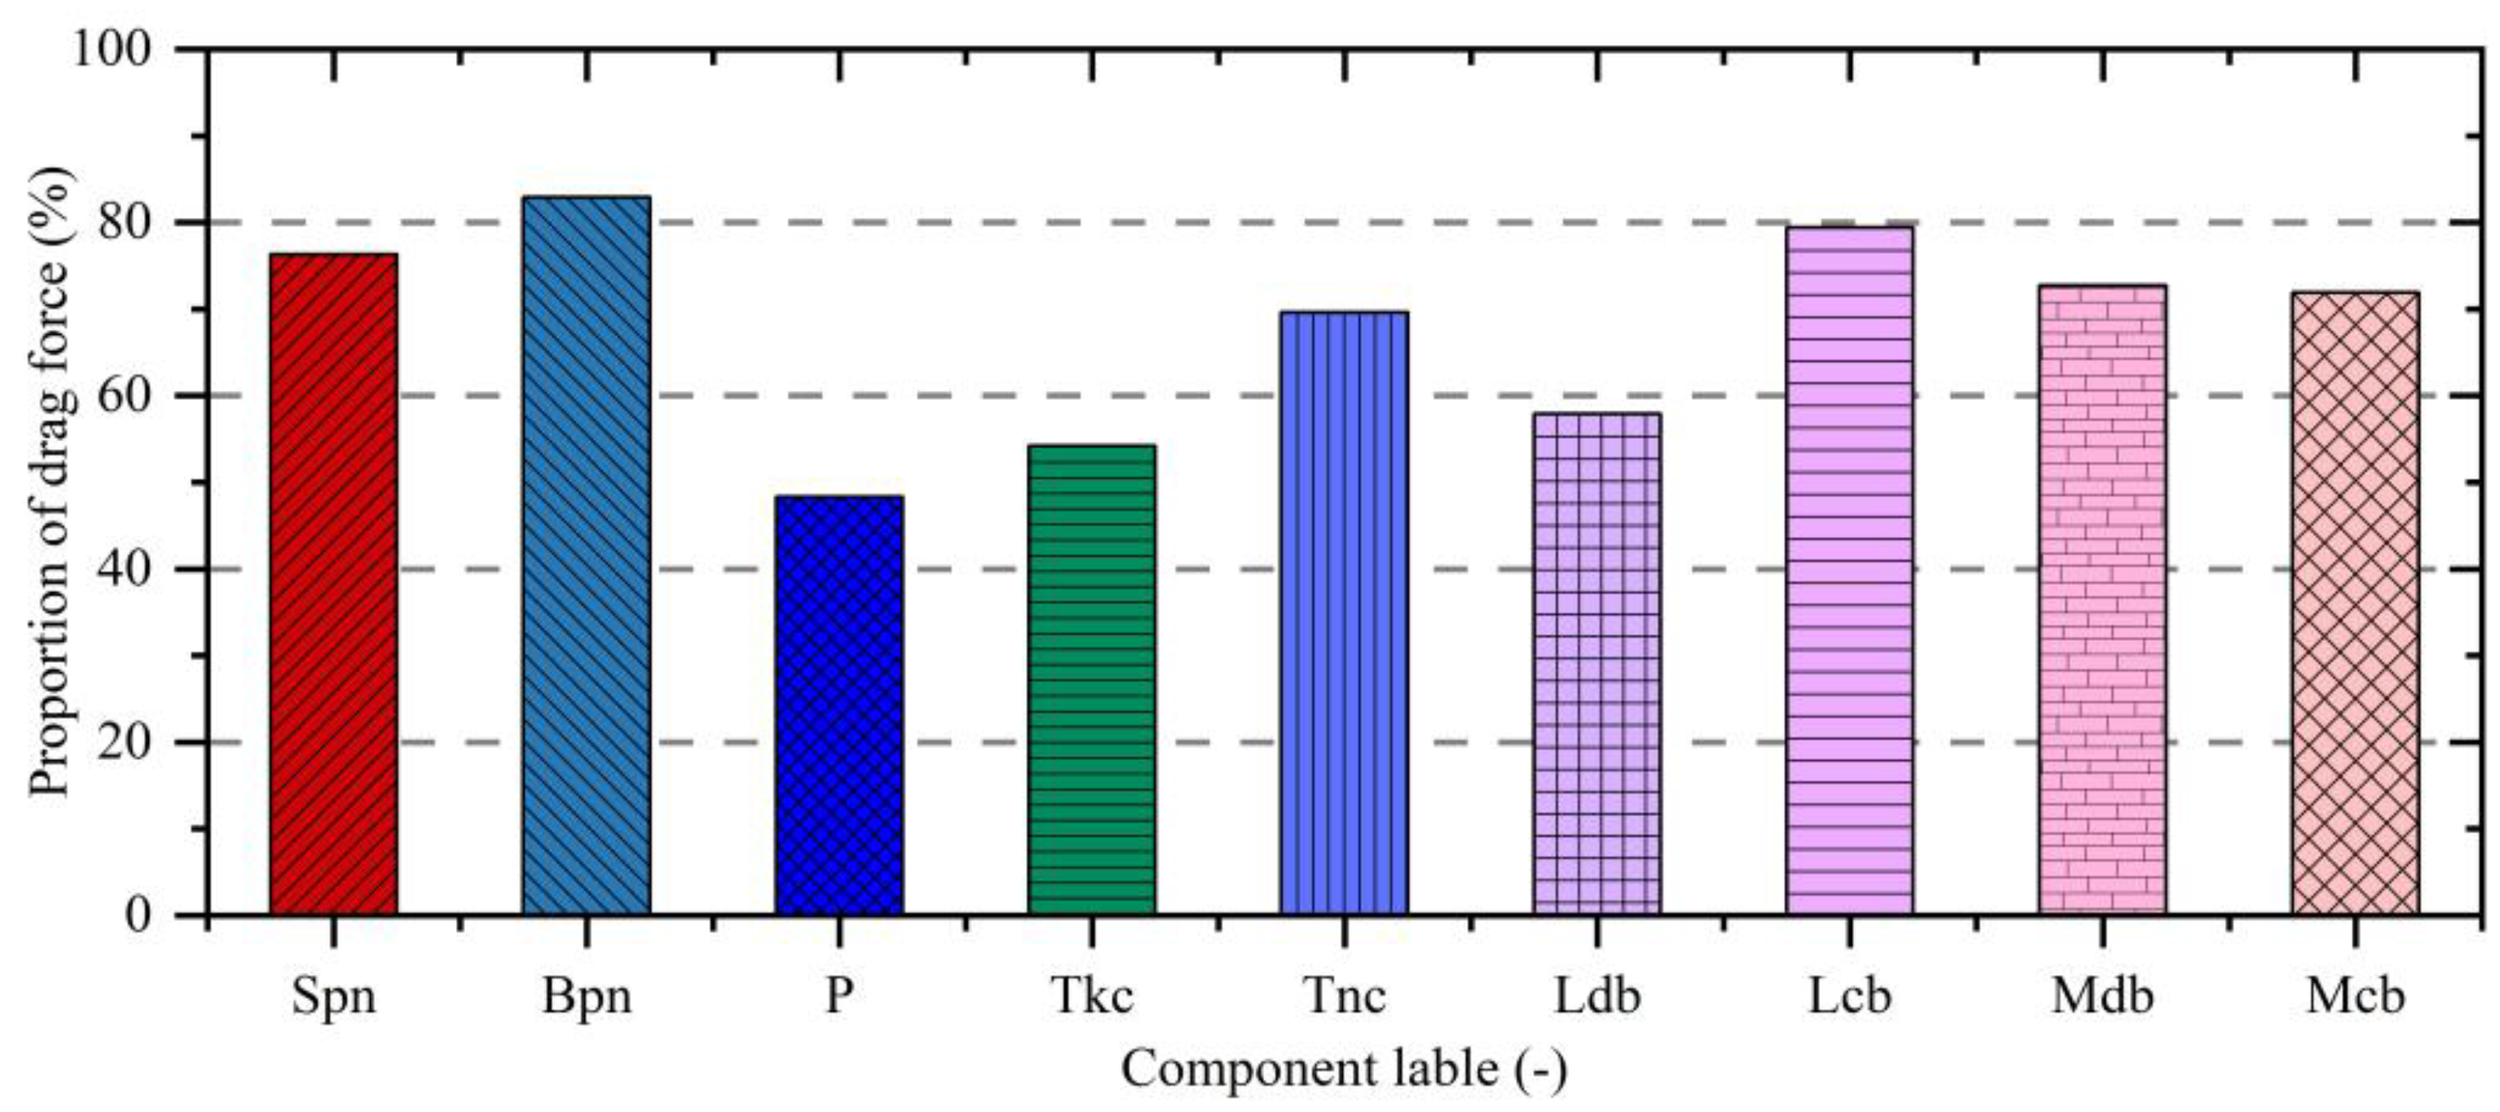
The distribution of current load exerted on the various components of the semi-submersible truss fish cage has been described in detail. However, an assessment of the proportion of current loads on each component relative to the total current load is missing. As illustrated in Figure 17, it can be found the side plane nets bear the highest proportion of current load, accounting for 24.3% of the total force exerted on the semi-submersible. This is followed by the pontoons and the thick columns, which account for 18.7% and 13.8% of the total current load, respectively. The middle cross braces bear the smallest proportion, at only 3.7%. A comparison between the current loads exerted on the side plane nets and the bottom plane nets reveals that the force exerted on the side plane net is 2.4 times greater than that on the bottom plane nets. It indicates that the side plane nets bear a significantly higher current load, making its safety more critical. The primary function of the bottom plane nets is to prevent fish from escaping, thereby maintaining the overall integrity of the truss net cage. Compared with the side nets, the presence of the bottom net can also aggravate the fluctuation of current speed, forming a large area of low current speed at the bottom of the culture platform (Figure 18). The pontoons and columns bear substantial hydrodynamic loads, second only to the side plane nets, suggesting that the structural strength of these components should be reinforced. In contrast, the braces, namely lower diagonal braces, lower cross braces, middle diagonal braces, and middle cross braces, experience relatively smaller current loads. Their primary function is to connect various components, transmit loads, and ensure the overall stability of the structure, which cannot be ignored.
Figure 17
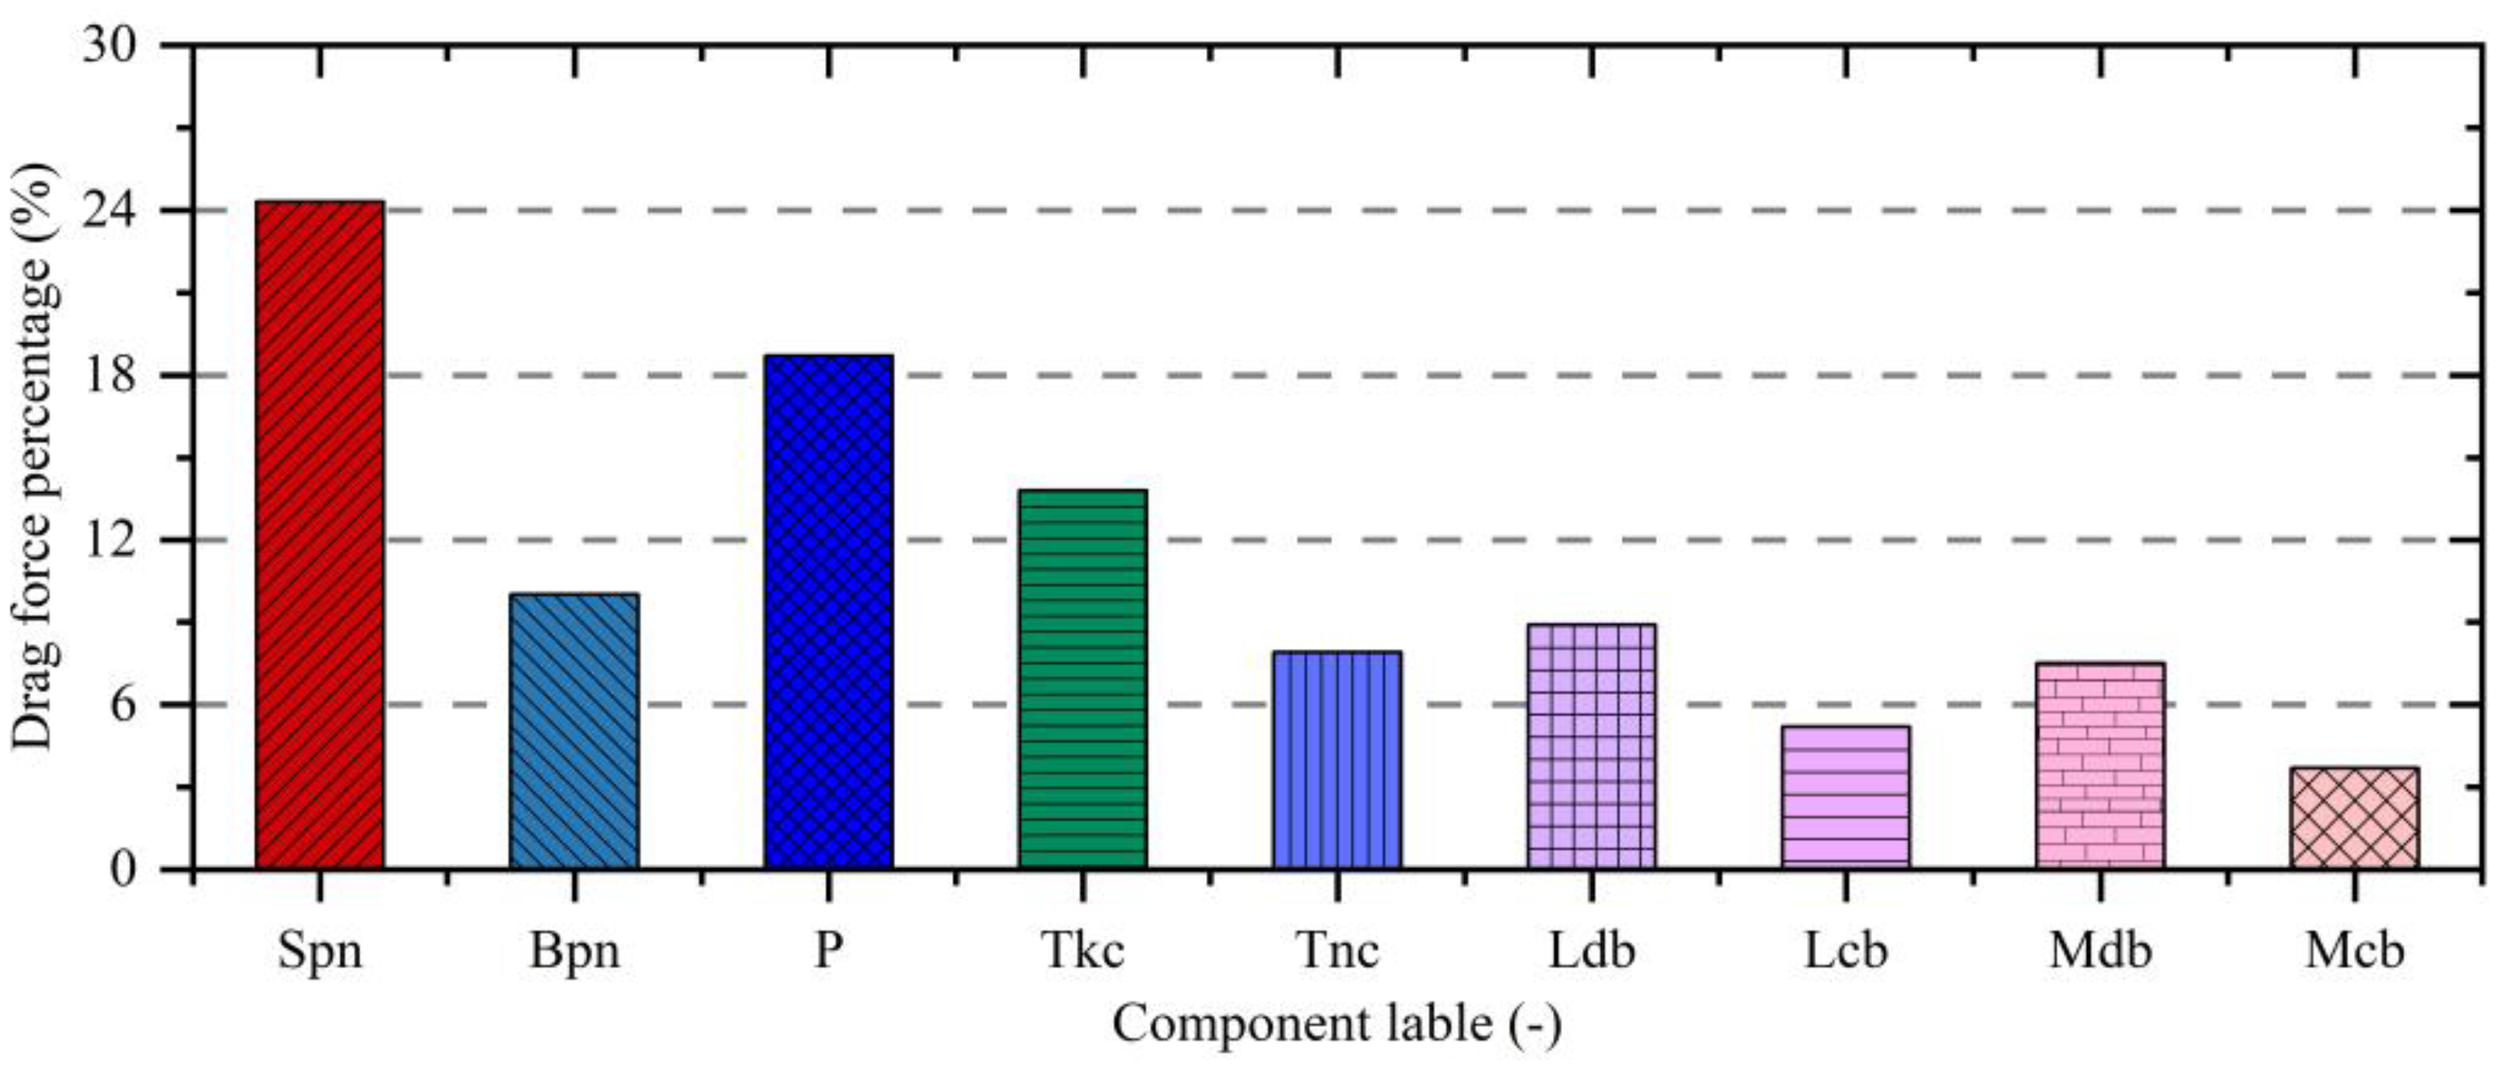
The proportion of current load exerted on components to the total current load exerted on the truss net cage.
Figure 18
Effects of bottom net and side net on current speed distribution inside truss net cage.
As reported by Liu et al. (2021), in the condition of an incident current speed of 0.2204 m/s, the current speed decreased by 38.57% at a distance of 1.0D downstream from the truss net cage. Owing to the blocking consequence of the truss net cage on the current, multiple low-current speed areas appear inside and downstream of the truss net cage (Figure 19). As for the current load, the forces exerted on the downstream side, such as Spn8, P5, Tkc5, are 76.3%, 48.3% and 54.2% of the force exerted on the upstream side, namely Spn1, P1, Tkc1, and reduced by 23.7%, 51.7%, and 45.8%, respectively (Figure 20). The current load attenuation is basically above 20% for the components of the truss net cage. It is acknowledged that the blocking consequence of the truss net cage on the current speed leads to a significant decay in the current loads on the downstream side plane nets, pontoons, columns and braces. Additionally, it is observed that the current loads on the bottom plane nets (Bpn1 and Bpn16) and lower diagonal braces (Ldb1 and Ldb16) are relatively small. The phenomenon is attributed to the structural arrangement at certain angles to the incident current direction, resulting in a reduced projected area along the incident current direction and consequently lower current loads. Therefore, the primary reasons for the decay in current loads exerted on the components of the truss net cage are two aspects: (1) the blocking consequence of the truss net cage on the current speed, causing a decay in current speed (Figure 19), and (2) the projected area of the truss net cage components in the direction of the incident current (Figure 16).
Figure 19
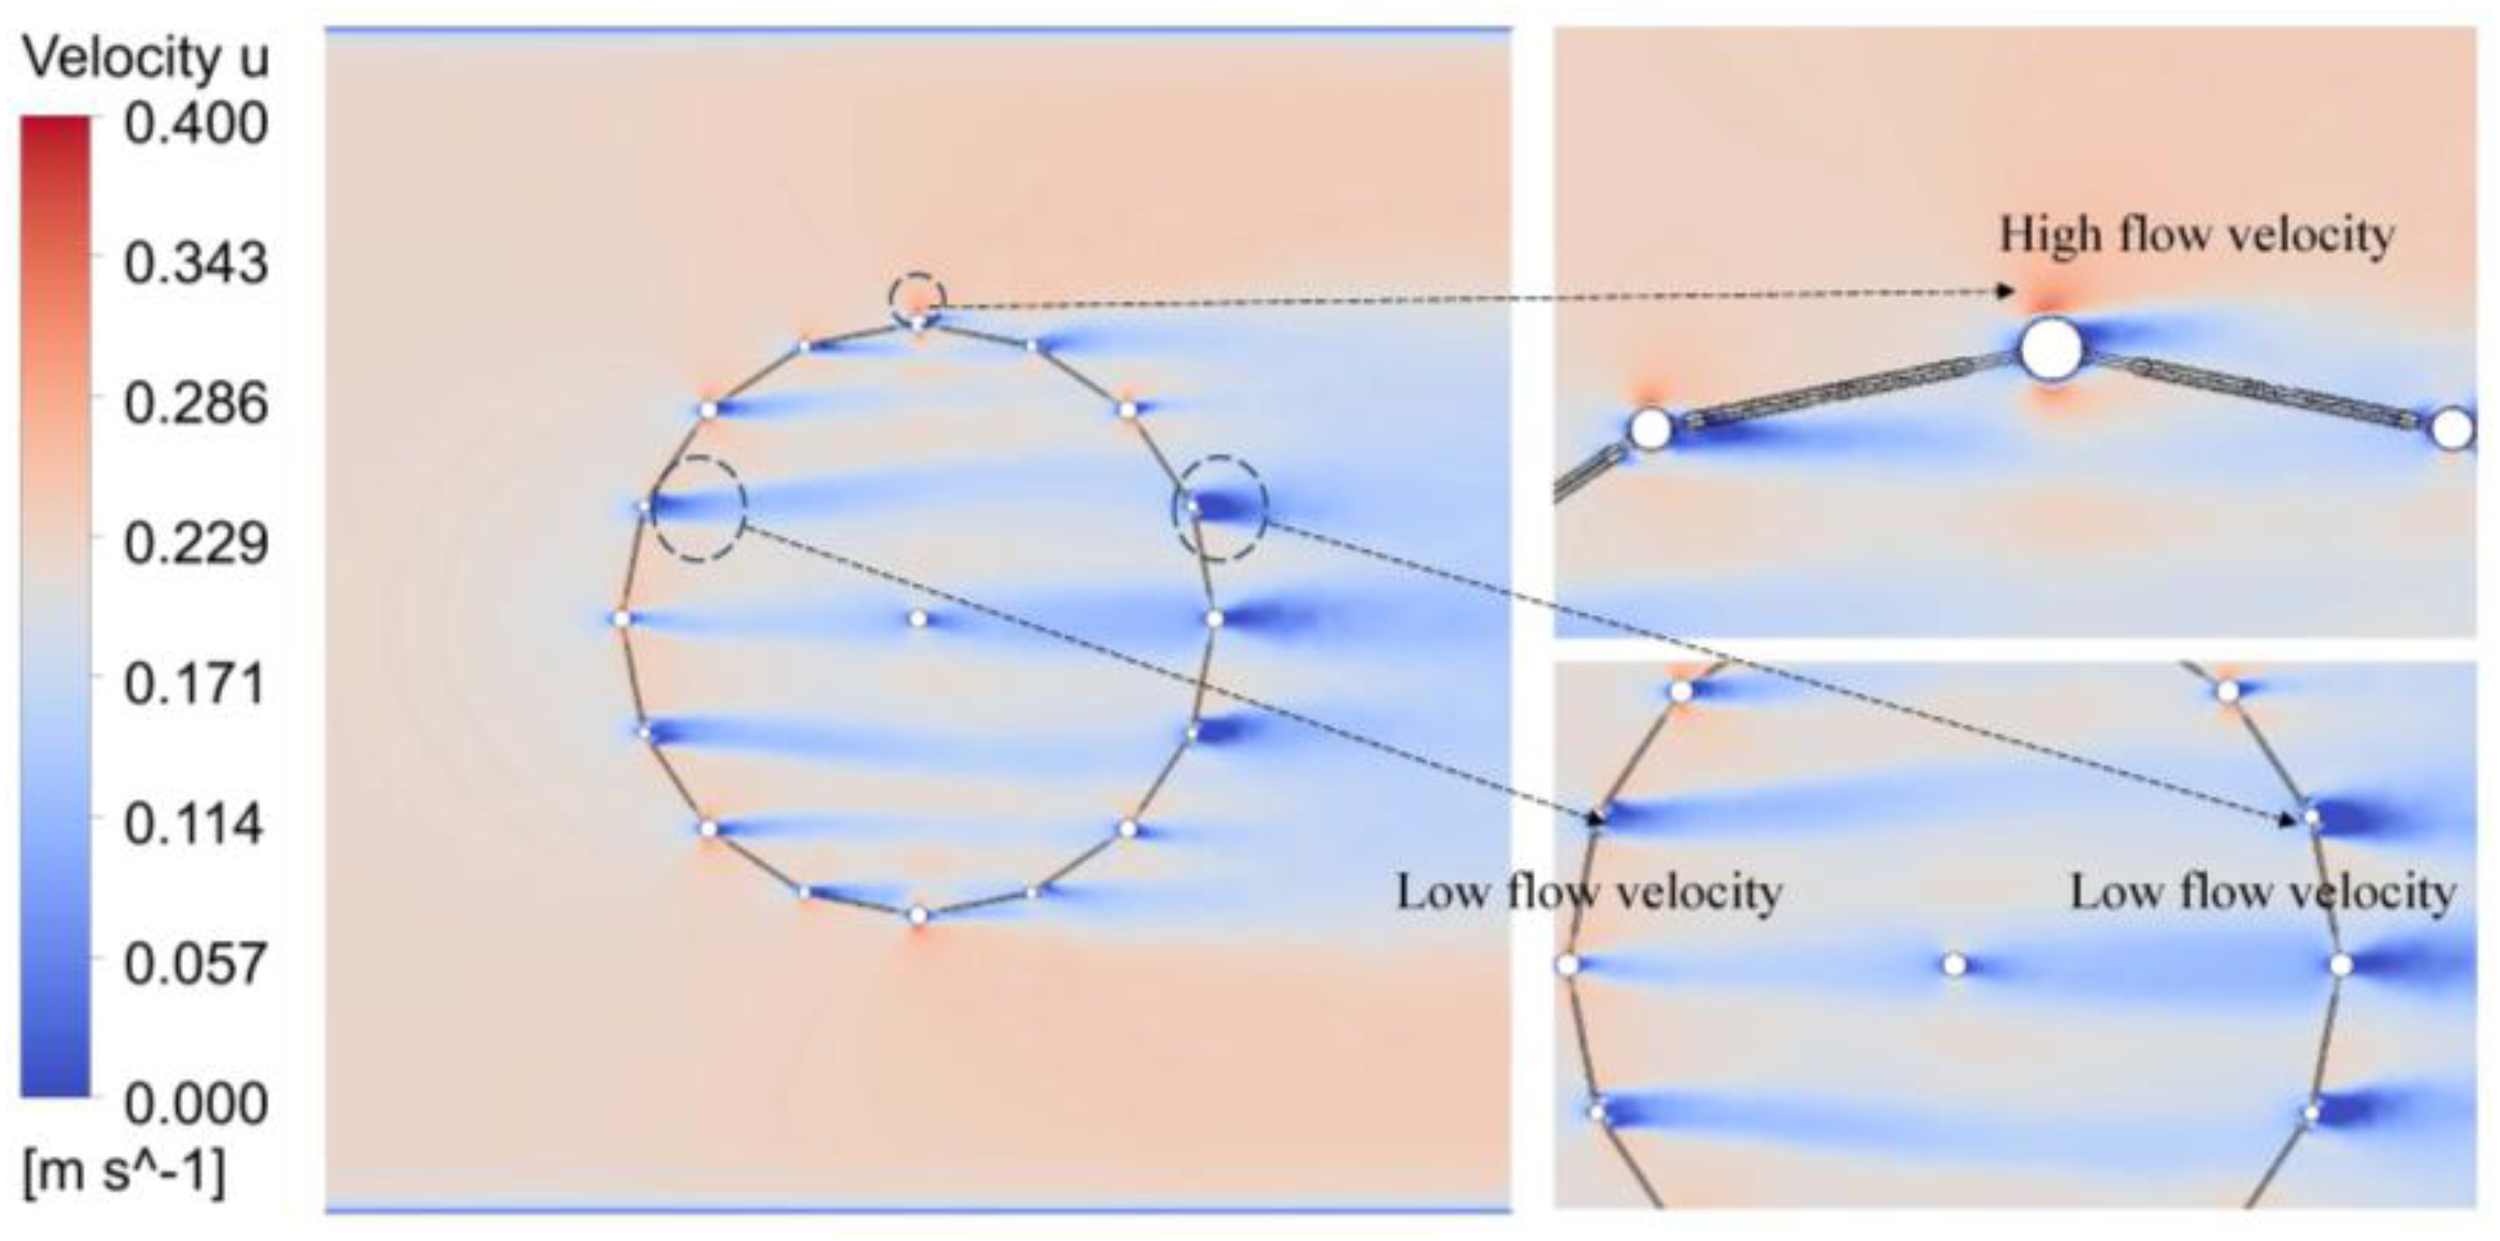
The distribution of current speed inside and around the truss net cage.
Figure 20
The ratio of the drag force on the downstream side to the drag force on the upstream side (Proportion of drag force=Force on a single component on the downstream side/Force on a single component on the upstream side).
In addition, the present section also discusses an intriguing issue is that the direction of tilt experienced by the truss net cage in the current. It is well-known that under the impact of current or during towing operations, the truss net cage may tilt, and when the tilt exceeds a safe angle, it can lead to fish escaping. The tilting of the truss net cage involves the consideration of torque. Thus, the present study investigates the changes regarding torque at working draught conditions to determine the direction of the platform’s tilt in current. As illustrated in Figure 21, the changing trend of the torques generated by current loads around the center of the truss net cage without mooring conditions is described. When considering only current forces, selecting a center point near the bottom pontoon results in a positive torque, indicating a clockwise rotation and a tilt towards the downstream side. Conversely, selecting a center point near the water surface results in counterclockwise torque, indicating a tilt towards the upstream side. When the center point is between 0.18 m and 0.19 m, the torque generated by the current loads is near zero, and the truss net cage reaches a state of equilibrium. It is important to note that this study only considers torque generated by current forces. In practical engineering applications, the truss net cage is subjected not only to current forces but also to wave forces, mooring forces, and gravitational forces. Therefore, calculating the direction and magnitude of platform tilt becomes more complex. During the design and evaluation, we can try to concentrate the force generated by external loads at the position where the torque is zero. This can reduce the tilt angle of the truss net cage and reduce the risk of equipment on the truss net cage being damaged and fish escaping by crossing the platform. In summary, while this study provides insights into the tilting behavior of the truss net cage under current forces, further research is needed to comprehensively understand the influence of additional forces in practical engineering to accurately predict and mitigate potential tilting and its associated risks.
Figure 21
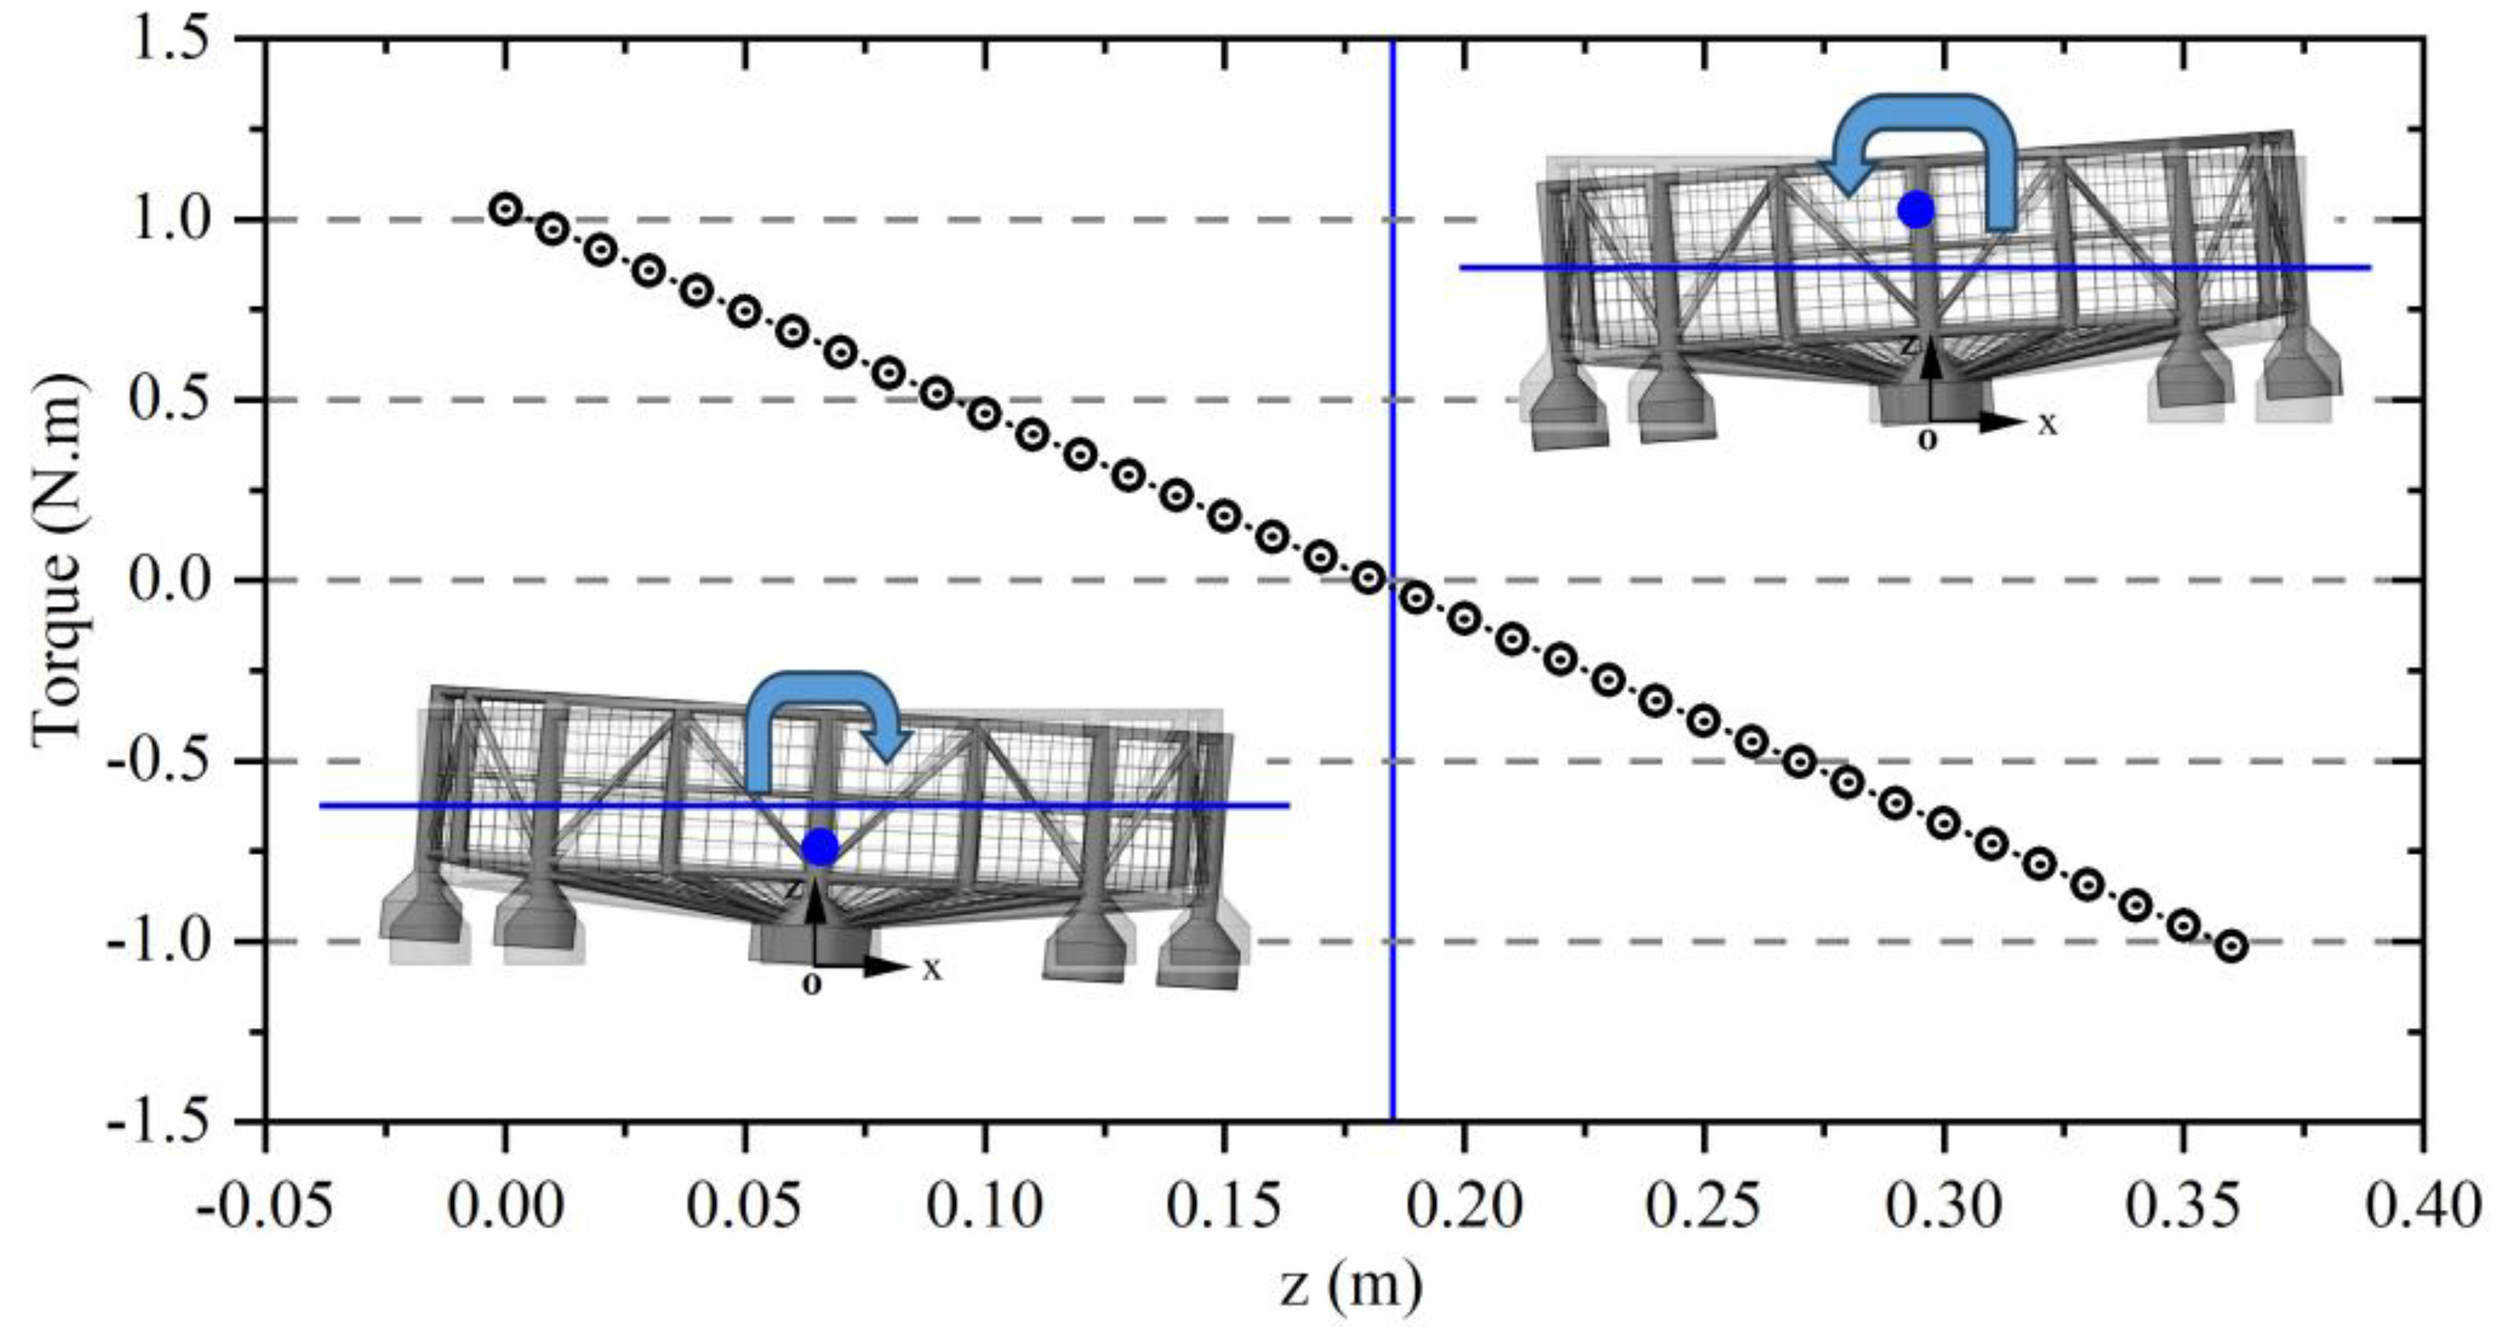
The torque generated by the current force exerted on the semi-submersible truss fish cage.
5 Conclusions
The present study utilizes computational fluid dynamics methods and porous media theory to analyze the distribution of current loads exerted on various components of a semi-submersible truss fish cage. The topic has not been previously addressed in the literature, making it a novel and intriguing area of investigation. Thus, the present research quantifies the current loads exerted on the plane nets, pontoons, columns, and braces, and assesses the torques induced by these forces on the truss net cage in current. The main findings are outlined below:
The drag force exerted on the side plane nets of the upstream side (Spn1 and Spn16) experiences the greatest values, whereas the minimum current load occurs on the side plane nets oriented perpendicular to the current direction (Spn5 and Spn12). Additionally, the maximum current load on the bottom plane nets does not occur at Bpn1 and Bpn16, but rather at Bpn2 and Bpn15, with the minimum current load observed on the downstream side. It is indicated that the current load exerted on the side plane nets is considerably higher than that on the bottom plane nets. Nevertheless, the bottom plane nets are essential for preventing fish escape.
The drag force on the pontoons and columns is highest on the upstream side. The minimum force on the pontoons and thick columns occurs downstream, while for the thin columns, it is perpendicular to the current direction. Additionally, the current load on the lower diagonal braces is lowest on the upstream side and highest perpendicular to the incident current direction. The maximum current load on the lower cross braces, middle diagonal braces, and middle cross braces occurs on the upstream side, while the minimum force is observed perpendicular to the incident current direction.
By quantifying the drag forces exerted on the plane nets, pontoons, columns, and braces, it is evident that the side plane nets bear the greatest current load (24.3%), followed by the pontoons and thick columns (18.7% and 13.8%, respectively). The current load exerted on the middle cross braces is the smallest, at 3.7%. Furthermore, we found that the decay regarding the projected area of the components in the coming current direction and the attenuation of current speed are two significant factors influencing the decrease in current load. In addition, considering the phenomenon of the semi-submersible truss fish cage tilting in the current, the torque exerted by the current loads exerted on the truss net cage is studied in detail. The results indicate that, only considering the current forces, the truss net cage tilts downstream when the torque center is located at the bottom pontoons. Conversely, the truss net cage tilts upstream when the torque center is near the free water surface. The truss net cage remains relatively balanced when the torque center is positioned at 18-19 cm along the depth direction.
The present study only considers the distribution of drag force exerted on various components of the truss net cage in the current, without accounting for the consequences of wind or waves on the current load distribution. This limitation represents a shortcoming of the current research. In practical engineering applications, the combined consequences of wind, waves, and currents have a significant impact on the safety of net cage structures, particularly regarding strength-related damage, which cannot be ignored. The present study serves as a foundation for understanding hydrodynamic forces. In future research, we will focus on the truss net cage under the influence of wind, waves, and currents, including strength analysis of components such as the truss structure, netting, and mooring systems, to achieve optimized structural design and improvement.
Statements
Data availability statement
The original contributions presented in the study are included in the article/supplementary material. Further inquiries can be directed to the corresponding author.
Author contributions
HL: Conceptualization, Data curation, Formal analysis, Funding acquisition, Investigation, Methodology, Project administration, Resources, Software, Supervision, Validation, Visualization, Writing – original draft, Writing – review & editing. XH: Conceptualization, Funding acquisition, Investigation, Project administration, Resources, Supervision, Writing – review & editing. GP: Funding acquisition, Investigation, Methodology, Resources, Writing – review & editing. GL: Funding acquisition, Investigation, Writing – review & editing. TY: Data curation, Methodology, Writing – review & editing. YH: Investigation, Methodology, Writing – review & editing. QT: Conceptualization, Investigation, Writing – review & editing.
Funding
The author(s) declare that financial support was received for the research and/or publication of this article. This work was financially funded by National Natural Science Foundation of China (No.32173024, 32403089), Central Public-interest Scientific Institution Basal Research Fund, CAFS (No.2023TD97, 2024XT0803), Central Public-interest Scientific Institution Basal Research Fund, South China Sea Fisheries Research Institute, CAFS (NO.2024TS07, 2022TS06) and Project supported by Southern Marine Science and Engineering Guangdong Laboratory (Zhuhai) (No.SML2023SP237).
Conflict of interest
The authors declare that the research was conducted in the absence of any commercial or financial relationships that could be construed as a potential conflict of interest.
Generative AI statement
The author(s) declare that no Generative AI was used in the creation of this manuscript.
Publisher’s note
All claims expressed in this article are solely those of the authors and do not necessarily represent those of their affiliated organizations, or those of the publisher, the editors and the reviewers. Any product that may be evaluated in this article, or claim that may be made by its manufacturer, is not guaranteed or endorsed by the publisher.
References
1
BiC.-W.ZhaoY.-P.DongG.-H.WuZ.-M.ZhangY.XuT.-J. (2018). Drag on and flow through the hydroid-fouled nets in currents. Ocean Eng.161, 195–204. doi: 10.1016/j.oceaneng.2018.05.005
2
ChenQ.-P.MaC.ZhaoY.-P.BiC.-W.LiuH.-F. (2024). Hydrodynamics of focused waves acting on netting that extends above the mean sea level. Ocean Eng.309, 1–8. doi: 10.1016/j.oceaneng.2024.118516
3
ChuY. I.WangC. M.ParkJ. C.LaderP. F. (2020). Review of cage and containment tank designs for offshore fish farming. Aquaculture519, 1–16. doi: 10.1016/j.aquaculture.2020.734928
4
FAO (2024). The State of World Fisheries and Aquaculture 2024 (Rome, Italy: Food and Agriculture Organization).
5
GuoG.YouX.HuF.YamazakiR.ZhuangX.WuQ.et al. (2023). Hydrodynamic characteristics of fine-mesh minnow netting for sampling nets. Ocean Eng.281, 1–10. doi: 10.1016/j.oceaneng.2023.114738
6
HuangX.-H.GuoG.-X.TaoQ.-Y.HuY.LiuH.-Y.WangS.-M.et al. (2018). Dynamic deformation of the floating collar of a net cage under the combined effect of waves and current. Aquacultural Eng.83, 47–56. doi: 10.1016/j.aquaeng.2018.08.002
7
HuangX.-H.LiuH.-Y.HuY.YuanT.-P.TaoQ.-Y.WangS.-M.et al. (2020). Hydrodynamic performance of a semi-submersible offshore fish farm with a single point mooring system in pure waves and current. Aquacultural Eng.90, 1–9. doi: 10.1016/j.aquaeng.2020.102075
8
KristiansenT.FaltinsenO. M. (2015). Experimental and numerical study of an aquaculture net cage with floater in waves and current. J. Fluids Structures54, 1–26. doi: 10.1016/j.jfluidstructs.2014.08.015
9
KristiansenD.LaderP.JensenØ.FredrikssonD. (2015). Experimental study of an aquaculture net cage in waves and current. China Ocean Eng.29, 325–340. doi: 10.1007/s13344-015-0023-1
10
LiL.FuS.XuY.WangJ.YangJ. (2013). Dynamic responses of floating fish cage in waves and current. Ocean Eng.72, 297–303. doi: 10.1016/j.oceaneng.2013.07.004
11
LiuH.-F.BiC.-W.XuZ.ZhaoY.-P. (2021). Hydrodynamic assessment of a semi-submersible aquaculture platform in uniform fluid environment. Ocean Eng.237, 1–16. doi: 10.1016/j.oceaneng.2021.109656
12
LiuH.-F.LiuY. (2024). Numerical investigation on the dynamic response of the semi-submersible aquaculture platform in regular waves. Ocean Eng.294, 1–15. doi: 10.1016/j.oceaneng.2024.116718
13
LolandG. (1993). Current forces on, and water flow through and around, floating fish farms. Aquaculture Int.1, 72–89. doi: 10.1007/BF00692665
14
PaturssonØ.SwiftM. R.TsukrovI.SimonsenK.BaldwinK.FredrikssonD. W.et al. (2010). Development of a porous media model with application to flow through and around a net panel. Ocean Eng.37, 314–324. doi: 10.1016/j.oceaneng.2009.10.001
15
TangM.-F.XuT.-J.DongG.-H.ZhaoY.-P.GuoW.-J. (2017). Numerical simulation of the effects of fish behavior on flow dynamics around net cage. Appl. Ocean Res.64, 258–280. doi: 10.1016/j.apor.2017.03.006
16
TsukrovI.EroshkinO.FredrikssonD.SwiftM. R.CelikkolB. (2003). Finite element modeling of net panels using a consistent net element. Ocean Eng.30, 251–270. doi: 10.1016/S0029-8018(02)00021-5
17
XieW.LiangZ.HuZ.PanJ.JiangZ. (2023). Dynamic responses of a large fishing net under waves with boundaries deforming with time. Ocean Eng.276, 1–16. doi: 10.1016/j.oceaneng.2023.114245
18
XuZ. J.QinH. D. (2020). Fluid-structure interactions of cage based aquaculture: From structures to organisms. Ocean Eng.217, 1–20. doi: 10.1016/j.oceaneng.2020.107961
19
ZhaoY.-P.BiC.-W.ChenC.-P.LiY.-C.DongG.-H. (2015). Experimental study on flow velocity and mooring loads for multiple net cages in steady current. Aquacultural Eng.67, 24–31. doi: 10.1016/j.aquaeng.2015.05.005
20
ZhaoY.-P.BiC.-W.DongG.-H.GuiF.-K.CuiY.GuanC.-T.et al. (2013a). Numerical simulation of the flow around fishing plane nets using the porous media model. Ocean Eng.62, 25–37. doi: 10.1016/j.oceaneng.2013.01.009
21
ZhaoY.GuanC.BiC.LiuH.CuiY. (2019). Experimental investigations on hydrodynamic responses of a semi-submersible offshore fish farm in waves. J. Mar. Sci. Eng.7, 1–19. doi: 10.3390/jmse7070238
22
ZhaoY.-P.GuiF.-k.XuT.-J.ChenX.-F.CuiY. (2013b). Numerical analysis of dynamic behavior of a box-shaped net cage in pure waves and current. Appl. Ocean Res.39, 158–167. doi: 10.1016/j.apor.2012.12.002
Summary
Keywords
semi-submersible truss fish cage, porous media theory, drag force, Torque, current
Citation
Liu H-F, Huang X, Pang G, Li G, Yuan T, Hu Y and Tao Q (2025) Assessment on drag force distribution of a semi-submersible truss fish cage in currents. Front. Mar. Sci. 12:1557985. doi: 10.3389/fmars.2025.1557985
Received
09 January 2025
Accepted
24 February 2025
Published
07 March 2025
Volume
12 - 2025
Edited by
Chunwei Bi, Ocean University of China, China
Reviewed by
Shuchuang Dong, The University of Tokyo, Japan
Xiaodong Bai, Tianjin University, China
Updates
Copyright
© 2025 Liu, Huang, Pang, Li, Yuan, Hu and Tao.
This is an open-access article distributed under the terms of the Creative Commons Attribution License (CC BY). The use, distribution or reproduction in other forums is permitted, provided the original author(s) and the copyright owner(s) are credited and that the original publication in this journal is cited, in accordance with accepted academic practice. No use, distribution or reproduction is permitted which does not comply with these terms.
*Correspondence: Xiaohua Huang, huangx-hua@163.com
Disclaimer
All claims expressed in this article are solely those of the authors and do not necessarily represent those of their affiliated organizations, or those of the publisher, the editors and the reviewers. Any product that may be evaluated in this article or claim that may be made by its manufacturer is not guaranteed or endorsed by the publisher.