 Qiang Wang1
 Yu Duan
94% of researchers rate our articles as excellent or good
Learn more about the work of our research integrity team to safeguard the quality of each article we publish.
Find out more
ORIGINAL RESEARCH article
Front. Mar. Sci., 06 March 2025
Sec. Ocean Observation
Volume 12 - 2025 | https://doi.org/10.3389/fmars.2025.1557950
This paper, based on channel topographic survey data from 2015 to 2023, analyzes the scouring and silting evolution characteristics of the Made Island port channel, port basin, outer anchorage, and empty ship anchorage. By conducting a quantitative analysis of water depth variations and scouring and silting phenomena across different years, this paper investigates the effects of water flow, topographic changes, and human dredging activities on the topographic evolution of the port area. The study utilizes bathymetric survey data collected at two-year intervals using the MV SEA PRINCESS survey vessel, equipped with a Positioning, Motion and Heading Unit, Bathymetric Equipment for Sounding, Sound Velocity Profiler, Single Beam Echosounder, and Transducers. The monitoring methodology involved interpolating and subtracting multi-year bathymetric data to assess sediment transport dynamics. The results indicate that the Made Island port channel exhibits a dynamic alternation of scouring and silting, with significant sediment accumulation in shallow areas, especially after dredging operations. Notably, the outer anchorage experiences the highest silting rates in years with increased sediment supply, whereas the port basin generally maintains deeper water levels, ensuring its functionality despite localized siltation. The empty ship anchorage shows strong correlations between water flow speed variations and sediment deposition, leading to navigational constraints in certain conditions. The findings indicate that the scouring and silting phenomena in the port area are the result of multiple interacting factors. The paper recommends regular topographic monitoring and the implementation of necessary dredging and maintenance measures to ensure the efficient operation and navigational safety of the port.
Made Island is situated within Kayauk Phyu County, Rakhine State, on the western coast of Myanmar, and covers an area of approximately 12 square kilometers. Originally a remote island primarily engaged in fisheries and agriculture, it became the starting point for the China-Myanmar crude oil pipeline project, and is now home to Myanmar’s first international large-scale crude oil unloading port.
The China-Myanmar crude oil pipeline begins at Made Island Port in Kyauk Phyu Bay, along the Bay of Bengal in Myanmar, passing through Rakhine State, Magway Region, Mandalay, and Shan State, and enters China at Ruili, Yunnan. Currently, its terminus is in Kunming, Yunnan, with long-term plans to extend to Chongqing. This pipeline, following the China-Kazakhstan crude oil pipeline, Central Asia natural gas pipeline, and China-Russia crude oil pipeline, serves as another critical energy import route (You, 2018). In the channel and restricted waters of Made Island Port, due to relatively shallow water depths and narrow channels, vessels experience significant shallow water and bank effects during navigation. These effects may lead to phenomena such as bank suction or bank push. Additionally, the sinking of ship hulls is also quite noticeable. Therefore, ensuring adequate channel width and water depth to avoid these issues is an important consideration for navigation safety in this area (Song and Lv, 2024; Yang and Li, 2020).
The silting phenomenon in the channel reduces the cross-sectional area of the river, decreasing drainage capacity, which significantly impacts the navigability of the entry channel (Wan et al., 2009). Existing research has shown that by analyzing scouring and silting phenomena in different ports, one can reveal trends and causes of channel changes. For example, a study based on the MIKE11 model’s CST module analyzed the scouring and silting changes in the river mouth channel of Yancheng (Ju et al., 2015); another study used measured nautical charts and MapInfo methods to digitize water depth data and quantitatively evaluate the scouring and silting conditions from Sanya Port to Chuanyao Port, and the Xiyang tidal current channel (Gao et al., 2009). Recent studies have further advanced sediment transport modeling approaches. Kundu et al. applied a 1D sediment transport model to examine seasonal variations in bridge scour, demonstrating the critical role of hydrodynamic fluctuations in sediment deposition (Kundu et al., 2025). Similarly, Gupta et al. reviewed the ecological consequences of fine sediment intrusion, emphasizing its long-term impact on navigational channels and marine ecosystems (Gupta et al., 2023). These studies highlight the importance of integrating sediment transport modeling with real-time monitoring, which our study adopts to improve the understanding of scouring and silting in the Made Island Port channel. Furthermore, the scouring and silting changes in the Dandong Port area before and after reclamation projects have been thoroughly discussed (Wang et al., 2017), and the seabed scouring and silting characteristics of Dongshan Bay during the 1950s, 1970s, 1990s, and 2008 have been clarified through comparisons of nautical charts and water depth data (Liang et al., 2016). Additionally, the impact of the Yangtze River deepwater channel improvement project on the scouring and silting of the North Channel riverbed was focused on through topographic survey maps, analyzing the dredging and sediment deposition processes of the deepwater channel (Pan et al., 2011). Combining the hydrological data, topographic surveys, and silting conditions of the Yangtze River channel from 2011 to 2017, a further analysis was conducted on the scouring and silting changes and their causes in the 12.5-meter deepwater channel, revealing sediment deposition conditions and trends over different years (Liu et al., 2019).
Although research on scouring and silting in the Made Island Port channel is relatively scarce, recent years have seen some preliminary exploration of its spatial and temporal changes. However, a systematic long-term study quantifying the evolution of sediment transport and deposition patterns in this port remains lacking. Given that excessive sedimentation can significantly impact navigability and operational efficiency, understanding these processes is critical for sustainable port management. Furthermore, previous research has not sufficiently quantified the impact of human interventions, such as dredging, on sedimentation patterns. This study fills this gap by systematically analyzing multi-year bathymetric survey data (2015–2023) to assess the spatial and temporal variations in sediment transport. By integrating hydrodynamic influences with human-induced modifications, our research provides a comprehensive understanding of sedimentation processes and offers practical recommendations for sustainable port maintenance and navigational safety. The paper will analyze the evolution of the channel topography, port basin topography, outer anchorage topography, and the topography of the empty ship anchorage, providing reference for studying the sediment silting patterns in the Made Island channel and for navigation marker monitoring.
The 300,000-ton crude oil terminal at Made Island Port is located on Made Island in Kyauk Phyu, Rakhine State, Myanmar (Figure 1). The terminal is surrounded by a group of islands to the southwest of the Widian coast, providing excellent shelter conditions. The crude oil terminal was fully completed and put into operation in July 2014.
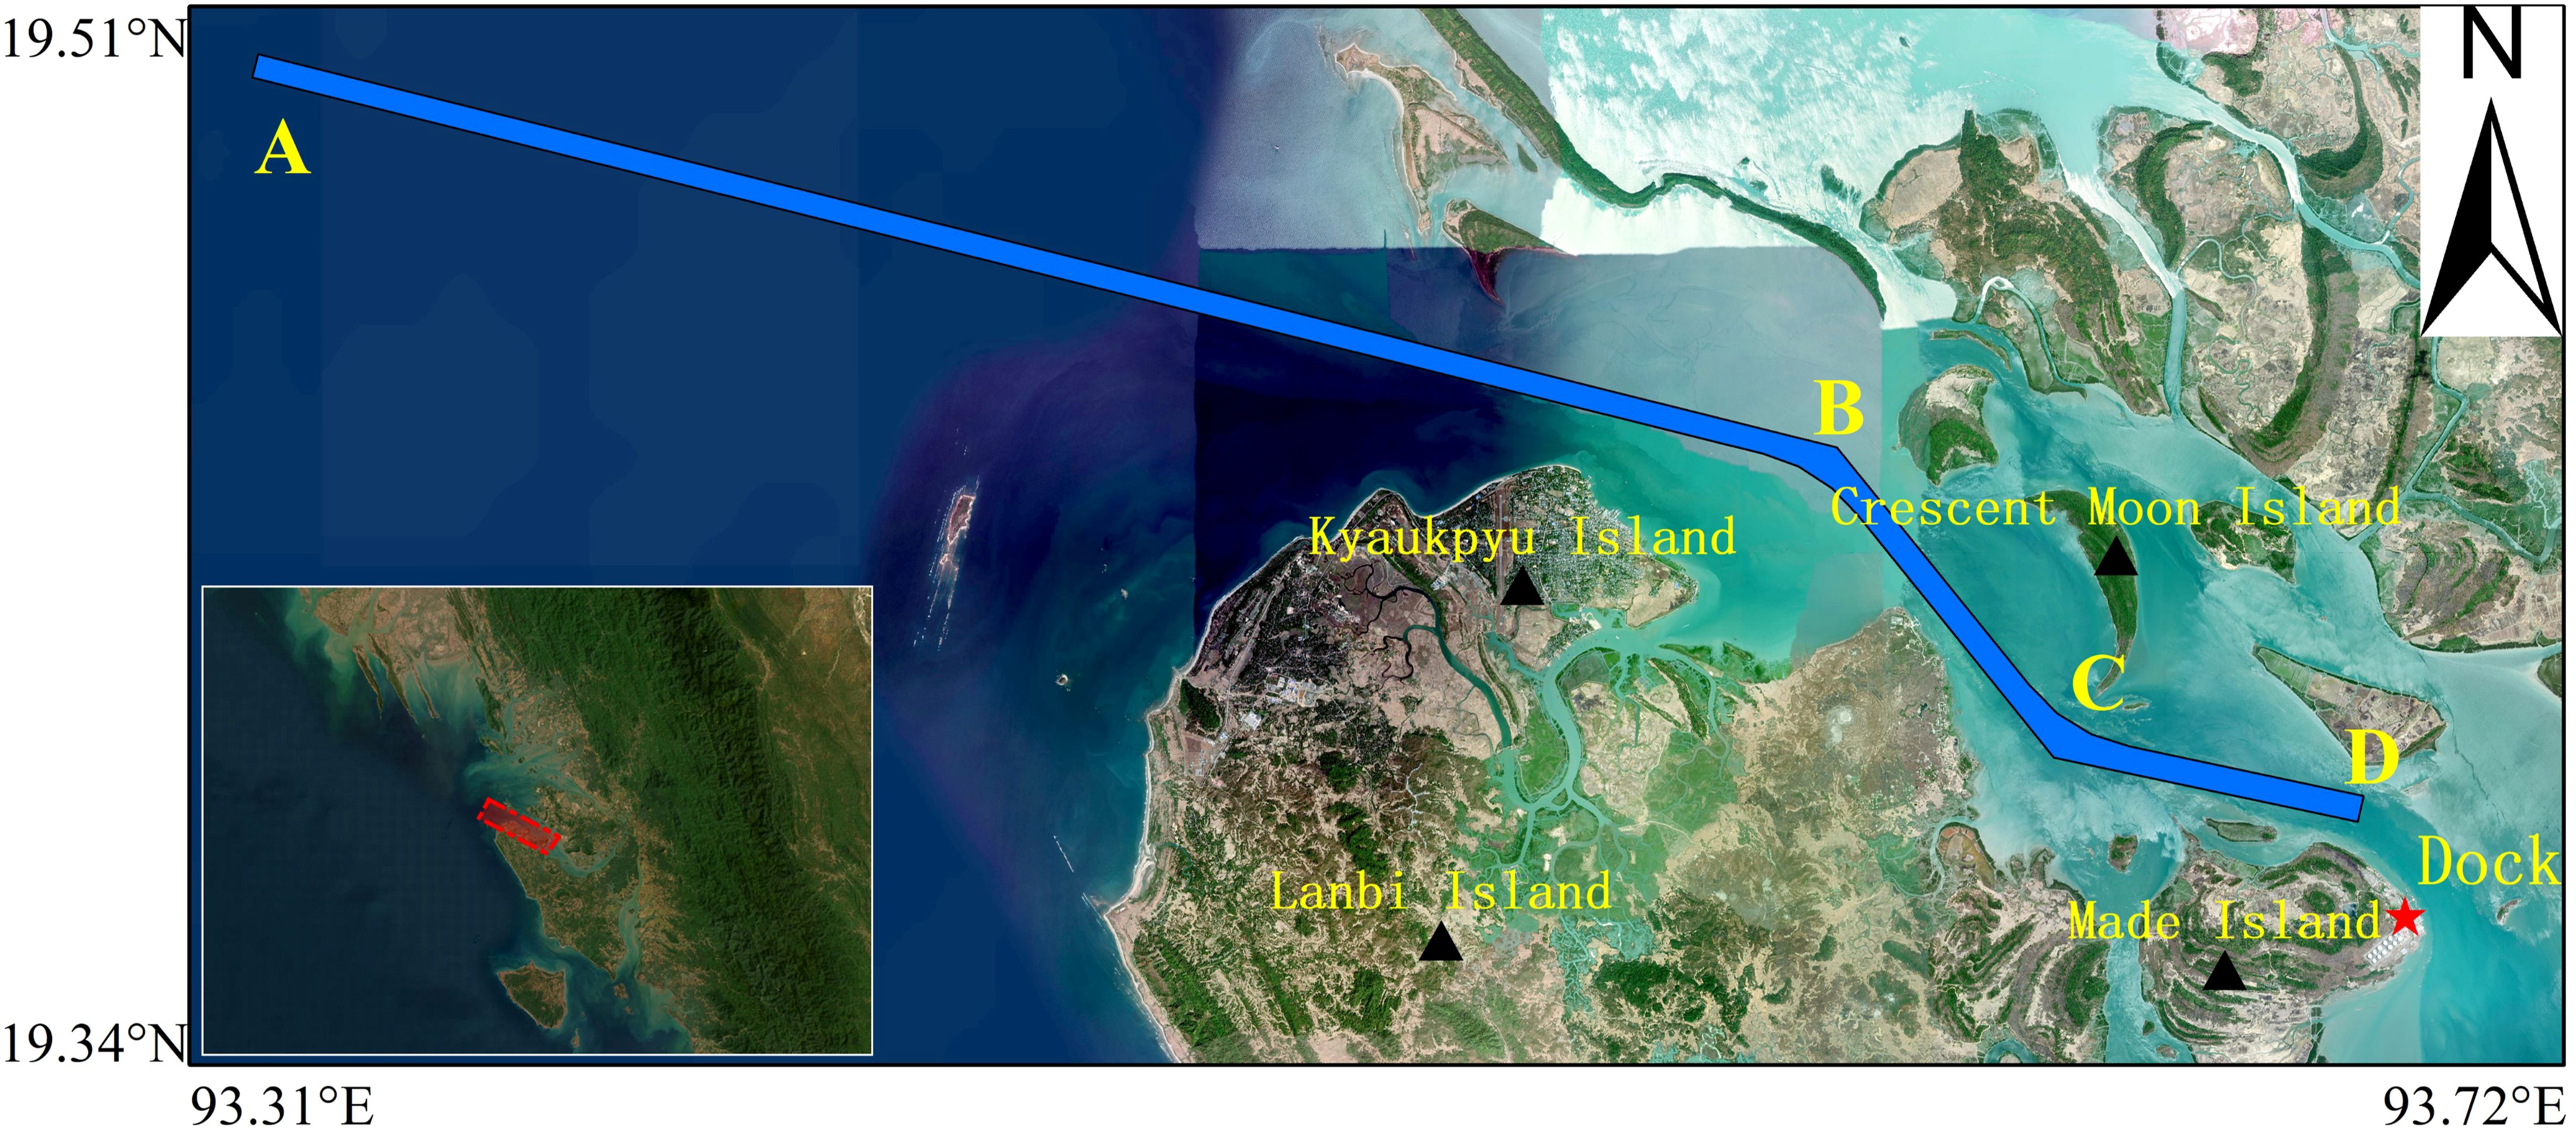
Figure 1. Diagram of the port channel location at Made Island. Section AB, The outer channel; Section BC, The Crescent Island Channel; Section CD: The Made Island Channel.
The entrance channel to Made Island Port is surrounded by multiple islands and is connected to the open sea through tidal channels. Following artificial dredging, the current channel depth has reached −22.8 meters. The total length of the channel from the open sea to the port is approximately 25 nautical miles, divided into three sections: the outer channel (Section AB), the Crescent Island Channel (Section BC), and the Made Island Channel (Section CD), as shown in Figure 1. Detailed information on the water depths and positions of the navigation markers can be found in Table 1.
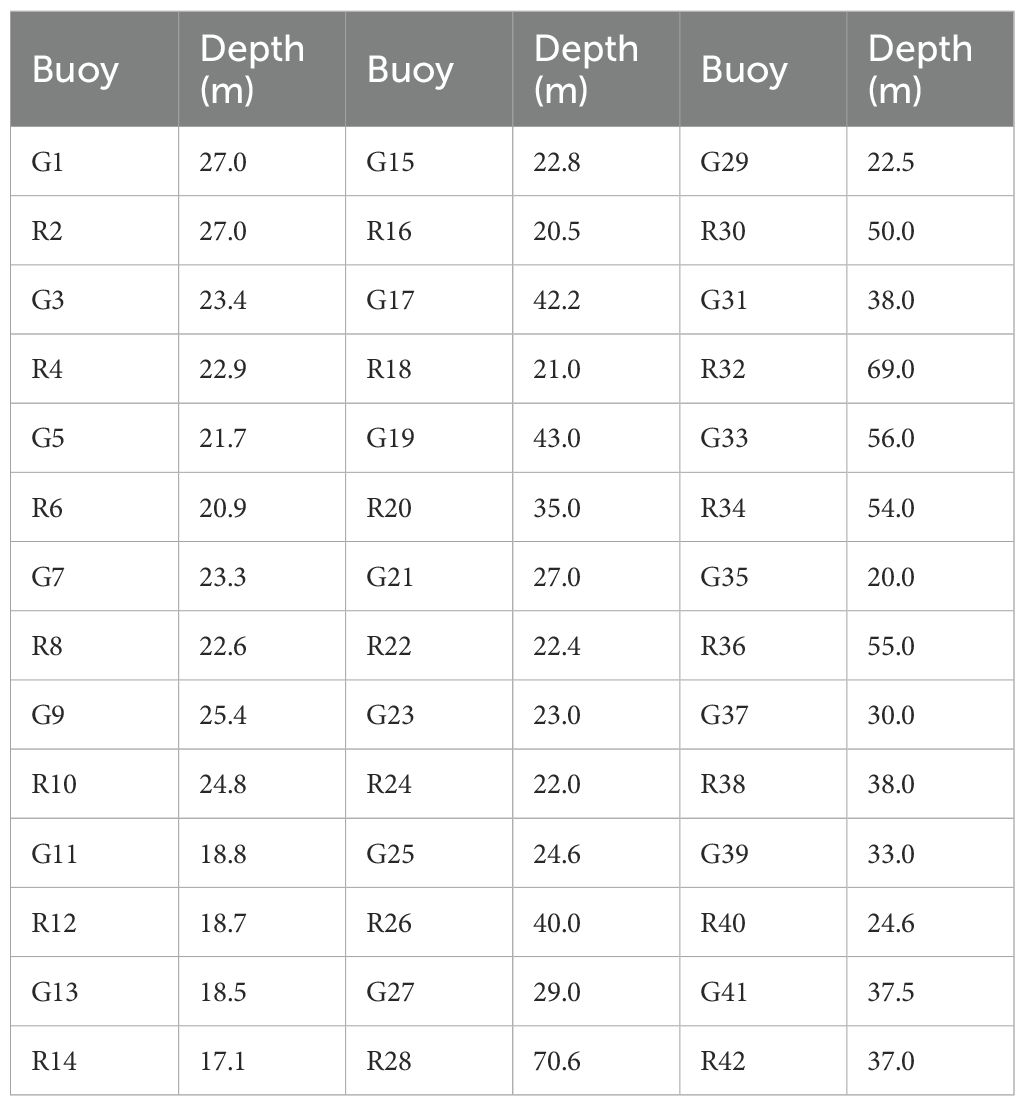
Table 1. Depth and location information of the navigation marks.
The outer channel (Section AB) is shown in Figure 2. Starting from the pilot boarding point in the open sea, it has a total length of approximately 18.5 nautical miles, a width of 320 meters, and a water depth of −22.8 meters. The channel orientation is from 104° to 284°. At the turning point B, the channel is widened using a zigzag method. Ships entering the port need to turn about 40° to the right at this point and then proceed into the Crescent Island Channel (Section BC).
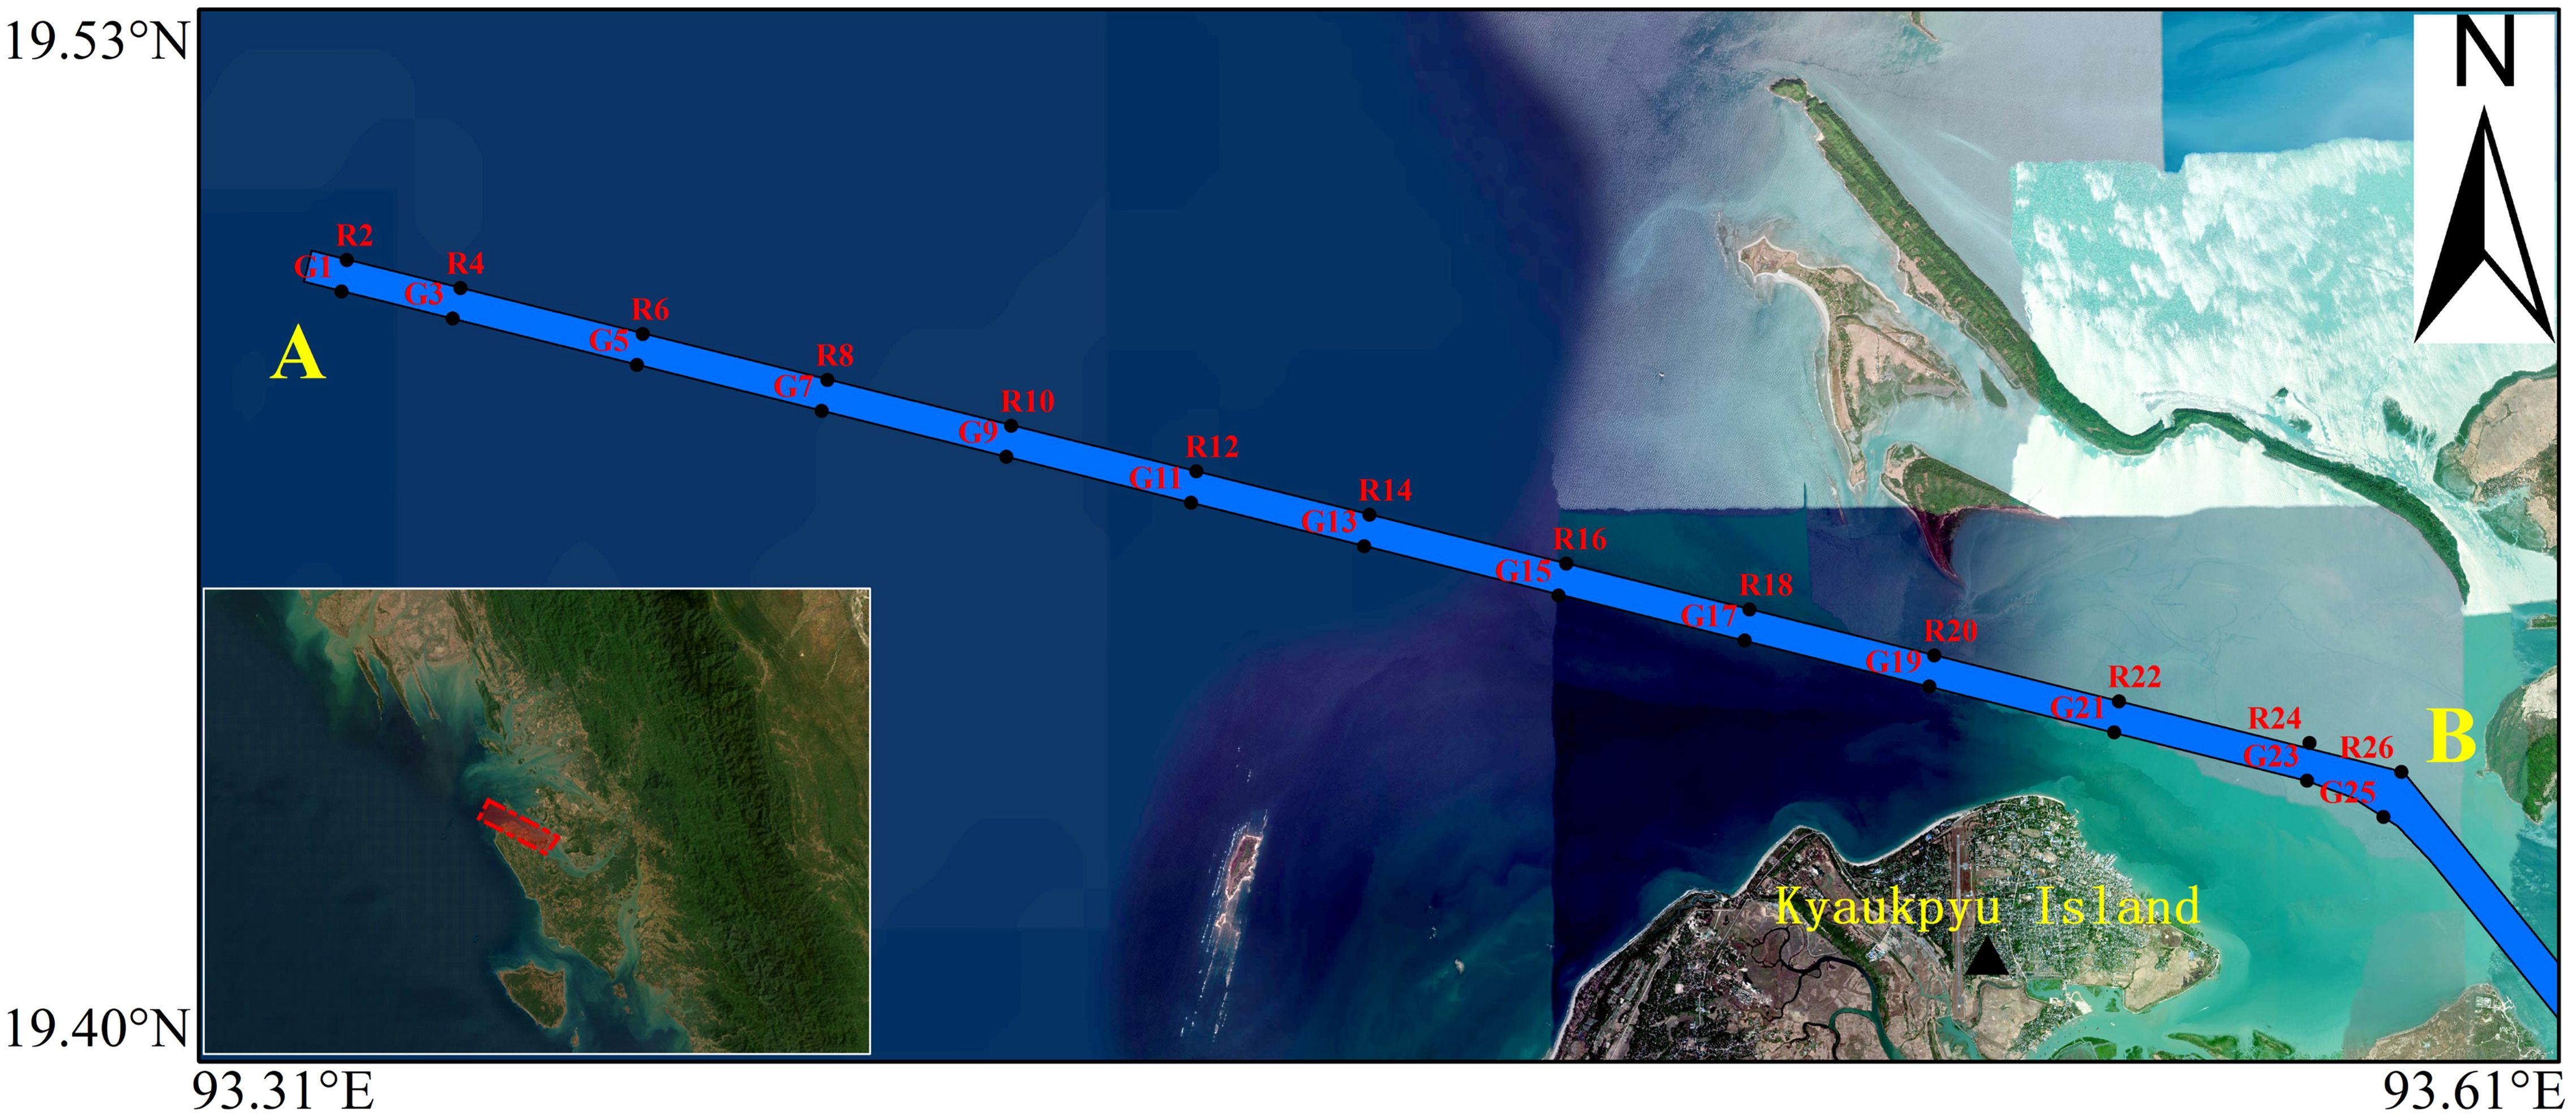
Figure 2. Locations of navigation marks along Section AB (The outer channel).
The Crescent Island Channel (Section BC) is shown in Figure 3. It has a total length of about 3.5 nautical miles, a width of 360 meters, and a water depth of −22.8 meters. The channel orientation is from 141° to 321°. At the turning point C, the channel is widened using a zigzag method. Ships entering the port must turn about 40° to the left at this point and then enter the Made Island Channel (Section CD).
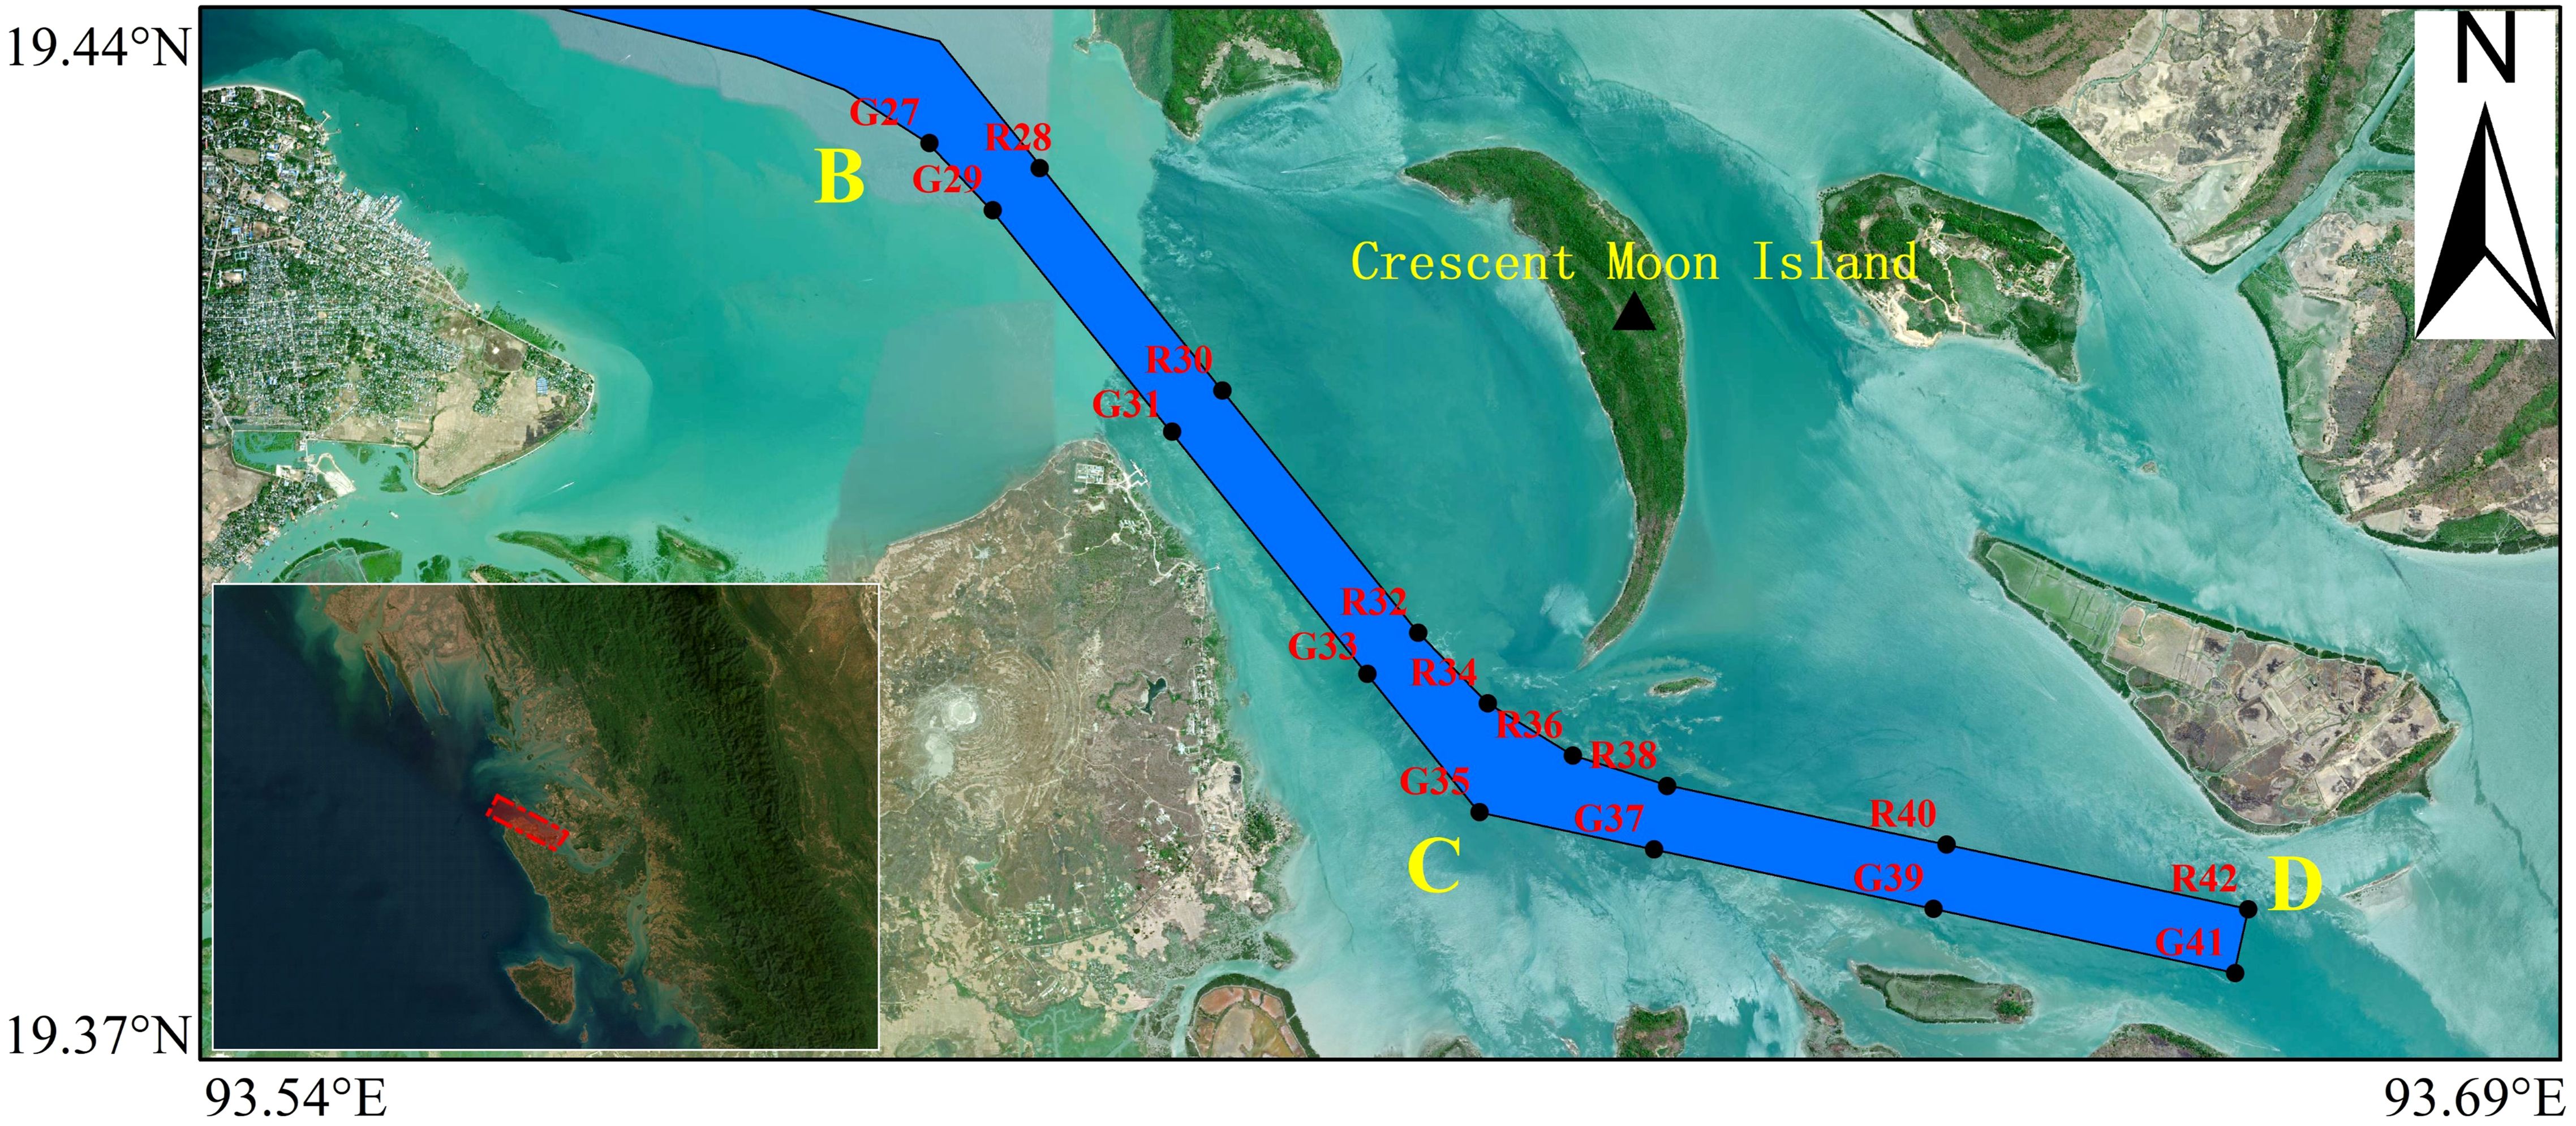
Figure 3. Locations of navigation marks along Sections BC (The Crescent Island Channel) and CD (The Made Island Channel).
The Made Island Channel (Section CD) is also shown in Figure 3. It has a total length of approximately 3 nautical miles, a width of 360 meters, and a water depth of −22.8 meters. The channel orientation is from 102° to 282°. At the turning point D, the channel is widened using a zigzag method. Ships entering the port need to turn about 50° to the right at this point and proceed into the water area in front of the terminal.
The meteorological conditions at the location of the terminal vary with the seasons. In the early season (from November to April of the following year), the prevailing wind direction is from the northwest (WNW), with a frequency of 13.50%. The strong wind direction is also from the northwest, with wind speeds greater than 5.5 m/s occurring with a frequency of 0.33%, and wind speeds greater than 5.4 m/s occurring with a frequency of 0.76%. In the rainy season (from May to October), the prevailing wind direction is from the south-southeast (SSE), with a frequency of 21.90%. The strong wind direction is from the north-northwest (NNW), with wind speeds greater than 8.0 m/s occurring with a frequency of 0.07%, and wind speeds greater than 5.4 m/s occurring with a frequency of 1.52%.
Based on three years of continuous observation data at Made Island, the frequency of wind speeds exceeding 10.8 m/s is only 0.02%. To date, no thunderstorms or other hazardous weather events have been recorded in the waters where the Made Island 300,000-ton crude oil terminal is located.
Made Island experiences a mixed semi-diurnal tide. As the island is located within Kyauk Phyu Bay, approximately 8 nautical miles from Kyauk Phyu Island, the tidal times at Made Island are about 30 minutes later than those at Kyauk Phyu Island. The average mean sea level at the Made Island crude oil terminal is 1.53 meters, with the highest tide reaching 3.48 meters and the lowest tide reaching −0.62 meters. The average high tide level is 2.61 meters, the average low tide level is 0.36 meters, with a maximum tidal range of 3.85 meters and an average tidal range of 2.26 meters. The average flood tide time is 6 hours and 22 minutes, while the average ebb tide time is 6 hours and 2 minutes.
The survey vessel MV SEA PRINCESS (Figure 4) was chartered from INJYNN Development Company Ltd. It is a twin-propelled Shoal Buster multipurpose vessel registered under the Myanmar flag.
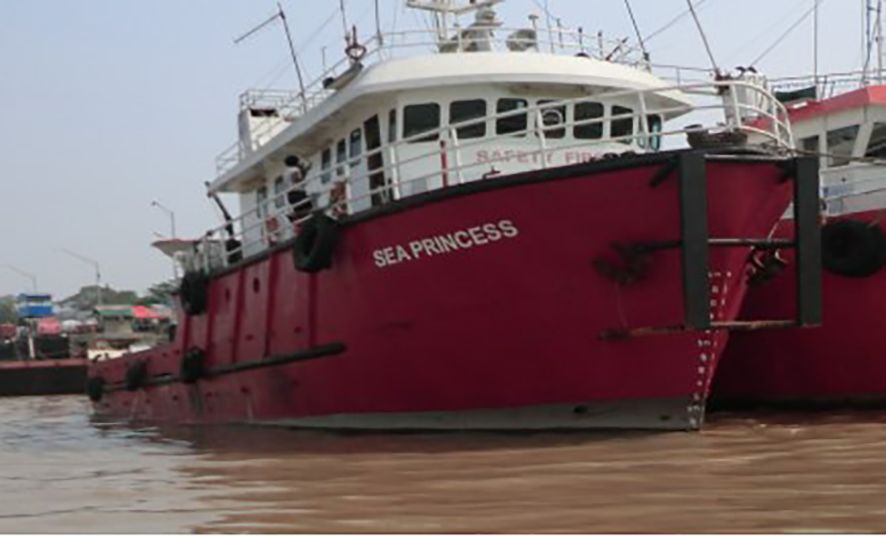
Figure 4. Image of MV SEA PRINCESS.
The survey equipment installed on board the MV SEA PRINCESS consisted of a Positioning, Motion and Heading Unit, Bathymetric Equipment for Sounding, Sound Velocity Profiler, Single Beam Echosounder and Transducer, and Two Pacific Crest ADL Vantage Transceivers. These instruments were employed to measure bathymetry with a precision reaching the centimeter level, and a sampling frequency ranging from several Hertz to dozens of Hertz. The bathymetric survey used a Multibeam Echo Sounding technique, which employs multiple beams to map underwater topography, ensuring 100% seabed coverage. The R2Sonic 2024 Multibeam Sonar System used in the survey operates with 256 focused beams, a 0.5° x 1° transducer, and a 160° swath coverage, although only a 120° beam was used to ensure high precision. The frequency was set to 200kHz, and the ping rate was 20 pings per second. Other equipment included the TSS Orion INS Gyro Compass and Integrated Motion Sensors for precise heading and motion compensation, and the Valeport Sound Velocity Profiler for measuring the velocity of sound in the water, correcting for errors due to water column variations. The survey adhered to IHO Special Order standards, ensuring both measurement accuracy and reliability.
The horizontal accuracy of the survey was better than 1 meter, achieved through differential corrections from the Trimble SPS461 GPS. The vertical accuracy of the measurements using R2Sonic 2024 and Valeport equipment is ±0.3 meters. The pitch and roll accuracy of the motion sensors was ±0.01°, with heave accuracy of ±5cm. The accuracy of the Valeport Sound Velocity Profiler was ±0.3m/s, with a resolution of ±0.1m/s.
From 2015 to 2023, a total of seven bathymetric surveys were conducted at the Madeira Island port channel and harbor, in the years 2015, 2016, 2017, 2018, 2019, 2022, and 2023. The scouring and silting bathymetric maps were generated by interpolating and subtracting bathymetric data from surveys conducted two years apart.
Based on the topographic survey data of the Made Island Port channel and harbor from 2015 to 2023, a total of seven surveys, an analysis of the scouring and silting changes between different years in the channel was conducted. Figure 5 shows the scouring and silting changes in the overall Made Island channel between different years.
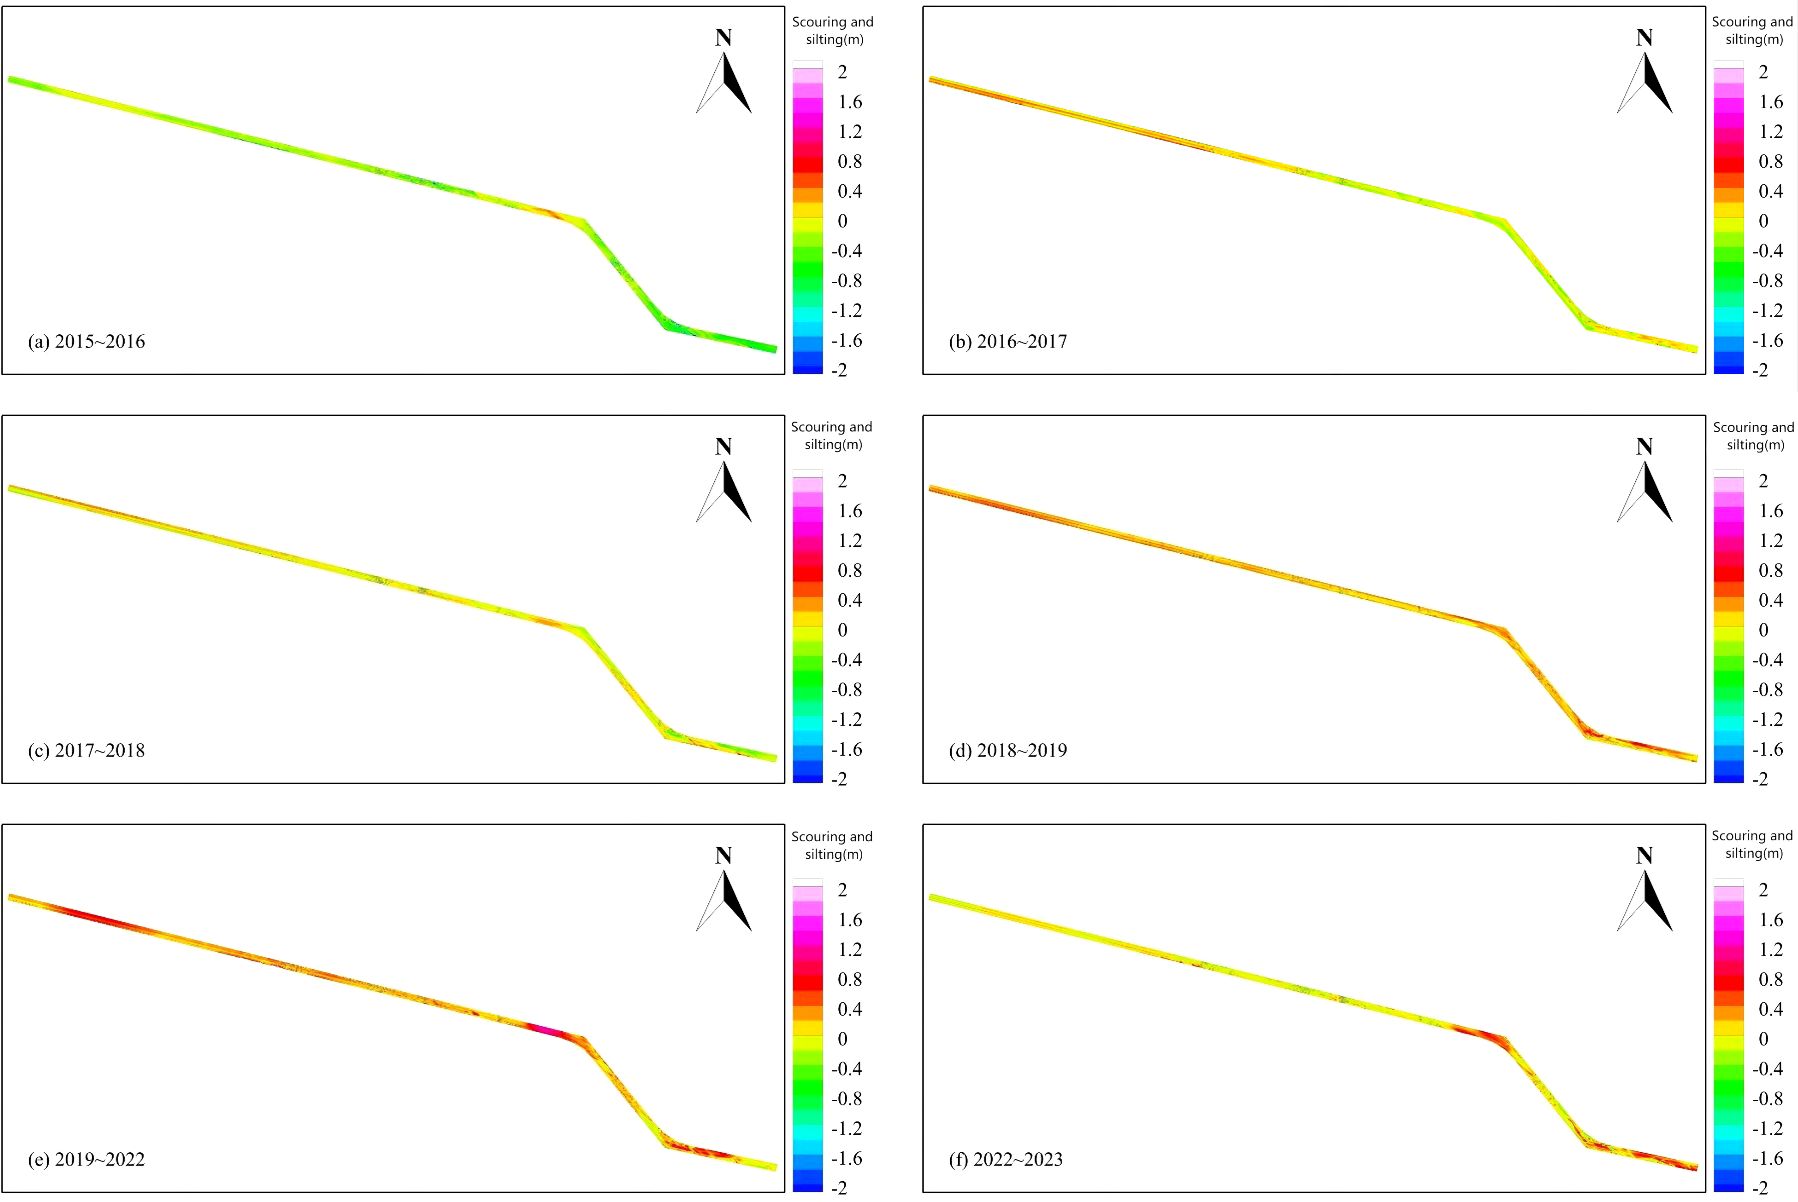
Figure 5. Overall channel scouring and silting changes.
Based on the overall scouring and silting changes in the channel, significant areas of heightened silting were observed, indicating that these regions have relatively large silting depths. An analysis of the scouring and silting conditions in different sections of the channel over the years was conducted. From 2015 to 2023, scouring and silting phenomena in different sections of the channel were studied, revealing noticeable annual variations in silting. In 2015, following extensive dredging activities, the channel primarily exhibited scouring, with minor silting observed in specific areas (e.g., the G23-R24 section). Between 2016 and 2017, the silting phenomenon gradually intensified, particularly in sections outside G41-R42 to G37-R38 and G15-R16, where the maximum silting depth in certain areas reached 1.0 meter. From 2017 to 2018, areas closer to the harbor experienced scouring, while areas farther from the harbor exhibited significant silting, particularly on the right side, where the silting depth exceeded 0.6 meters in some regions. From 2018 to 2019, the silting phenomenon reached its peak, with localized silting depths approaching 2.0 meters in the G41-R42 to G23-R24 sections. This can likely be attributed to anthropogenic activities, such as sediment backfilling. Between 2019 and 2022, the extent of silting further expanded, with localized areas experiencing silting depths exceeding 2.0 meters, particularly in the G7-R8 to G3-R4 sections. From 2022 to 2023, although localized silting remained significant, scouring and silting alternated, leading to a reduction in the overall occurrence of large-scale scouring or silting events.
In summary, the silting of the channel was primarily influenced by the interaction of hydrodynamic conditions, sediment supply, and human dredging activities. The reduction in flow velocity near the harbor and anthropogenic interventions significantly contributed to the exacerbation of silting (van Rijn, 1984).
To further clarify the variations in water depth and scouring and silting along the channel, depth and scouring distribution maps were drawn along the centerline of the channel, as shown in Figures 6, 7. The horizontal axis in these figures begins at the G41-R42 position of the channel. According to the longitudinal bed elevation distribution in Figure 6, the water depth along the Made Island Port channel shows significant variation, with a clear pattern of alternating deep and shallow areas. Two deep valleys were observed in the channel, located at distances of 3.9–8.0 km and 17.9–19.4 km from the starting point, where the water depth exceeds 50 meters, with the deepest point approaching 70 meters. As scouring and silting continued over time, the bed elevation in certain sections of the channel rose, leading to shallower water depths. Sections of the channel between 1.2–3.3 km, 11.5–15.5 km, and beyond 21.4 km from the starting point had water depths less than 30 meters. The design depth of the Made Island Port channel is −22.8 meters, with dredging carried out when the bed elevation exceeds −21.5 meters. Overall, the variation in water depth along the channel is closely related to the local topography and hydrodynamic conditions. The deep valleys are relatively stable, while the shallow water areas are more susceptible to scouring or silting. Regular dredging and maintenance are essential measures to ensure the smooth navigation of the channel.
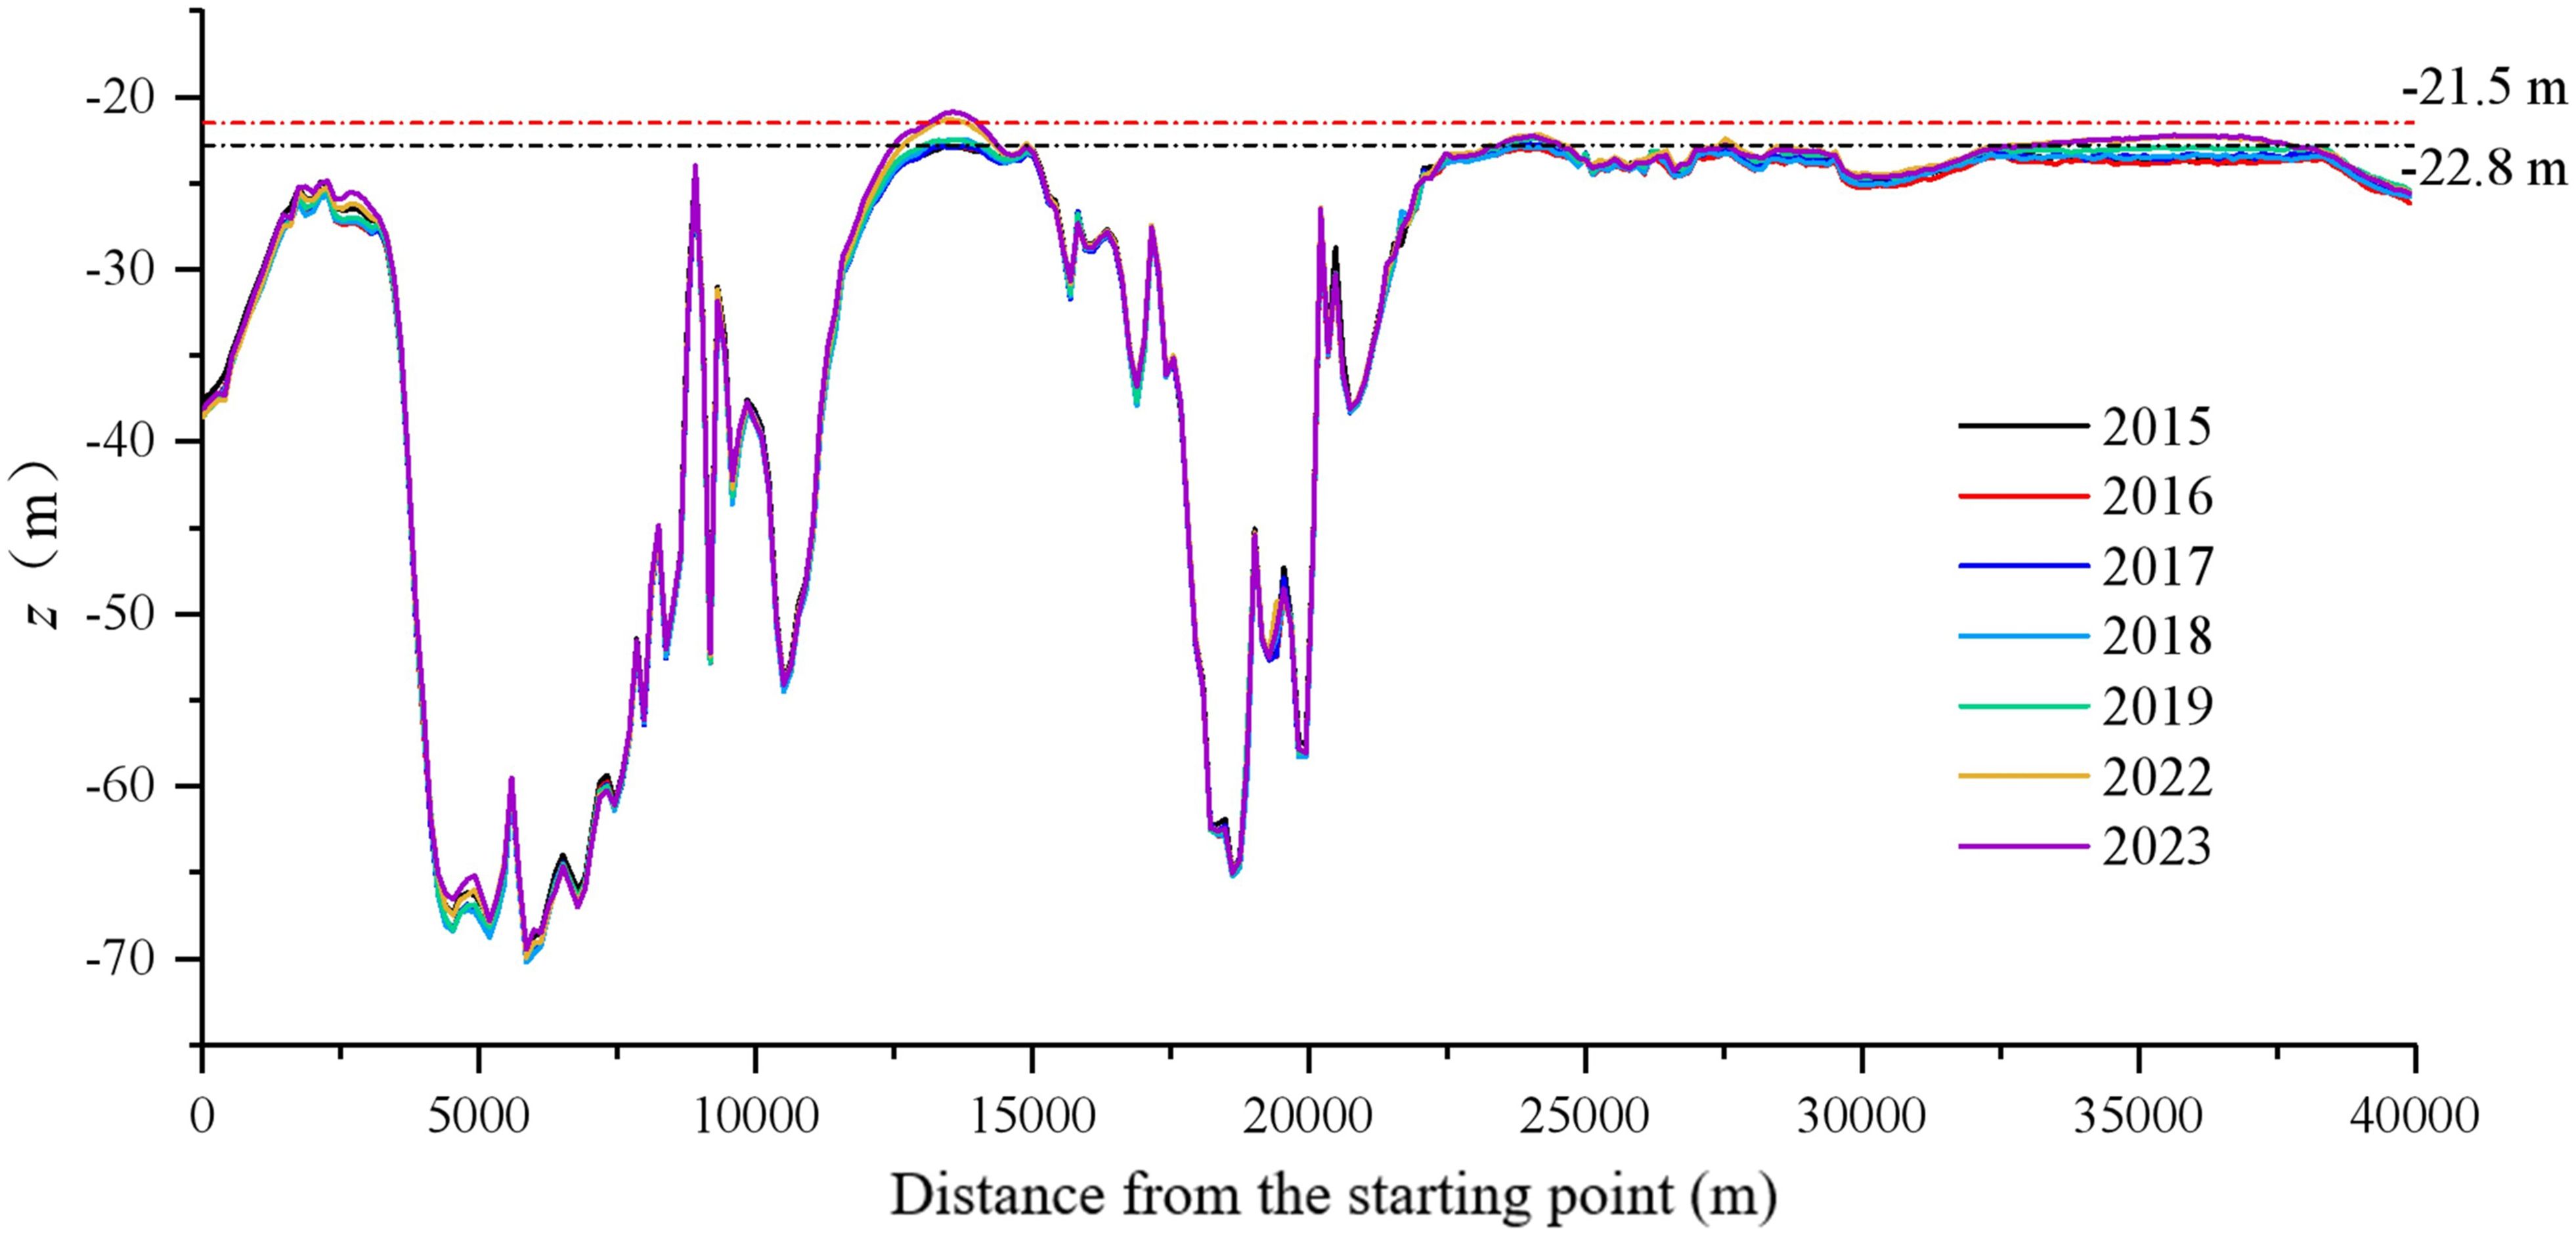
Figure 6. Distribution of bottom elevation along the Made Island port channel from 2015 to 2023.
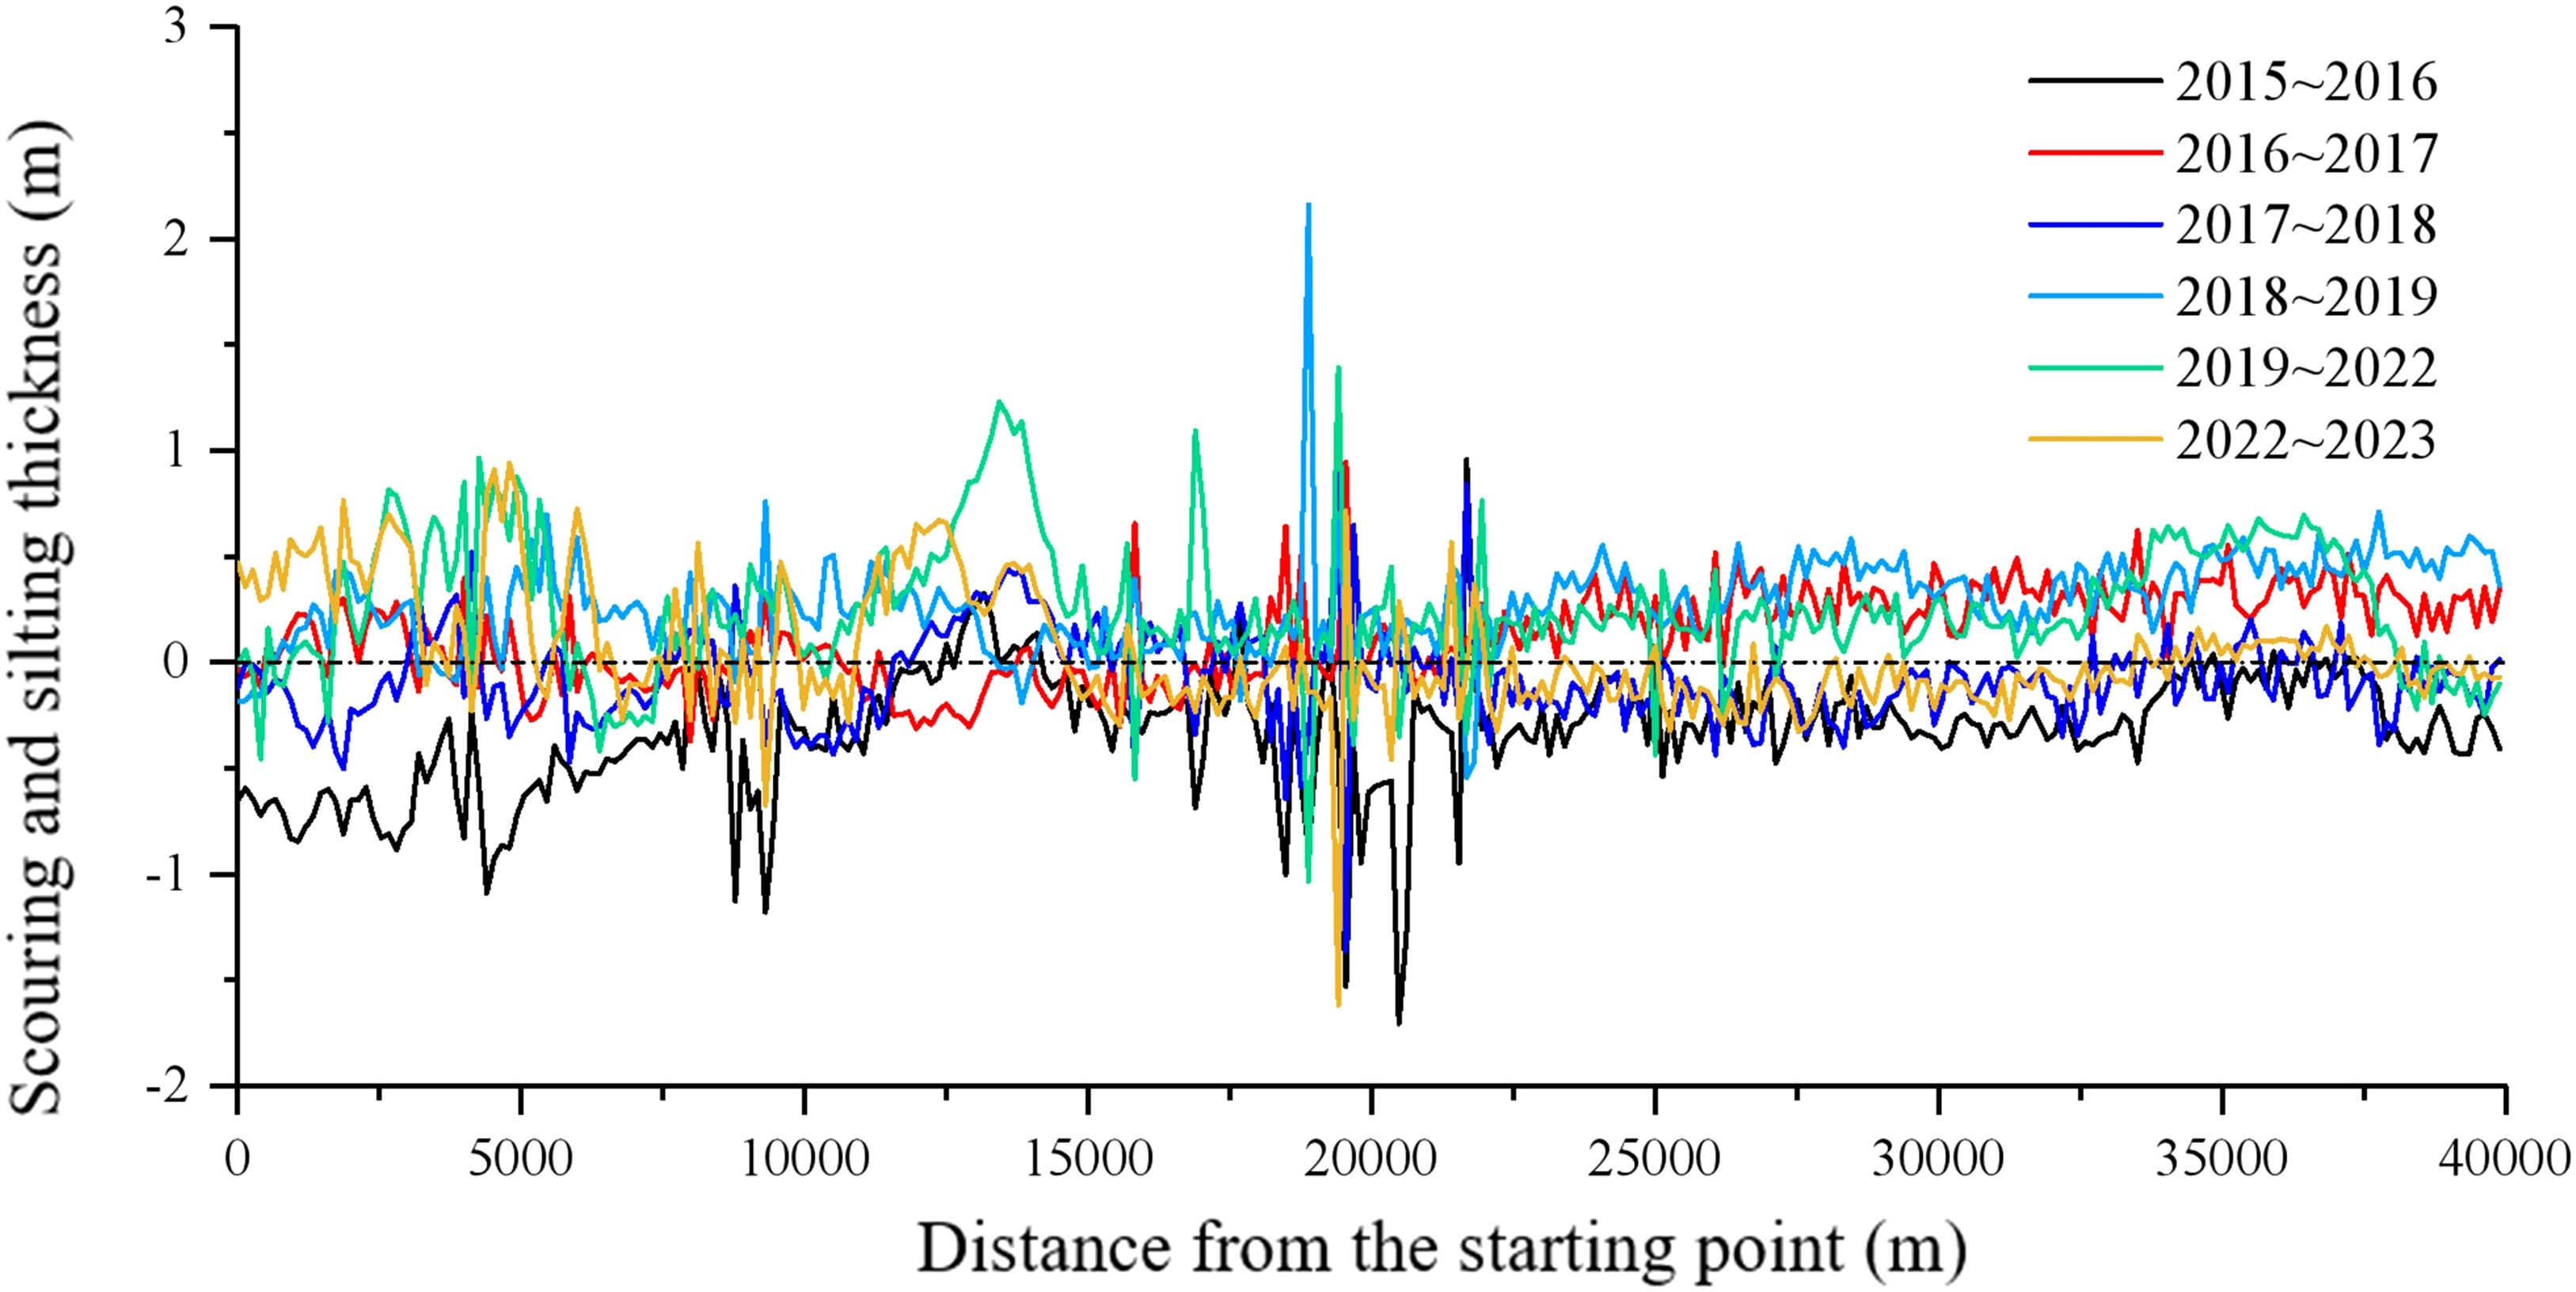
Figure 7. Distribution of scouring and silting along the Made Island port channel from 2015 to 2023.
The scouring and silting distribution along the Made Island Port channel exhibited a clear pattern of change over different years, as shown in Figure 7. Following the channel dredging in August 2015, the channel primarily experienced scouring from 2015 to 2016. Between 2016 and 2017, scouring and silting were observed along sections of the channel less than 20.0 km from the starting point, while areas beyond 20.0 km were predominantly affected by silting. From 2017 to 2018, scouring and silting alternated in sections less than 20.0 km from the starting point, while the areas greater than 20.0 km were mostly dominated by scouring. Between 2018 and 2019, as well as 2019 and 2022, the channel generally showed a trend of silting. In 2022 to 2023, the section of the channel less than 20.0 km from the starting point primarily experienced silting, while areas beyond 20.0 km mainly showed minor scouring. From the perspective of scouring and silting thickness, between 2017 and 2023, substantial fluctuations were observed in the channel bed topography in the range of 18.0–20.0 km from the starting point, with elevation changes between −1.7 and 2.2 meters. However, due to the greater water depth in this region (mostly above 45 meters), the silting had minimal impact on channel navigation. In contrast, sections of the channel between 12.3–15.1 km, 23.0–24.8 km, and 32.0–38.5 km from the starting point have predominantly experienced silting since 2018. These areas have shallower water depths, mostly below 24 meters, and may potentially affect the safety of navigation to some extent. Overall, the pattern of scouring and silting in the channel is closely related to factors such as hydrodynamics, topography, and human intervention. Silting fluctuations are smaller in deeper water areas, while shallow areas are more susceptible to scouring or silting. To ensure the navigability of the channel, regular topographic surveys should be conducted, and timely dredging should be performed in shallow areas.
To quantify the scouring and silting conditions across different years and channel sections, this paper calculates the average scouring and silting volumes and thicknesses for each year and channel section. Figure 8 shows the overall scouring and silting conditions of the entire channel, while Figure 9 reflects the scouring and silting conditions of different channel sections. Figures 9a to i sequentially illustrate the conditions from G41-R42 to G37-R38, G37-R38 to G31-R30, G31-R30 to G23-R24, G23-R24 to G19-R20, G19-R20 to G15-R16, G15-R16 to G11-R12, G11-R12 to G7-R8, G7-R8 to G3-R4, and beyond G3-R4 across nine channel sections. For the specific locations of these sections, refer to Table 1 and Figures 2, 3. From 2015 to 2016, due to the influence of dredging, the channel predominantly exhibited scouring. The total scouring volume for the entire channel was 4.626 million m³/a, with an average scouring intensity of 0.38 m/a, while the silting volume was 208,600 m³/a, with an average silting intensity of 0.14 m/a. In this period, the scouring volume significantly exceeded the silting volume in all sections. From 2016 to 2017, the sections from G37-R38 to G15-R16 exhibited a scouring trend, while sections from G41-R42 to G37-R38 and beyond G15-R16 showed higher average silting volumes than scouring volumes, indicating the beginning of a silting trend. In the period from 2017 to 2018, scouring predominated in the sections from G41-R42 to G23-R24, G19-R20 to G15-R16, and G3-R4, while other sections showed a predominant silting trend. The overall scouring volume was 1.3286 million m³/a, with scouring and silting volumes being relatively close. From 2018 to 2019, silting was the most severe, with all sections predominantly experiencing silting. The total silting volume reached 3.1258 million m³/a, with an average silting intensity of 0.26 m/a, while the scouring volume was only 244,200 m³/a, with an average scouring intensity of 0.16 m/a. This period’s high intensity silting may have been exacerbated by sediment refilling following the dredging in April 2018. From 2019 to 2022, the channel remained dominated by silting, but the intensity of silting significantly decreased. The total silting volume was 1.4167 million m³/a, with an average silting intensity of 0.12 m/a. From 2022 to 2023, the scouring and silting trends once again presented a segmented pattern. Sections from G41-R42 to G19-R20 and G11-R12 to G3-R4 were predominantly silting, while other sections showed a scouring trend. Overall, the silting volume was 1.8959 million m³/a, with an average silting intensity of 0.25 m/a, while the scouring volume was 945,600 m³/a, with an average scouring intensity of 0.16 m/a.
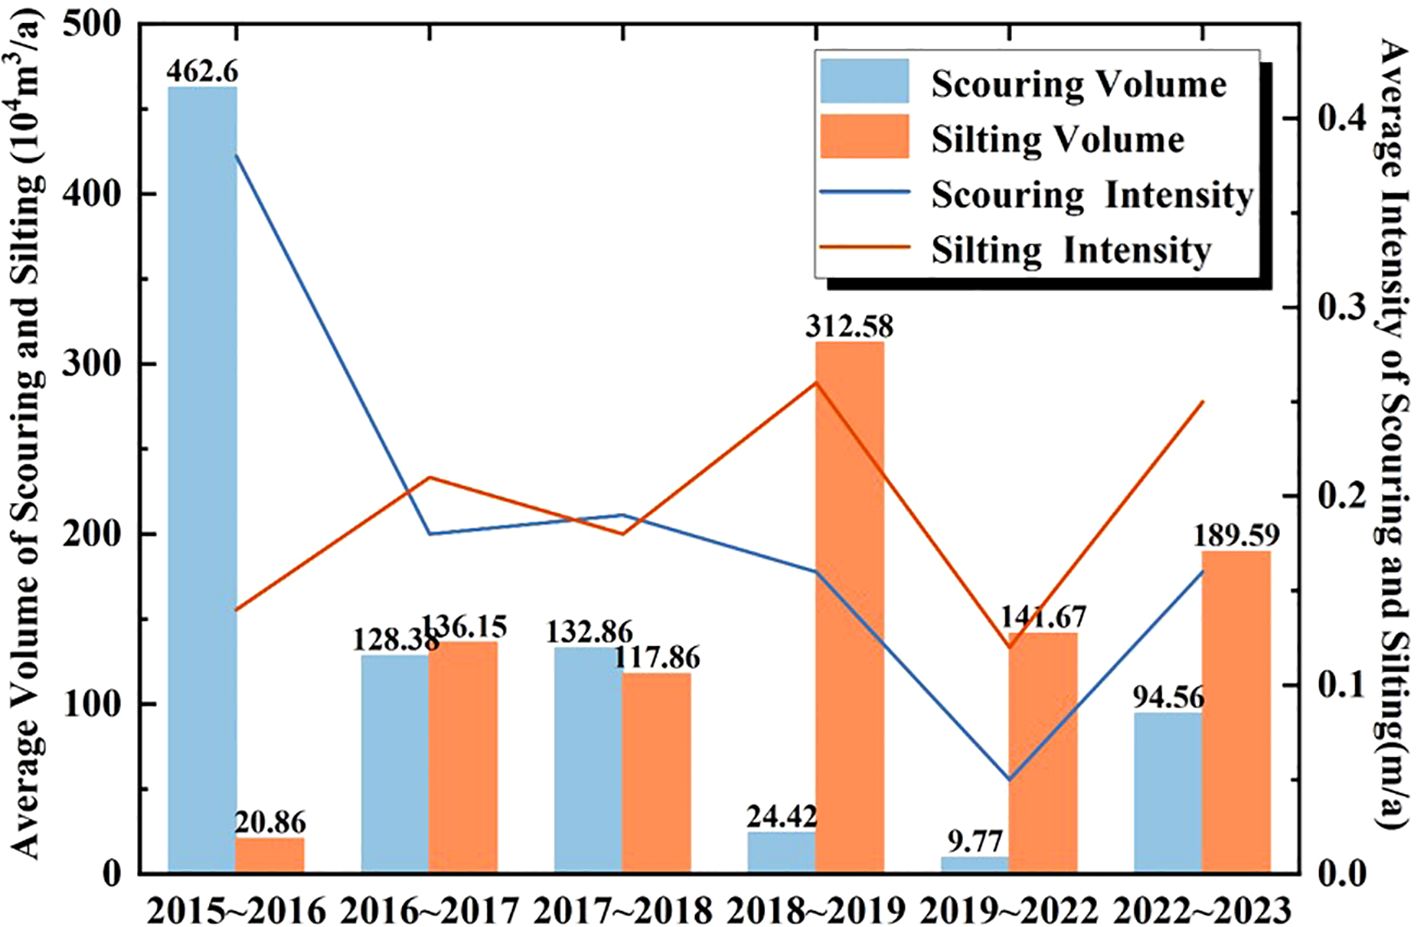
Figure 8. Average scouring and silting volume and thickness along the overall channel.
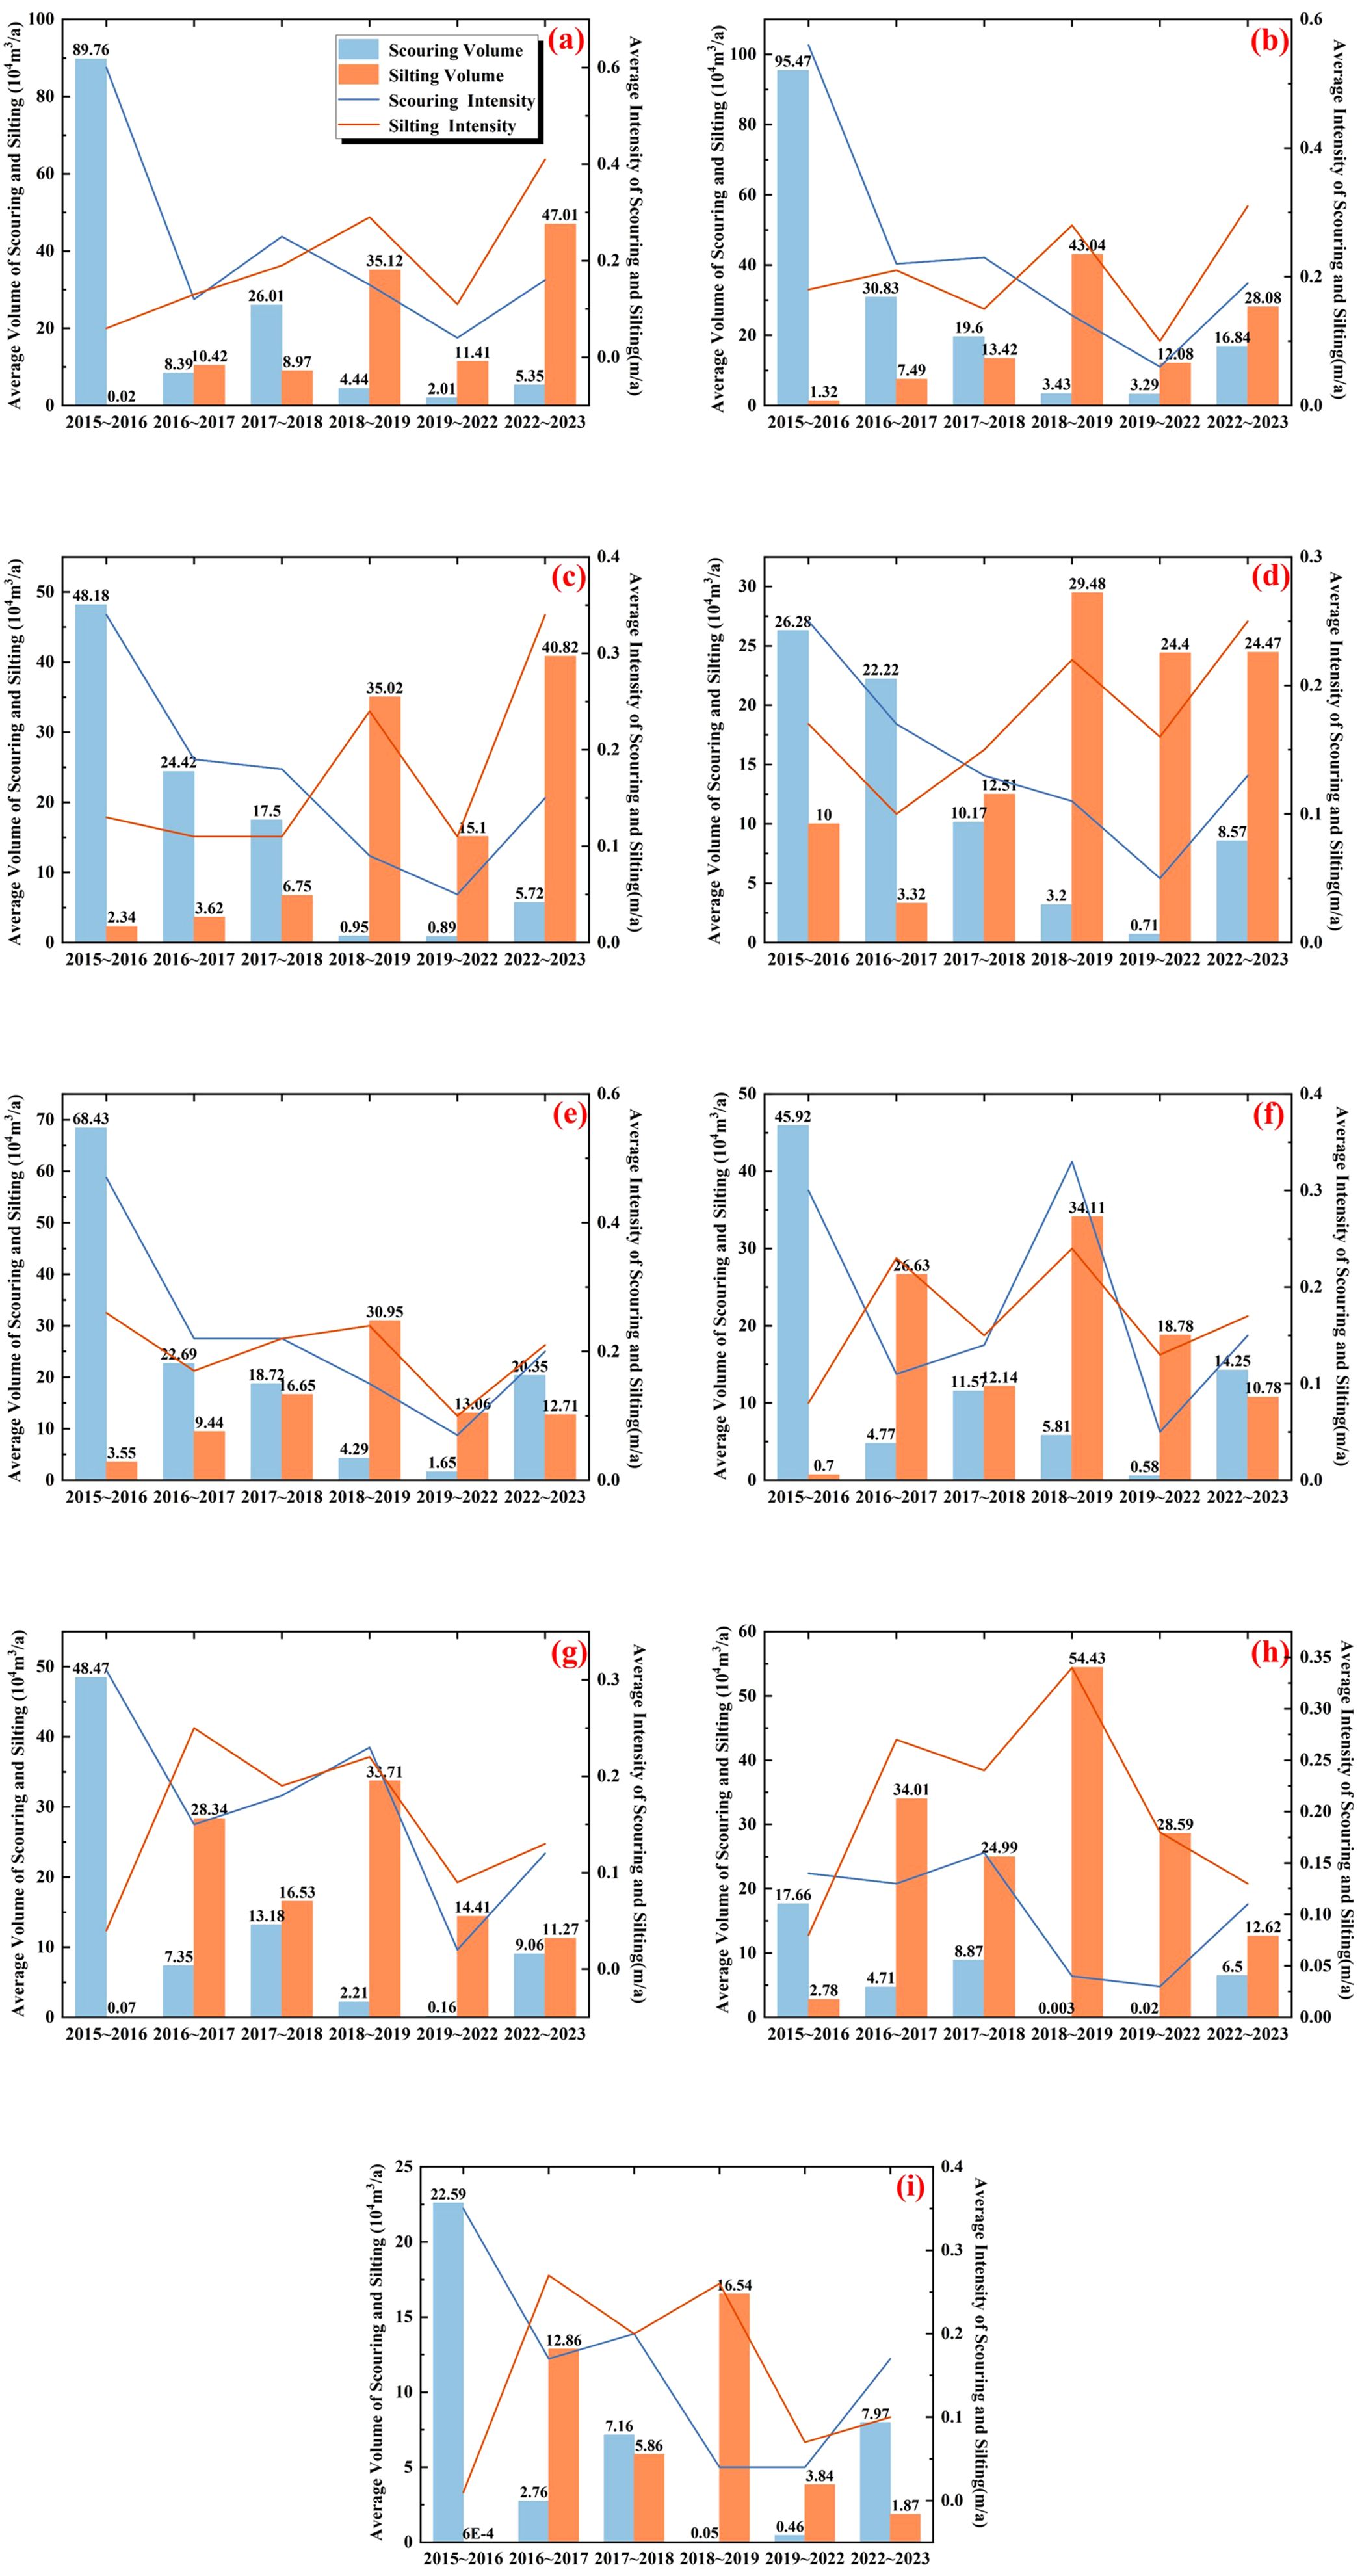
Figure 9. Average scouring and silting volume and thickness along different channel segments: G41-R42 to G37-R38 (a), G37-R38 to G31-R30 (b), G31-R30 to G23-R24 (c), G23-R24 to G19-R20 (d), G19-R20 to G15-R16 (e), G15-R16 to G11-R12 (f), G11-R12 to G7-R8 (g), G7-R8 to G3-R4 (h), beyond G3-R4 (i).
From the above data, it is evident that the scouring and silting patterns of the channel are influenced by a combination of factors including dredging activities, sediment resettling, natural topography, and hydrodynamic conditions. Scouring is primarily concentrated shortly after dredging activities, while silting gradually becomes the dominant trend, particularly with a significant increase in silting intensity following dredging. Furthermore, the uneven distribution of scouring and silting across different sections of the channel is closely related to local hydrodynamic conditions, sediment sources, and topographic features. Scouring is relatively stable in deep-water areas, while shallow-water areas are more prone to sediment accumulation, resulting in silting (Winterwerp et al., 2013).
Based on the overall channel evolution analysis in Section 4.1.1, the section of the channel from R26-G27 to G21-R22, which has the shallowest water depth and the most significant sediment accumulation, was selected as the focus of this study. During this study, Southeast Asia Crude Oil Pipeline Co., Ltd. (Oceania Branch) conducted depth measurements and dredging operations for the R26-G27 to G21-R22 section, based on the operational conditions of the channel. This section serves as the primary subject of analysis in this study, with the channel evolution patterns analyzed based on the results of eight measurements conducted between 2015 and 2024, as shown in Figure 10. The scouring and silting changes in the R26-G27 to G21-R22 section of the Made Island Port channel across different years are presented in Figure 11.
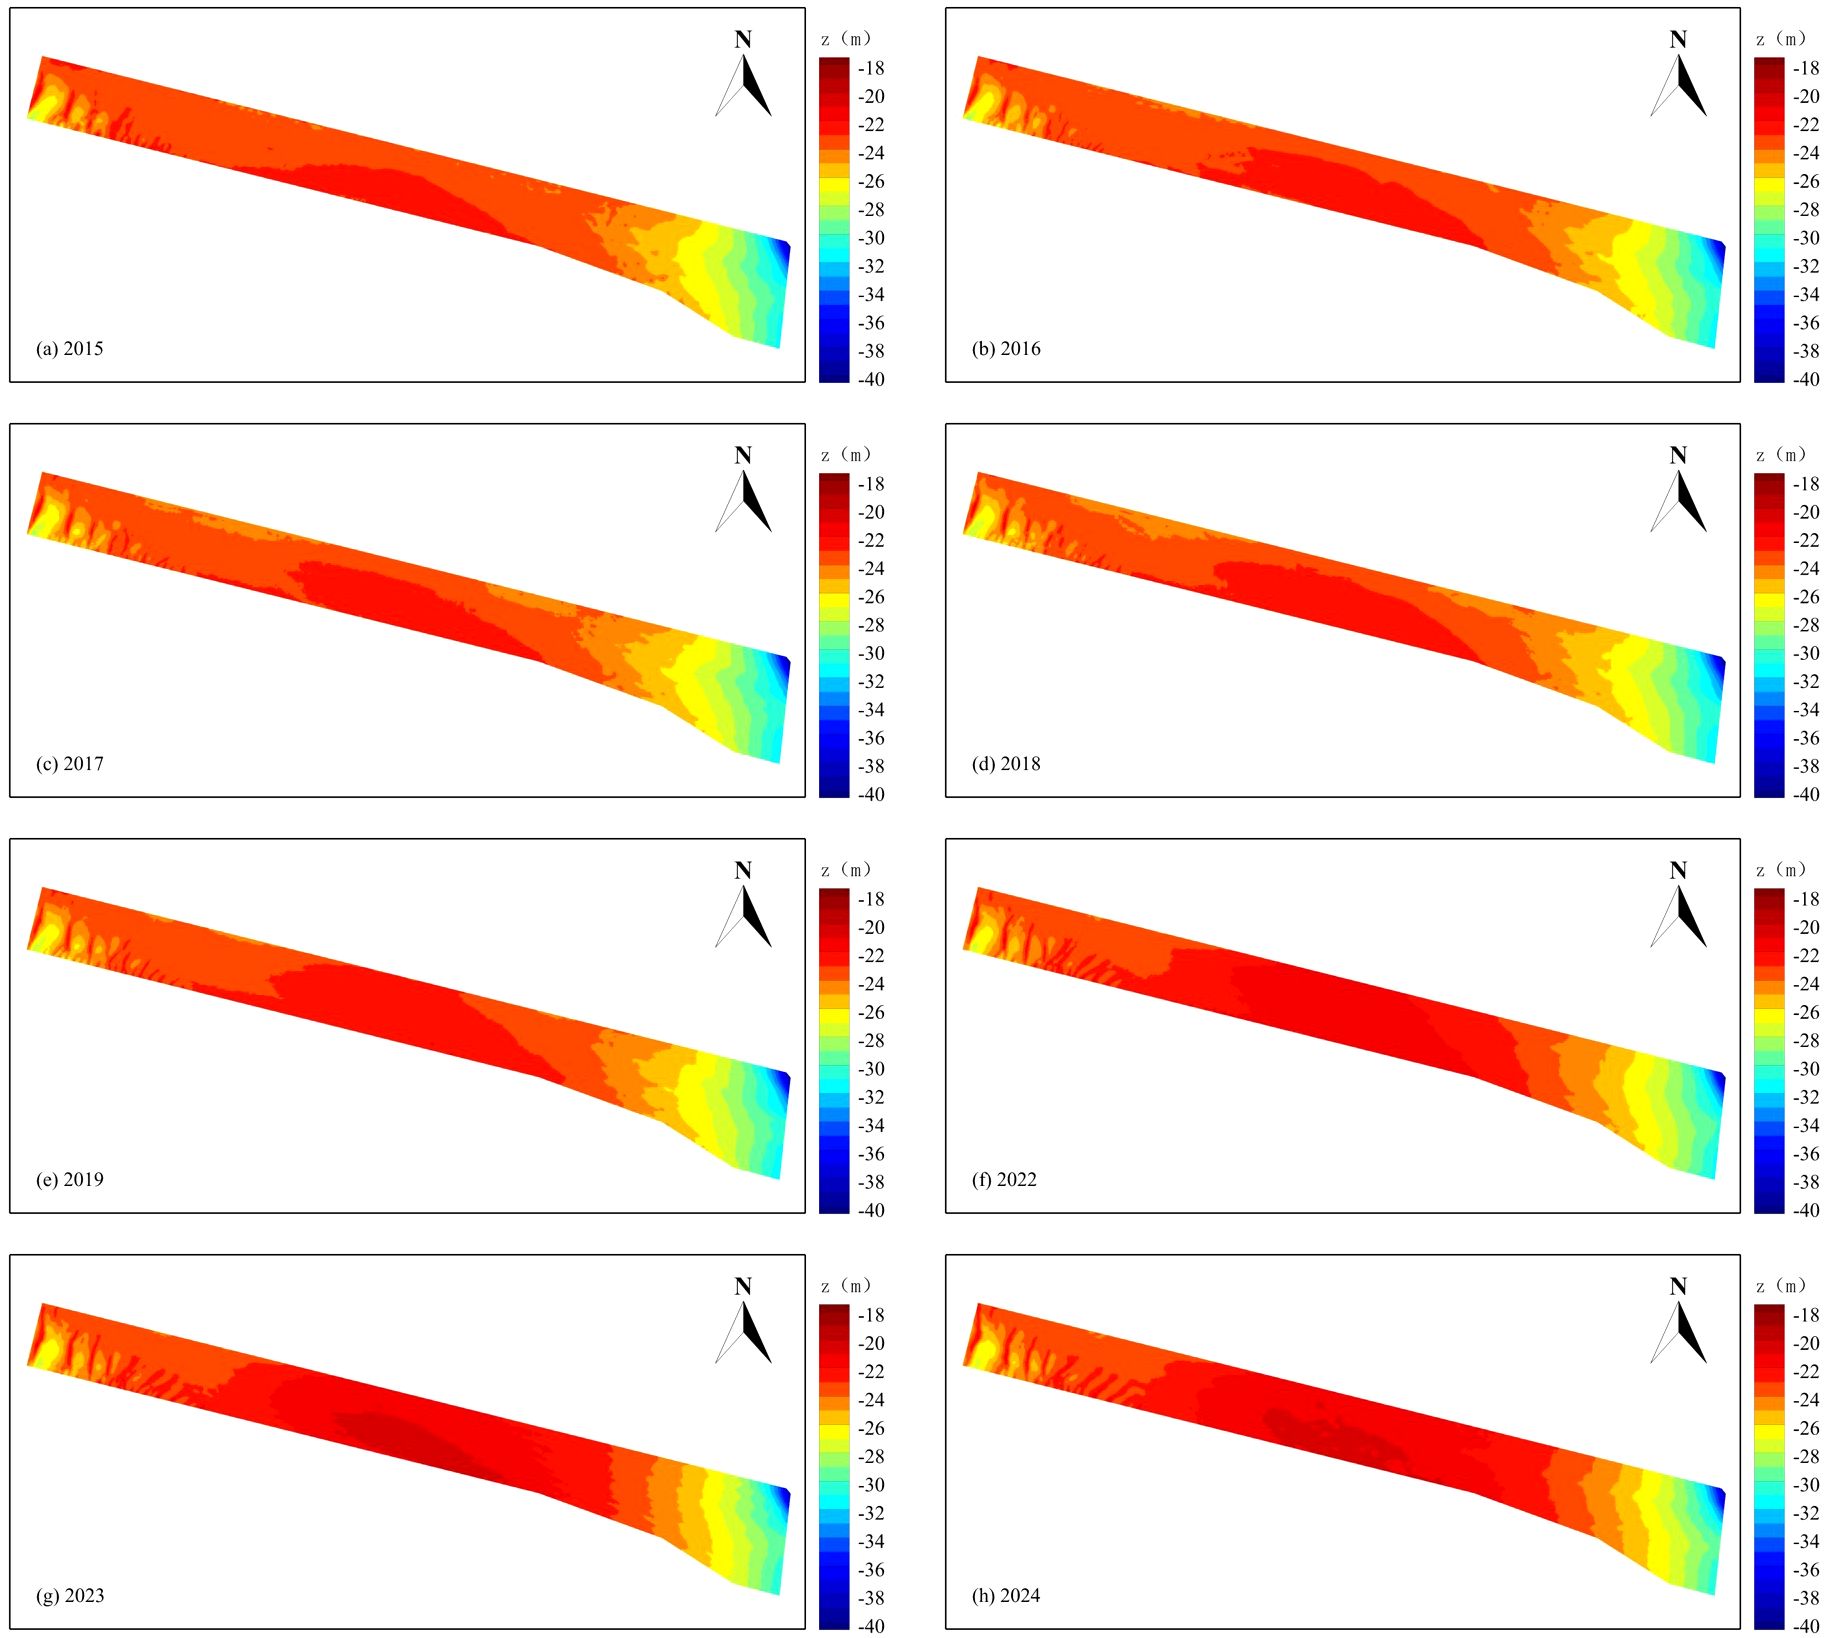
Figure 10. Bathymetric map of the Made Island port channel segment from R26-G27 to G21-R22, 2015–2024.
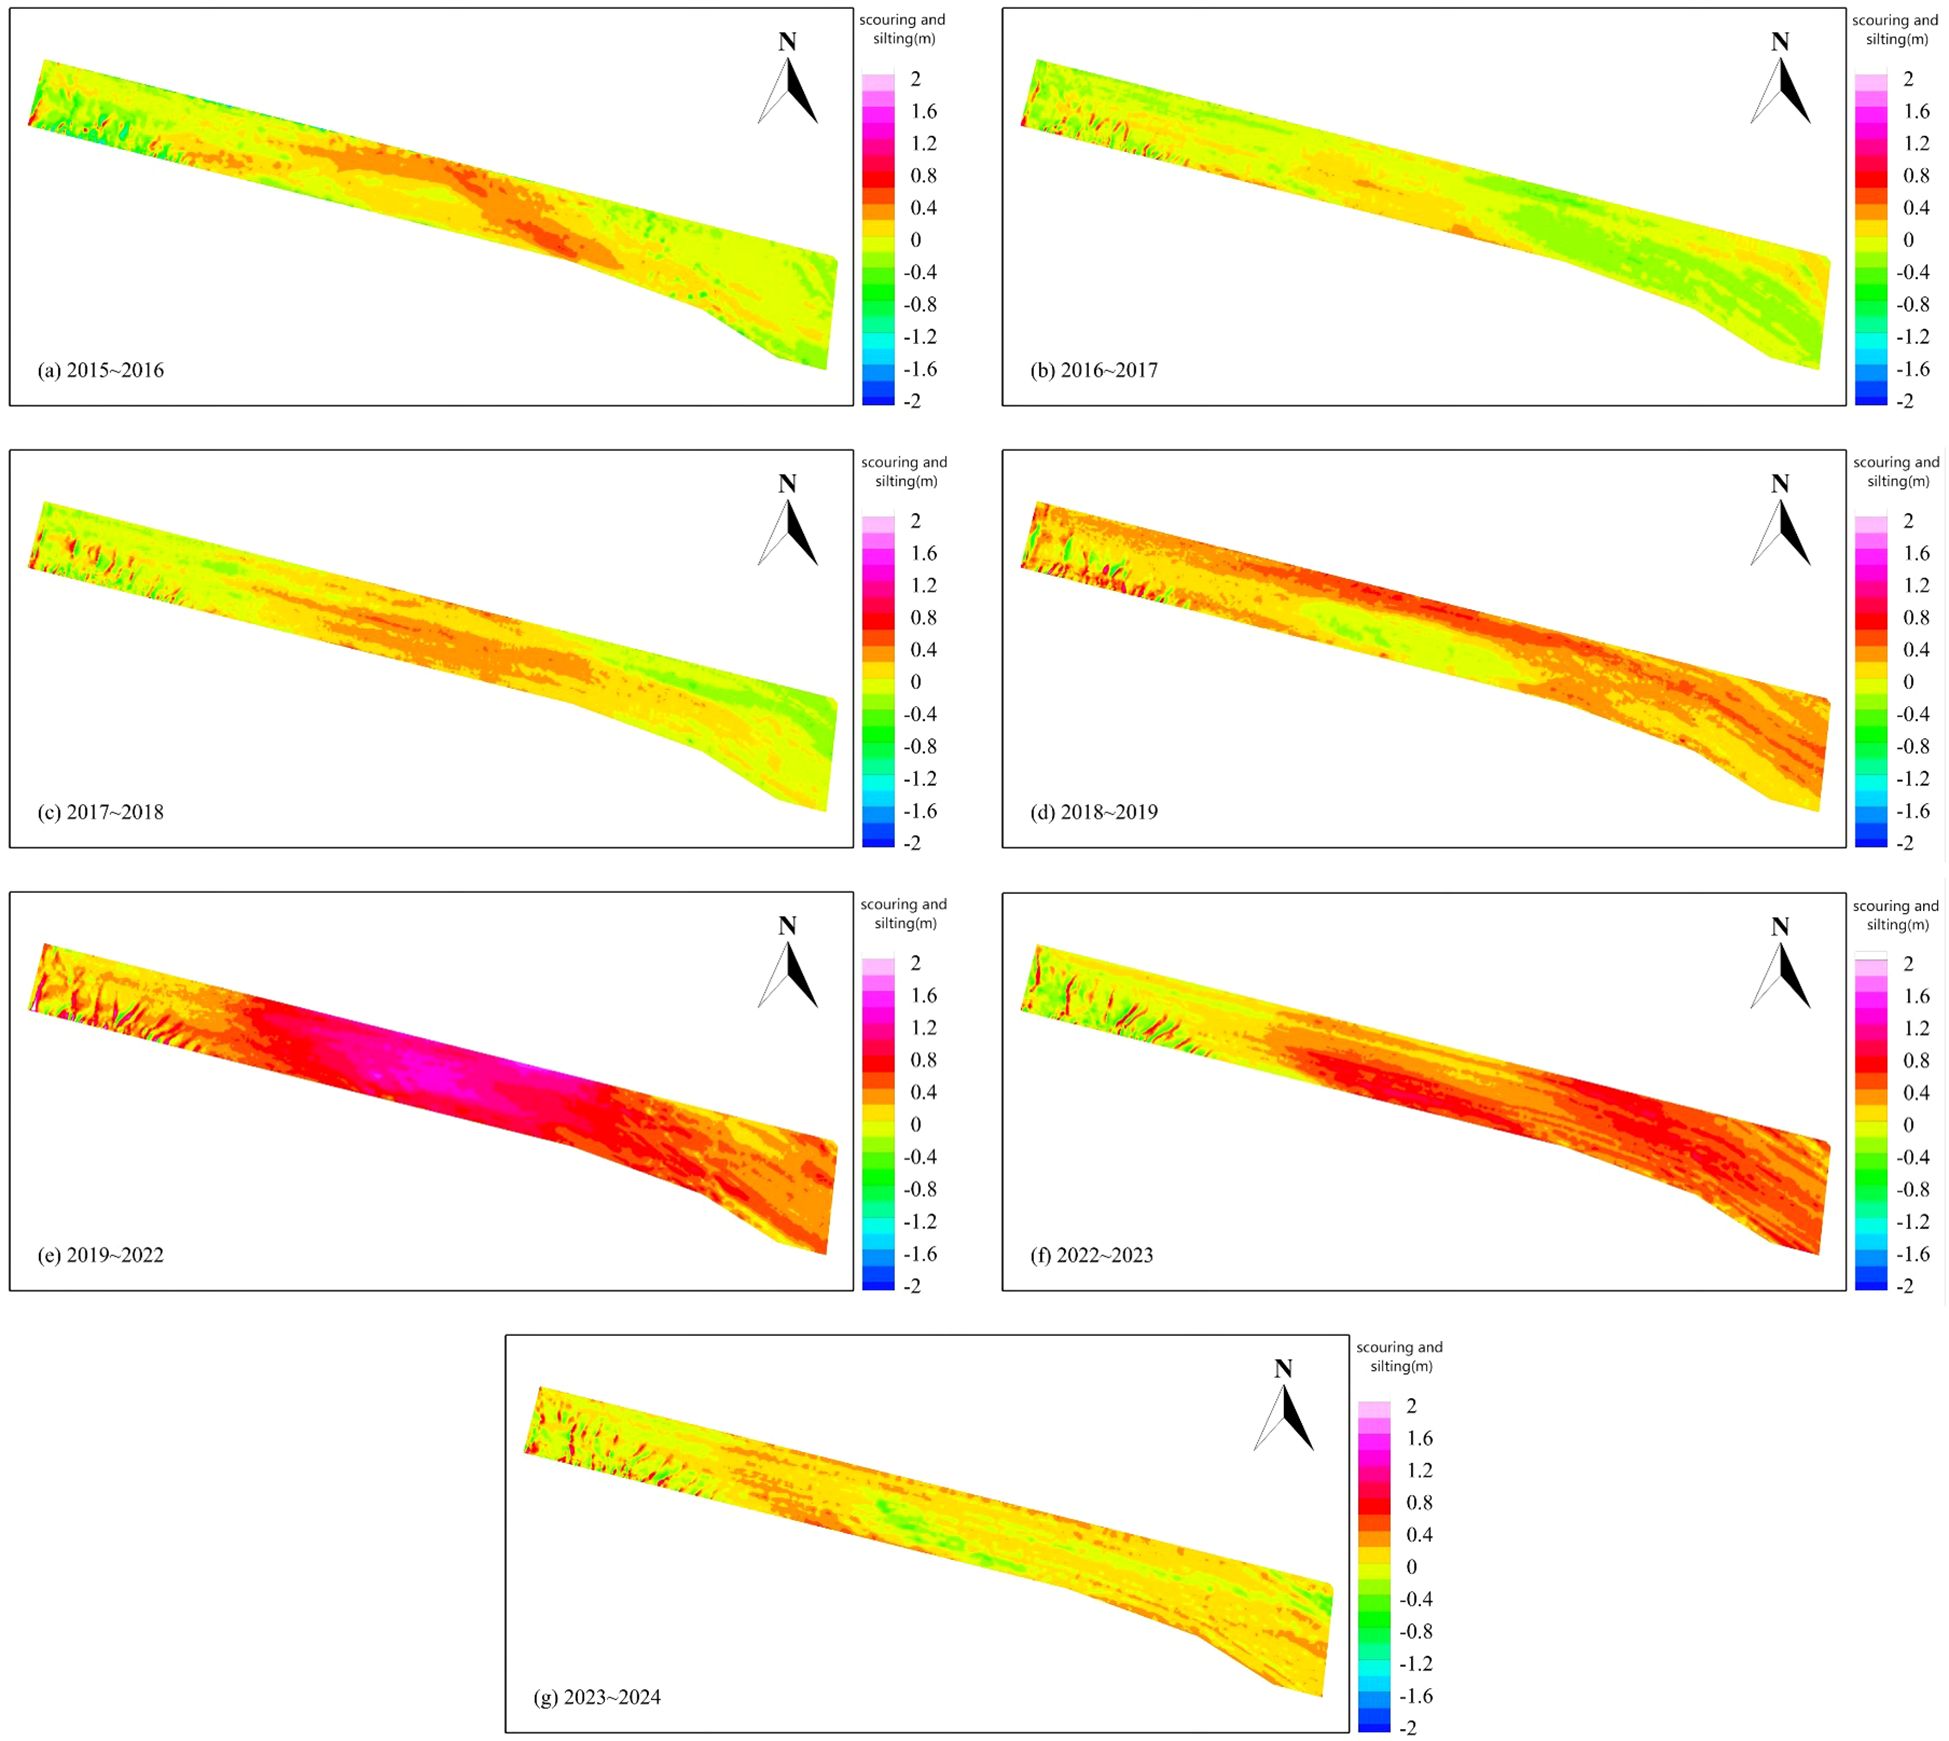
Figure 11. Scouring and silting distribution map of the Made Island port channel segment from R26-G27 to G21-R22, 2015–2024.
As shown in Figure 10, the R26-G27 to G21-R22 section of the Made Island Port channel is considered a shallow area. This is primarily due to the relatively shallow water depth in the region, with significant fluctuations in the channel bottom elevation, making it susceptible to sediment accumulation. According to Figure 10, in certain years (such as 2023 and 2024), the bottom elevation of this section exceeds −21.5 m, which is above the dredging standard for the channel (−22.8 m), thus posing a threat to navigation capacity. Shallow areas are a critical bottleneck for the channel, especially in ports affected by tides, where sediment tends to accumulate in these shallow zones, increasing the risk of ships running aground or bottoming out. For heavily loaded vessels or ships with deep drafts, shallow areas can restrict the navigability of the channel, even affecting the overall logistics efficiency of the port.
As shown in Figure 11, from 2015 to 2018, the R26-G27 to G21-R22 section of the channel exhibited a pattern of sediment accumulation in the center and scouring at both ends, with the maximum sediment accumulation intensity exceeding 0.5 m/a. This indicates that the central part of the channel was significantly affected by sediment deposition, while the higher flow velocities at the ends resulted in scouring. In 2018–2019, the channel showed a shift to localized scouring in the central area and sediment accumulation on both sides. The dredging activity in April 2018 altered the hydrodynamic conditions, causing scouring in the middle section and sediment accumulation at the sides. This could be attributed to the redistribution of sediment caused by the increased flow velocity post-dredging. Between 2019 and 2022, the channel overall experienced a trend of sediment accumulation, with both the center and the sides accumulating sediment, and the maximum sediment thickness reaching approximately 1.3 m. This accumulation may have been influenced by increased sediment supply from upstream or sediment resettling after dredging. In 2022–2023, sediment accumulation continued, but at a slower pace, with the maximum accumulation thickness remaining above 0.6 m. In 2023–2024, the channel exhibited an alternating pattern of scouring and sedimentation. Emergency dredging in 2023 cleared some of the shallower areas, leading to noticeable scouring in the central and localized regions, while sediment accumulation persisted at the ends and certain areas. This alternating pattern of scouring and sedimentation is a typical characteristic of post-dredging adjustments in the flow field.
Further, the key section’s topographic data measured in 2024 was plotted on the topographic scouring and silting distribution map, as shown in Figure 12. It can be observed that this section continued the overall sediment accumulation trend from previous years during 2023–2024. The localized scouring shown in Figure 13 may be related to the emergency dredging carried out in 2023.
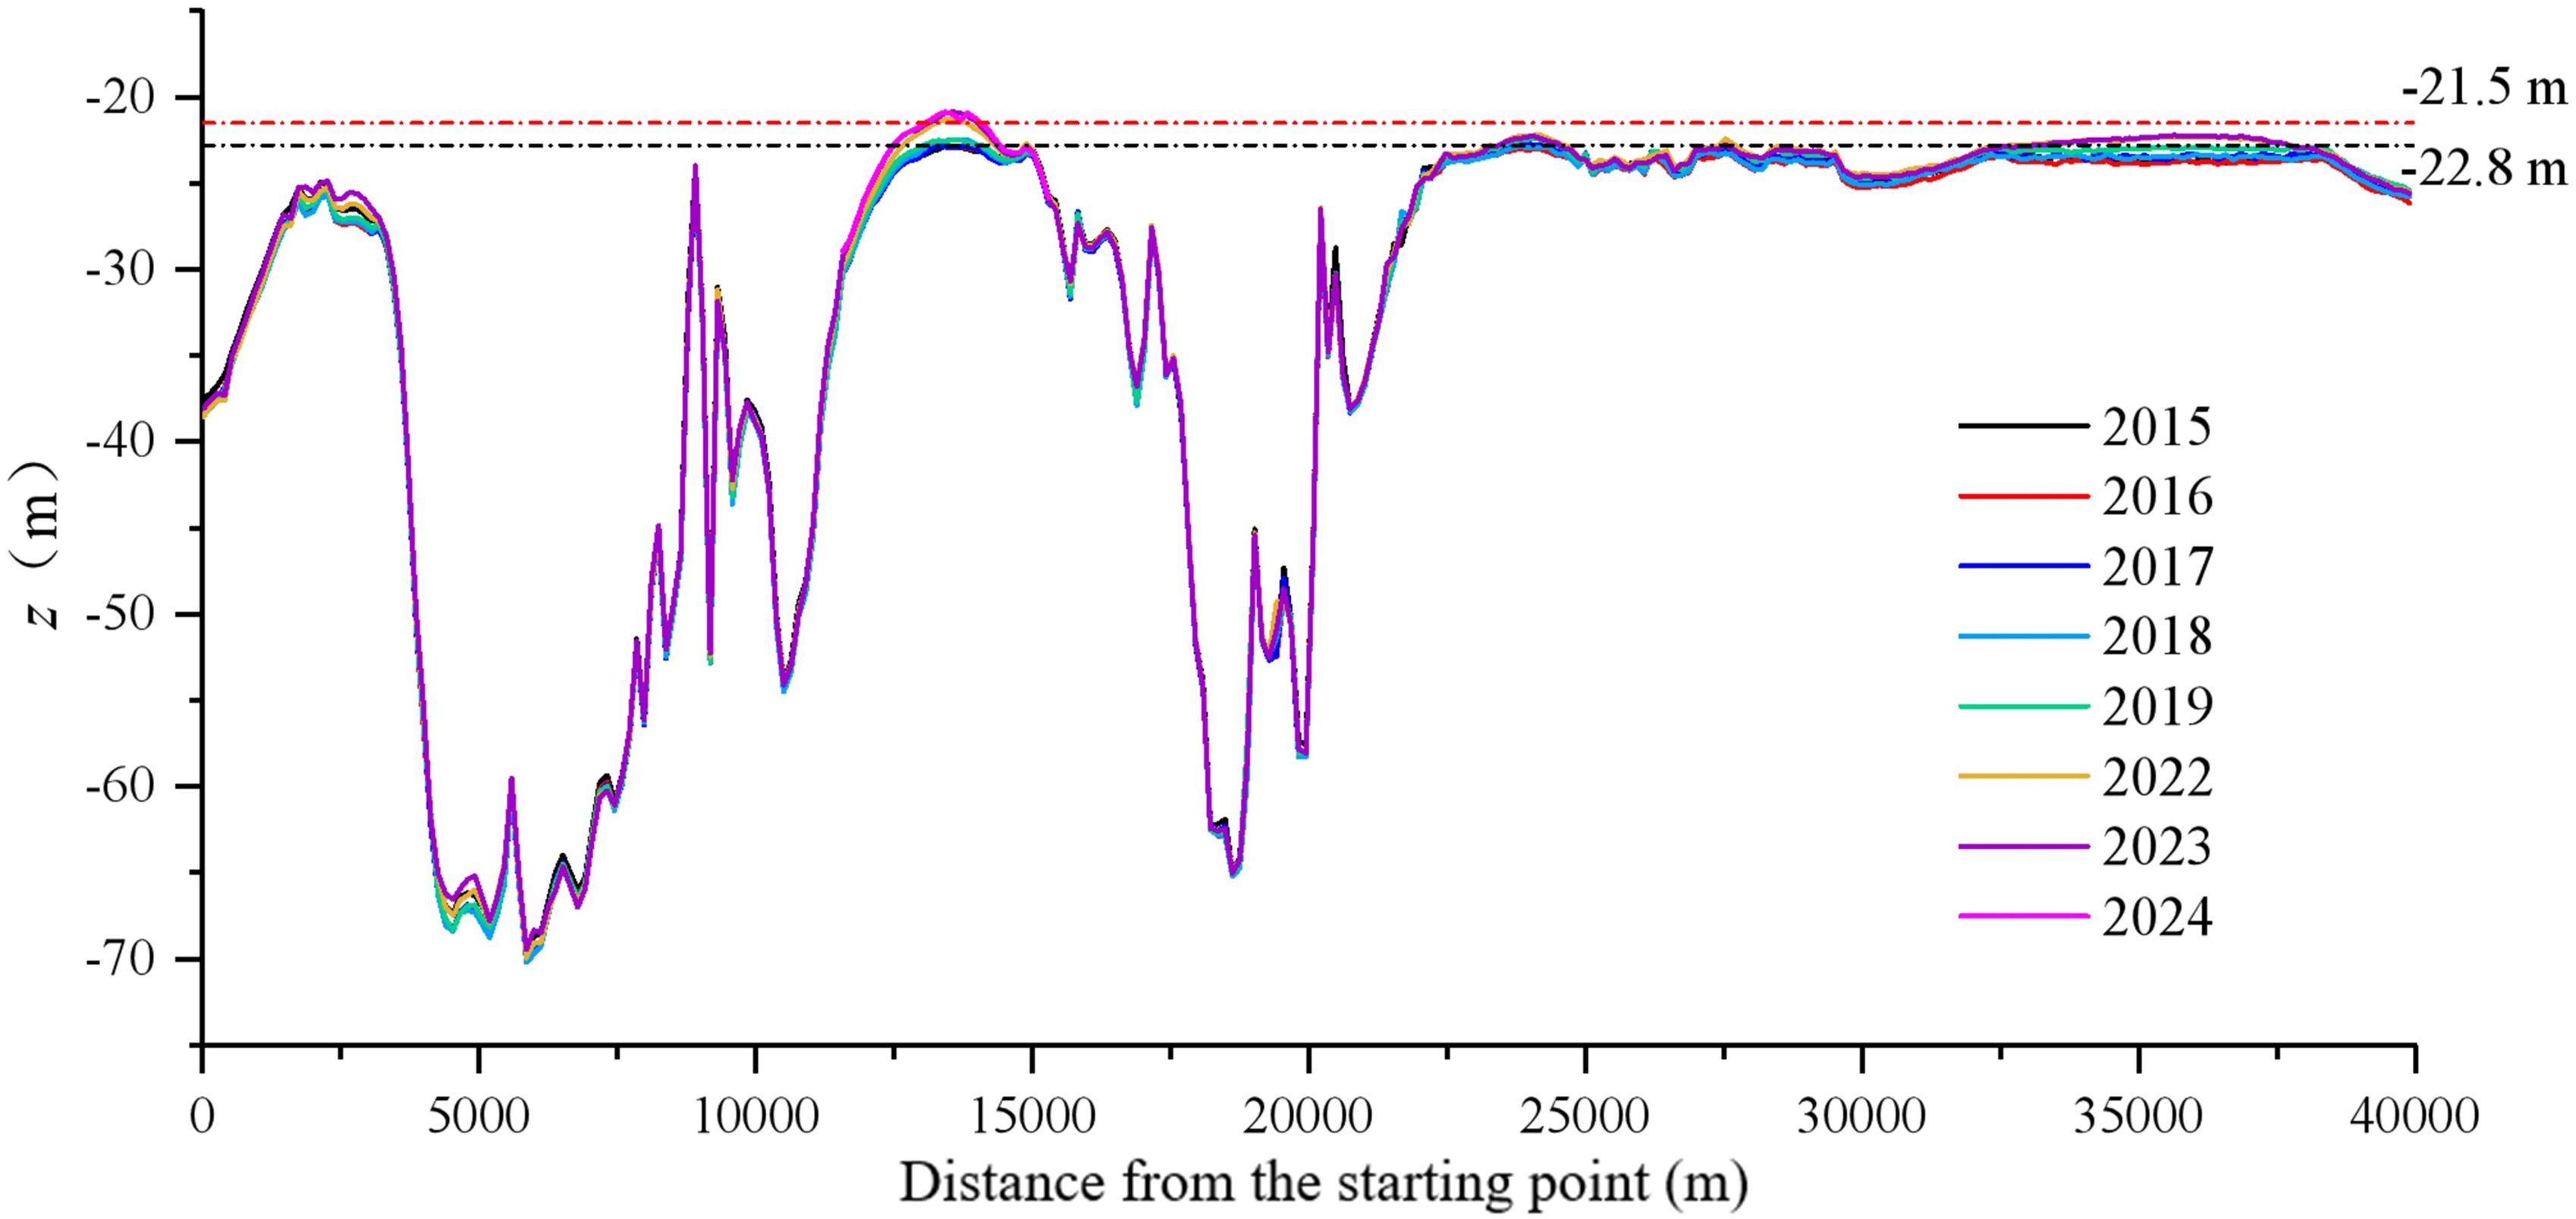
Figure 12. Distribution of bottom elevation along the Made Island port channel from 2005 to 2024.
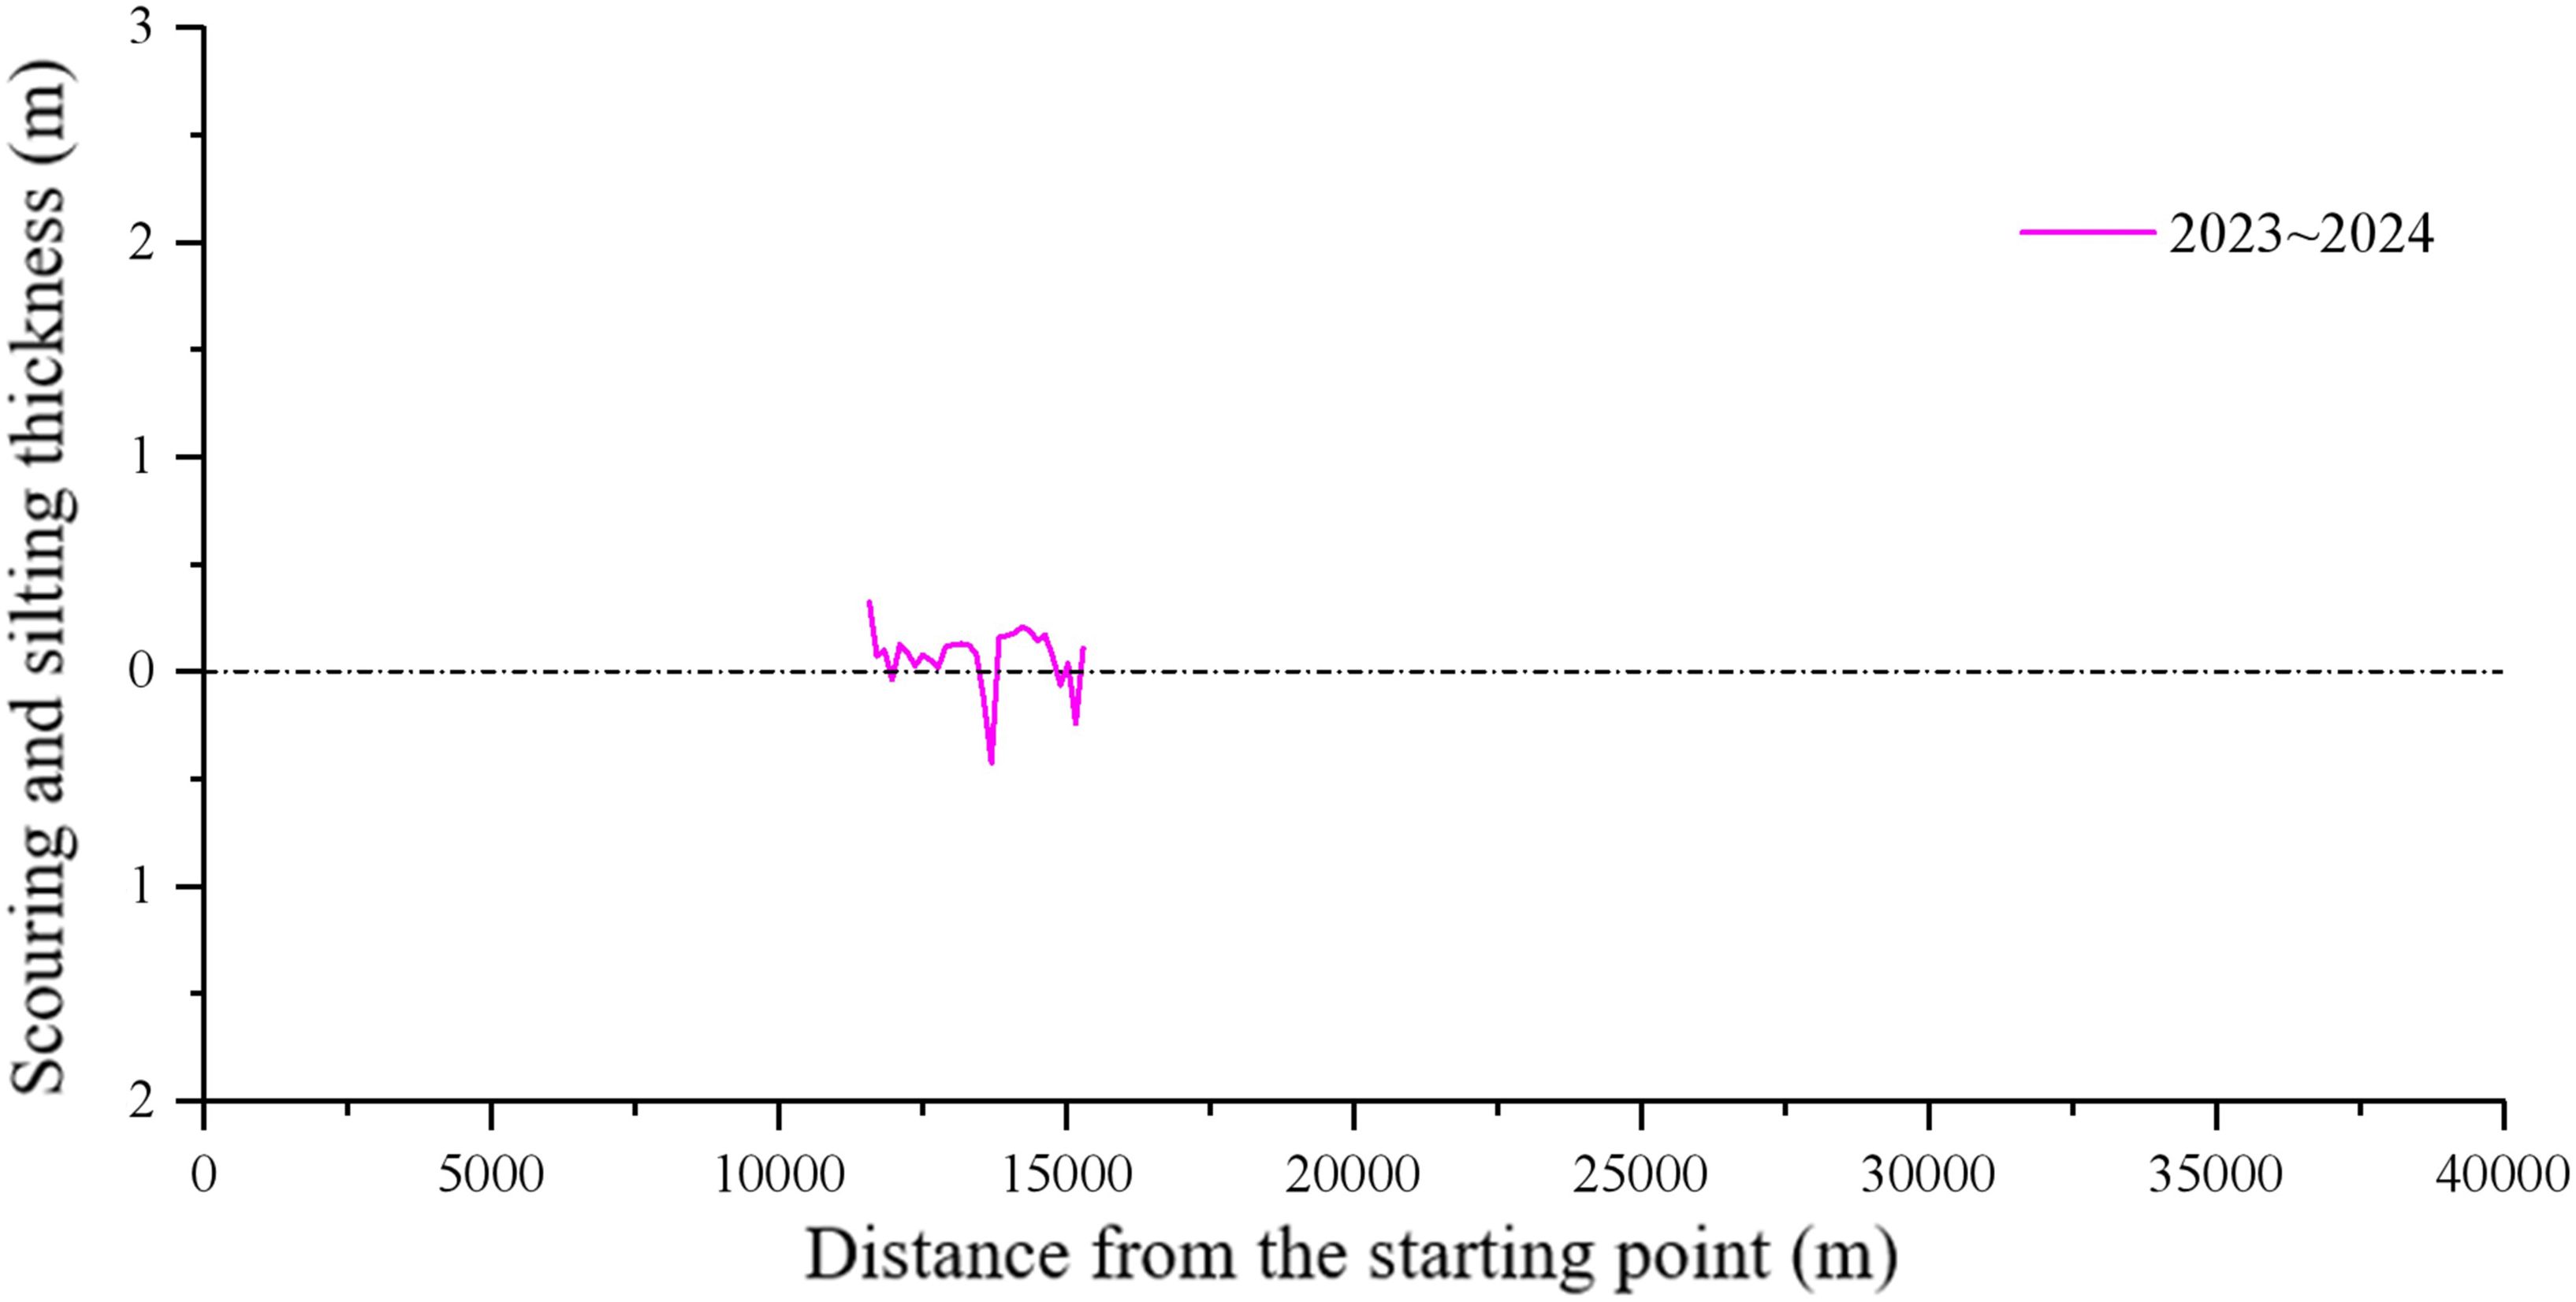
Figure 13. Scouring and silting distribution along the Made Island port channel from 2023 to 2024.
To quantify the scouring and silting conditions of the R26-G27 to G21-R22 channel section in different years, the average scouring and silting volume and intensity for each year were calculated, as shown in Figure 14. During 2015–2016 and 2016–2017, the channel section predominantly experienced scouring over silting, with scouring volumes of 120,600 m³/a and 172,100 m³/a, and scouring intensities of 0.16 m/a and 0.17 m/a, respectively. After 2017, as sediment transport gradually resumed and the impact of dredging on hydrodynamics weakened, combined with the reduced flow velocity in the central area, sediment deposition increased, leading to silting becoming the dominant feature. The most significant silting occurred in 2022–2023, with a silting volume of 455,600 m³/a and an average silting intensity of 0.40 m/a.

Figure 14. Average scouring and silting volume and intensity.
As shown in Figure 11, in certain years, the central section of the R26-G27 to G21-R22 channel exhibits a maximum silting depth of over 0.5 m. Combining the analysis of channel topography and scouring/silting conditions, the sediment supply from upstream is a key factor influencing silting. The tidal effects and seasonal rainfall increase sediment transport, while the low flow velocity in the central region makes it a typical sediment deposition area, resulting in significant silting. Additionally, the intensification of silting may be related to the sediment re-deposition effect following dredging activities in 2018 and 2023. After dredging, the seabed structure becomes loose, making it easier for sediment to accumulate during the return flow. Compared to deeper areas, shallow zones are more sensitive to changes in flow velocity, and often exhibit rapid local silting recovery after dredging.
Based on the 7 sets of bathymetric survey data of Made Island Port from 2015 to 2023, the scouring and silting changes in the port basin over the years were analyzed. Figure 15 shows the bathymetric maps of the port basin for each year, and Figure 16 illustrates the scouring and silting changes between the years. As seen in Figure 15, the bathymetry of the Made Island Port basin has a water depth of over 35 meters in most areas, which meets the requirements for ship docking, undocking, and operation. However, there are some localized shallower areas in the port basin. Two shallow points are located to the west of the central area, and two more are on the southern side. The shallowest water depth in these locations is less than 25 meters, which may limit the berthing of large vessels, increase the risk of grounding, and affect the port’s throughput capacity and operational efficiency, while also increasing maintenance and dredging costs. Regular monitoring of the shallow points and timely dredging is necessary to ensure navigational safety and port operational efficiency. Therefore, it is crucial to focus on monitoring the bathymetric changes in shallow water areas, take timely dredging measures, and ensure the port’s navigability and economic benefits.
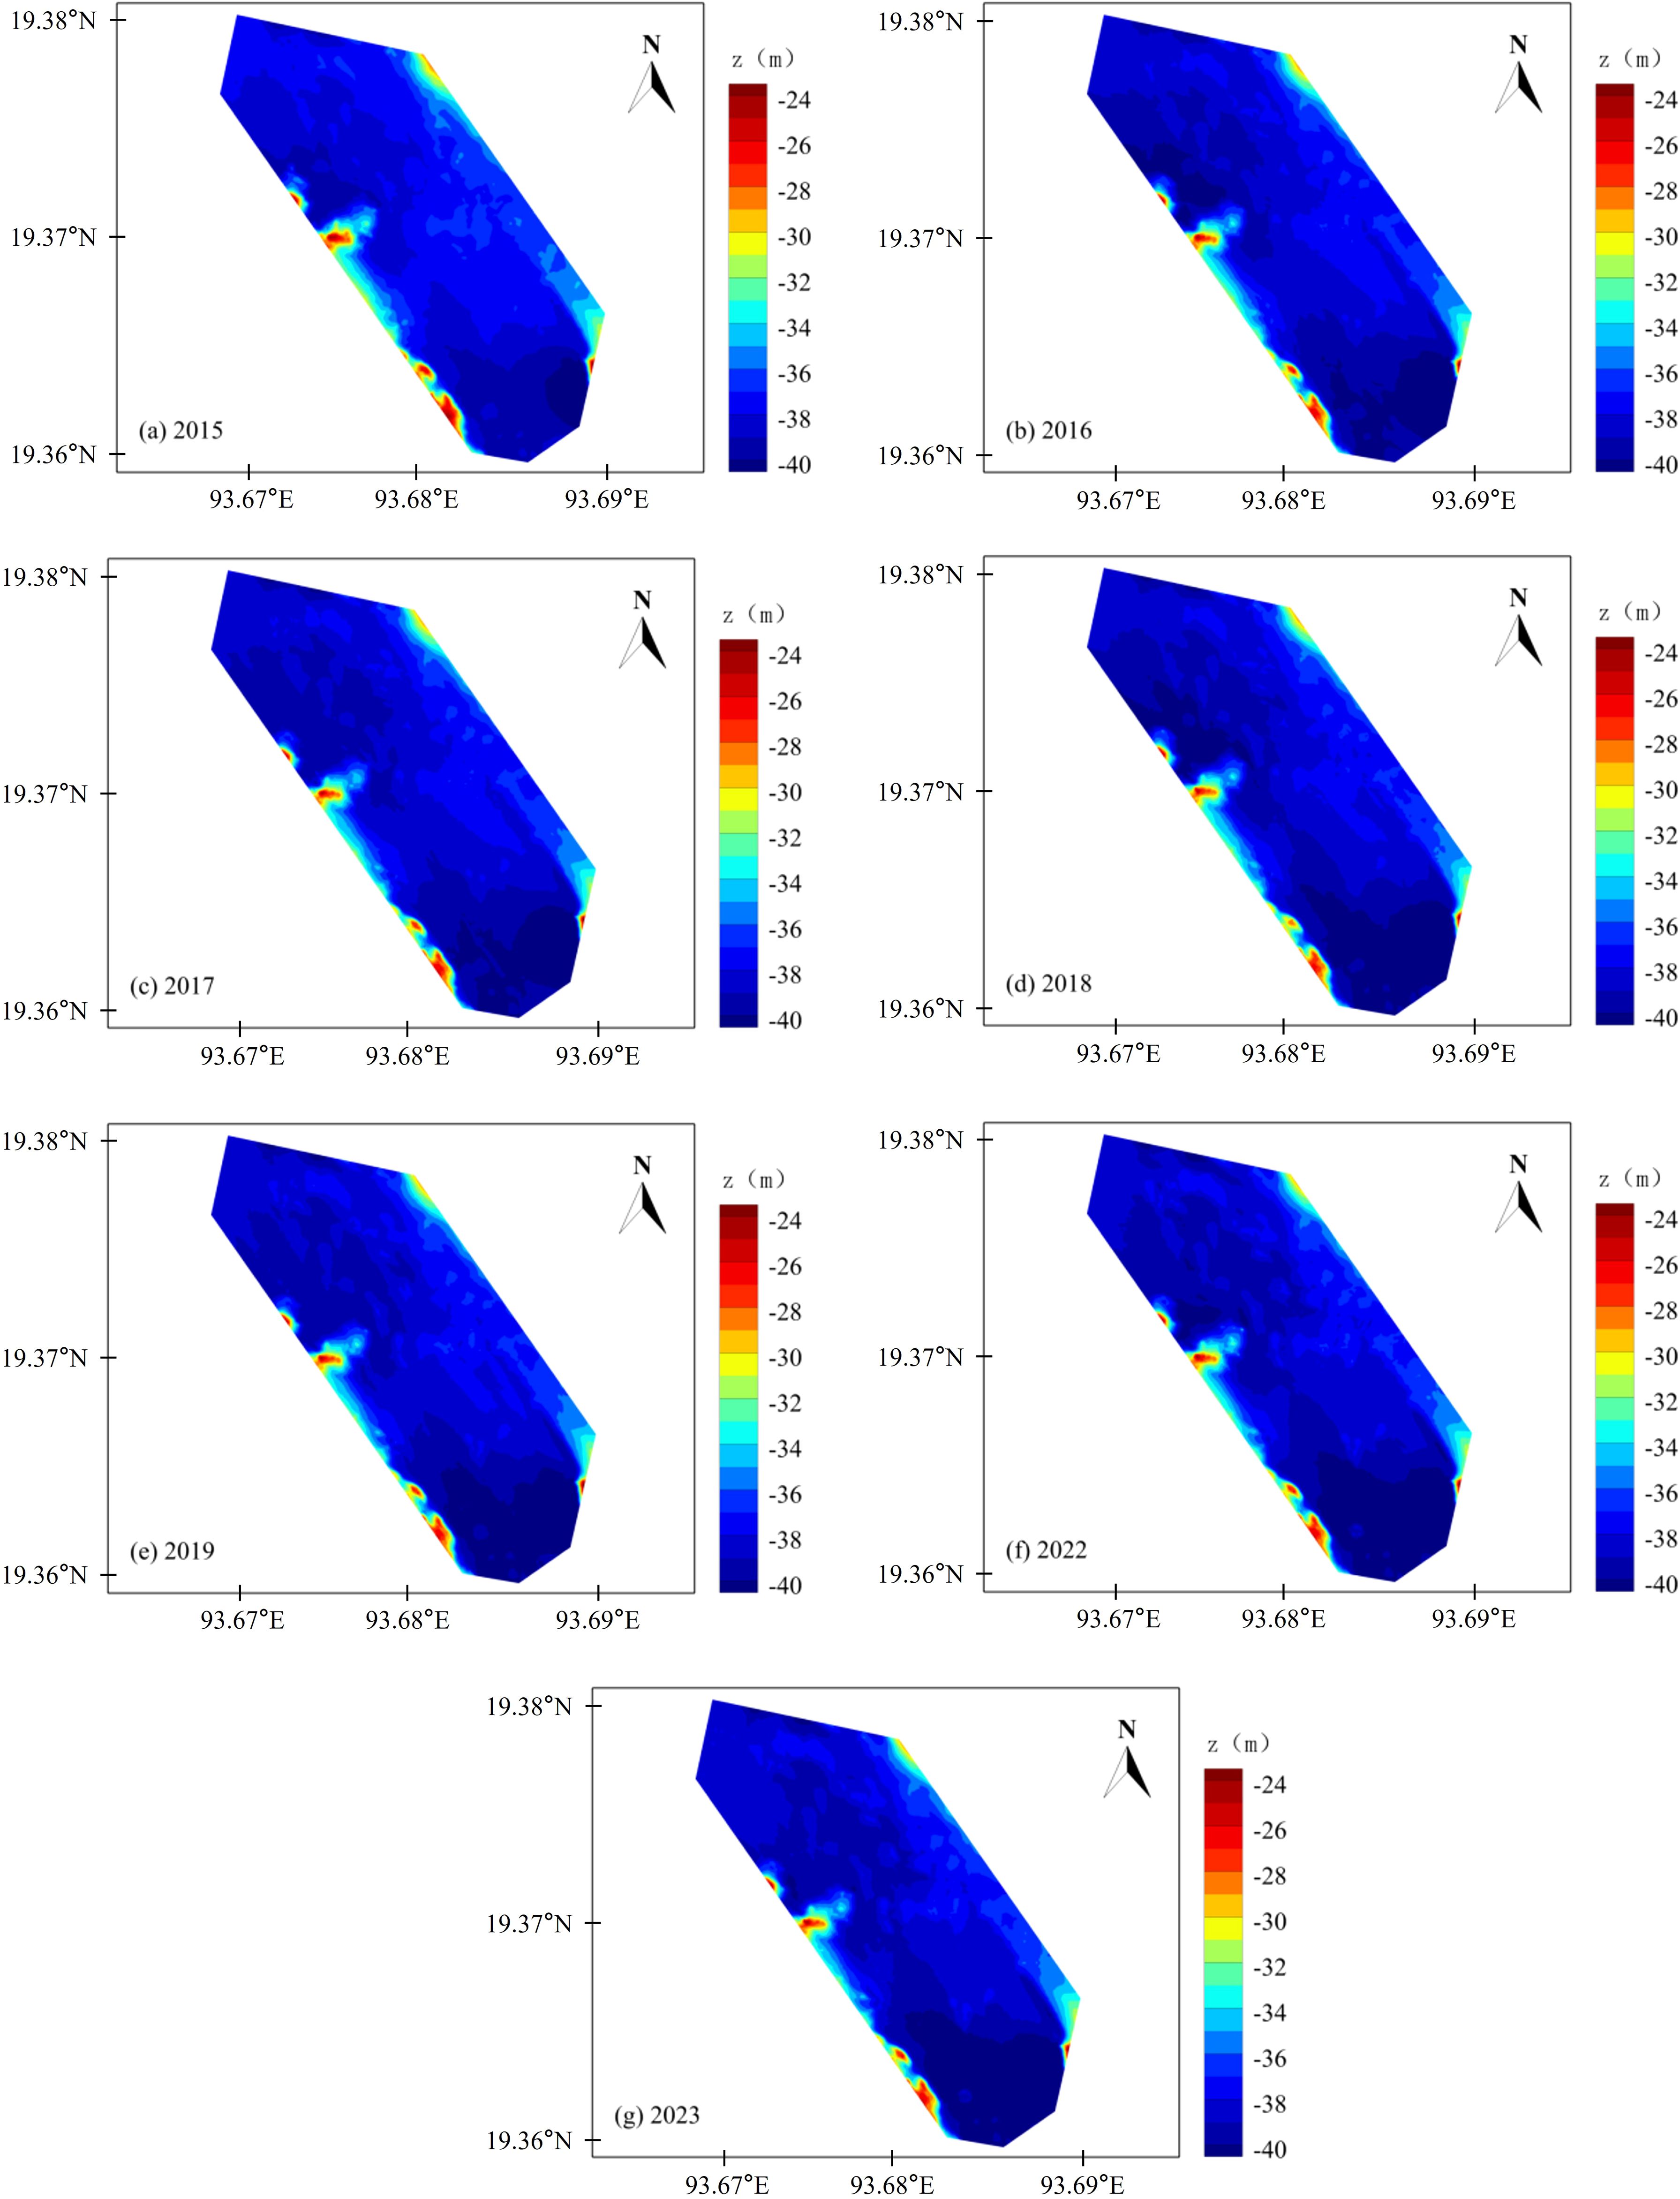
Figure 15. Bathymetric map of the Made Island Port Harbor from 2015 to 2023.
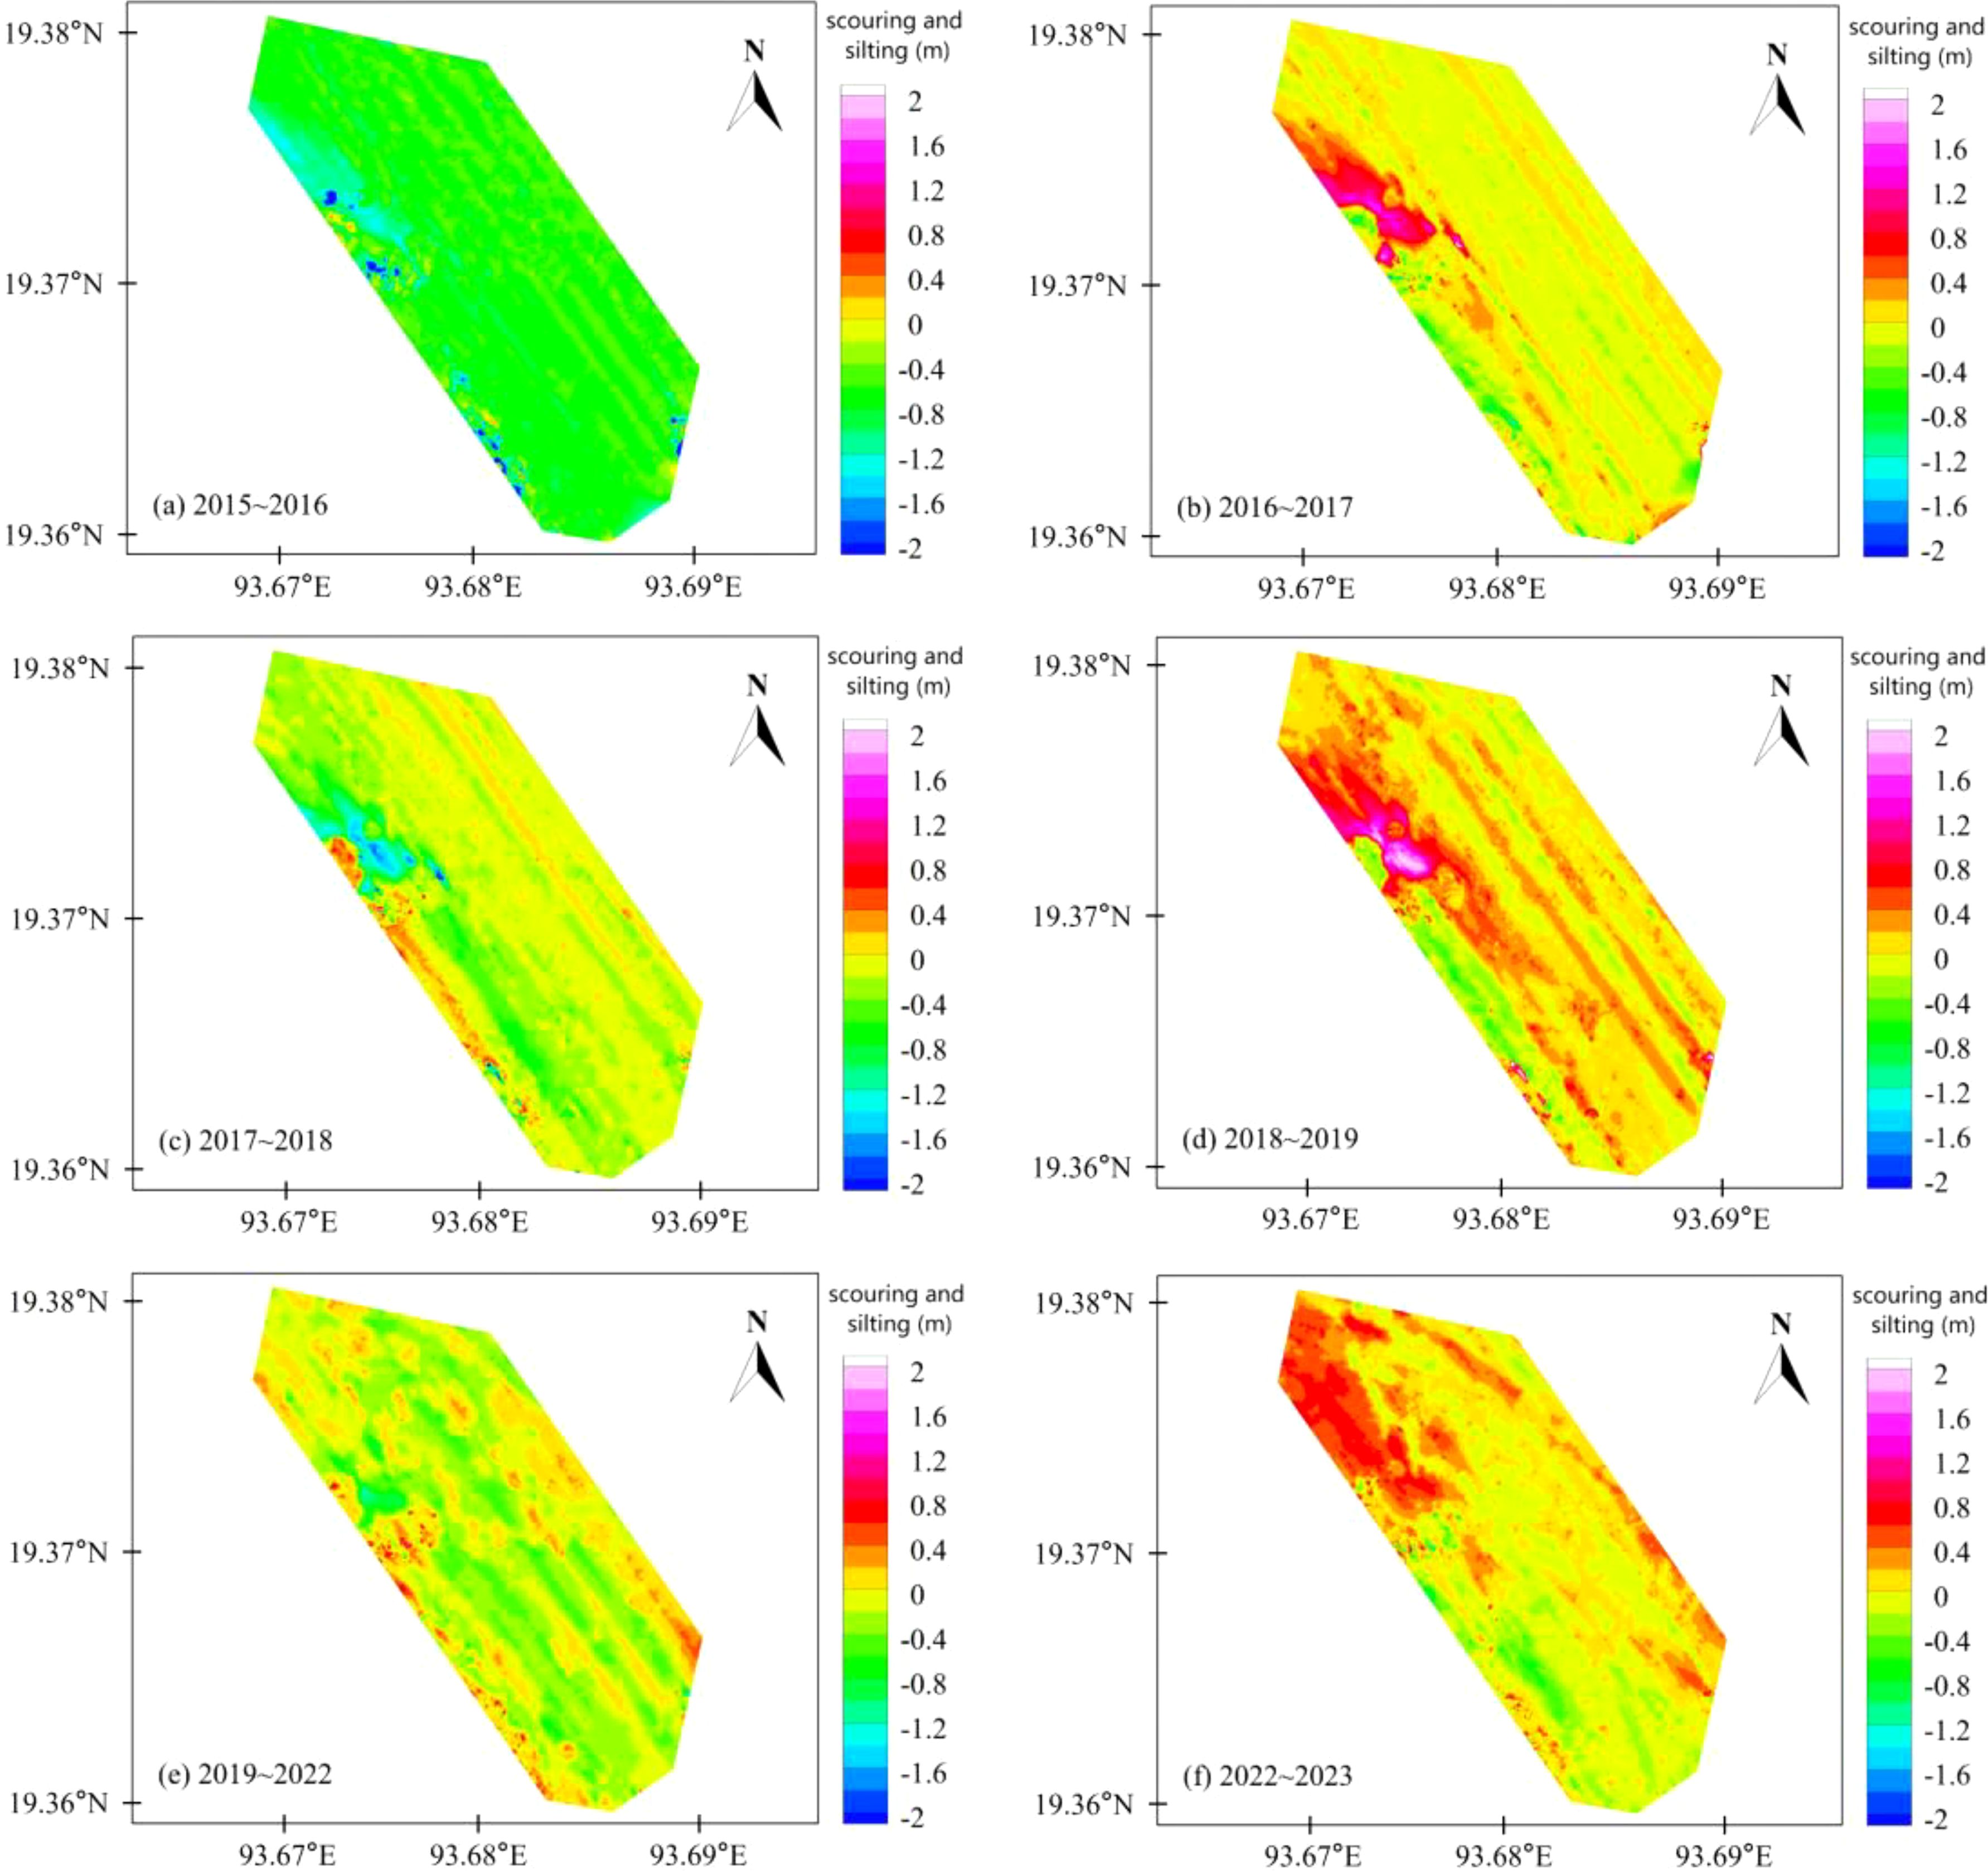
Figure 16. Scouring and silting distribution map of the Made Island Port Harbor from 2015 to 2023.
As shown in Figure 16, the harbor basin of Made Island Port exhibits complex scouring and silting characteristics over different years. From 2015 to 2016, the basin experienced overall scouring, with localized scouring points exceeding 3 meters, likely caused by human dredging activities that altered the hydrodynamic conditions, increasing flow velocity and causing sediment to be washed away and transported to other areas. From 2016 to 2017, most of the basin showed alternating scouring and silting, indicating complex hydrodynamic conditions. A large area of silting occurred in the northwest, with the maximum silting thickness exceeding 1.2 meters, possibly due to reduced flow velocity and sediment accumulation. From 2017 to 2018, the basin was primarily scoured, with silting occurring near the dock’s edge and shoreline. This may be closely related to the weakening of hydrodynamics and sediment deposition caused by tidal influences. Some areas had silting thicknesses greater than 0.3 meters. From 2018 to 2019, the basin was mainly in a silting state, particularly in the central and northwest areas where localized silting reached a maximum of nearly 2.0 meters. This suggests that sediment accumulated in low-velocity zones, and the silting situation was further aggravated by post-dredging sediment redeposition in 2018. From 2019 to 2022, most areas of the basin showed alternating scouring and silting, with relatively small scouring and silting extents. From 2022 to 2023, there was significant silting in the northwest, with the maximum silting thickness exceeding 0.7 meters. The southern part of the basin was predominantly scoured, with the maximum scouring thickness also exceeding 0.6 meters.
To quantify the scouring and silting conditions of the harbor basin over different years, this study calculated the average net scouring and silting volume and scouring-silting intensity for each year, as shown in Figure 17. A positive scouring-silting volume indicates silting, while a negative value indicates scouring. The net scouring-silting intensity follows the same principle.
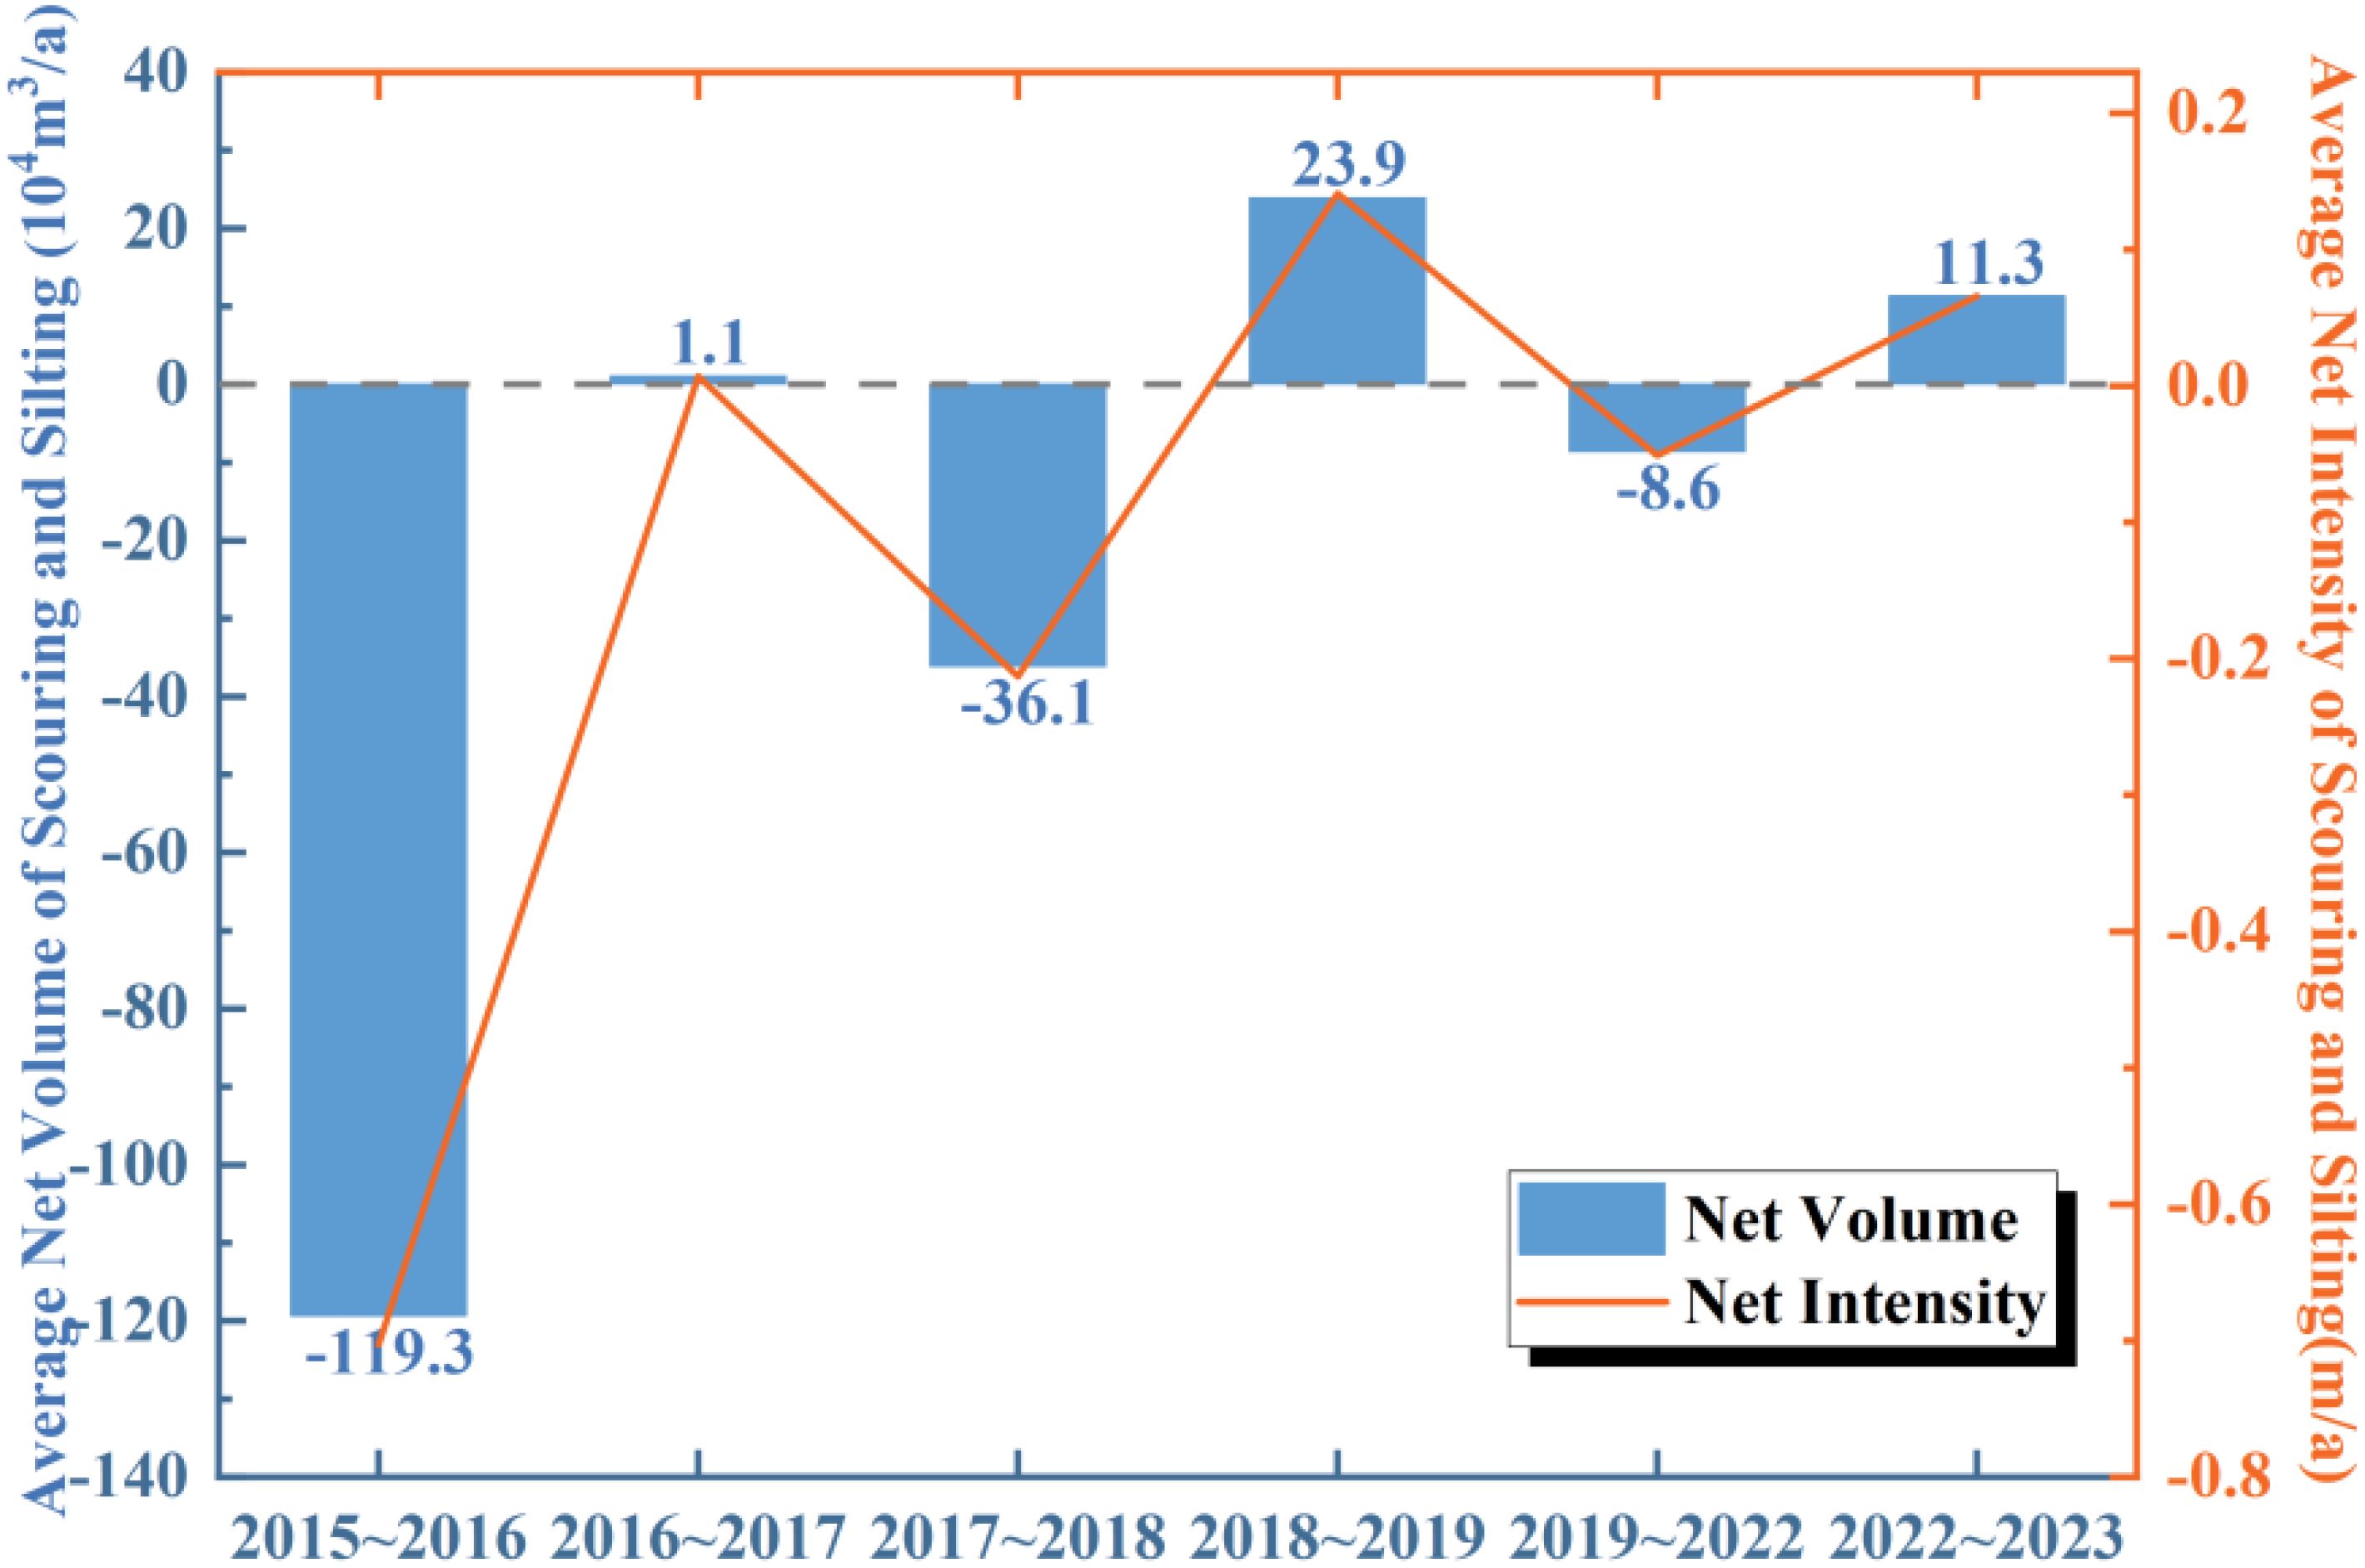
Figure 17. Average net scouring and silting in the Harbor.
As shown in Figure 17, from 2015 to 2016, the scouring trend was significant, with a net scouring volume of 1.193 million cubic meters per year and a scouring intensity of 0.703 meters per year. This was mainly due to dredging activities in 2015, which altered the harbor basin’s topography and hydrodynamic conditions, increasing flow velocity and leading to significant sediment scouring and transport. During 2017 to 2018 and 2019 to 2022, the harbor basin also showed a scouring trend, but the scouring volumes were relatively limited. This could be because the hydrodynamics of the dredged harbor gradually returned to a natural balance, reducing scouring intensity, along with a decrease in upstream sediment supply. In the remaining years, the harbor basin showed a silting trend. From 2018 to 2019, silting was particularly pronounced, likely due to the sediment redeposition effect and tidal influences. The loosened bed characteristics after dredging further exacerbated the silting, with a net silting volume of 23.9 cubic meters per year and a silting intensity of 0.141 meters per year.
Based on seven topographic surveys of the outer anchorage area of Made Island Port from 2015 to 2023, the scouring and silting changes over the years were analyzed. Figure 18 shows the topographic maps of the outer anchorage area for each year, and Figure 19 illustrates the scouring and silting changes between years. As shown in Figure 18, the depth of the outer anchorage area of Made Island Port mainly exhibits an east-shallow, west-deep characteristic. The shallow areas on the east side have water depths ranging from 27.0 to 30.0 meters, while the deeper areas on the west side have depths exceeding 37.0 meters. This characteristic is primarily determined by topographical features and hydrodynamic conditions. The distribution of water depths remains stable across different years, indicating that sediment transport in the region is in dynamic equilibrium, with good water depth conditions. The shallow areas on the east side are more susceptible to sedimentation due to weaker flow velocities, while the deeper areas on the west side maintain greater depth due to higher flow velocities or deep channel effects. Through regular topographic surveys and necessary maintenance, the water depths in the outer anchorage area can be further ensured to meet anchorage requirements, supporting the efficient operation of the port.

Figure 18. Bathymetric map of the outer anchorage of Made Island Port from 2015 to 2023.
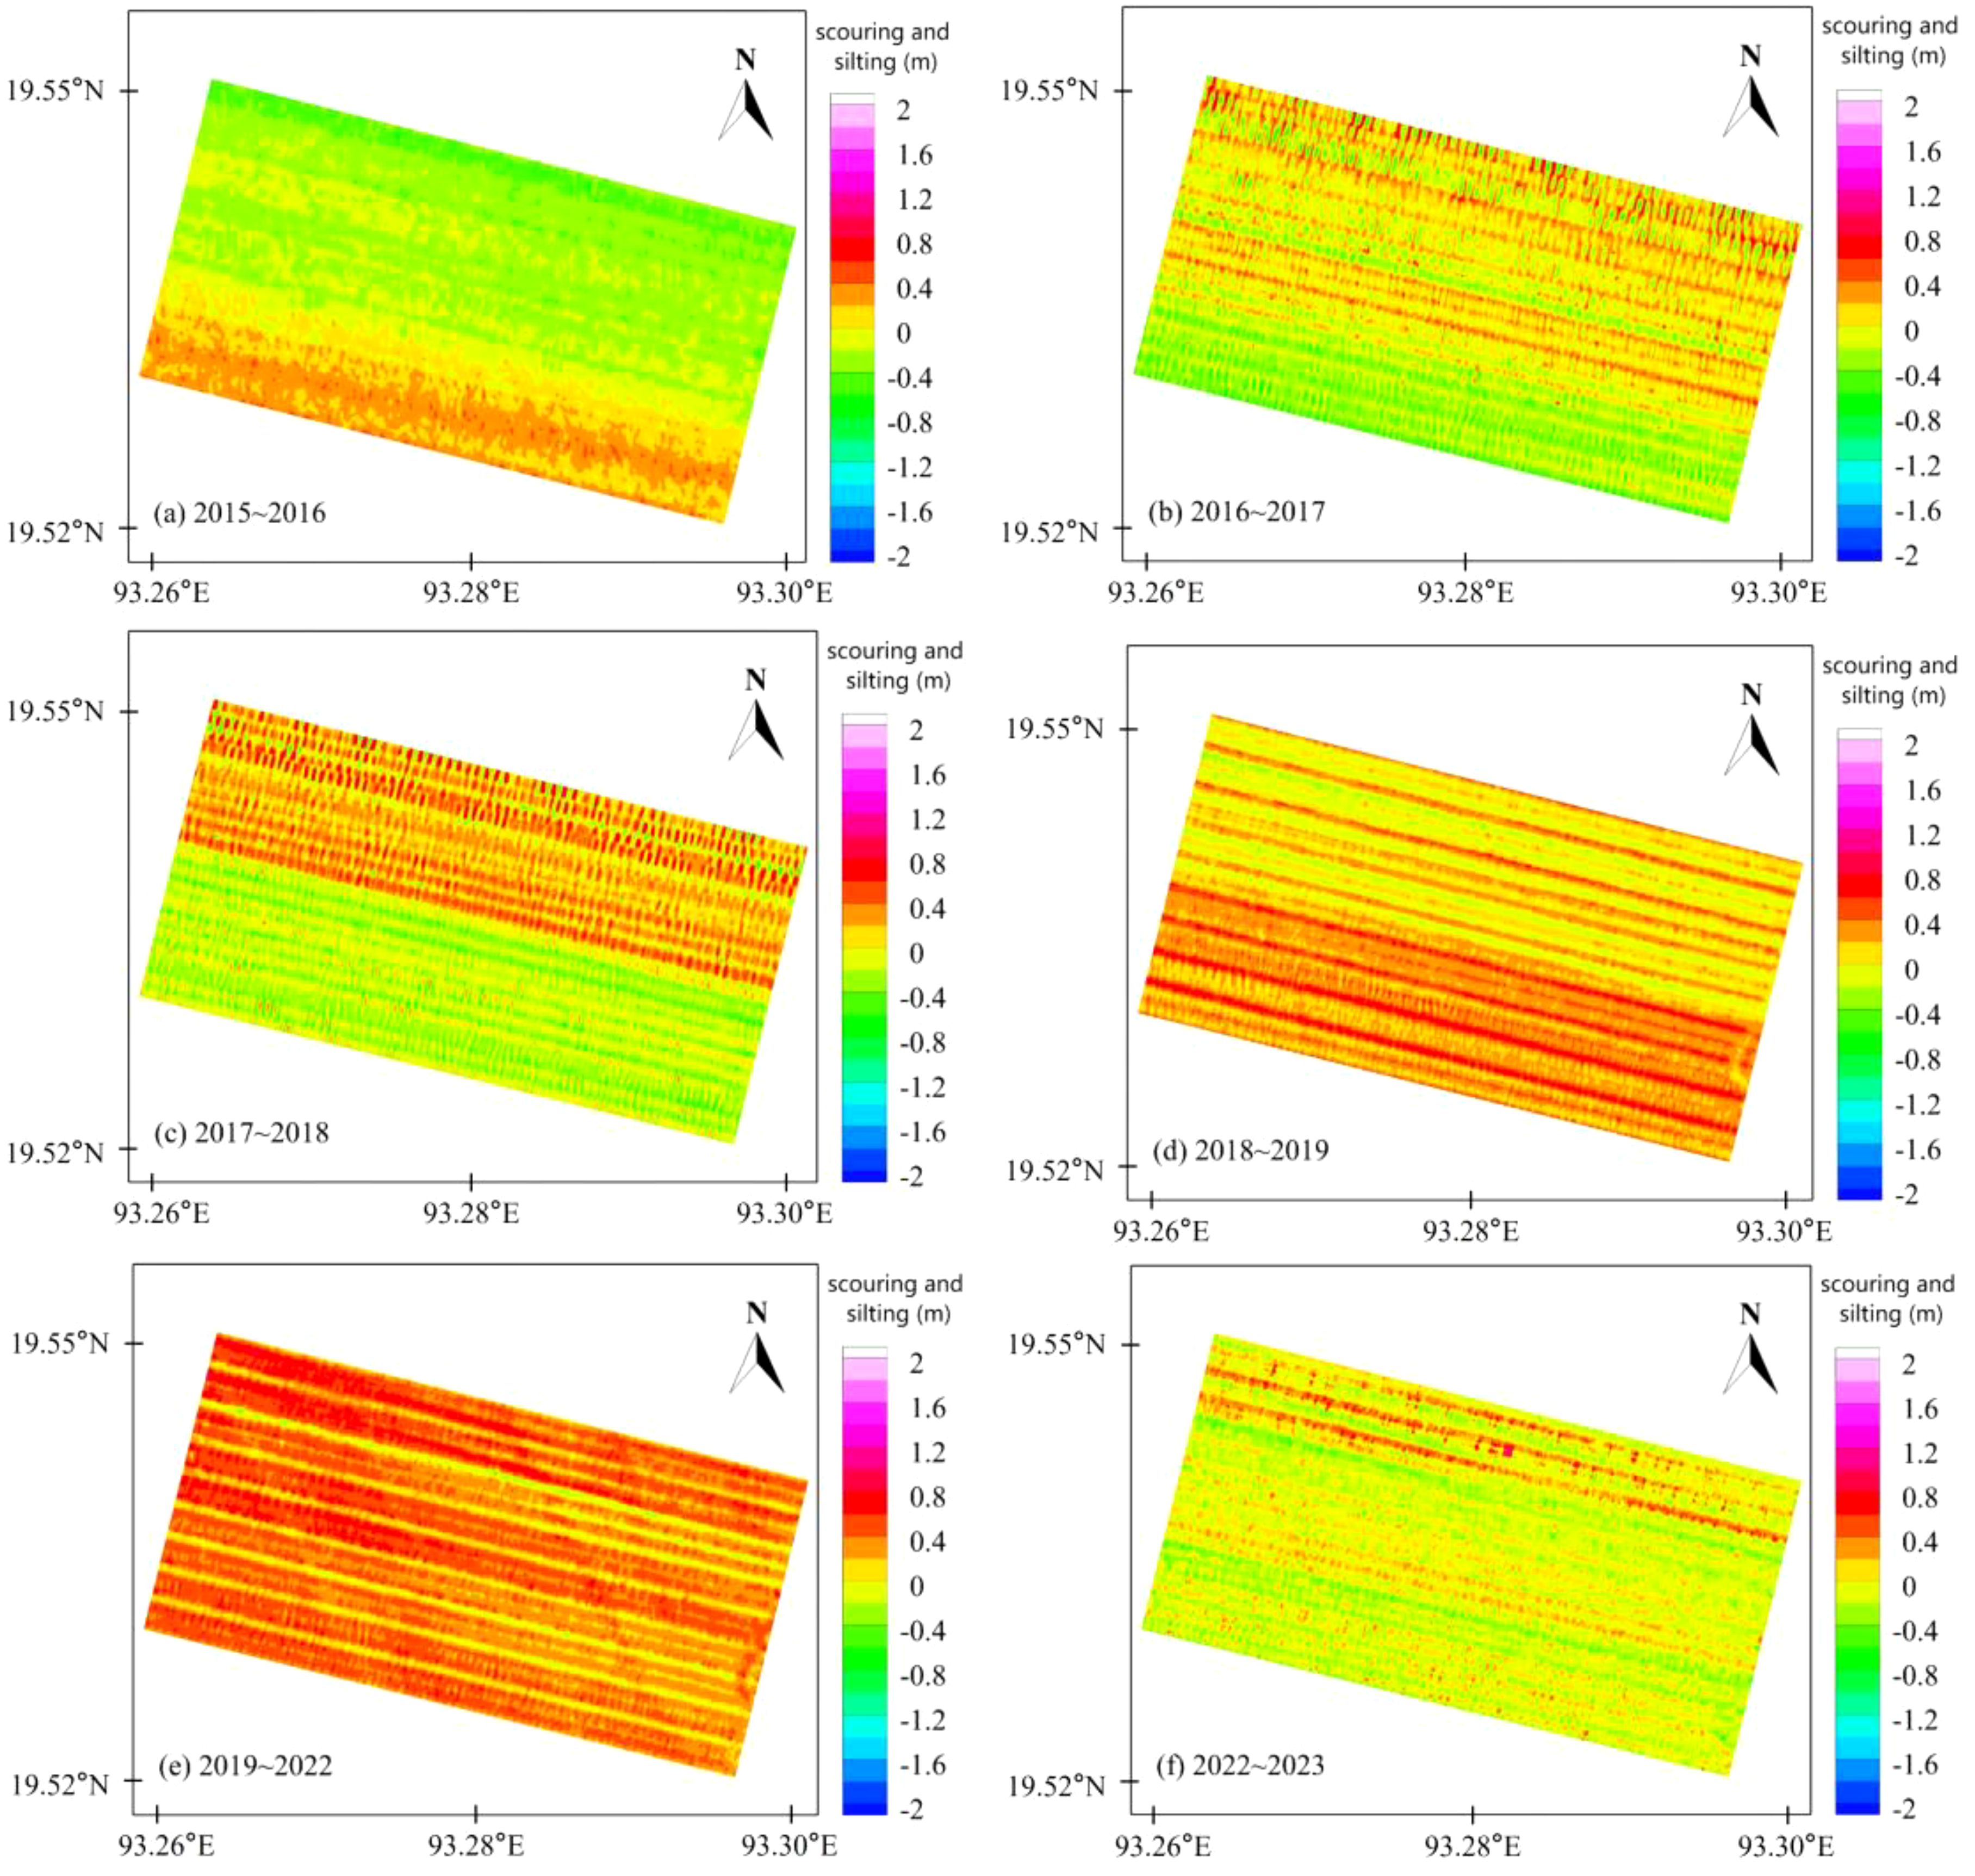
Figure 19. Scouring and silting distribution map of the outer anchorage of Made Island port from 2015 to 2023.
As shown in Figure 19, from 2015 to 2016, the outer anchorage area experienced scouring in the north and silting in the south, with most scouring and silting amplitudes within 0.5 meters. The scouring was mainly concentrated in the northern region with stronger hydrodynamics, while the southern region, due to relatively weaker hydrodynamics and sediment deposition, formed a silting trend. From 2016 to 2017 and 2017 to 2018, the anchorage area exhibited scouring in the south and silting in the north, which may be related to tidal flow direction and seasonal hydrodynamic changes, with scouring and silting amplitudes mostly within 0.5 meters. From 2018 to 2019, silting predominated in the outer anchorage area, with more significant silting in the south, where some areas had silting depths exceeding 0.7 meters. This could be related to enhanced sediment transport and optimized deposition conditions in the southern region. From 2019 to 2022, there was a clear silting trend in the outer anchorage area. This silting may be associated with increased sediment supply and weakened hydrodynamic conditions, with silting depths exceeding 0.5 meters in most areas. From 2022 to 2023, scouring and silting occurred alternately, with relatively limited scouring and silting volumes, most of which were within 0.2 meters. Only localized areas in the northern part showed silting depths exceeding 0.4 meters, suggesting slight changes in local hydrodynamic conditions, but overall, the situation remained stable.
The causes of silting in the outer anchorage area of Made Island Port are determined by the combined effects of sediment supply, hydrodynamic conditions, external interventions, and seasonal variations. Sediment sources include coastal erosion, port operations, and tidal transport. Significant silting is related to regional subsidence and sediment accumulation. The spatial distribution of hydrodynamics makes the northern region more prone to scouring, while the southern region becomes a sediment deposition area due to reduced water flow. Dredging and engineering activities alter the hydrodynamic environment, leading to changes in the scouring and silting patterns over different years. Seasonal wind, waves, and tidal flow direction changes cause alternating scouring and silting patterns between the north and south. These factors collectively influence the complexity of the anchorage’s scouring and silting dynamics.
To quantify the scouring and silting conditions of the outer anchorage area over different years, this study calculated the average net scouring and silting volume and scouring-silting intensity for each year, as shown in Figure 20. A positive scouring-silting volume indicates silting, while a negative value indicates scouring. The net scouring-silting intensity follows the same principle.
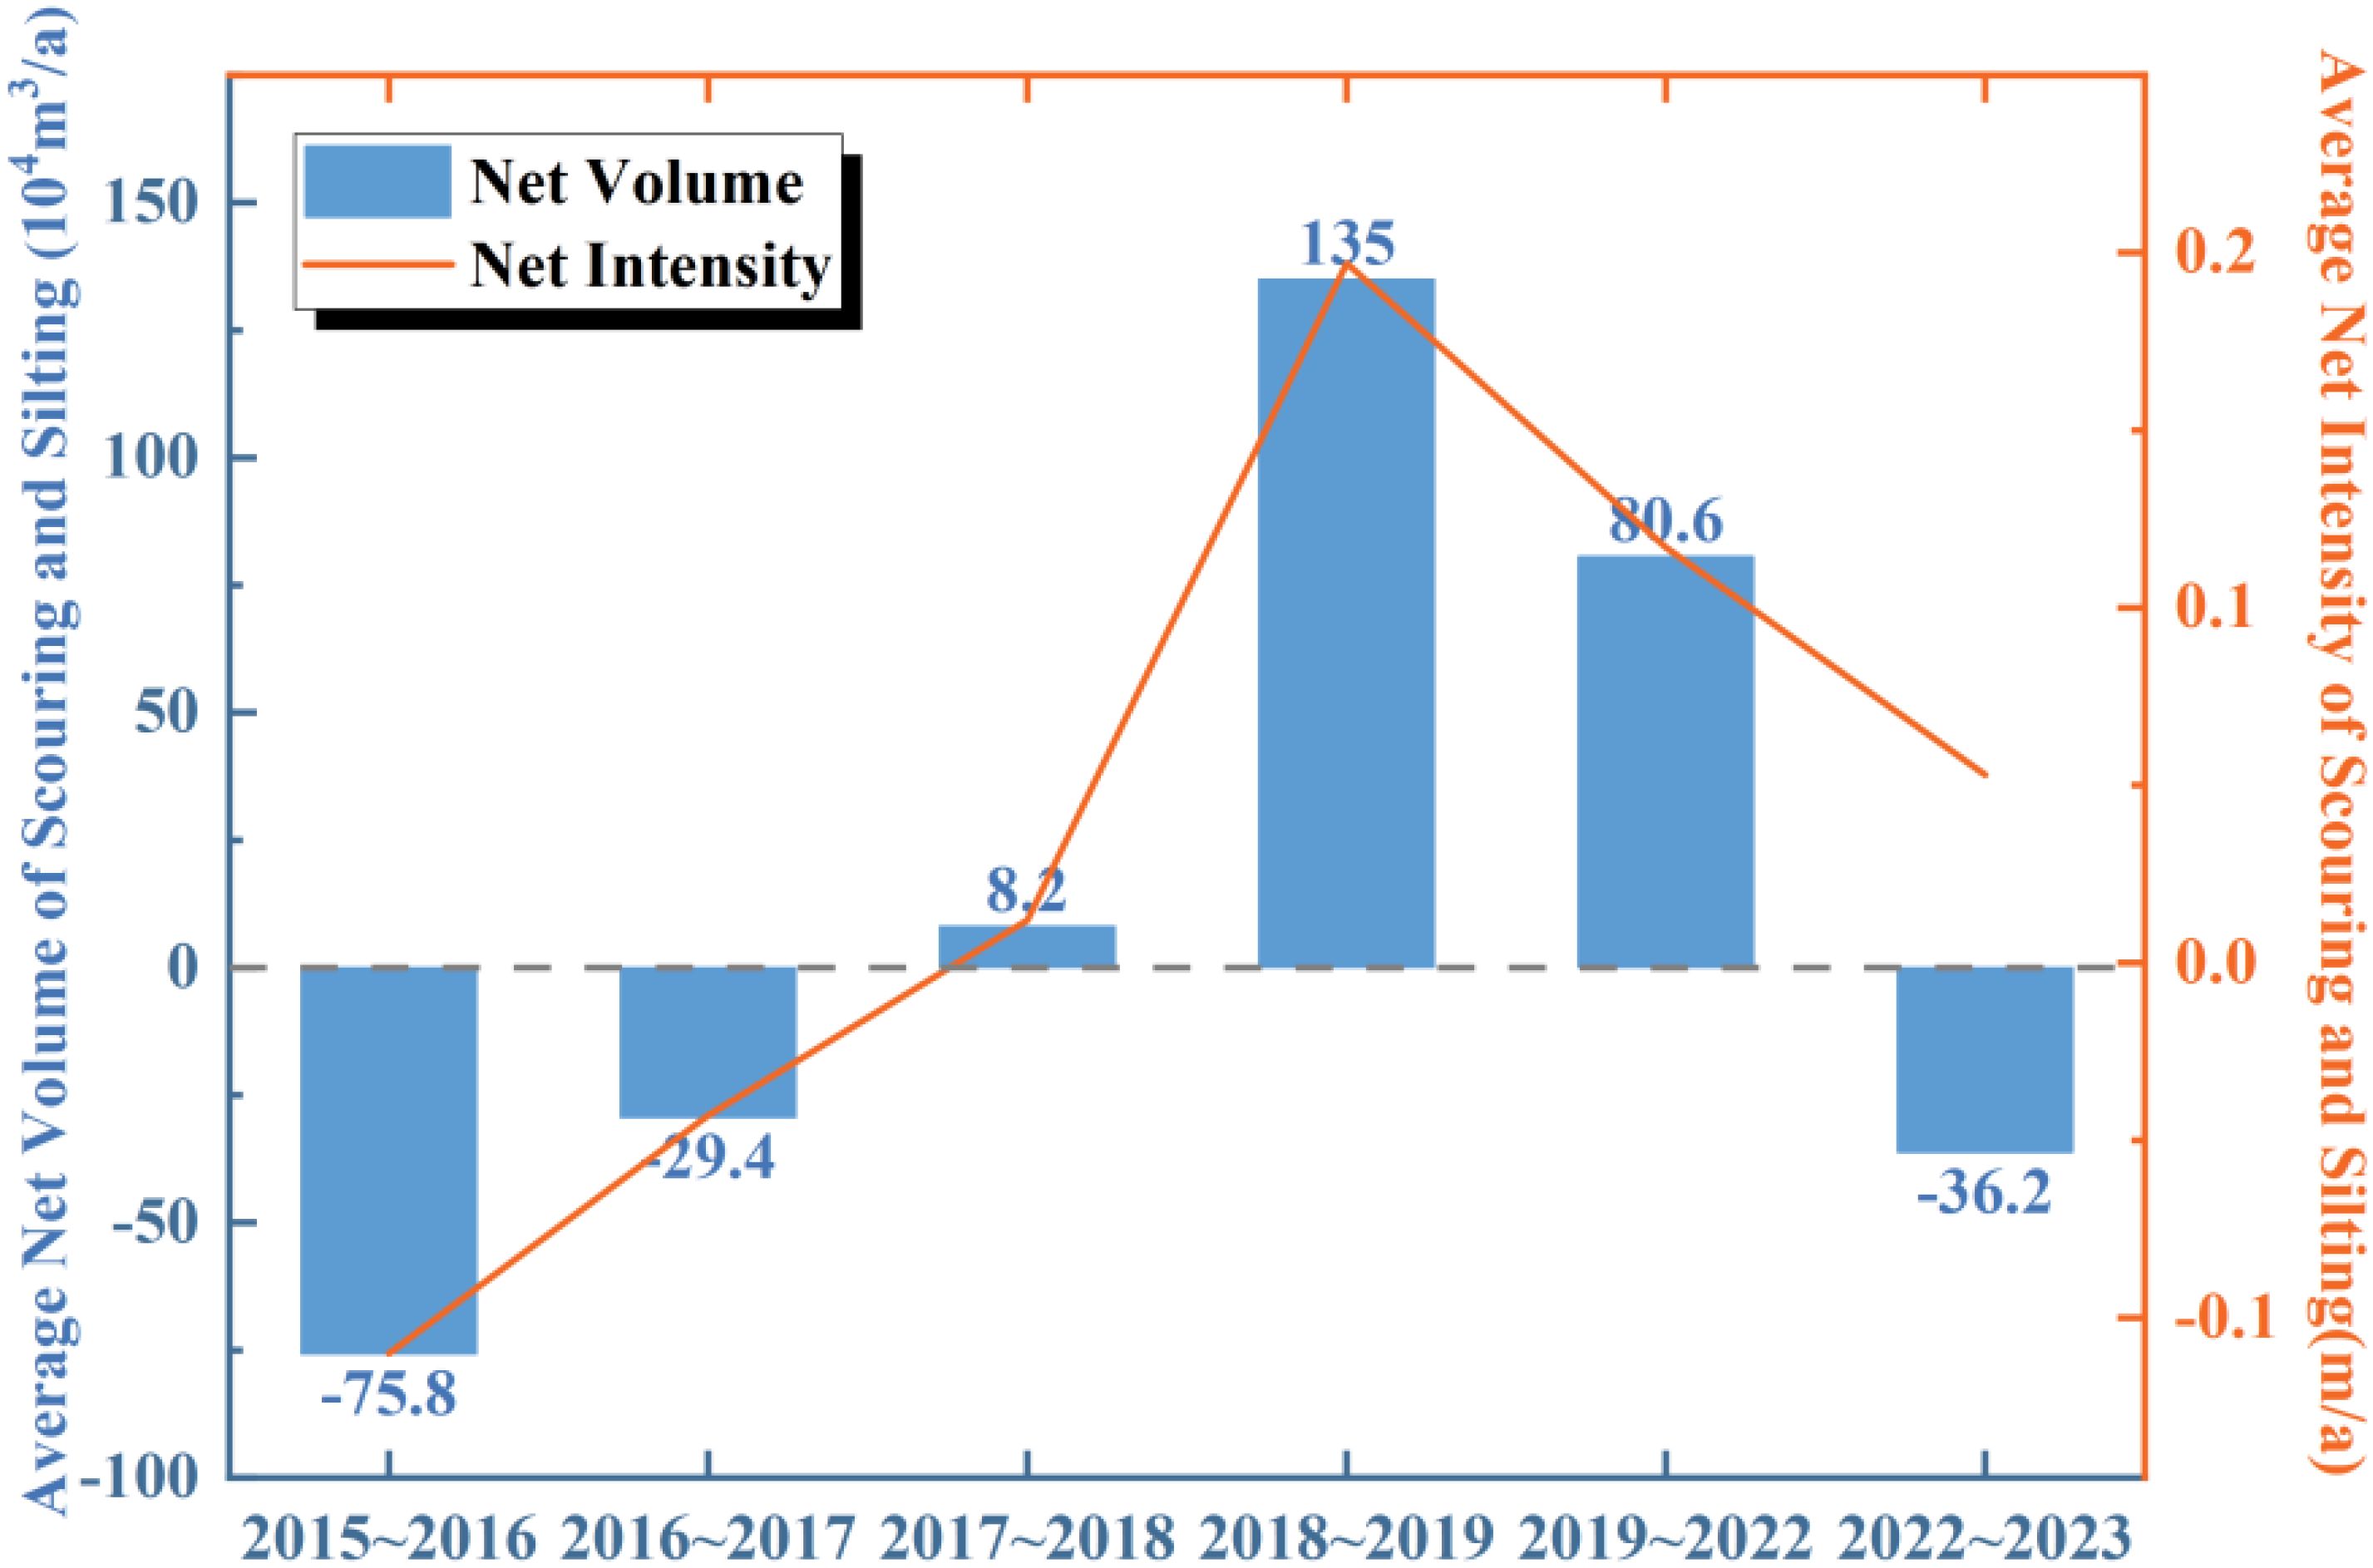
Figure 20. Average net scouring and silting in the outer anchorage.
As shown in Figure 20, from 2015 to 2016, the outer anchorage area exhibited a scouring trend caused by dredging, with a net scouring volume of 758,000 cubic meters per year and a scouring intensity of 0.110 meters per year. This indicates that dredging activities significantly reduced sediment accumulation in the anchorage area, improving water depth conditions. From 2016 to 2017, the scouring trend continued, likely related to the weakening of dredging activities or the natural recovery of hydrodynamic conditions, though the scouring volume was relatively limited. In the remaining years, the outer anchorage area exhibited a silting trend. From 2018 to 2019, silting was more pronounced, possibly due to weakened regional hydrodynamics, enhanced sediment transport, or changes in local deposition environments, with a net silting volume of 135.0 cubic meters per year and a silting intensity of 0.197 meters per year. Overall, the water depth conditions in the outer anchorage area of Made Island Port are relatively good, with smaller scouring and silting amplitudes in recent years, suggesting that the anchorage has reached a dynamic equilibrium state and that water depth conditions are stable.
Based on seven topographic surveys of the inner anchorage area for empty vessels at Made Island Port from 2015 to 2023, the scouring and silting changes over the years were analyzed. According to the survey report, the empty vessel anchorage area is a circular region with a radius of 600 meters. Figure 21 shows the topographic maps of the empty vessel anchorage area for each year, and Figure 22 illustrates the scouring and silting changes between years.
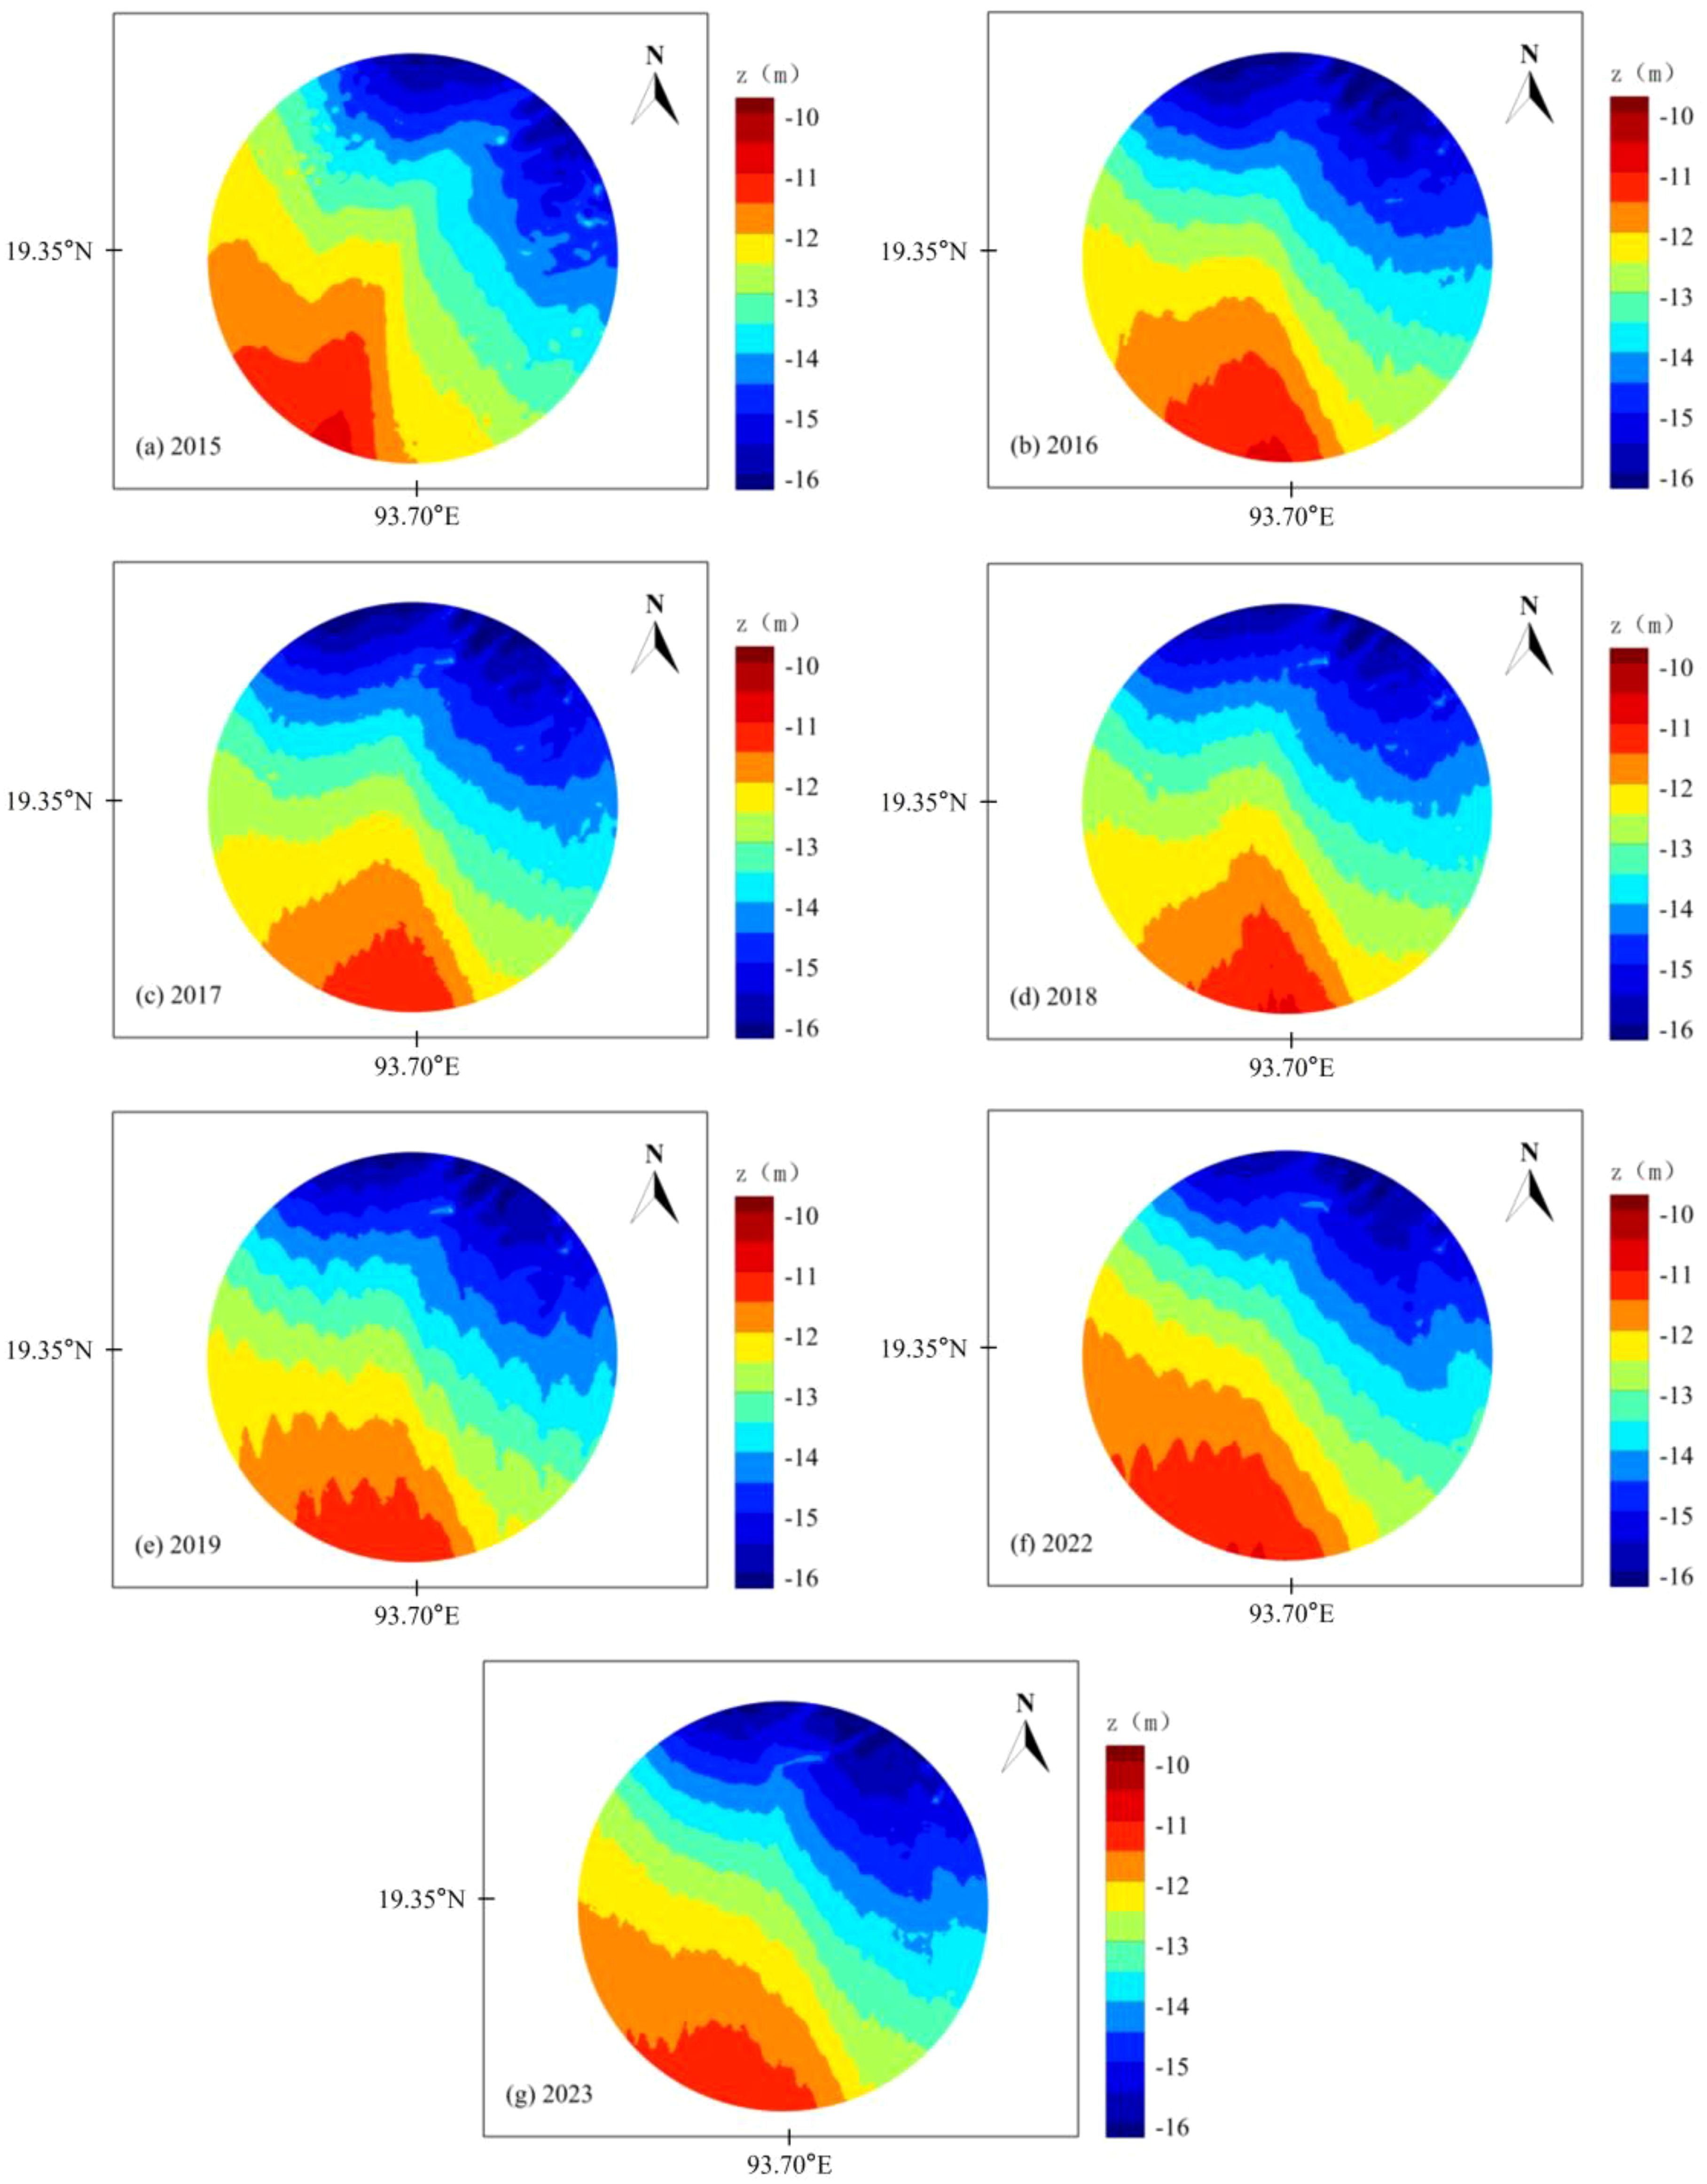
Figure 21. Bathymetric map of the inner empty ship anchorage of Made Island Port from 2015 to 2023(Radius 600m).
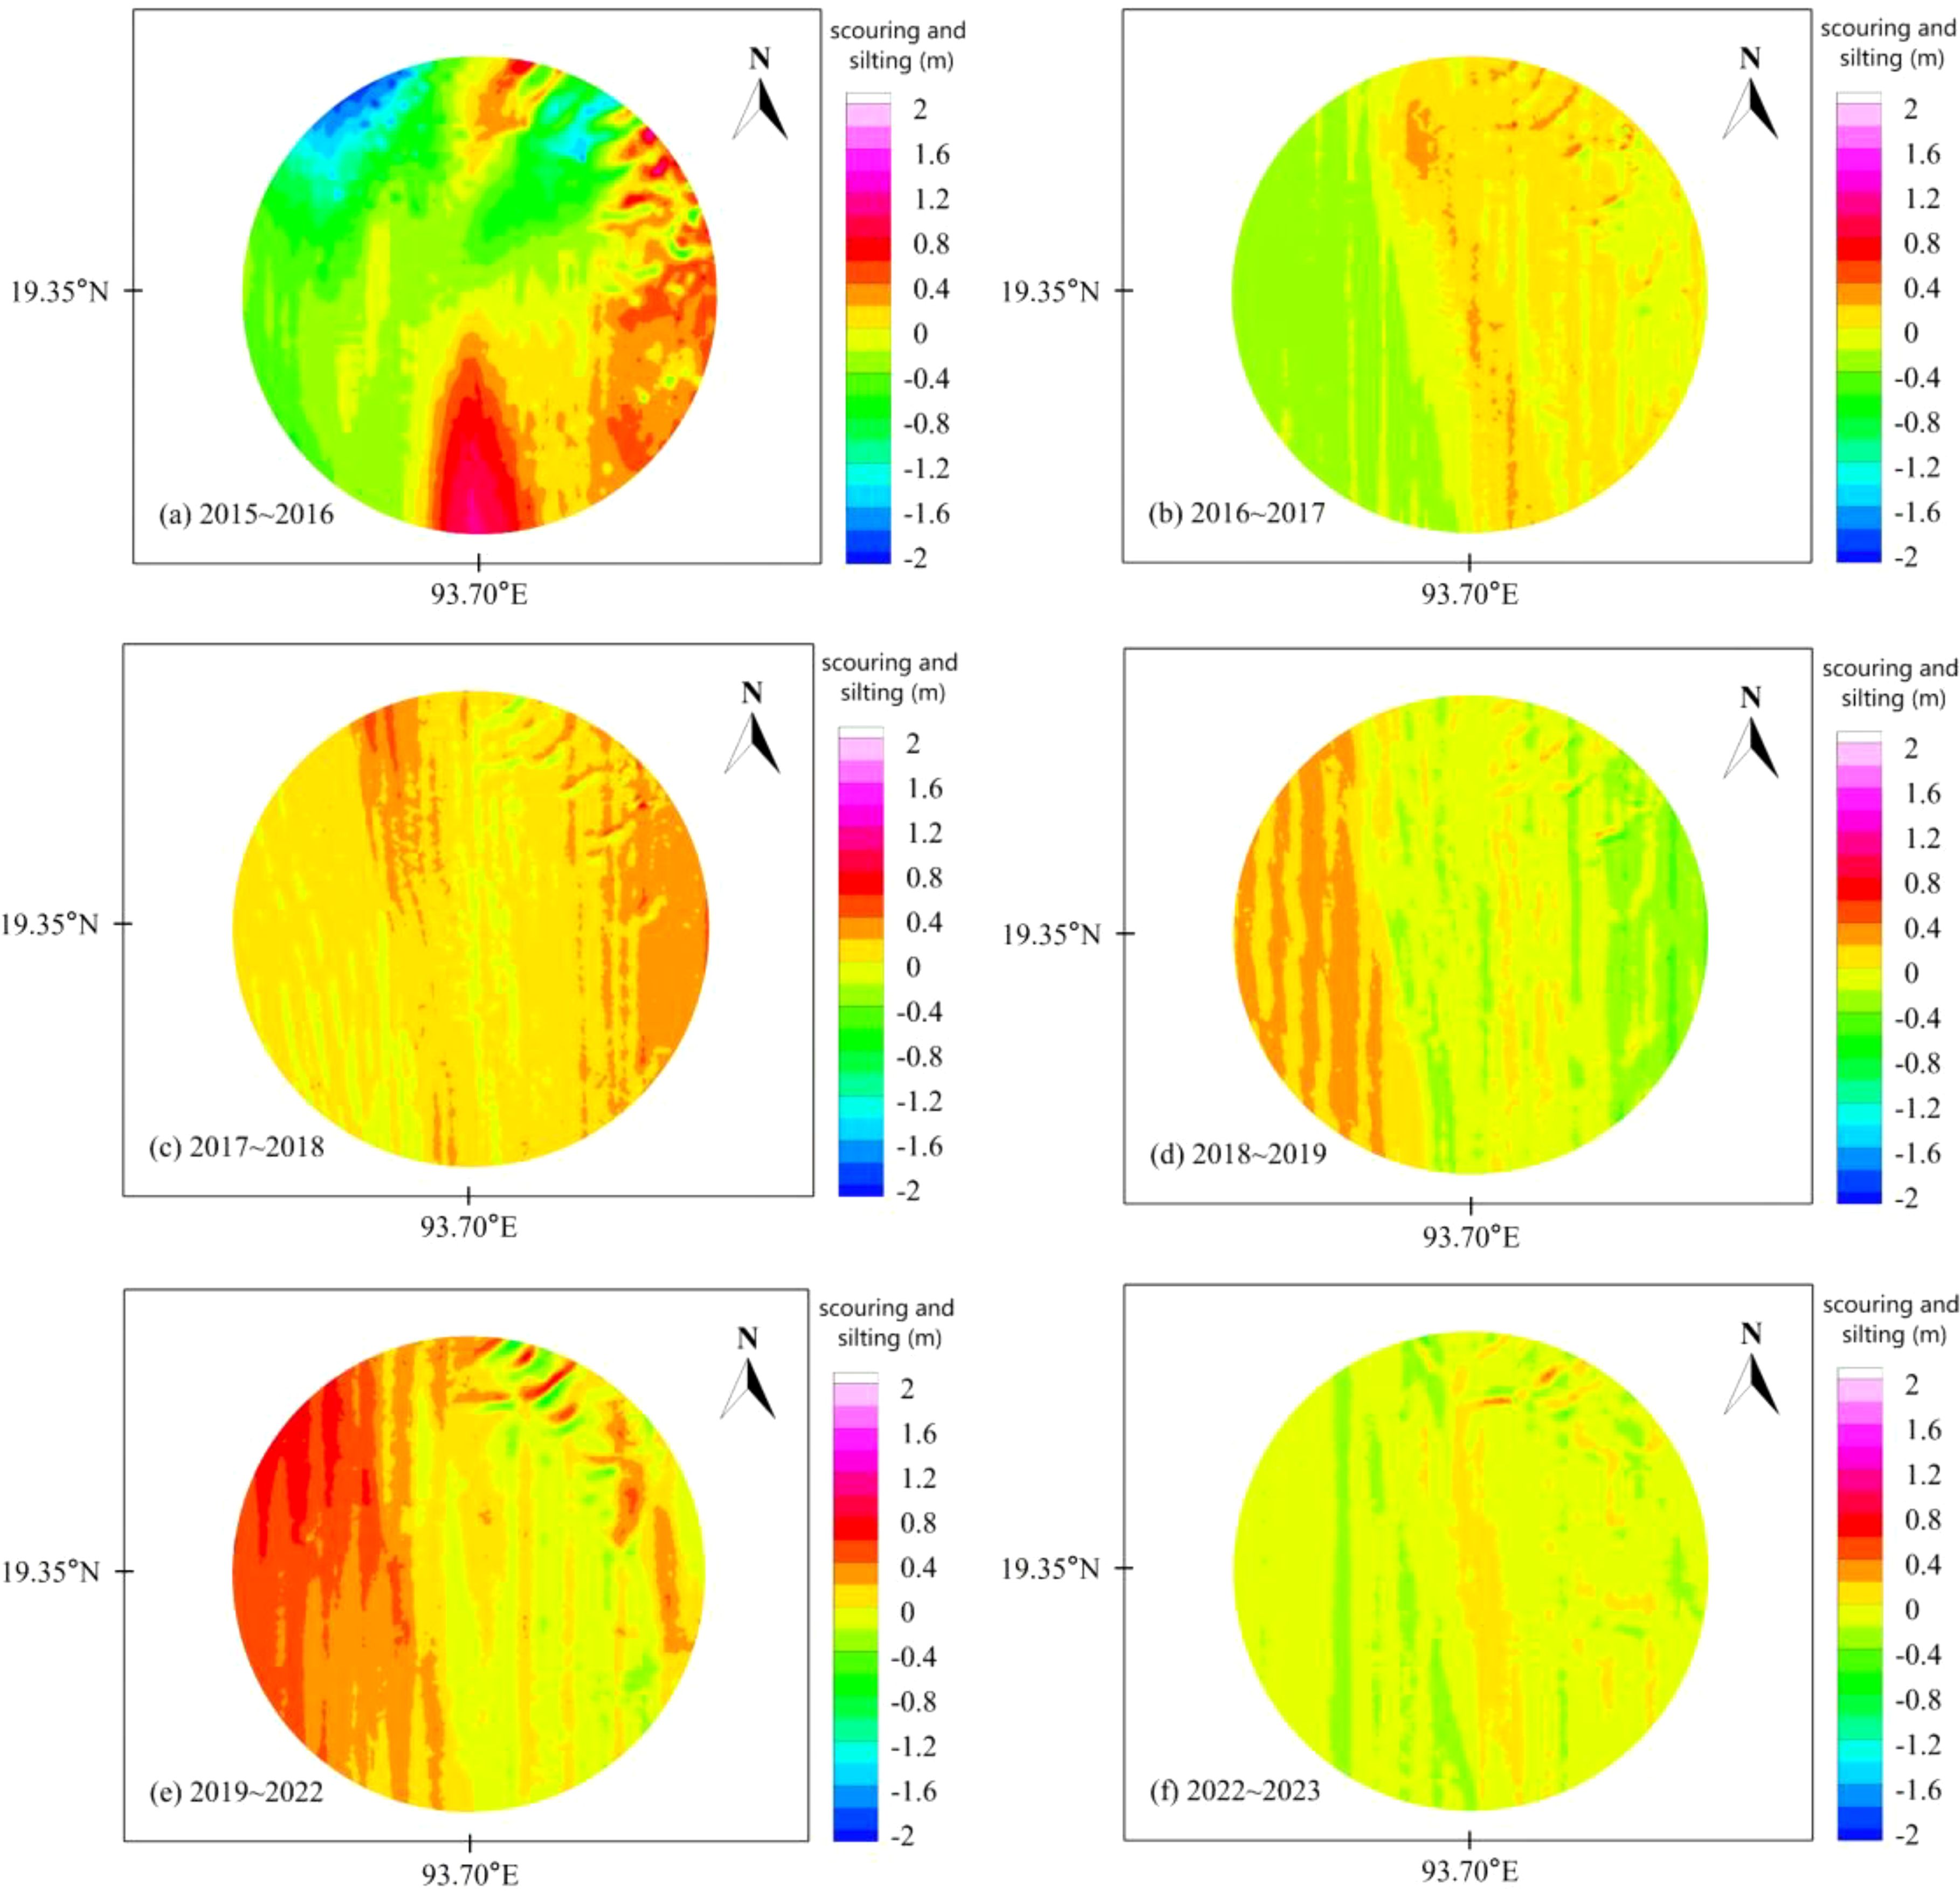
Figure 22. Scouring and silting distribution map of the inner empty ship anchorage of Made Island Port from 2015 to 2023(Radius 600m).
As shown in Figure 21, the depth of the empty vessel anchorage area at Made Island Port mainly exhibits a south-shallow, north-deep characteristic. The shallow areas on the southern side have depths ranging from approximately 11.0 to 12.0 meters, while the deeper areas on the northern side have depths greater than 15.0 meters. Overall, the depth distribution characteristics of the empty vessel anchorage area are relatively consistent across different years.
As shown in Figure 22, from 2015 to 2016, significant silting occurred in the southern and western parts of the empty vessel anchorage area, with a maximum silting depth of more than 1.0 meter. This could be related to the direction and lower velocity of the water flow in this area, which made it difficult for sediments to be transported away. The southern and western regions may be in relatively slow-flowing areas, causing sediment to accumulate and leading to silting. From 2016 to 2017, the anchorage area predominantly experienced scouring, with more pronounced scouring in the western part. The western region may have been affected by more concentrated water flow, leading to notable scouring and preventing long-term sediment accumulation in this area. In 2017 to 2018, the anchorage area showed an overall silting trend, with silting being particularly noticeable in the eastern part. This could be due to weaker water flow in the east, where sediments were transported to the eastern side and gradually accumulated. From 2018 to 2019, the anchorage area exhibited a westward silting and eastward scouring pattern, indicating a shift in scouring and silting regions. This change may be related to the dredging of the channel in 2018, which generated stronger water flow in the east, leading to scouring. From 2019 to 2022, the westward silting and eastward scouring phenomenon continued, but silting was more pronounced than scouring. This could be due to the gradual accumulation of sediment in the western region, where there was no effective scouring, making the silting more significant. The eastern scouring was stronger, but the overall silting volume exceeded the scouring volume due to long-term sediment deposition. From 2022 to 2023, the anchorage area mainly experienced silting in the central part, with scouring occurring on the eastern and western sides. This phenomenon suggests a significant change in the water flow dynamics and direction. The water flow in the central area may have slowed, causing sediment to accumulate in this region, while the accelerated flow on the east and west sides carried away the sediment, resulting in pronounced scouring.
The reasons for changes in scouring and silting regions and patterns in the empty vessel anchorage area over different years are as follows: The speed and direction of water flow, as well as its distribution across different regions, are the core factors driving scouring and silting. Additionally, tidal fluctuations and the effects of wind and waves influence the strength of water flow, which in turn affects sediment distribution. Changes in the port area’s topography can alter the path and speed of water flow, while human activities such as dredging and channel diversion can also change local water flow characteristics, leading to variations in scouring and silting. Finally, scouring and silting are long-term cumulative effects over time, the accumulation of sediments and changes in water flow interact, resulting in annual differences in scouring and silting.
To quantify the scouring and silting conditions of the outer anchorage area across different years, this study calculated the average scouring and silting volumes and intensities for different channel sections, as shown in Figure 23.
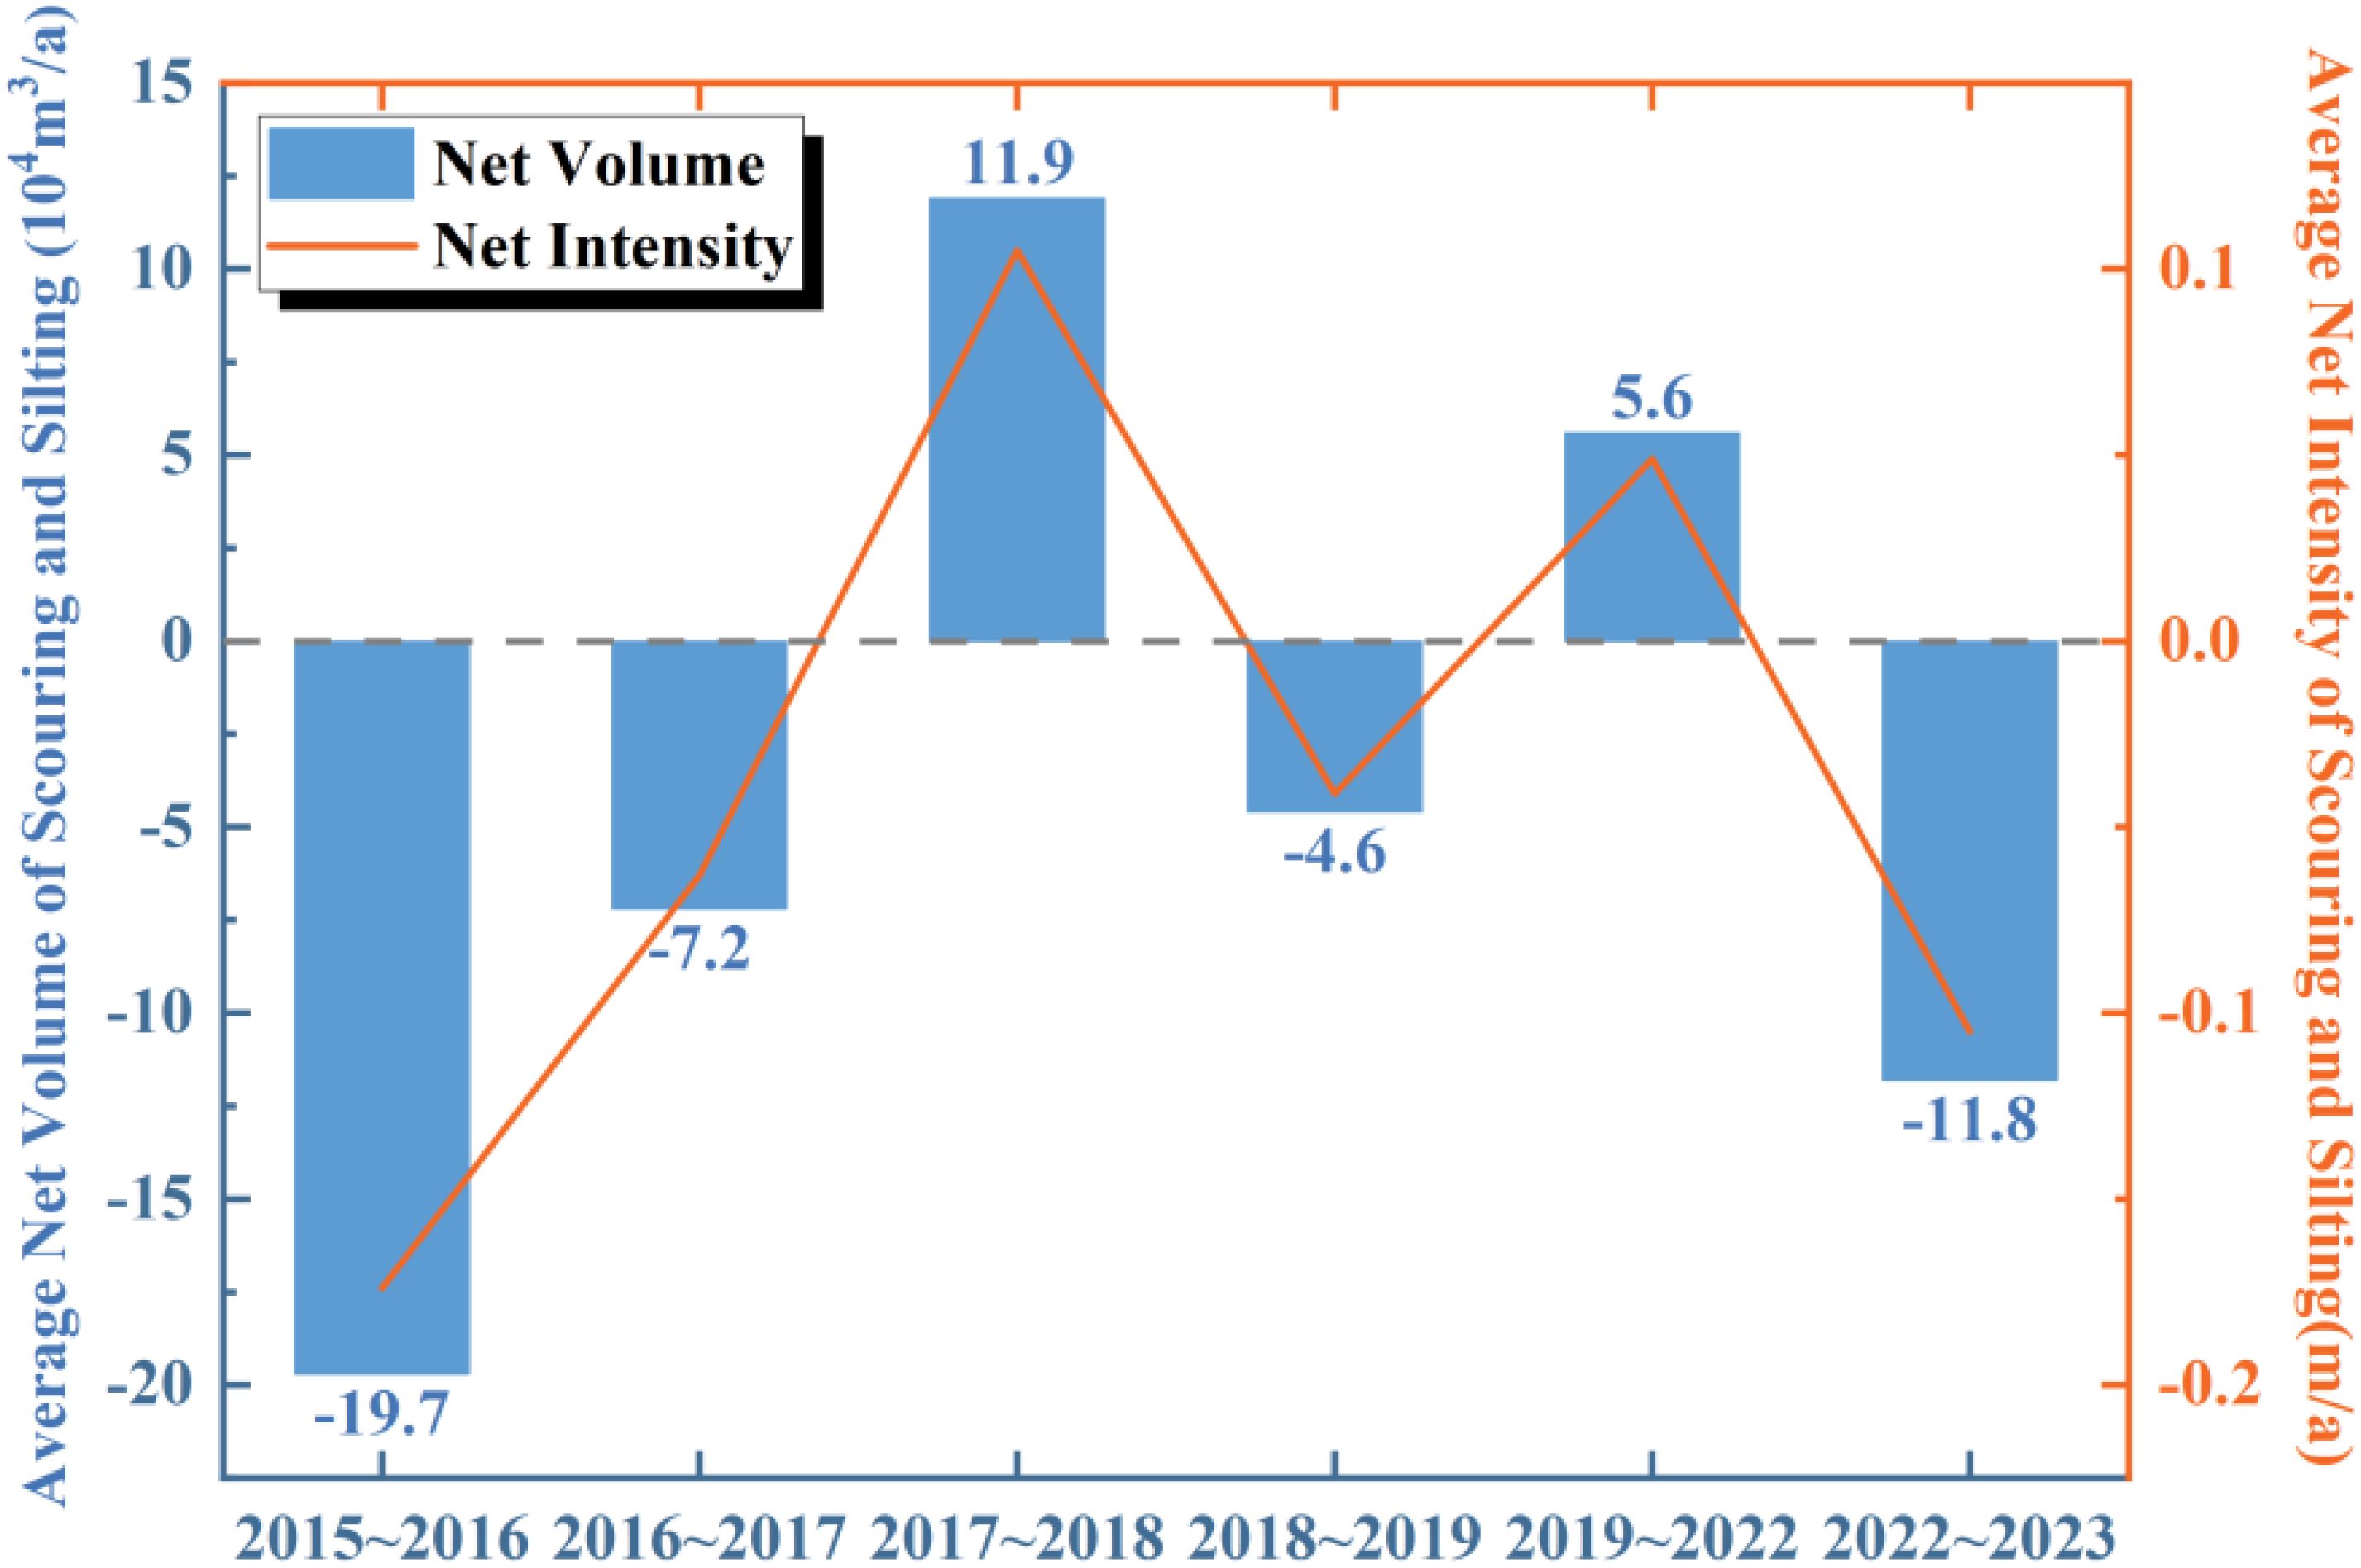
Figure 23. Average net scouring and silting volume and intensity in the inner empty ship anchorage of Made Island Port across different years.
As shown in Figure 23, from 2015 to 2016, due to the influence of dredging, the empty vessel anchorage area exhibited a scouring trend, with a net scouring volume of 197,000 cubic meters per year and a scouring intensity of 0.174 meters per year. This phenomenon is likely related to the dredging activities in 2015, which typically lead to changes in the water flow path, altering the velocity and direction of the flow, thereby intensifying scouring in certain areas. Dredging not only increases water flow speed but also may transport sediments away, resulting in a larger scouring volume and stronger scouring intensity. Between 2016–2017, 2018–2019, and 2022–2023, the area also exhibited a scouring trend, though the scouring volumes were relatively limited. Compared to 2015-2016, the scouring effect in these years weakened, likely due to the cessation of dredging activities or changes in water flow conditions. Especially in the absence of further dredging and flow enhancement, the natural flow velocity stabilized, leading to a reduction in scouring volume. In the remaining years, the empty vessel anchorage area exhibited silting conditions, with a more significant silting effect in 2017-2018. The net silting volume during this period was 11.9 cubic meters per year, and the silting intensity was 0.105 meters per year. This period may have seen slower water flow or continuous sediment input into the area, leading to a higher silting volume. In areas with weaker flow, silting is more likely, especially in certain parts of the anchorage area where sediment is constantly brought in and accumulated. In other years (2019-2022), the scouring effect was minimal, and the silting effect gradually became more apparent. The weakening of water flow or the accumulation of sediment in the port area made it difficult for water flow to effectively scour, leading to an increase in silting volume year by year.
This paper analyzes the topographic evolution of different areas of Made Island Port and draws the following main conclusions:
Scouring and Silting Patterns in the Channel: Between 2015 and 2023, the channels of Made Island Port exhibited a clear alternation between scouring and silting. Dredging activities significantly altered the water flow conditions, leading to intensified scouring in certain areas. Particularly after dredging, the channel depth gradually stabilized. However, due to changes in sediment supply and water flow conditions, some areas of the channel continue to experience silting problems, especially in shallow regions.
Topographic Evolution of the Port Basin: Most of the port basin at Made Island Port has a water depth exceeding 35 meters, which meets the berthing requirements for large vessels. However, certain localized areas have shallower depths. The scouring and silting phenomena in the port basin are complex, with varying intensity and extent depending on the year. From 2015 to 2016, a peak of scouring occurred following dredging activities. Afterward, as water flow conditions gradually stabilized, the scouring intensity decreased, and silting began to emerge.
Scouring and Silting Changes in the Outer Anchorage Area: The depth distribution in the outer anchorage area is stable, showing a characteristic of shallow east and deep west. Between 2015 and 2023, scouring and silting in the outer anchorage were mainly influenced by the direction of water flow, tidal effects, and seasonal changes. Dredging activities had a noticeable improvement on the water depth in the outer anchorage area. Silting mainly occurred in the southern region, where water flow was weaker.
Scouring and Silting Evolution in the Empty Vessel Anchorage Area: The topography of the empty vessel anchorage shows a characteristic of shallow south and deep north. The study shows that the scouring and silting in this area are closely related to the water flow speed, direction, and the accumulation of local sediments. Dredging activities had a significant impact on the water depth in the empty vessel anchorage. As water flow conditions changed, scouring and silting alternated.
Overall, the scouring and silting evolution at Made Island Port is influenced by a combination of hydrodynamic factors, topographic changes, and human interventions. To ensure the safe operation and efficient transportation of the port, it is recommended to strengthen the monitoring of the port’s topography, regularly carry out dredging maintenance, and implement timely and effective dredging measures, particularly in areas vulnerable to silting, to maintain the navigability of the port channels and anchorage areas. The methodology used in this study can be applied to other ports experiencing similar sedimentation challenges, particularly in regions with strong tidal influences, seasonal sediment transport variations, or extensive dredging activities.
The original contributions presented in the study are included in the article/supplementary material. Further inquiries can be directed to the corresponding author.
QW: Conceptualization, Investigation, Methodology, Validation, Writing – original draft, Writing – review & editing. GW: Data curation, Methodology, Writing – original draft. HJ: Data curation, Methodology, Writing – review & editing. HS: Conceptualization, Methodology, Writing – review & editing. DM: Data curation, Methodology, Writing – original draft, Writing – review & editing. YD: Conceptualization, Data curation, Formal Analysis, Methodology, Project administration, Writing – review & editing.
The author(s) declare financial support was received for the research, authorship, and/or publication of this article. This research was funded by National Key Research and Development Program of China, grant number 2023YFB2603800. Guangxi Science and Technology Major Program, Grant number AA23023009, AA23062045, AA23062052. Scientific Research and Innovation Fund Project of TIWTE, grant number TKS20230110, TKS20240101.
Authors QW, GW, HJ and HS were employed by Sino-Pipeline International Company Limited.
The remaining authors declare that the research was conducted in the absence of any commercial or financial relationships that could be construed as a potential conflict of interest.
The author(s) declare that no Generative AI was used in the creation of this manuscript.
All claims expressed in this article are solely those of the authors and do not necessarily represent those of their affiliated organizations, or those of the publisher, the editors and the reviewers. Any product that may be evaluated in this article, or claim that may be made by its manufacturer, is not guaranteed or endorsed by the publisher.
Gao M., Xu L., Li G. (2009). The study of scouring and silting evolution of radiative sand ridge filed of the South Yellow Sea in support of DEM. Mar. Sci. Bull. 28, 168–176. doi: 10.3969/j.issn.1001-6392.2009.04.026
Gupta L. K., Pandey M., Raj P. A., Shukla A. K. (2023). Fine sediment intrusion and its consequences for river ecosystems: A review. J. Hazard Toxic Radioact. Waste 27, 1–12. doi: 10.1061/(ASCE)HZ.2153-5515.0000729
Ju B., Hang Q., Li Q., Li M., Li Y. (2015). Study of water requirement for silt scouring in seaward channels at Xinyang Port. J. Hohai Univ. (Natural Sciences) 43, 537–541. doi: 10.3876/j.issn.1000-1980.2015.06.006
Kundu M., Ghosh A., Pandey M., Maity R. (2025). Deciphering seasonal bridge scour effects: a 1D sediment transport model study in India’s tropical basin. Model. Earth Syst. Environ. 11, 34. doi: 10.1007/s40808-024-02260-4
Liang Q., Wang W., Zhao M., Lai Z., Lan B. (2016). Change of scouring and silting during 1954 to 2008 in the sea bed of Dongshan Bay, Fujian. J. Appl. Oceanogr. 35, 95–101. doi: 10.3969/J.ISSN.2095-4972.2016.01.011
Liu J., Cheng H., Han L., Wang Z. (2019). Interannual variations on siltation of the 12.5 m deepwater navigation channel in Yangtze Estuary. Adv. Water Sci. 30, 65–75. doi: 10.14042/j.cnki.32.1309.2019.01.007
Pan L., Ding P., Ge J., Hu K. (2011). Analysis of influence of Deep Waterway Project on morphological change in North Passage of Changjiang Estuary. J. Sediment Res. 9, 53–61. doi: 10.1002/clc.20818
Song C., Lv X. (2024). Safe maneuvering of VLCC berthing crude oil wharf of Madh island port in Myanmar. J. Qingdao Ocean Shipp. Mariners Coll. 45, 25–30.
van Rijn L. C. (1984). Sediment transport, part I: bed load transport. J. Hydraul. Eng. 110, 1431–1456. doi: 10.1061/(ASCE)0733-9429(1984)110:10(1431
Wan Z., Min F., Zhang Z. (2009). Observations and analyses of the water and sediment discharge ratios in the southern branch, Changjiang Estuary. J. Nanjing Univers.: Natural Sci. 45, 416–423. doi: 10.1360/972009-1551
Wang X., Feng X., Tian D., Jiang B., Jiang J., Teng S. (2017). Sediment scouring and deposition at the Dandong Port before and after the construction of reclamation project. Mar. Sci. 41, 41–49. doi: 10.11759/hykx20161207002
Winterwerp J. C., Wang Z. B., van Braeckel A., van Holland G., Kösters F. (2013). Man-induced regime shifts in small estuaries—II: a comparison of rivers. Ocean Dyn. 63, 1293–1306. doi: 10.1007/s10236-013-0663-8
Yang Y., Li D. (2020). Analysis of the safely berthing maneuvering on full loaded VLCC in the port of Myanma made island. J. Qingdao Ocean Shipp. Mariners Coll. 41, 7–11.
Keywords: Made Island port channel, port basin, outer anchorage, empty ship anchorage, scouring, silting
Citation: Wang Q, Wang G, Jiang H, Song H, Ma D and Duan Y (2025) Spatiotemporal evolution of scouring and silting in Made Island port channel (2015–2023). Front. Mar. Sci. 12:1557950. doi: 10.3389/fmars.2025.1557950
Received: 09 January 2025; Accepted: 18 February 2025;
Published: 06 March 2025.
Edited by:
Hossein Hamidifar, Shiraz University, IranReviewed by:
Manish Pandey, Indian Institute of Technology Kharagpur, IndiaCopyright © 2025 Wang, Wang, Jiang, Song, Ma and Duan. This is an open-access article distributed under the terms of the Creative Commons Attribution License (CC BY). The use, distribution or reproduction in other forums is permitted, provided the original author(s) and the copyright owner(s) are credited and that the original publication in this journal is cited, in accordance with accepted academic practice. No use, distribution or reproduction is permitted which does not comply with these terms.
*Correspondence: Dianguang Ma, bWFkZzIwMjFAMTYzLmNvbQ==
Disclaimer: All claims expressed in this article are solely those of the authors and do not necessarily represent those of their affiliated organizations, or those of the publisher, the editors and the reviewers. Any product that may be evaluated in this article or claim that may be made by its manufacturer is not guaranteed or endorsed by the publisher.
Research integrity at Frontiers
Learn more about the work of our research integrity team to safeguard the quality of each article we publish.