
94% of researchers rate our articles as excellent or good
Learn more about the work of our research integrity team to safeguard the quality of each article we publish.
Find out more
ORIGINAL RESEARCH article
Front. Mar. Sci., 20 March 2025
Sec. Coastal Ocean Processes
Volume 12 - 2025 | https://doi.org/10.3389/fmars.2025.1556561
This article is part of the Research TopicClimate Change and Human Impact: Assessing Vulnerability and Intensification of Hazards in Estuarine and Coastal ZonesView all 11 articles
 Yepeng Xu1
 Fangping Cheng1,2,3,4
 Xiao Ma2,4
 Ming Mao1Yuanli Zhu1,2,3,4
 Zhibing Jiang1,2,3,4,5Ziting Zheng6Jiangning Zeng1,2,3,4
 Lu Shou1,2,3,4
 Feng Zhou2,4
 Ping Du1,2,3,4,5*
Estuarine fronts, which arise from the convergence of distinct water masses, exhibit considerable spatial and temporal variability and play a crucial role in shaping ecological dynamics within estuarine ecosystems. Despite their importance, due to limited data, there’s inefficiency understanding on how biological communities, particularly zooplankton, respond to these dynamic environmental features. The Yangtze River Estuary (YRE), a transitional zone between the Yangtze River and the East China Sea, is an ideal place in which to study the response of zooplankton communities to estuarine fronts, as freshwater discharge, offshore waters, and the Taiwan Warm Current converge here and form sediment and plume fronts in summer. We investigate zooplankton communities and environmental variables including temperature, salinity, turbidity, and Chlorophyll a (Chl a) in the YRE during summer from 2016 to 2023, and examine the differences in spatial distribution of estuarine fronts and zooplankton community and the dominant environmental factors controlling zooplankton variation in different runoff years. Our findings found that the sediment fronts appeared around 122.5°E except in drought years (2022 and 2023); the plume fronts extended to 123.5°E and beyond during wet years (2016, 2020 and 2021), while shrank within 123°E in drought years. The zooplankton communities were classified into low-salinity, moderate-salinity, and high-salinity groups spatially in most years, but the low-salinity group had not been detected in the extreme drought year 2022. During flood years, low-salinity nearshore species such as Oithona brevicornis, Centropages dorsispinatus and Cladocera exhibited a notable increase in dominance, while the drought favored euryhaline species like Microsetella rosea. Furthermore, the turbidity, salinity and temperature all played significant roles in zooplankton spatial variation in wet years, while only salinity played as an important factor in drought years. These results implied the prominent sediment fronts and extended plume fronts in wet years shaped the zooplankton spatial variation collectively; in contrast, sediment fronts disappeared during drought years, and the plume fronts played a crucial role in shaping the zooplankton spatial variation. Besides, the extremely low runoff in 2022 has been shown to lead to obvious changes in zooplankton communities, which might affect fisheries stocks and require concern.
● Interannual runoff variation significantly alters the spatial distribution of fronts in the YRE, with outward extended plume fronts in wet years and disappeared sediment fronts in drought years.
● The distinct sediment fronts and extended plume fronts shape the zooplankton spatial variation collectively in wet years.
● The sediment fronts disappeared, zooplankton low-salinity group were not detected and dominance of euryhaline species raised in the extremely drought year of 2022 due to the low runoff.
Oceanic fronts are distinct three-dimensional zones where water masses with contrasting properties converge, leading to sharp gradients in characteristics such as temperature and salinity (Liu et al., 2022; Zhou et al., 2021). These fronts are typically characterized by abrupt changes in hydrographic features and can range in size from a few meters to several thousand kilometers. While some fronts are transient, lasting only a few days, others are more stable, occurring seasonally or persisting over long periods (Wang et al., 2021; Belkin et al., 2009).
The Yangtze River Estuary (YRE) is a dynamic and complex coastal ecosystem (Xu et al., 2024), shaped by both river discharge and tidal currents. The interaction between biological and physicochemical elements plays a crucial role in this ecosystem (Li et al., 2024a; Fukuda and Asanuma, 2007). The YRE features two prominent frontal systems: sediment and plume fronts (Zhou et al., 2021). The Yangtze River, which carries substantial sediment, forms sediment fronts at its mouth (Liu et al., 2022; Dai et al., 2011). The formation of these sediment fronts results from the interaction between river discharge and tidal currents (Liu et al., 2022). In the outer estuary, the convergence of freshwater from the river and saline water from the shelf leads to the formation of plume fronts (Liu et al., 2022). Between these sediment and plume fronts, optimal nutrient and light conditions foster phytoplankton blooms, leading to what is referred to as the “sandwich” structure (Li et al., 2021). The discharge of the Yangtze River is subject to significant interannual variability, driven by human activities and climate change (Shang et al., 2023). These variations directly impact the formation and structure of the sediment and plume fronts in the YRE.
Fronts play a pivotal role in shaping nutrient distribution, primary production, fisheries, and biogeochemical cycles (Jiang et al., 2024; Woodson and Litvin, 2015). Traditional studies have suggested that ecological gradients, representing changes in biological communities along environmental gradients, are closely associated with salinity changes in estuaries (Cram et al., 2024; Liu et al., 2024; Wang et al., 2024; Burdis and Hirsch, 2017; Liu et al., 2014). Since the formation of fronts is theoretically closely related to salinity gradients in estuaries, considering fronts as boundaries for ecological gradients would provide a more accurate approach by capturing critical environmental transitions that influence species distribution and community structure.
Zooplankton play a crucial role in estuarine food webs, converting phytoplankton and detritus into biomass, supporting higher trophic levels, and serving as critical food for fish larvae, while also acting as an important biological indicator of estuarine ecological health (Rogers et al., 2024; Du P. et al., 2023; Liu et al., 2023; Fernández and Molinero, 2008). They are highly sensitive to the environmental changes, such as fluctuations temperature, salinity, and Chlorophyll a (Chl a) concentration (Julien et al., 2024). Zooplankton respond to climate change through shifts in distribution, reproduction, and population dynamics, with temperature rise affecting growth rates, breeding seasons, and migration patterns, while ocean acidification and oxygen changes influence their physiological processes (Ratnarajah et al., 2022; Schubert et al., 2017). Previous studies on the distribution of zooplankton in the YRE suggest that temperature is the key factor influencing seasonal variations in community structure, while salinity drives regional variations in community structure (Yang et al., 2024; Shao et al., 2017; Xu et al., 2005). Given their sensitivity to salinity (von Weissenberg et al., 2022; Castellano et al., 2018), zooplankton communities in the YRE may respond to salinity fronts. Sediment fronts, characterized by elevated turbidity at the YRE mouth, affect light penetration and thus phytoplankton growth (Li et al., 2023). Since zooplankton rely on phytoplankton as a food source, they may also respond to sediment fronts and Chl a concentrations in the YRE. Based on the above characteristics of zooplankton response to environment, we speculate that the spatial distribution of zooplankton communities in the YRE would change with interannual variations in sediment and plume fronts, both of which are affected by river runoff.
Despite several investigations, previous research has not comprehensively addressed the response of zooplankton to estuarine fronts in the YRE, nor has it examined multi-year community structure variations. This study aims to demonstrate the response of zooplankton communities to the interannual variability of fronts in the YRE using summer samples from 2016 to 2023, providing insights into the intricate interactions between river discharge, estuarine fronts, and zooplankton communities. These findings will enhance our understanding of the ecological response of zooplankton to hydrographic fronts in estuarine and coastal environments.
The Yangtze River, the world’s third longest and China’s longest river (6,300 kilometers in length, with an average discharge of 30,000 m3/s), originates from the Tibetan Plateau and traverses western China to the eastern plain, ultimately emptying into the East China Sea, carrying significant sediment loads along its course (Dai and Lu, 2014). The YRE, a transitional zone between the river and the East China Sea, is influenced by complex hydrodynamic conditions due to the interaction of freshwater discharge, offshore waters, and the Taiwan Warm Current (Figures 1a, b). These interactions give rise to prominent features, including sediment and plume fronts (Zhou et al., 2021; Jiang et al., 2018). Suspended matter in the YRE undergoes substantial sedimentation near the sediment fronts, leading to a sharp decline in turbidity on the seaward side of deeper waters and an improvement in light conditions (Liu et al., 2022). Additionally, upwelling along the southern side of the plume fronts brings nutrient-rich bottom waters to the surface, stimulating phytoplankton growth in the upper water layers. This phenomenon creates a “sandwich” spatial distribution of phytoplankton between the sediment and plume fronts (Li et al., 2021), suggesting the potential existence of chlorophyll fronts in the outer YRE.
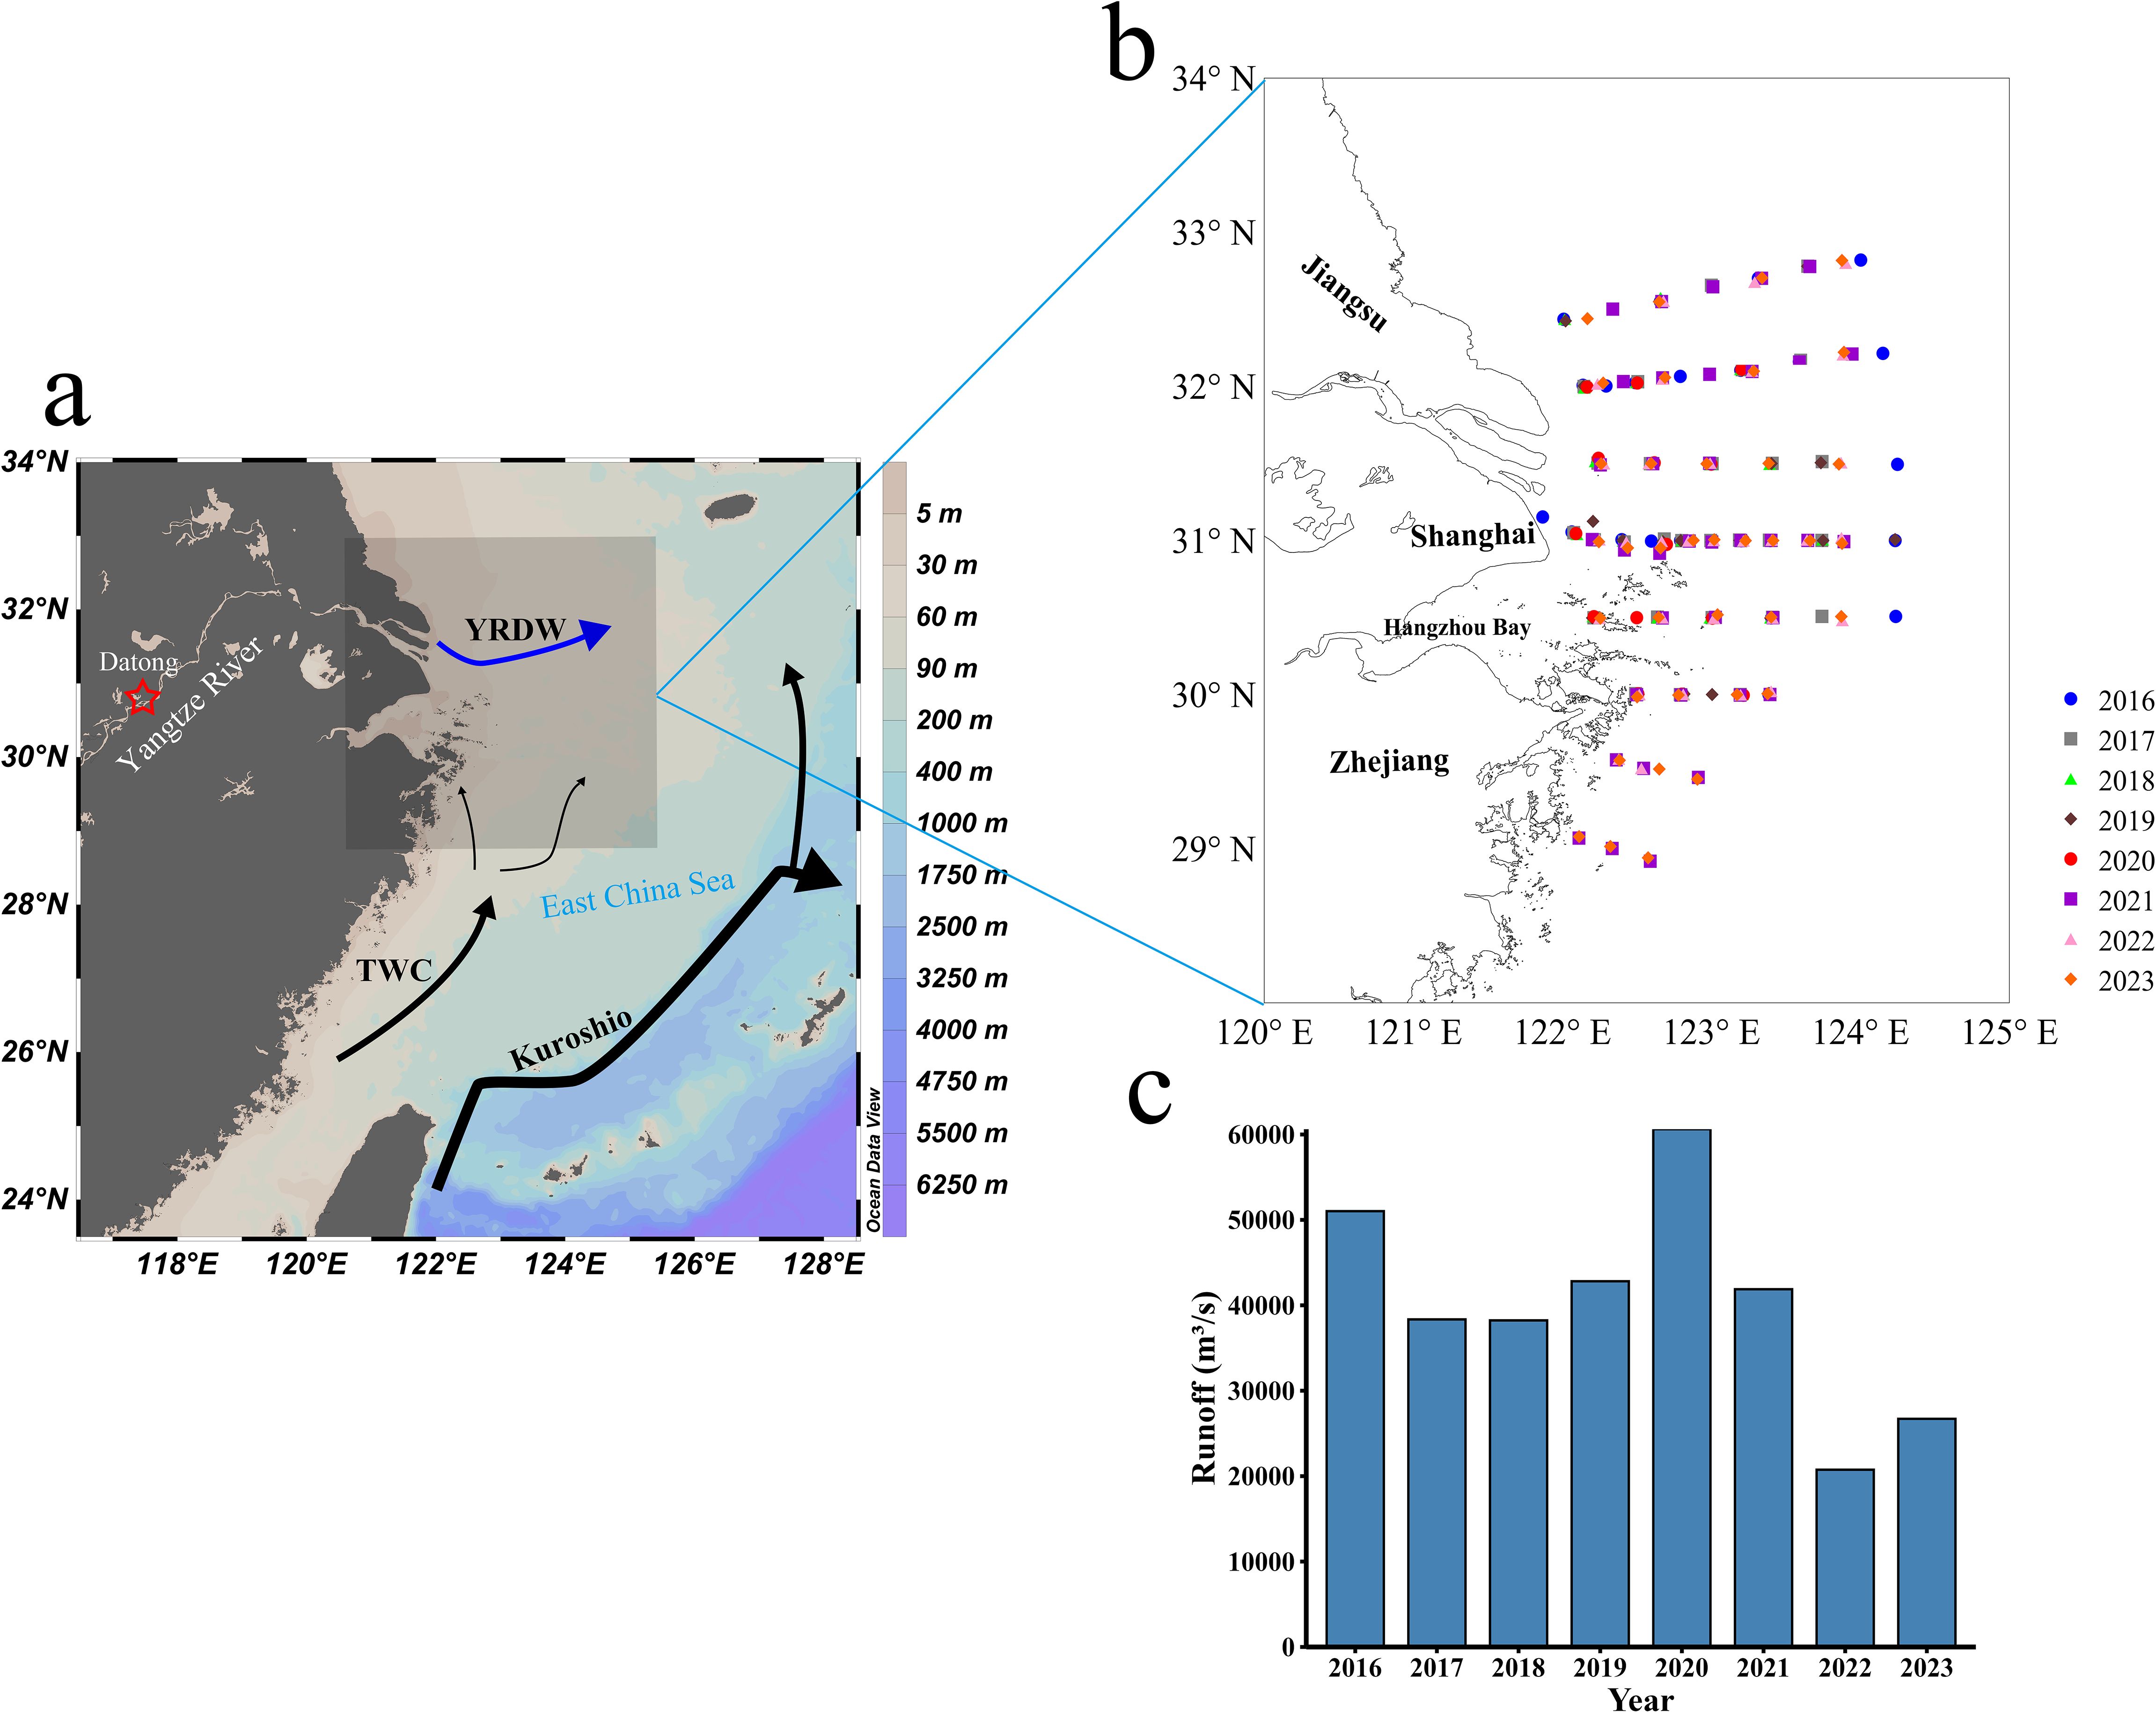
Figure 1. (a) Circulation in the East China Sea (modified from Sun et al., 2023); (b) Map of the sampling stations in summer during 2016 and 2023 in the YRE; (c) Monthly flow data for the Yangtze River sourced from the Datong Hydrological Gauge Station in August from 2016 to 2023. The arrows in (a) represent the Kuroshio, the TWC (Taiwan Warm Current), and the YRDW (Yangtze River Diluted Water). The red star indicates the location of Datong Hydrological Gauge Station.
Climate change and human activities have caused significant interannual variations in the Yangtze River’s runoff (Shang et al., 2023). Analysis of average monthly runoff data at Datong Station in August between 2016 and 2023 (Figure 1c) reveals considerable variability. August 2016 and 2020 recorded exceptionally high monthly runoff, characteristic of flood years, while August 2022 and 2023 experienced significantly reduced runoff, indicating drought years. The remaining years (2017, 2018, 2019, and 2021) demonstrated more typical, stable runoff levels.
Eight research cruises were conducted off in the waters off the YRE on the following dates: August 17-26, 2016; August 25-September 6, 2017; August 29-September 5, 2018; August 16-21, 2019; August 17-22, 2020; August 17-September 3, 2021; August 17-25, 2022; and August 20-27, 2023 (Figure 1b). Except for 2020, when zooplankton samples were collected using a plankton net (diameter 50 cm, mesh size 505 μm, and length 145 cm), in all other years, samples were collected using a plankton net (diameter 31.6 cm, mesh size 160 μm, and length 140 cm), equipped with a flow meter and hauled vertically from the bottom to the surface. The collected zooplankton samples were preserved in a buffered 5% formalin solution in 1-L plastic bottles. The volume of filtered water was estimated using the digital flow meter. The larger mesh size in 2020 likely resulted in the underestimation of smaller-size zooplankton taxa, leading to a potential sampling bias. However, the impact of this discrepancy was less, as we analyzed spatial variations in zooplankton communities influenced by sediment and plume fronts within every specific year independently.
In the laboratory, the zooplankton samples were filtered over a 160 μm mesh and weighed with a 0.1 mg electronic balance after picking out sundry items. Zooplankton abundance (ind/m3) was calculated by dividing the number of individuals by the volume of filtered water. Zooplankton biomass (mg/m3) was determined by dividing the wet weight of samples by the volume of filtered water. Taxonomic identification and enumeration were performed under a Zeiss SteREO Discovery V8 stereomicroscope. Adult zooplankton, crustacean larvae, and other larvae were identified to species, family, and class levels, respectively.
Environmental parameters including temperature, salinity and turbidity were measured using a Sea-Bird 911 Conductivity-Temperature-Depth (CTD) instrument (Sea-Bird Electronics Inc., USA). The calibration of CTD device was carried out by the National Center of Ocean Standards and Metrology for each cruise. The calibration was performed in the laboratory to ensure that the precision of temperature and conductivity reaches 0.001°C and 0.0003 S/m, respectively. Seawater samples for Chl a analysis were collected from the surface layer (2 m) and processed by filtering 100 mL of water through 0.7-μm GF/F filters (Whatman). The retained Chl a was then extracted in 90% acetone for 24 hours at −20°C and quantified using a Turner Design Fluorometer.
Plume fronts (salinity fronts) were generally defined as regions with significant salinity gradients, and in this study, the plume fronts were defined as the arrival location of water masses with salinity 28 as salinity gradients were significant for each year (Zhou et al., 2021; Beardsley et al., 1985).
The original zooplankton species abundance data (species-station matrix) were transformed using a Log(X+1) transformation to normalize the data. A hierarchical cluster analysis was then conducted using the Bray–Curtis similarity coefficient to classify all stations into distinct groups. These clusters were displayed on station maps for each year to visualize spatial patterns. Differences in zooplankton biomass and abundance among the groups were evaluated using the non-parametric Kruskal–Wallis test. The P-values for multiple comparisons were corrected using Bonferroni correction. To investigate the relationships between zooplankton biomass, abundance, and environmental factors (temperature, salinity, turbidity, and Chl a), Spearman correlation analysis was performed. Generalized additive models were employed to explore the potential influence of environmental variables on zooplankton biomass and abundance, with variables included in the model when p< 0.1. Canonical Correspondence Analysis (CCA) or Redundancy Analysis (RDA) was used to analyze the relationships between zooplankton community structure and environmental factors, following a preliminary Detrended Correspondence Analysis (DCA) to determine the appropriate method. The confidence intervals of Kruskal–Wallis test, Spearman correlation and CCA/RDA analysis were all set to 95%. Effect sizes (e.g., Cohen’s d or η²) were calculated where applicable.
The dominance index (Y) was calculated to identify the dominant zooplankton species using the formula:
In the formula, represented the number of individuals of species , represented the total number of zooplankton collected in the area, and represented the occurrence frequency of species at all stations. A species was considered dominant if ≥ 0.02.
Distribution maps for salinity, temperature, turbidity, and Chl a for each year were generated using Ocean Data View. Cluster analysis was conducted using Primer 6 (Plymouth Marine Laboratory, UK). Results of cluster analysis, and the spatial and temporal distributions of zooplankton biomass and abundance were visualized using Surfer 18. The non-parametric Kruskal–Wallis test was performed using IBM SPSS Statistics 27. PCoA analysis, Spearman analysis and GAM model were conducted using Python 3.10. CCA and RDA were performed using Canoco 5.
From 2016 to 2023, the surface salinity, temperature, turbidity and Chl a in the YRE exhibited significant interannual variability, closely related to the variations in Yangtze River runoff.
During flood years (2016 and 2020), low-salinity water expanded considerably outward, forming pronounced salinity fronts (the arrival location of water masses with salinity 28 defined in 2.3) that pushed further into the open sea. In 2016, the salinity fronts reached approximately 123.5°E (Figure 2a), while in 2020, they extended to 124°E or even further (Figure 2e). During drought years (2022 and 2023), the salinity fronts retracted significantly, with its position closer to the estuary at around 123°E or even closer (Figures 2g, h). During normal years (2017, 2018, 2019 and 2021), the salinity fronts displayed moderate positioning. In 2017, 2018 and 2019, the salinity fronts extended to 123°E (Figures 2b–d), whereas in 2021, they extended to 123.5°E or even further (Figure 2f).
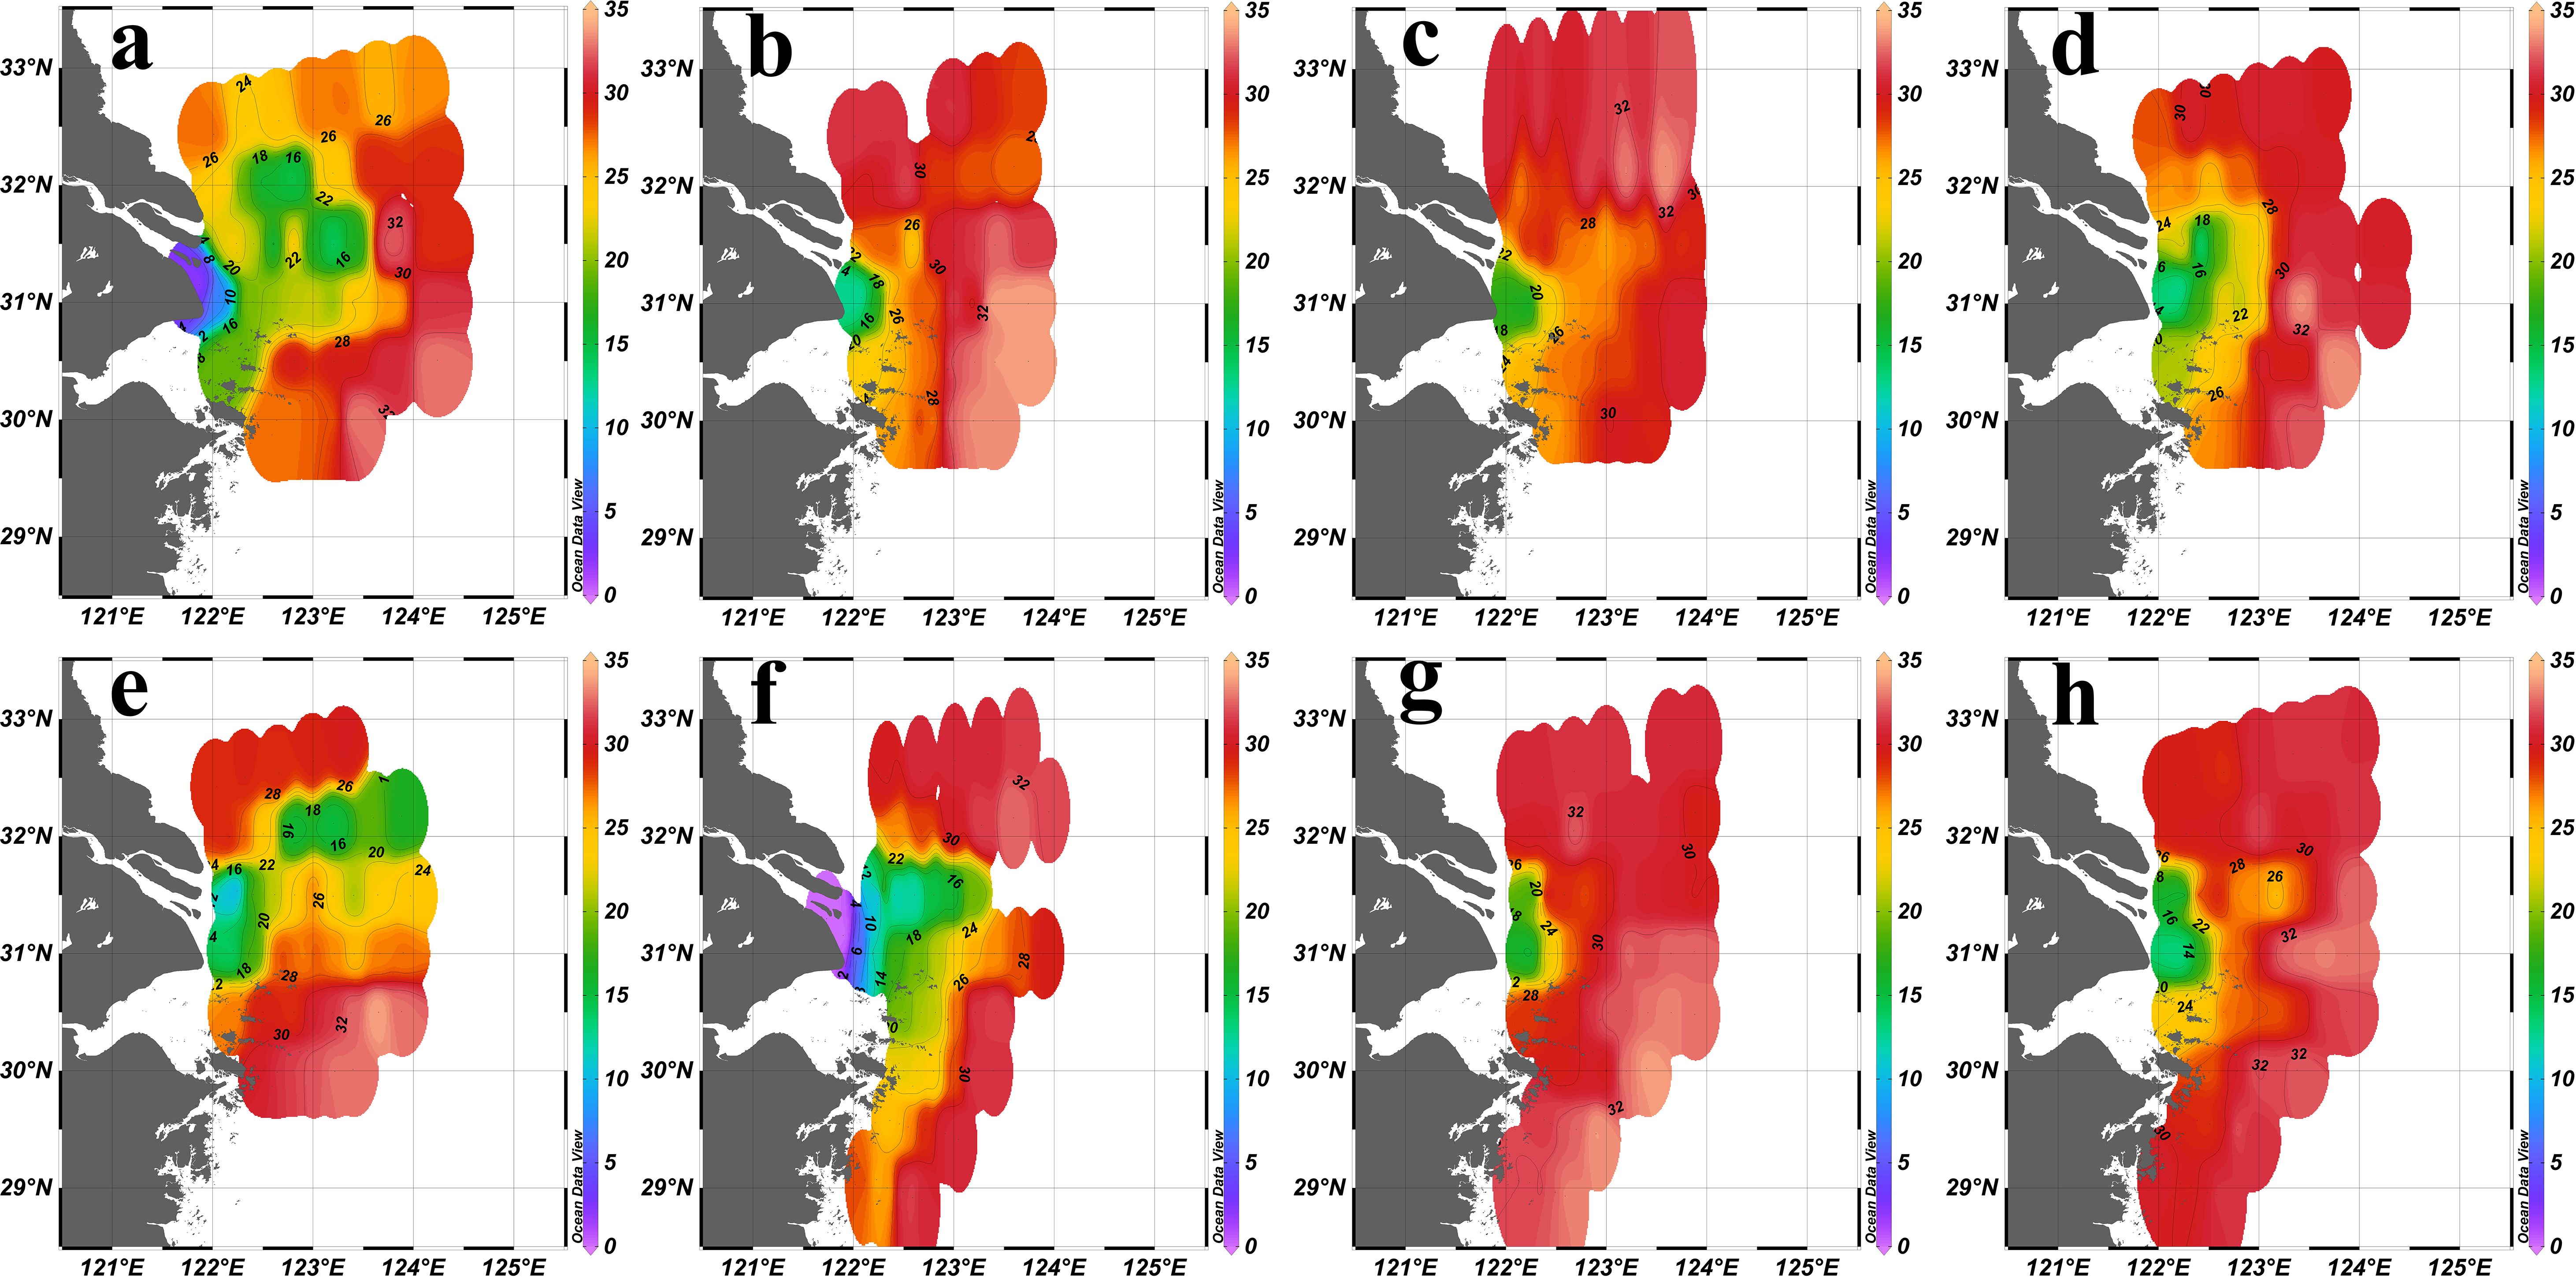
Figure 2. Sea surface (2 m) salinity distribution in the YRE in summer from 2016 to 2023. (a): 2016; (b):2017; (c):2018; (d):2019; (e): 2020; (f):2021; (g):2022; (h):2023.
During flood years (2016 and 2020), the large influx of freshwater created a pronounced temperature gradient in the estuary (Figures 3a, e). During drought years (2022 and 2023) and normal years (2017, 2018, 2019 and 2021), the temperature gradient was less pronounced (Figures 3b–d, f–h).
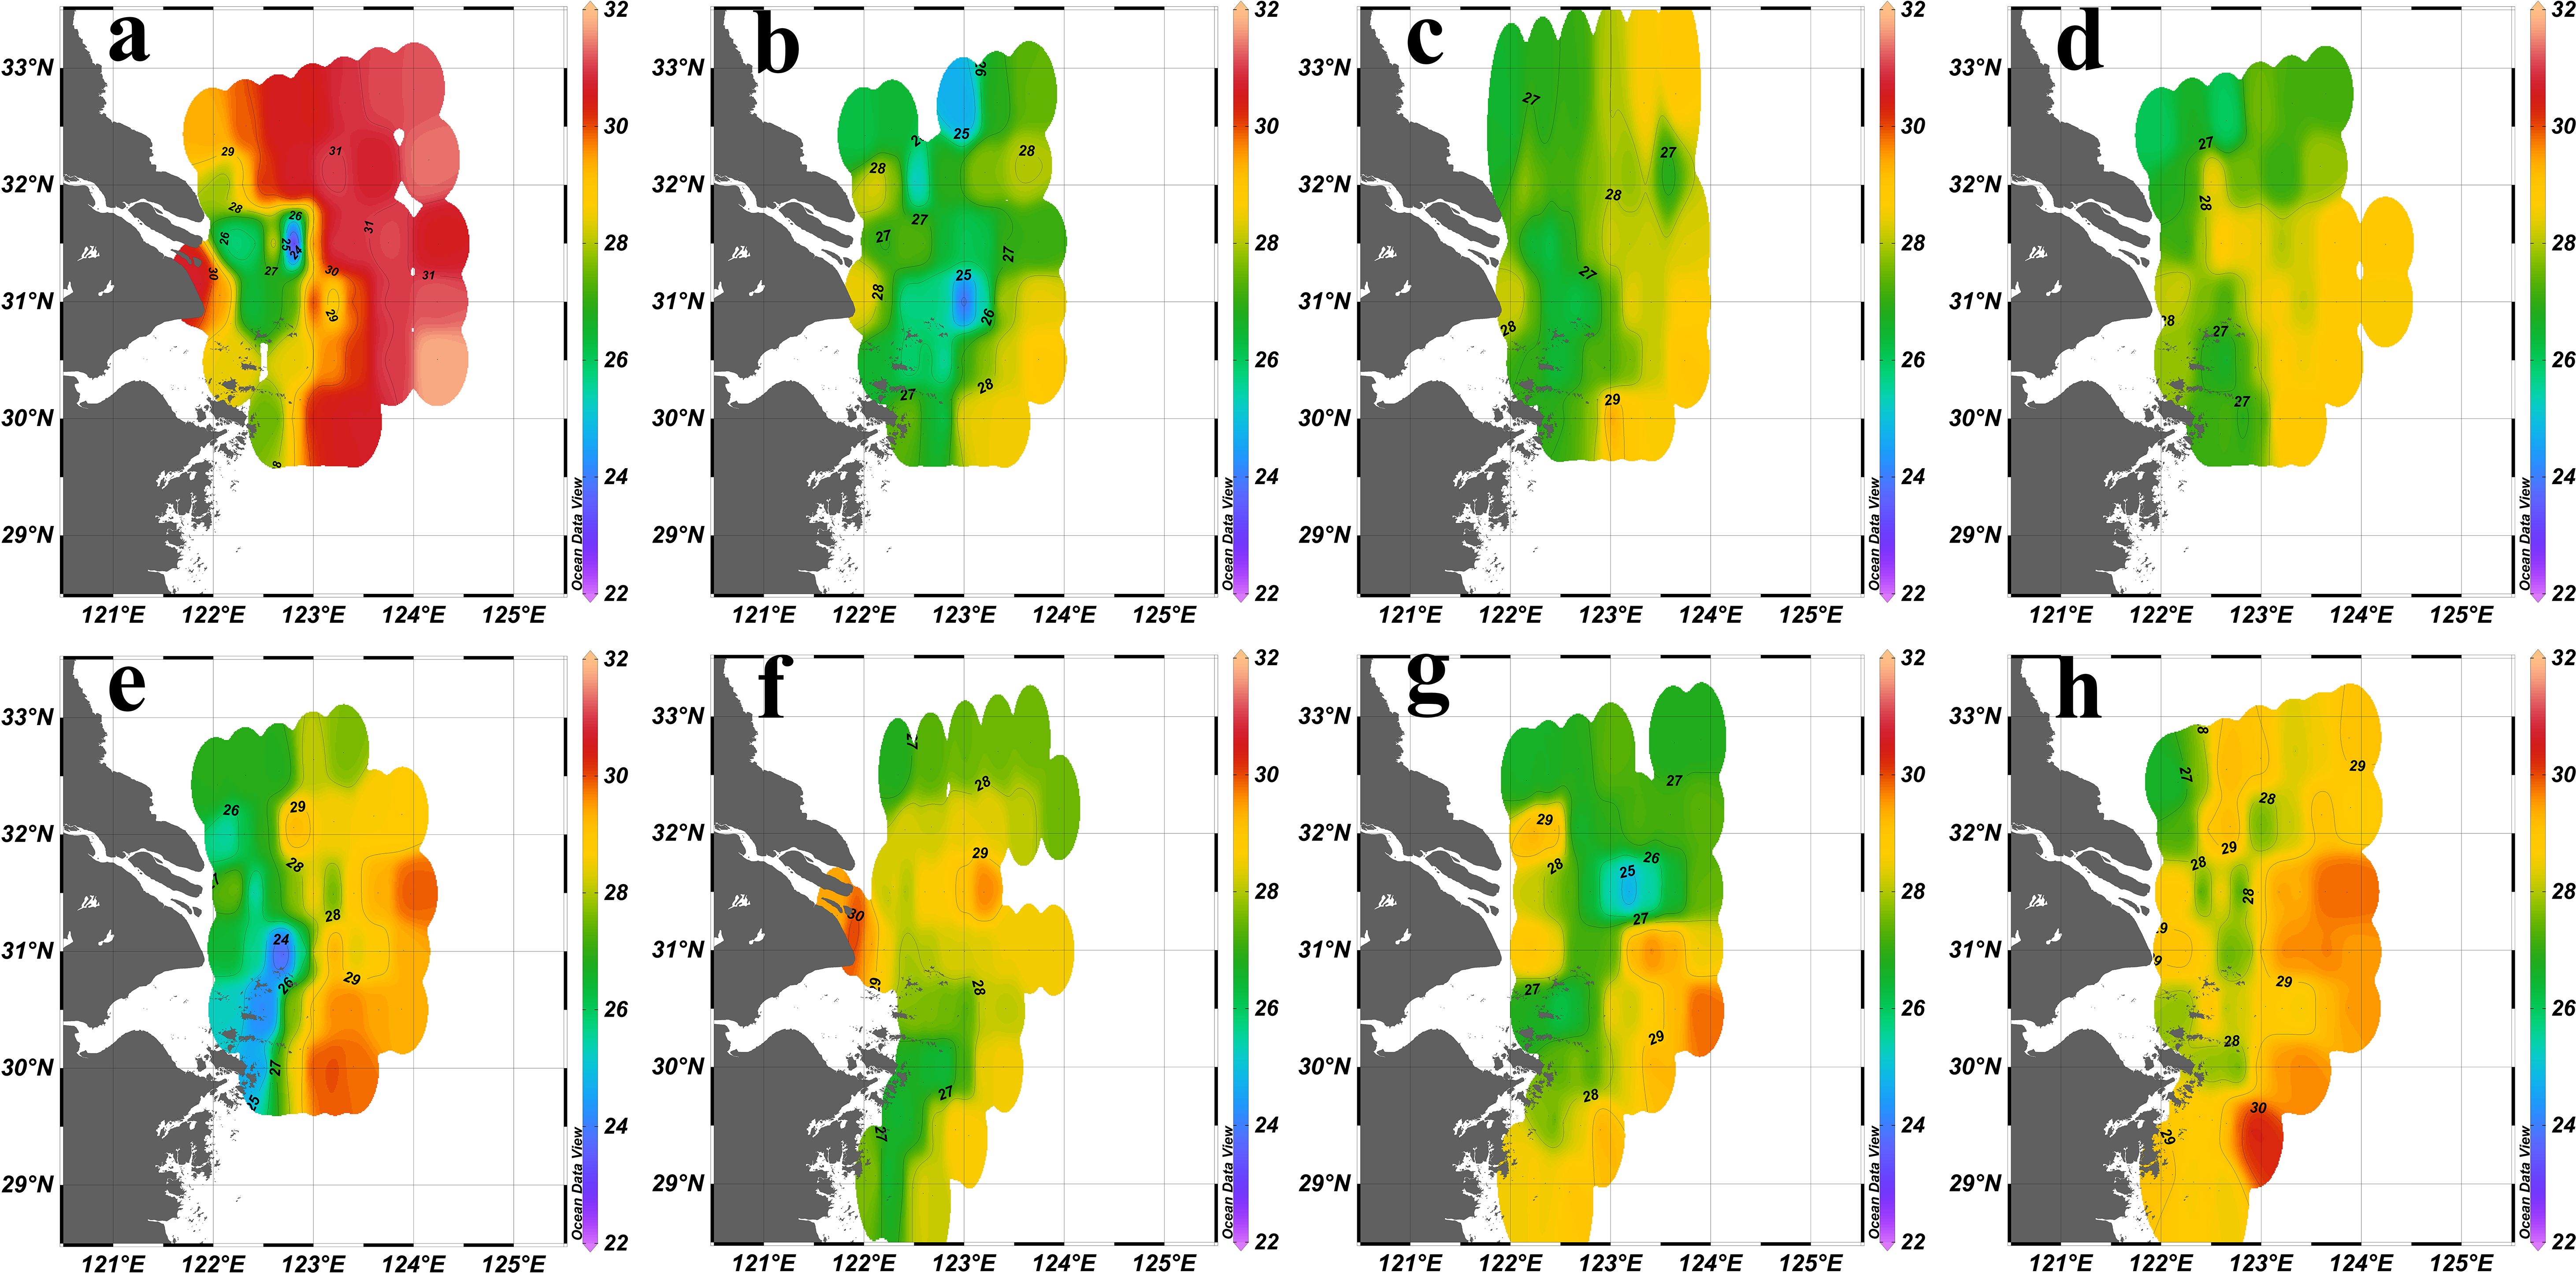
Figure 3. Sea surface (2 m) temperature (℃) distribution in the YRE in summer from 2016 to 2023. (a): 2016; (b):2017; (c):2018; (d):2019; (e): 2020; (f):2021; (g):2022; (h):2023.
During flood years (2016 and 2020), suspended particle concentrations surged (ranged from 0.025 to 120.000 NTU in 2016, ranged from 0.013 to 241.035 NTU in 2020), resulting in a pronounced turbidity gradient at the estuary, with the sediment fronts becoming prominent and located near 122.5°E (Figures 4a, e). During drought years (2022 and 2023), the concentration of suspended particles decreased significantly (ranged from 0.007 to 35.091 NTU in 2022, ranged from 0.629 to 19.451 NTU in 2023), leading to a less obvious turbidity gradient at the estuary, causing the sediment fronts to almost disappear (Figures 4g, h). During normal years (2017, 2018, 2019, 2021), the suspended particles concentrations were moderate, and sediment fronts remained within 122.5°E (Figures 4b–d, f).
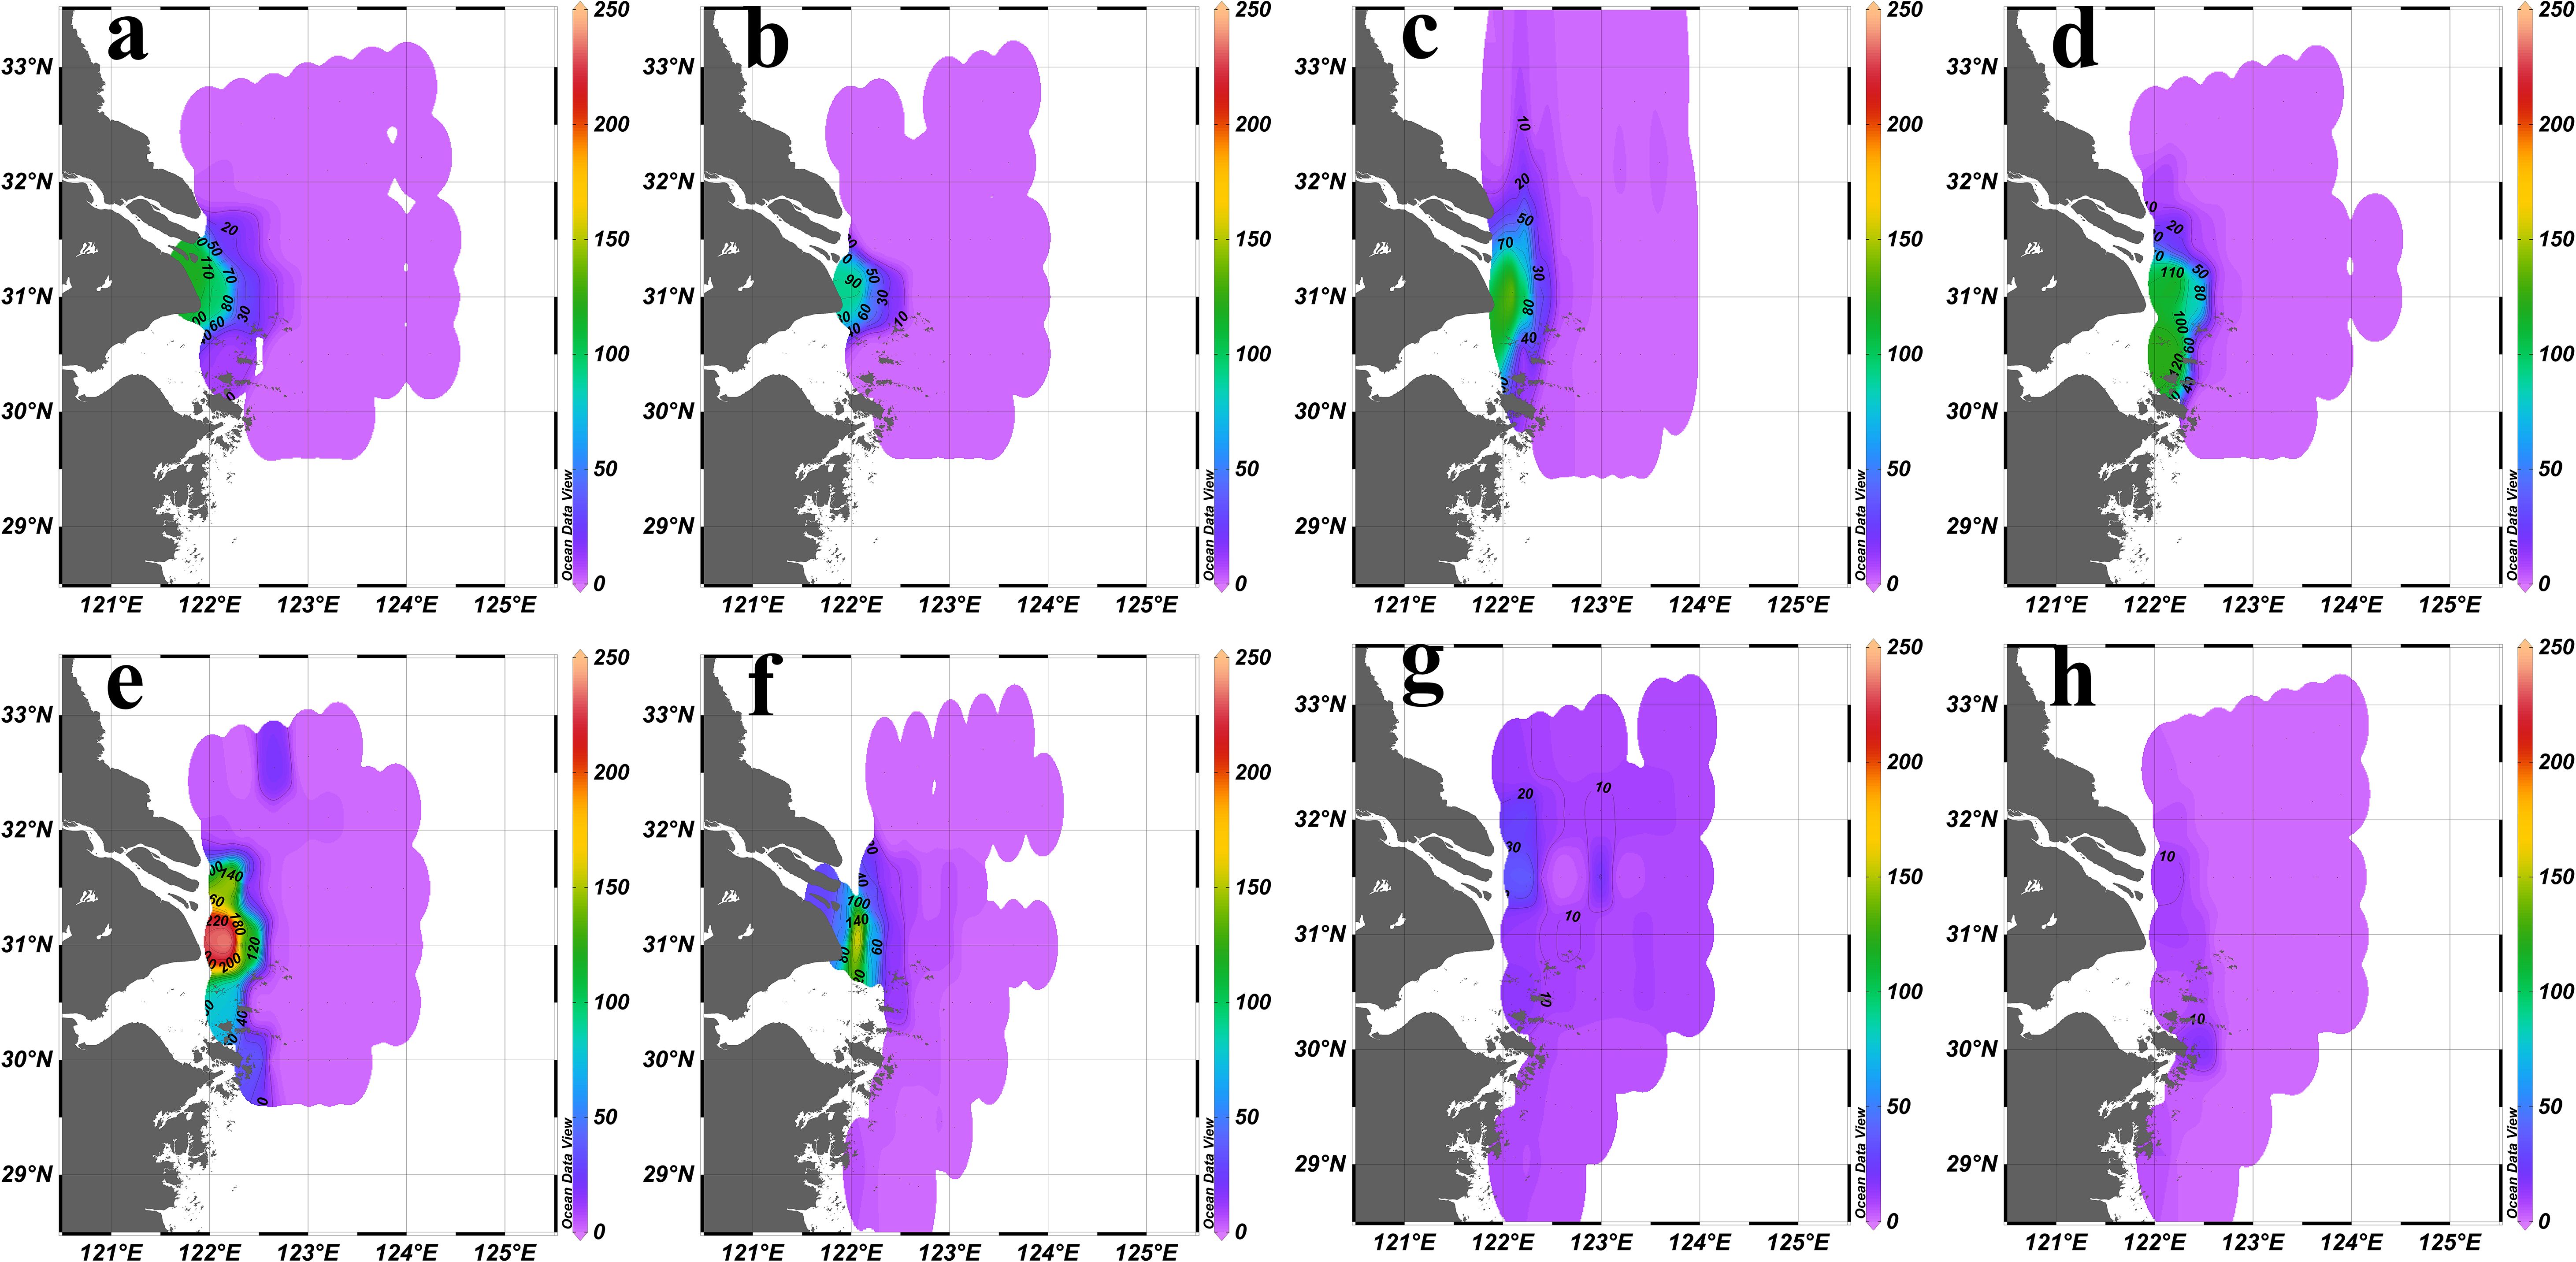
Figure 4. Sea surface (2 m) turbidity (NTU) distribution in the YRE in summer from 2016 to 2023. (a): 2016; (b):2017; (c):2018; (d):2019; (e): 2020; (f):2021; (g):2022; (h):2023.
The “sandwich” spatial pattern of Chl a could be observed almost every year. However, the location of the fronts and the value of the peak varied from year to year. In 2016, the Chl a fronts located between 122.5°E and 123°E with the highest value 22.87 μg/L at around 31.5°N (Figure 5a). In 2020, the Chl a fronts were observed between 122.5°E and 124°E with the highest value 29.62 μg/L at around 32°N; another area with the higher Chl a value was located in the northwest of the survey area (Figure 5e). In 2021, the Chl a fronts appeared near 123°E with the highest value 29.77 μg/L between 31°E and 32°N; another point with the higher Chl a value was located at 122.3°E, 31.5°E (Figure 5f). In 2022, the Chl a “sandwich” fronts appeared along 122.5°E, while the highest value 24.16 μg/L was located at 122.1°E, 29.1°E (Figure 5g). In 2023, the Chl a fronts appeared near 123°E with the highest value 29.28 μg/L between 32°N and 33°N (Figure 5h). For the other three years, the peak values were lower (17.11 μg/L in 2017, 11.65 μg/L in 2018 and 11.16 μg/L in 2019), with the fronts near 122.5°E or 123°E (Figures 5b–d).
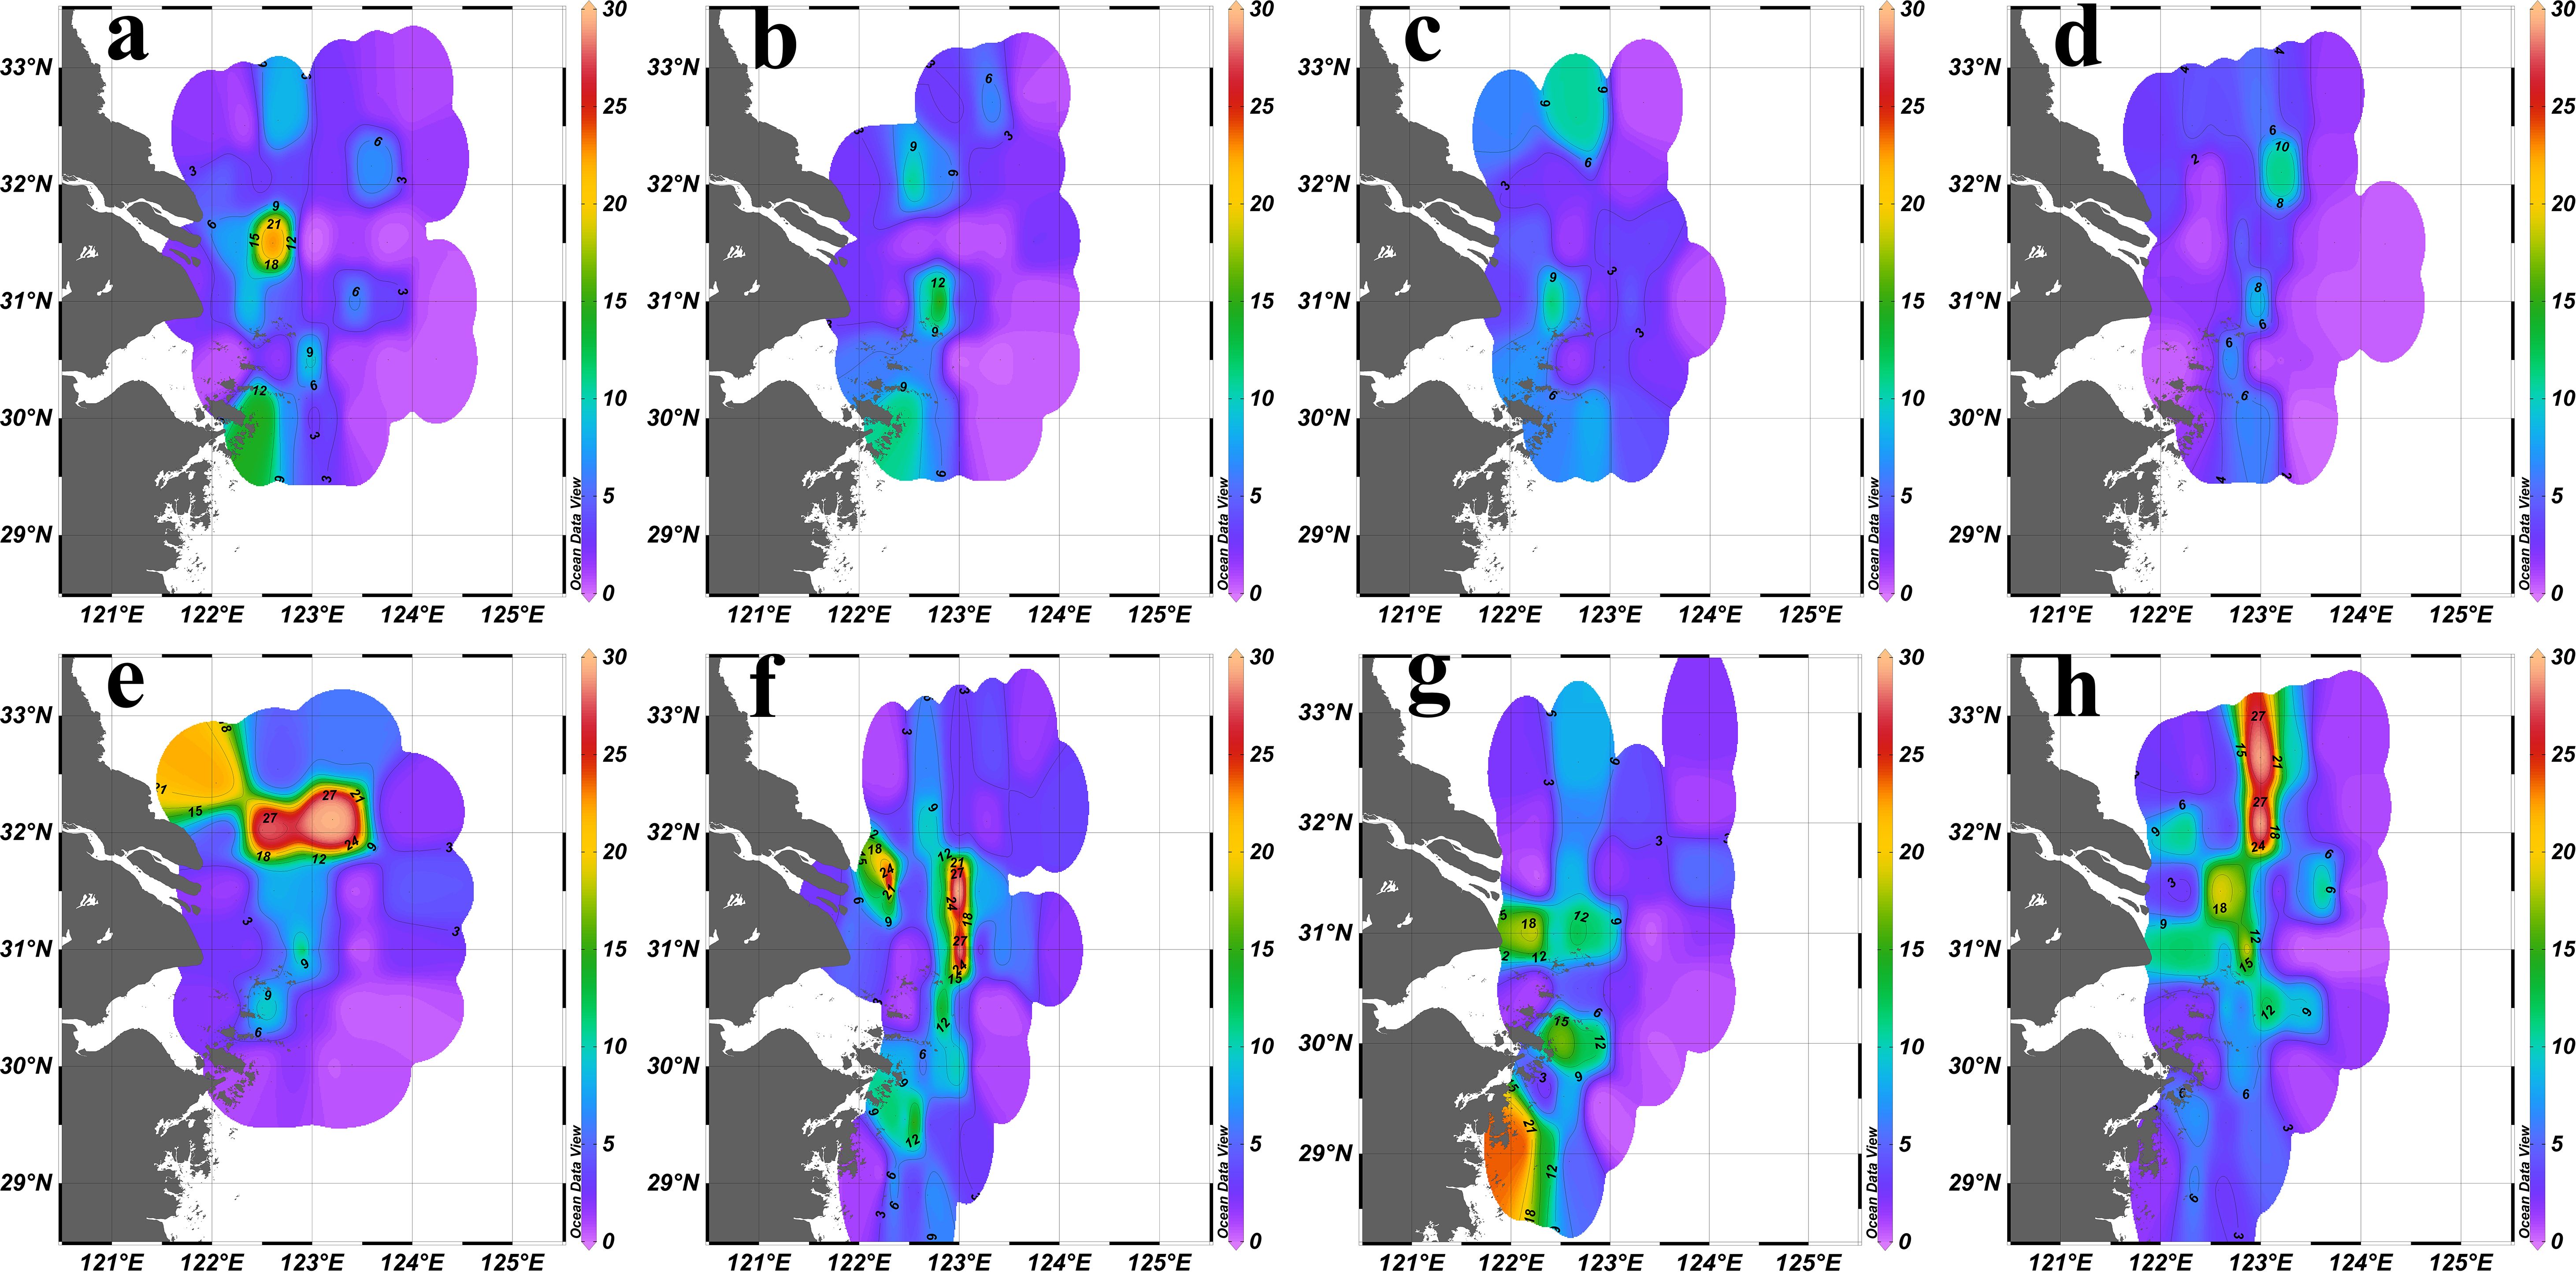
Figure 5. Surface (2 m) Chl a concentration (μg/L) distribution in the YRE in summer from 2016 to 2023. (a): 2016; (b):2017; (c):2018; (d):2019; (e): 2020; (f):2021; (g):2022; (h) :2023.
The species composition, dominant species, biomass, and abundance of zooplankton community in summer in the YRE exhibited substantial interannual variability from 2016 to 2023, closely related to the changes in Yangtze River runoff.
Except the year of 2022, the zooplankton communities were spatially divided into four groups in most years (Figures 6a–f, h). Group I was primarily located in west of 122.5°E, Group II was found between 122.5°E and 123°E, while Groups III and IV were situated in the outer estuary (Figure 6). In 2022, the zooplankton communities were categorized into either Group III or Group IV (Figure 6g).
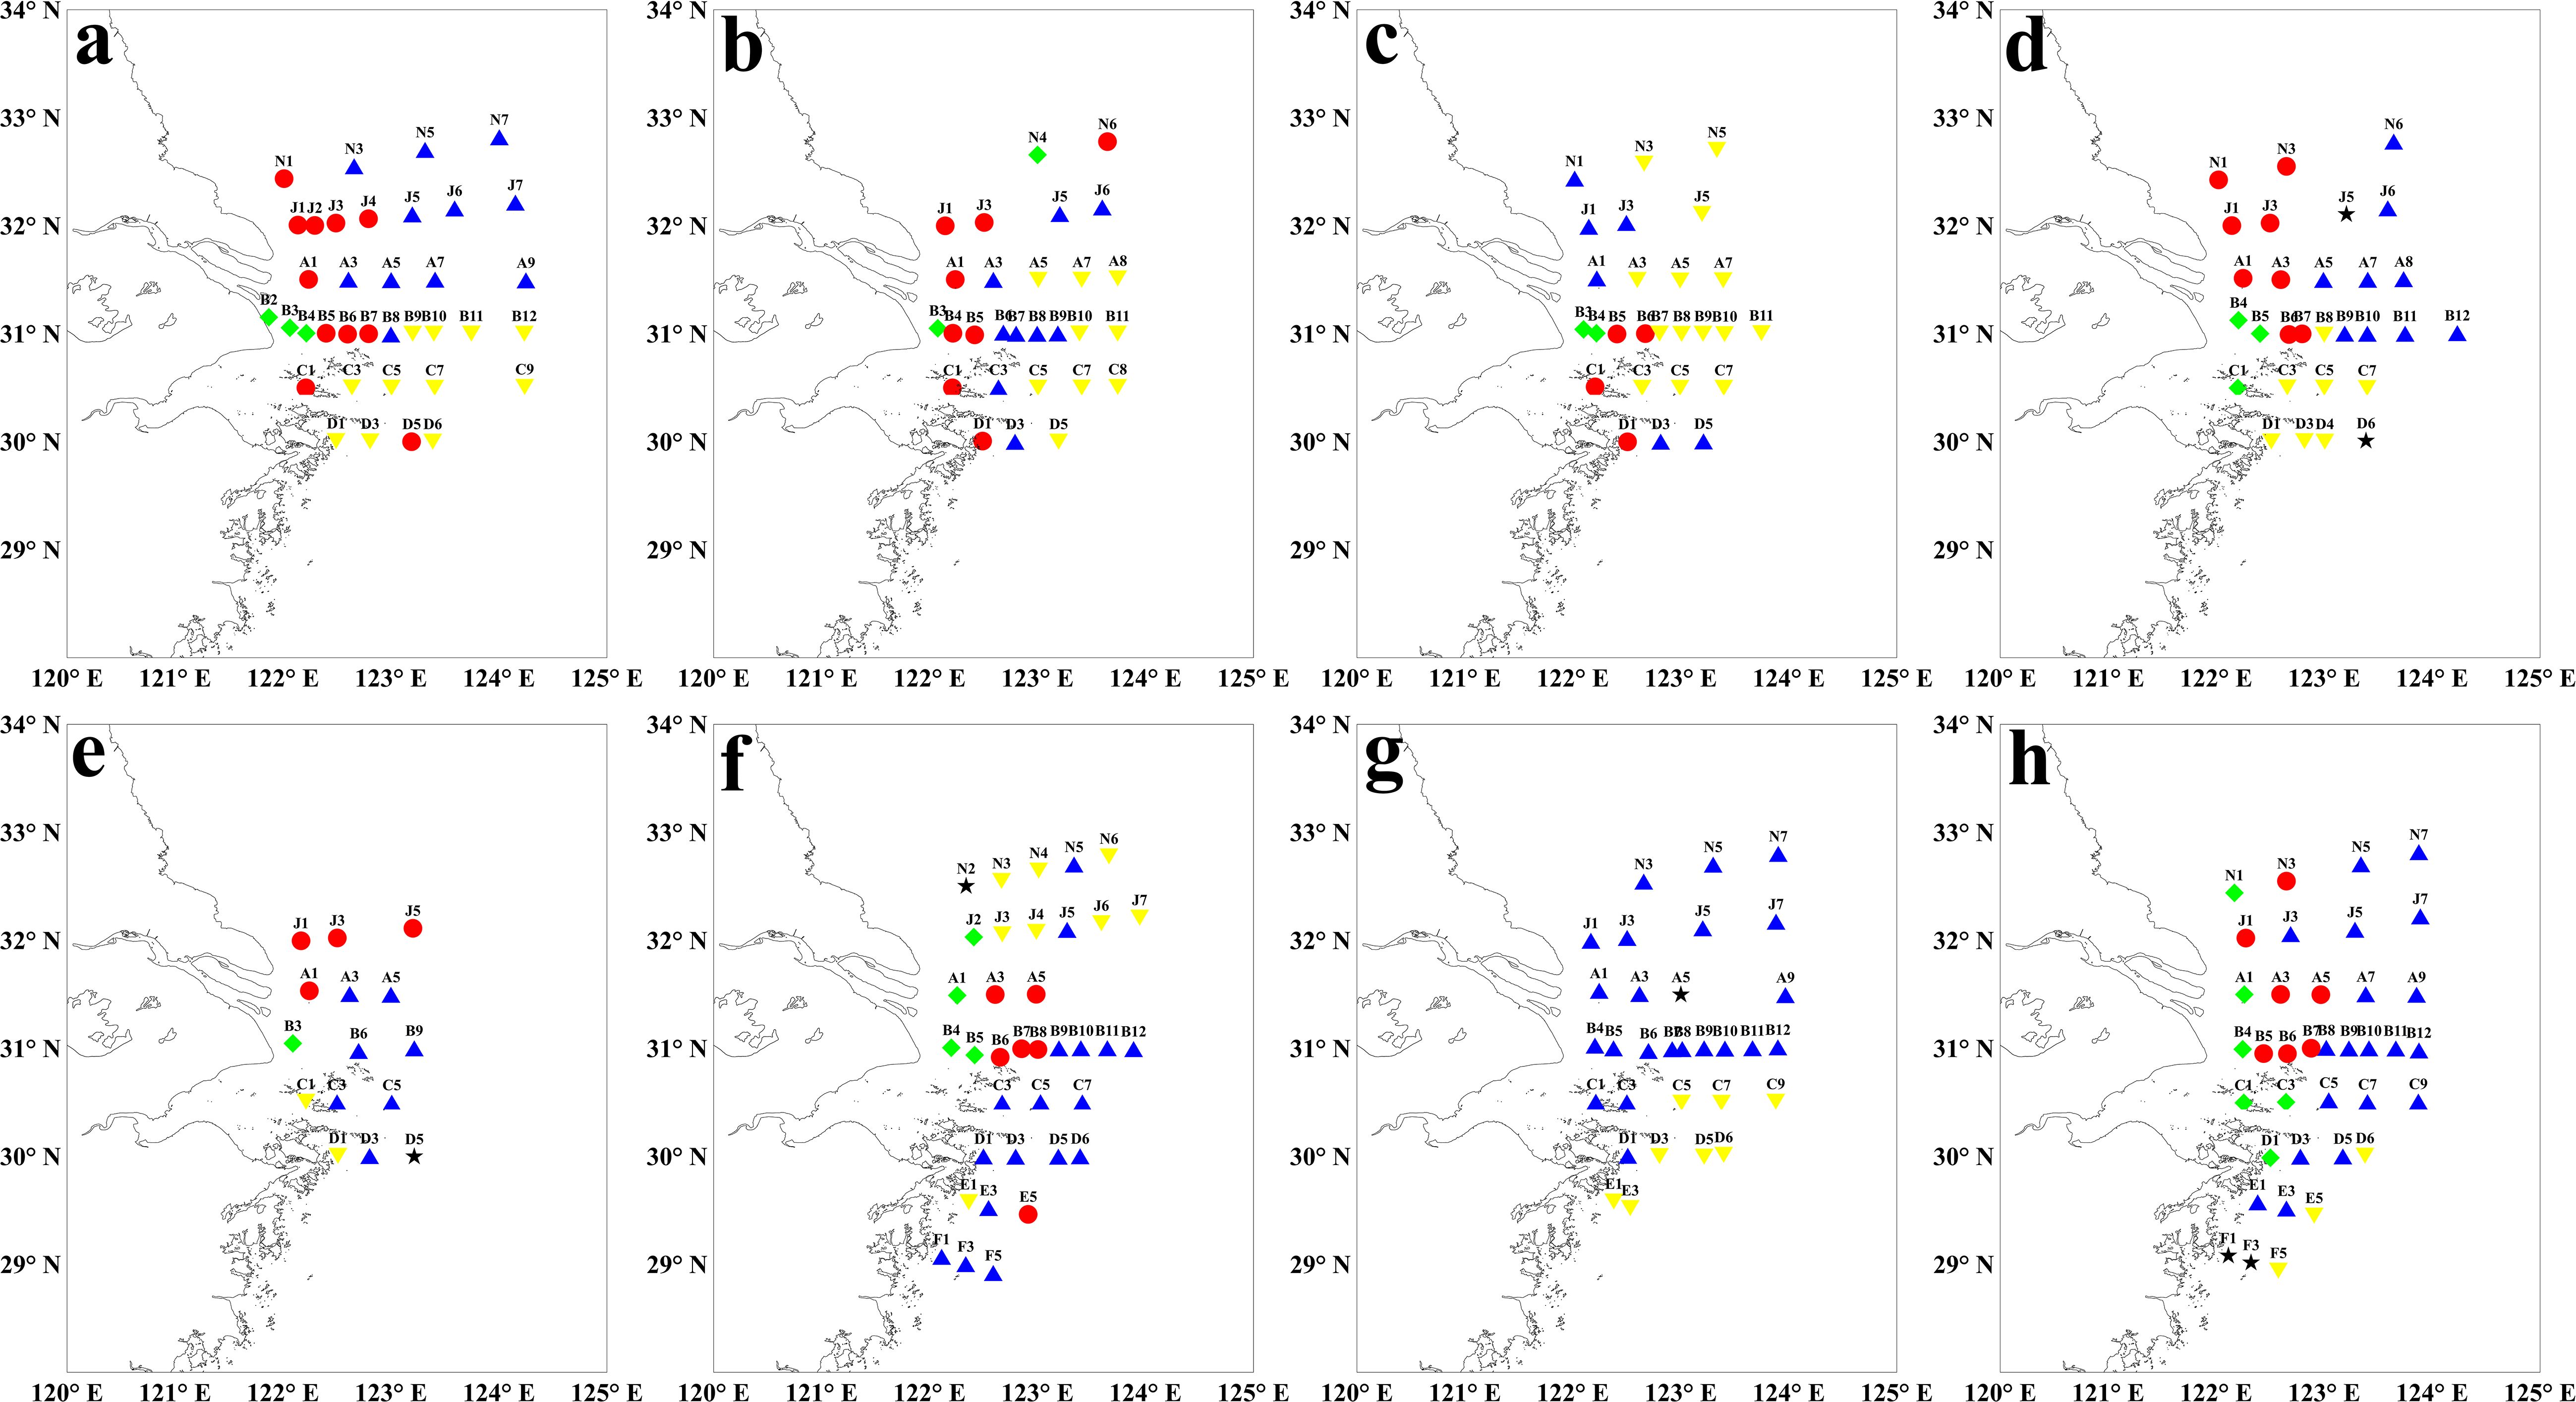
Figure 6. Zooplankton communities based on taxon abundance in summer from 2016 to 2023. (a): 2016; (b):2017; (c):2018; (d):2019; (e): 2020; (f):2021; (g):2022; (h):2023. The green diamond represented Group I, the red circle represented Group II, the blue triangle represented Group III, and the yellow inverted triangle represented Group IV. The zooplankton samples in 2020 were collected using a plankton net with mesh size of 505μm, while in the other years, using the plankton net with mesh size of 160μm.
The PCoA analysis revealed distinct patterns in zooplankton community structure under varying Yangtze River runoff conditions (Figure 7). During flood years, zooplankton communities displayed clear group separations, with 2016 and 2020 showing notable distinctions, influenced by different size of plankton nets (Figure 7a). Community distributions in 2022 and 2023 (Figure 7b) also exhibited separation, particularly highlighting the uniqueness of 2022, where only two groups were observed. Group I was predominantly influenced by the strong effects of YRDW, while Groups III and IV were primarily shaped by the influence of oceanic waters, with the two groups remaining largely independent. In contrast, Group II was affected by both YRDW and oceanic waters, resulting in overlaps with both Group I, Groups III and IV (Figures 7a, b). In normal years, the groups largely overlapped, indicating high species similarity across the community (Figure 7c).
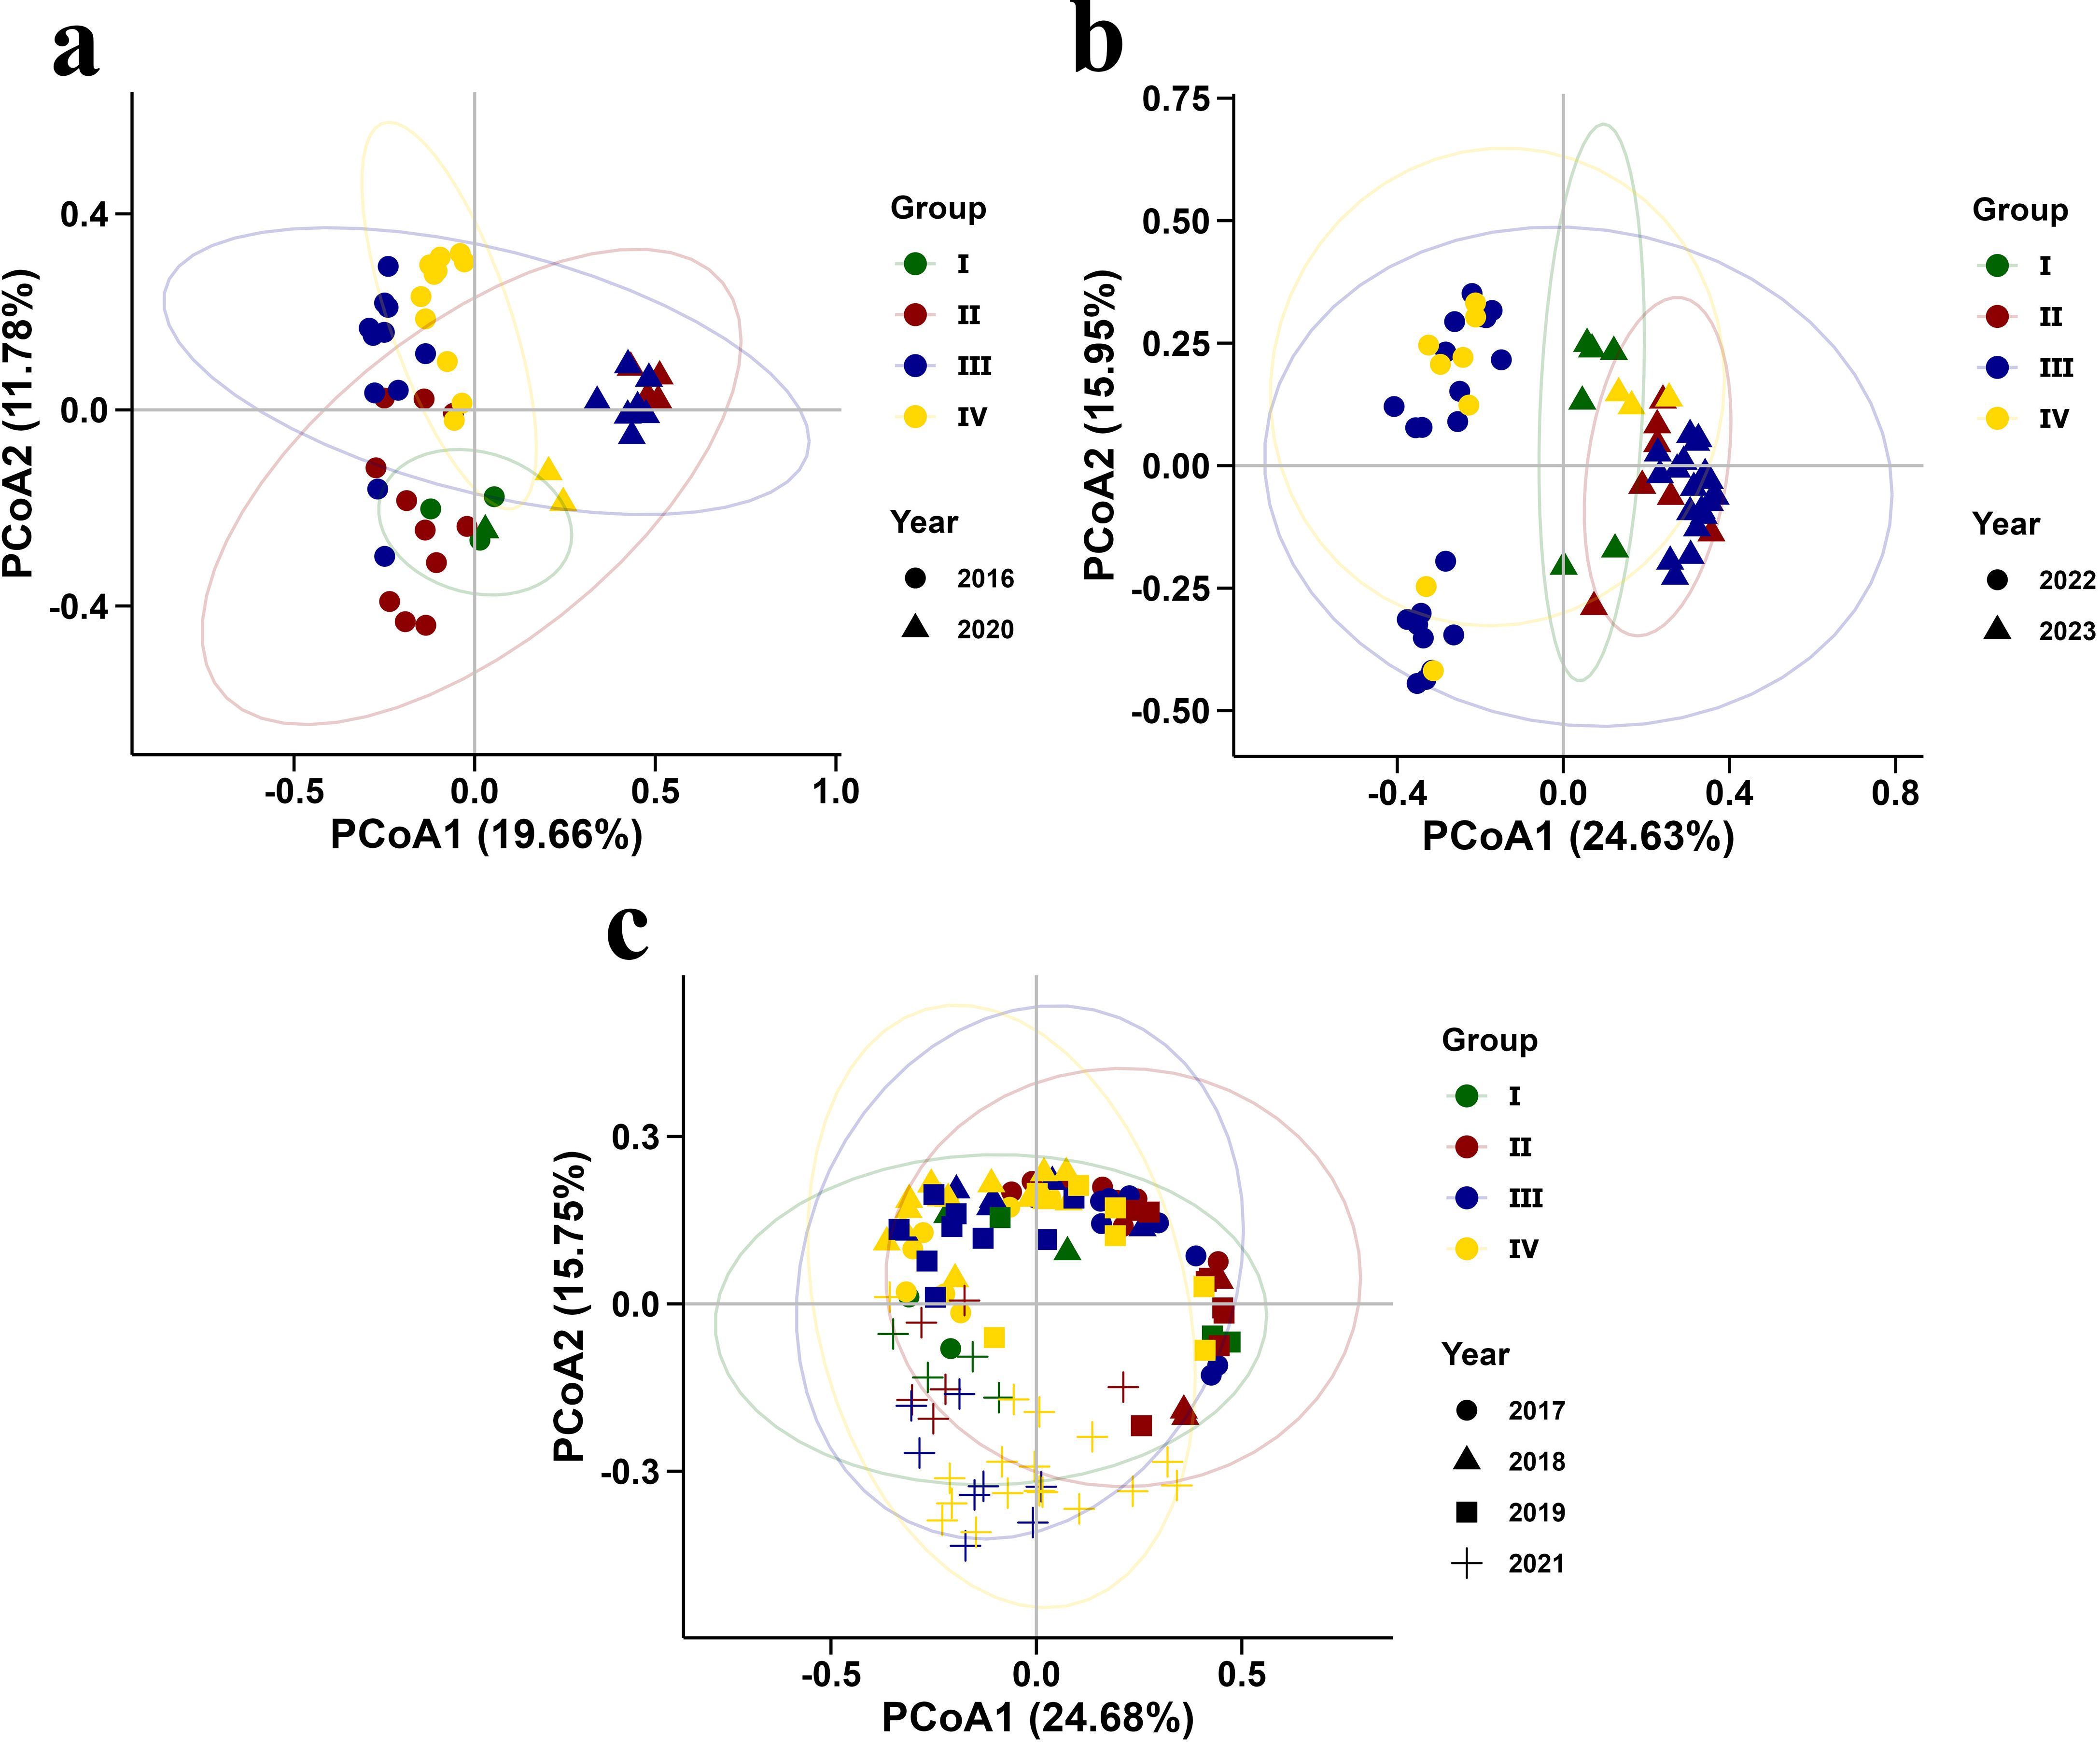
Figure 7. PCoA results of zooplankton communities based on taxon abundance in summer from 2016 to 2023.
Copepods consistently represented the dominant zooplankton taxa in terms of species number and abundance across all years. Among them, Paracalanus aculeatus was either the first or second dominant species each year. During flood years, low-salinity nearshore species such as Oithona brevicornis and Centropages dorsispinatus exhibited a notable increase in dominance, becoming the main dominant species in 2016 (Figure 8). During drought years, the eurythermal and euryhaline species, such as Microsetella rosea, showed a significant rise in dominance, becoming the first dominant species (Figure 8).
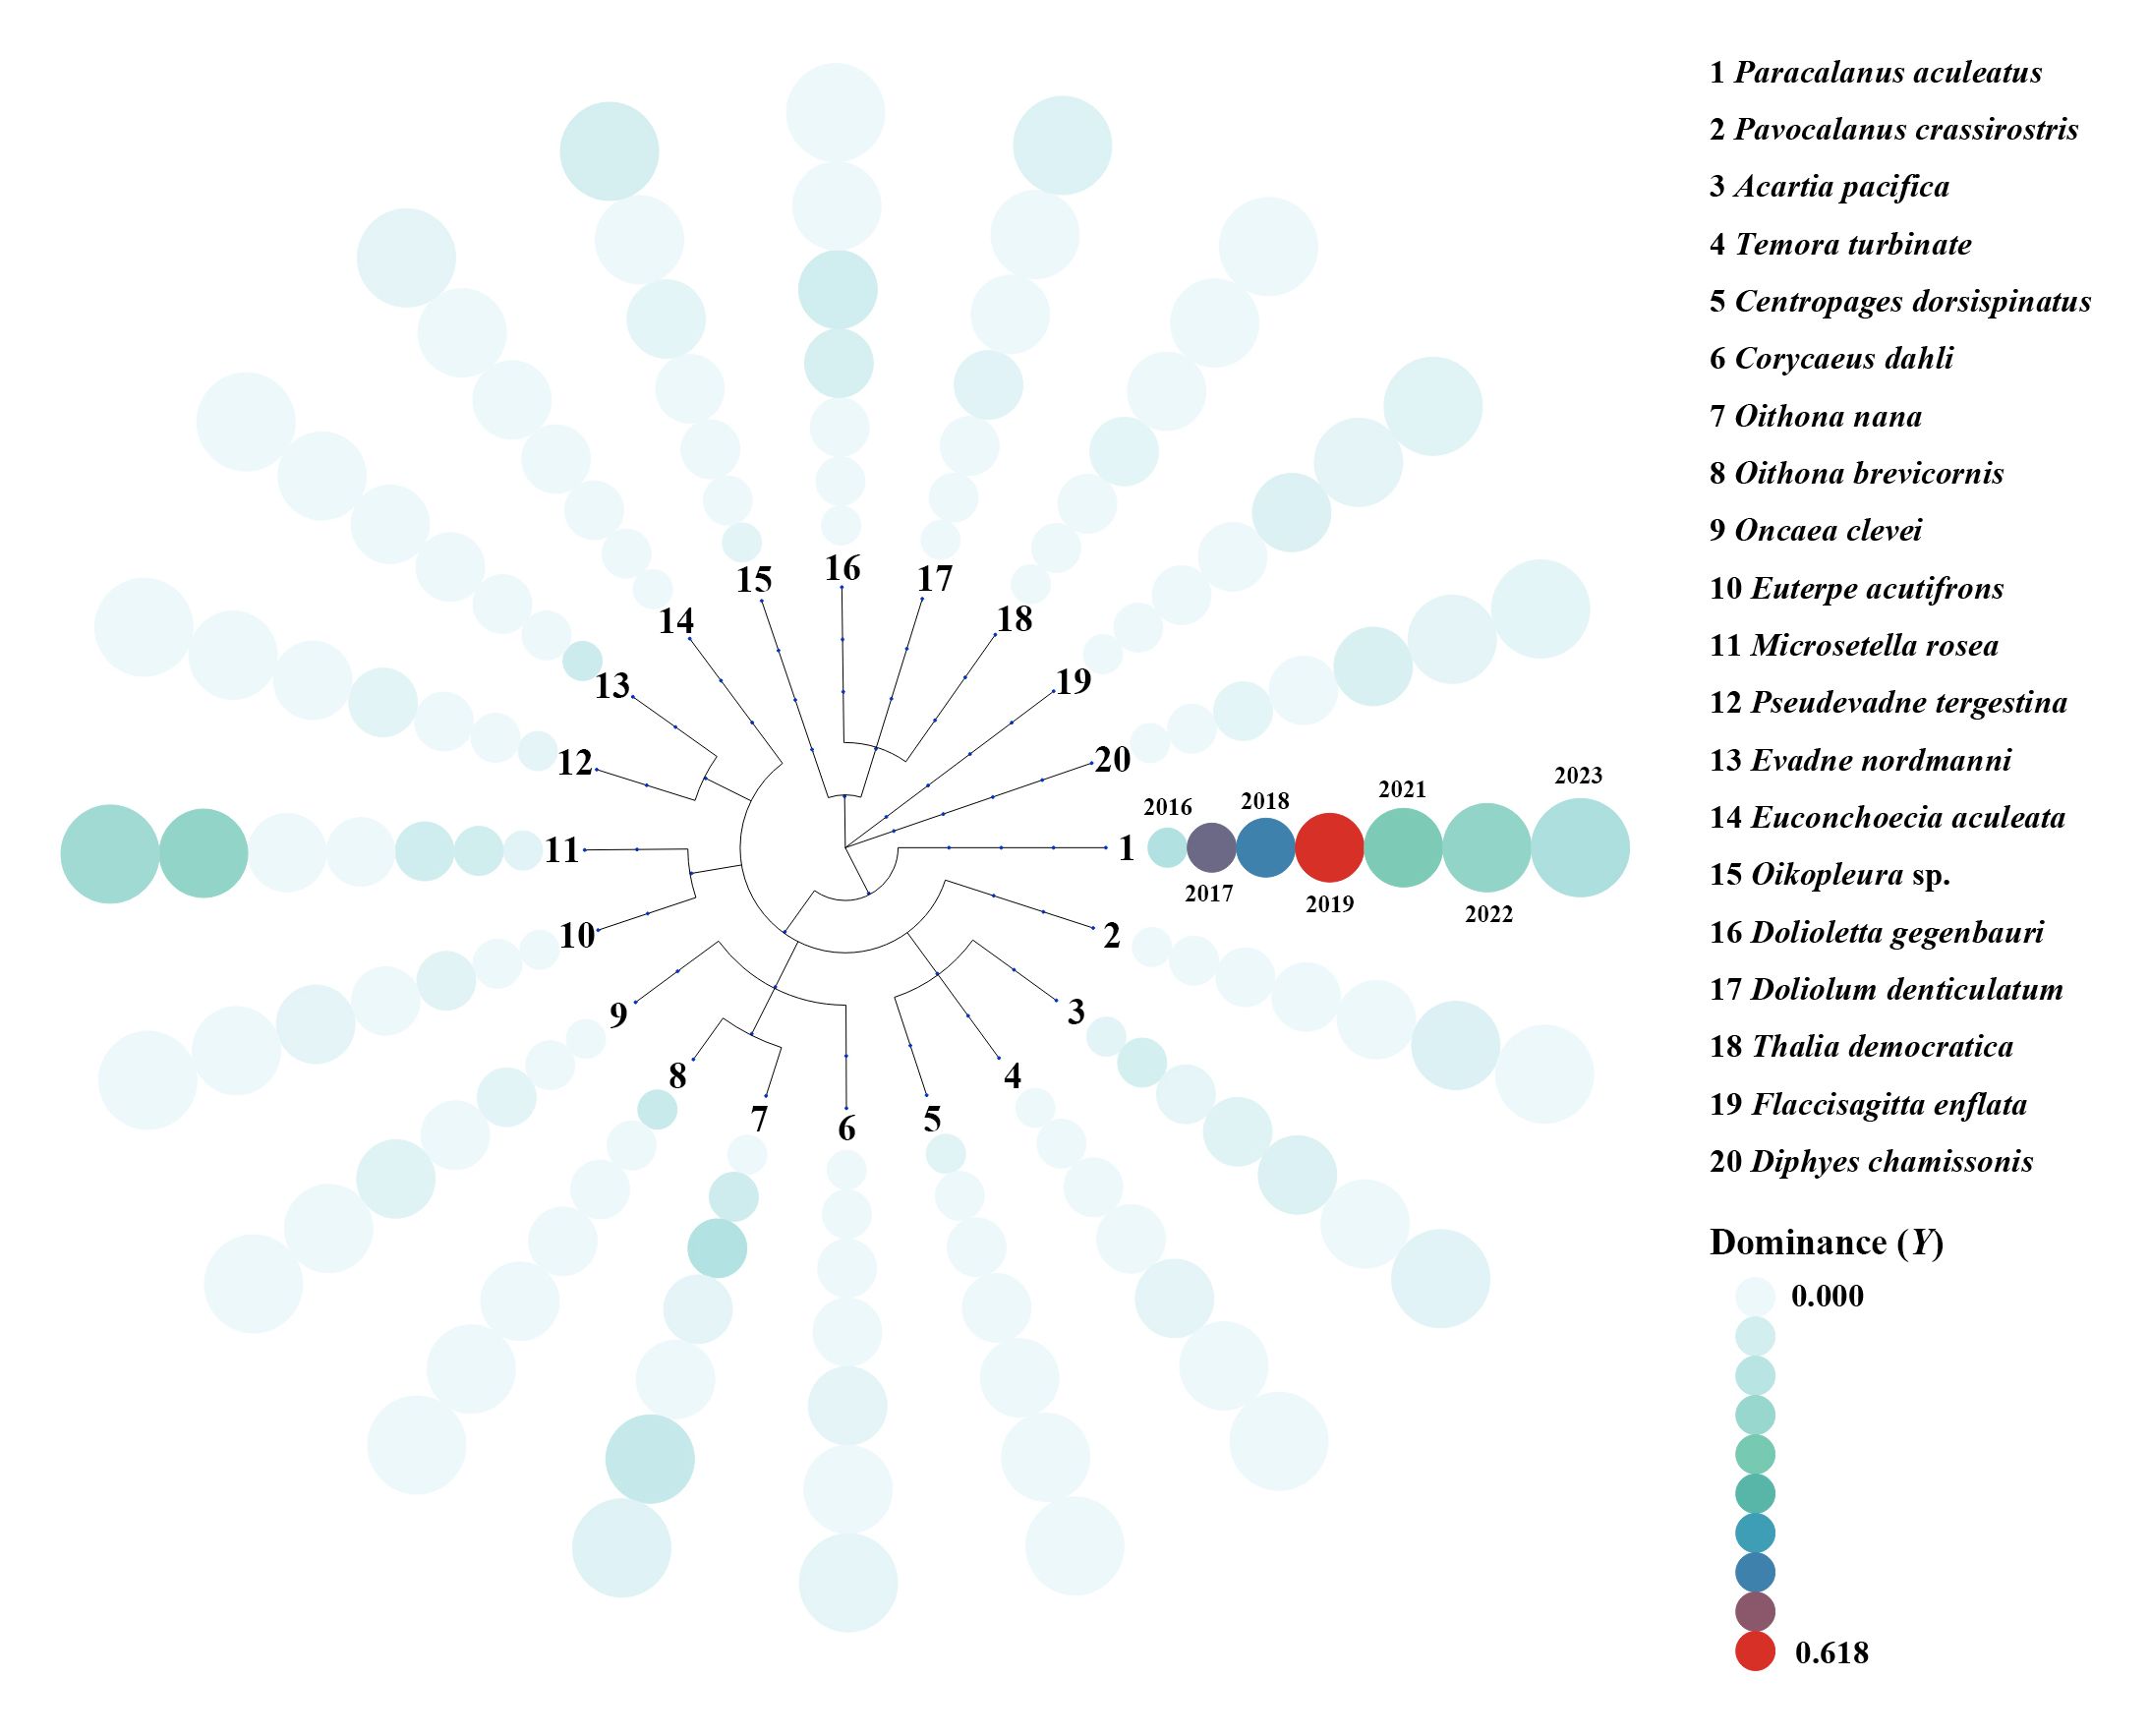
Figure 8. Dominance index () (Equation 1) of dominant zooplankton species in summer from 2016 to 2023. The dominant species in 2020 were not listed here, as the sampling net in 2020 was different from the other years, and then the dominant species were not comparable with the other years.
The mean biomass and abundance of zooplankton in summer in our study area varied between 616 to 2049 mg/m3 and 3254.95 to 13072.42 ind/m3, respectively, from 2016 to 2023 (Figures 9, 10).
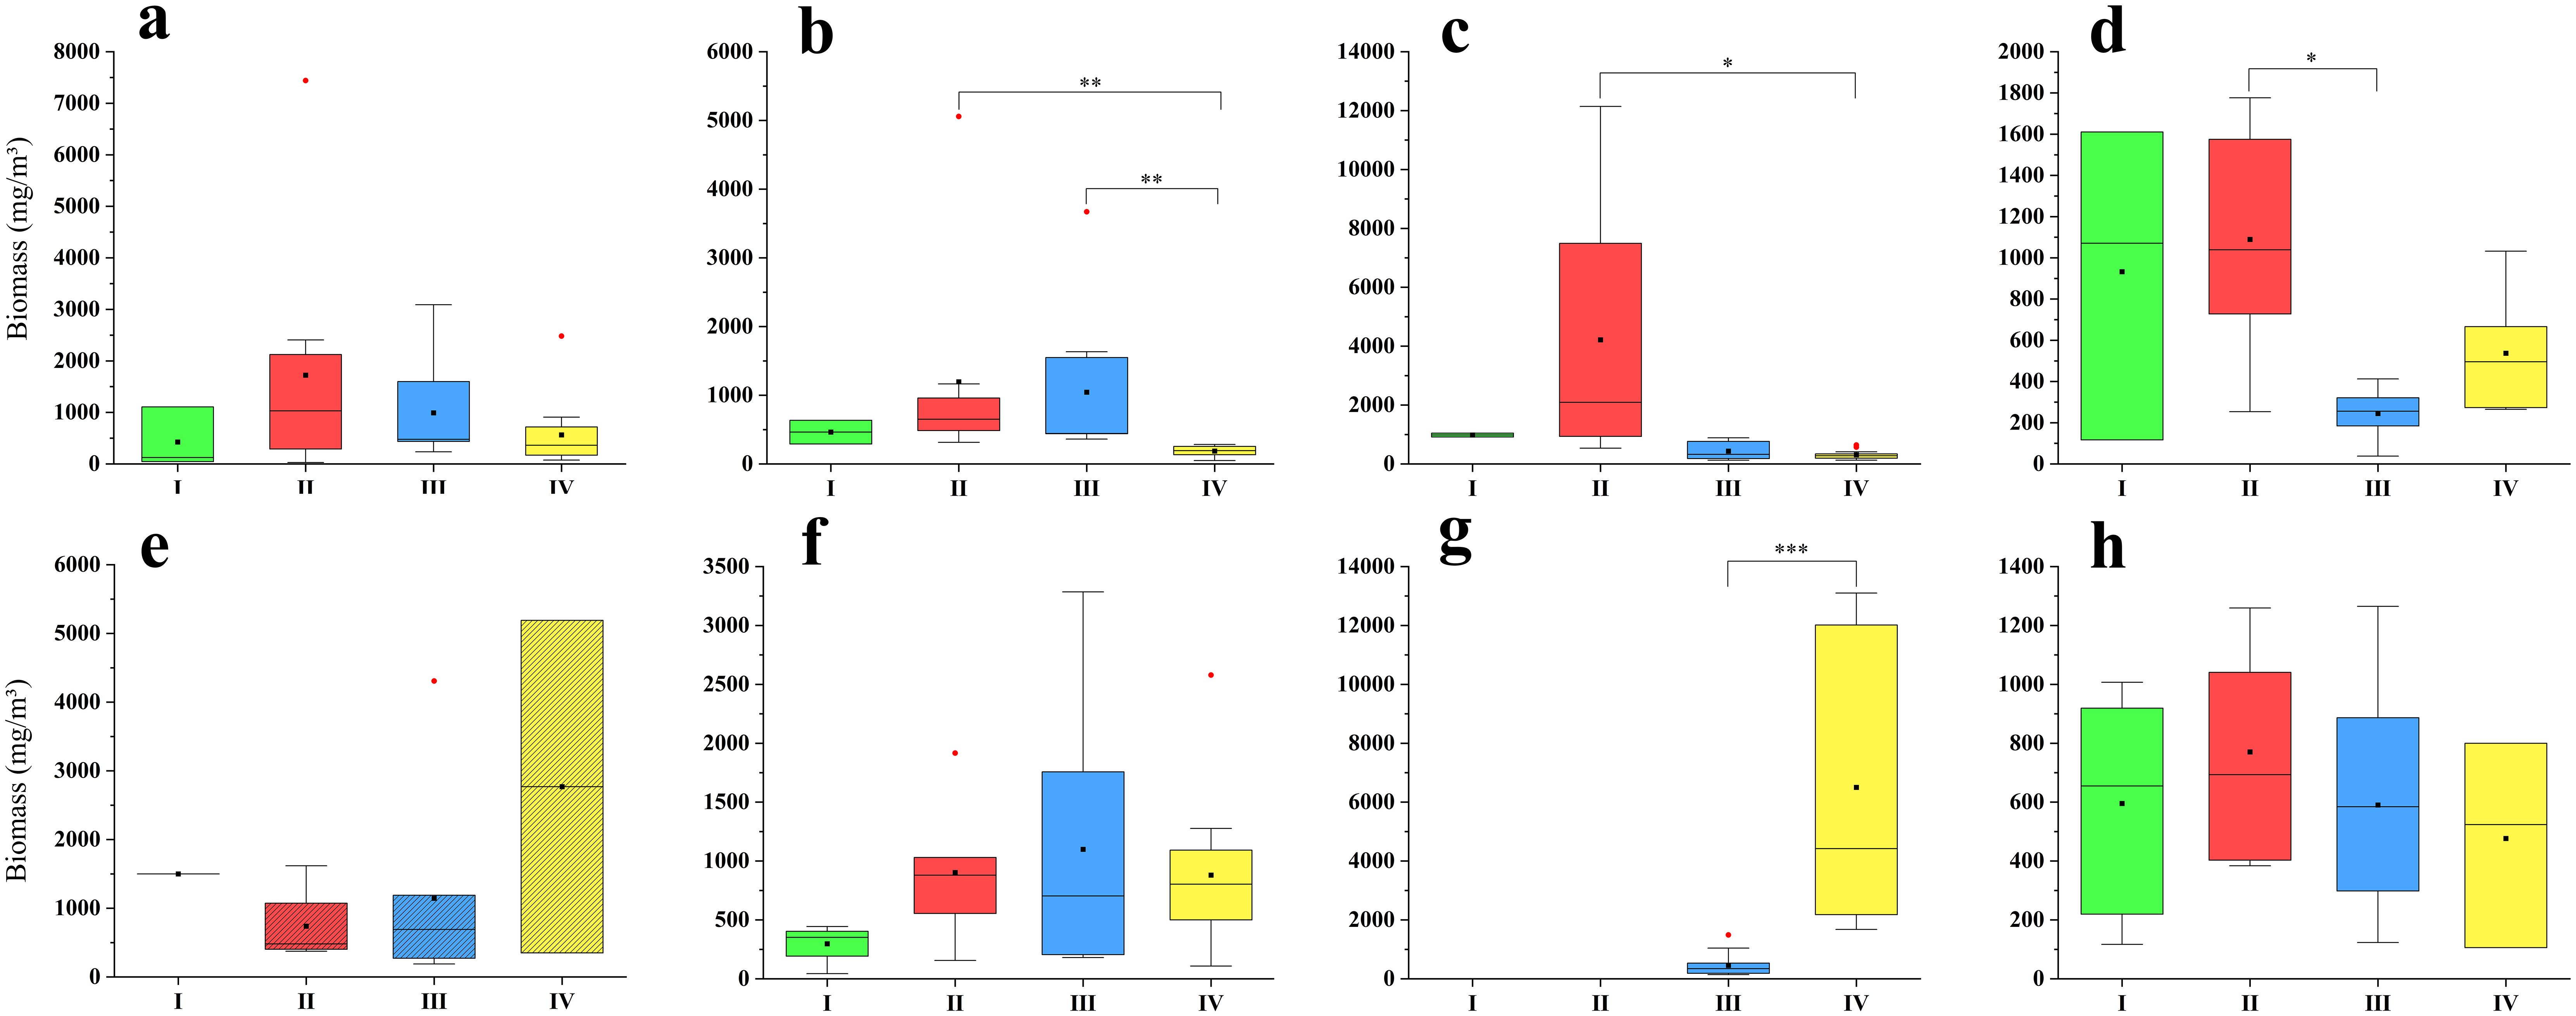
Figure 9. Zooplankton biomass of all groups in summer from 2016 to 2023. (a): 2016; (b):2017; (c):2018; (d):2019; (e): 2020; (f):2021; (g):2022; (h):2023. The zooplankton samples in 2020 were collected using a plankton net with a mesh size of 505μm, while in the other years, the size was 160μm. The black square represented the mean, the black horizontal line represented the median, the red circle represented outliers, and the star represented significant differences.
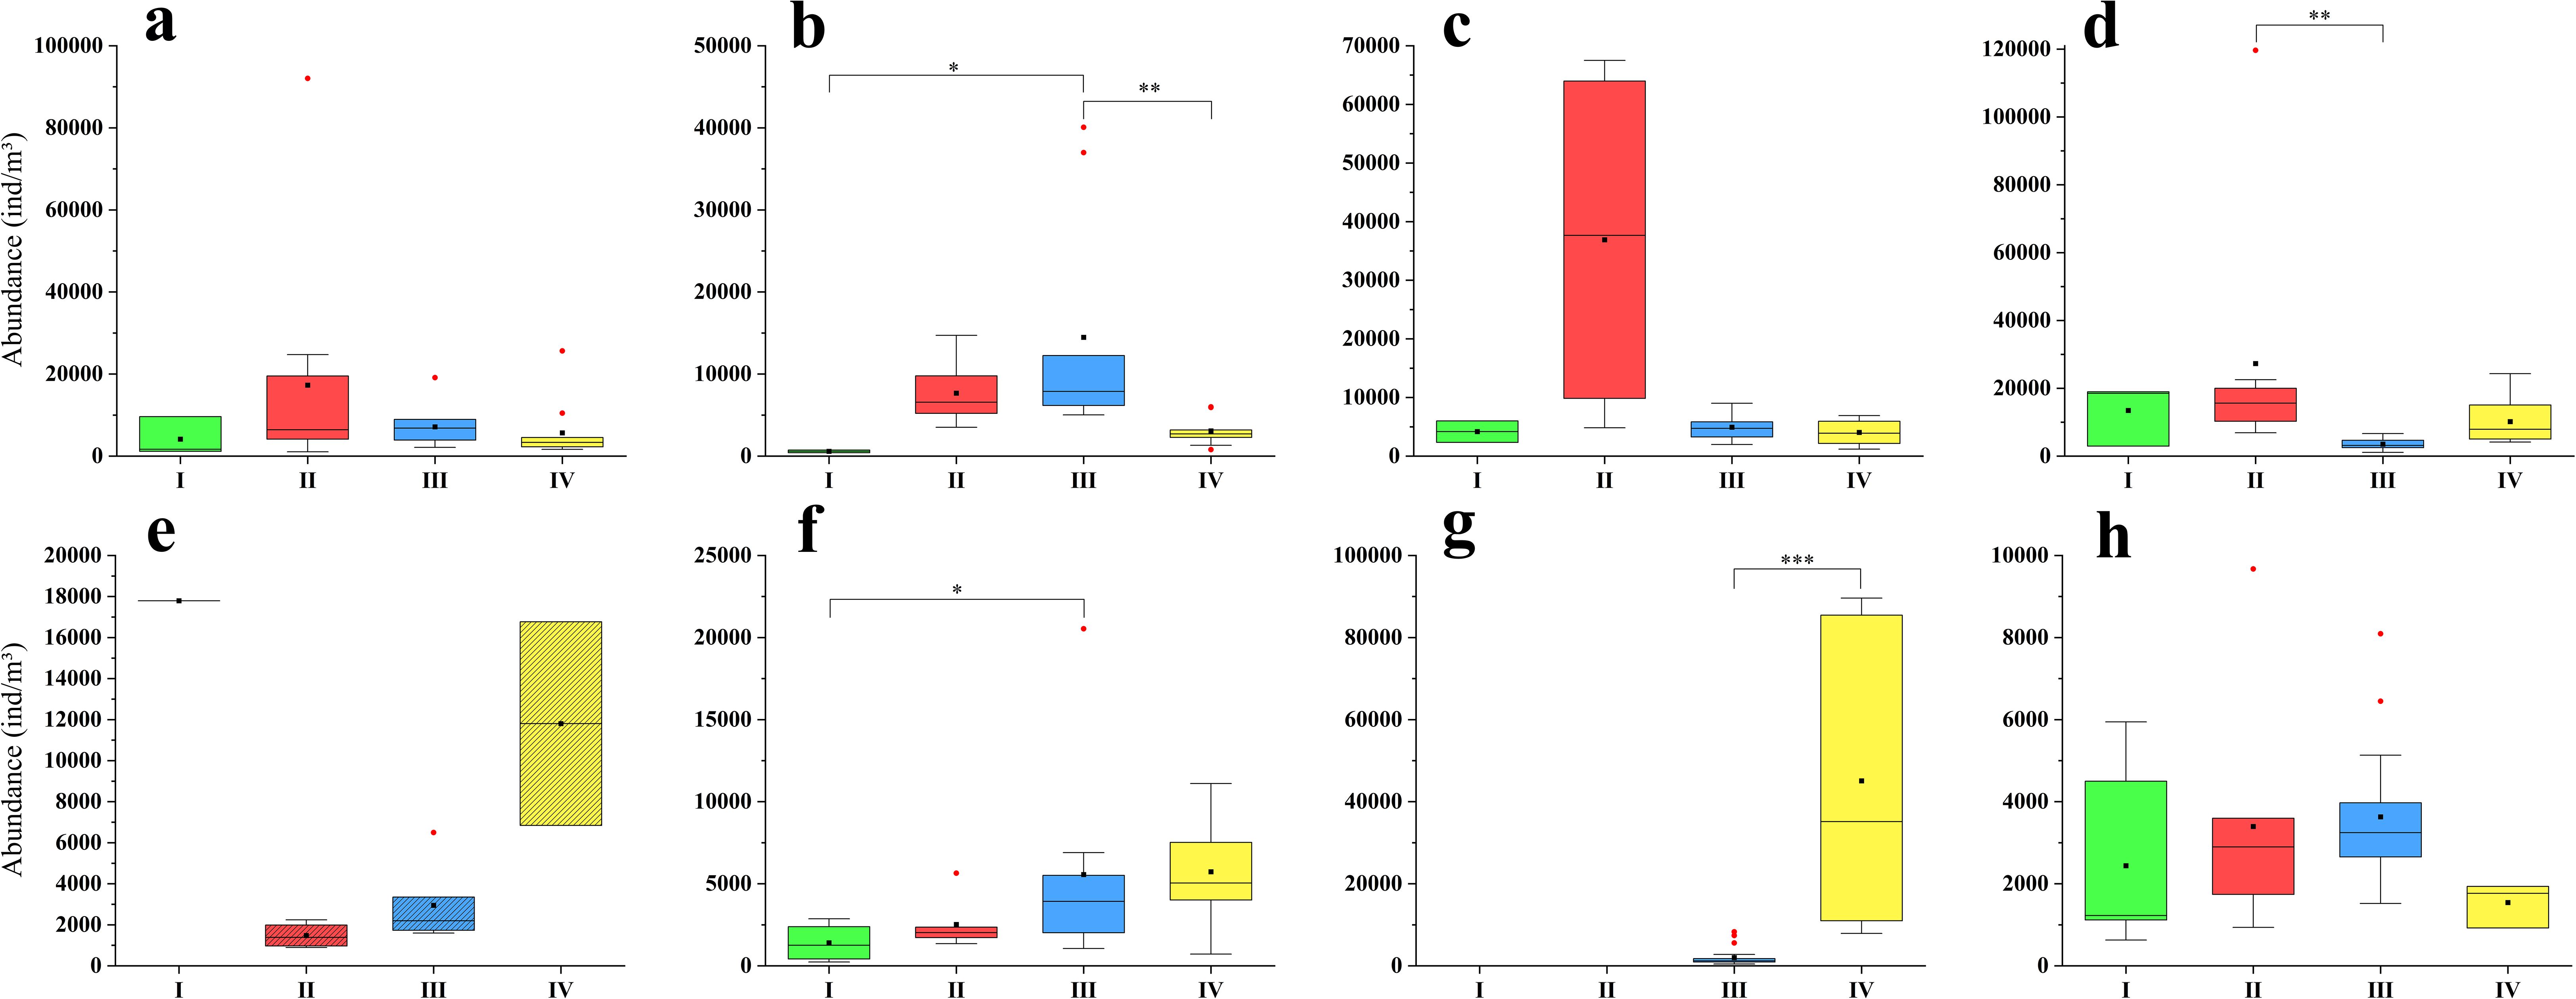
Figure 10. The zooplankton abundance of all groups in summer from 2016 to 2023. (a): 2016; (b): 2017; (c): 2018; (d): 2019; (e): 2020; (f): 2021; (g): 2022; (h): 2023. The zooplankton samples in 2020 were collected using a plankton net with a mesh size of 505μm, while in the other years, the size was 160μm. The black square represented the mean, the black horizontal line represented the median, the red circle represented outliers, and the stars represented significant differences.
The highest zooplankton biomass in most years occurred in Group II (2016, 2017, 2018, 2019 and 2023); in 2021, the biomass in Group III was the highest; and the biomass in Group IV was higher than that in Group III in 2022. The spatial difference of zooplankton biomass among four groups was significant in 2017, 2018, 2019 and 2022 (Figures 9, Supplementary Figure S1). The Kruskal-Wallis test revealed significant differences in 2017 between Groups II and IV (p = 0.001) and between Groups III and IV (p = 0.002); in 2018 between Groups II and IV (p = 0.019); in 2019 between Groups II and III (p = 0.010); and in 2022 between Groups III and IV (p< 0.001) (Figure 9).
The highest zooplankton abundance occurred in Group II in three years (2016, 2018, and 2019); in 2017 and 2023, the abundance in Group III was the highest; the abundance in Groups III and IV were higher than those in Groups I and II in 2021; and the abundance in Group IV was higher than that in Group III in 2022. The spatial difference of zooplankton abundance among four groups was significant in 2017, 2019, 2021 and 2022 (Figures 10, Supplementary Figure S2). The Kruskal-Wallis test revealed significant differences in 2017 between Groups I and III (p = 0.017) and between Groups III and IV (p = 0.007); in 2019 between Groups II and III (p = 0.002); in 2021 between Groups I and III (p = 0.041); and in 2022 between Groups III and IV (p< 0.001) (Figure 10).
In flood years, 2016 showed significant negative correlations between temperature and both biomass (r = -0.39*, p = 0.018) and abundance (r = -0.49*, p = 0.003); while significant positive correlations between Chl a and both biomass (r = 0.36*, p= 0.030) and abundance (r = 0.42*, p = 0.011), as well as between turbidity and both biomass (r = 0.39*, p = 0.019) and abundance (r = 0.45*, p = 0.005). In 2020, there were significant negative correlations between temperature and biomass (r = -0.53*, p = 0.043) (Figure 11).
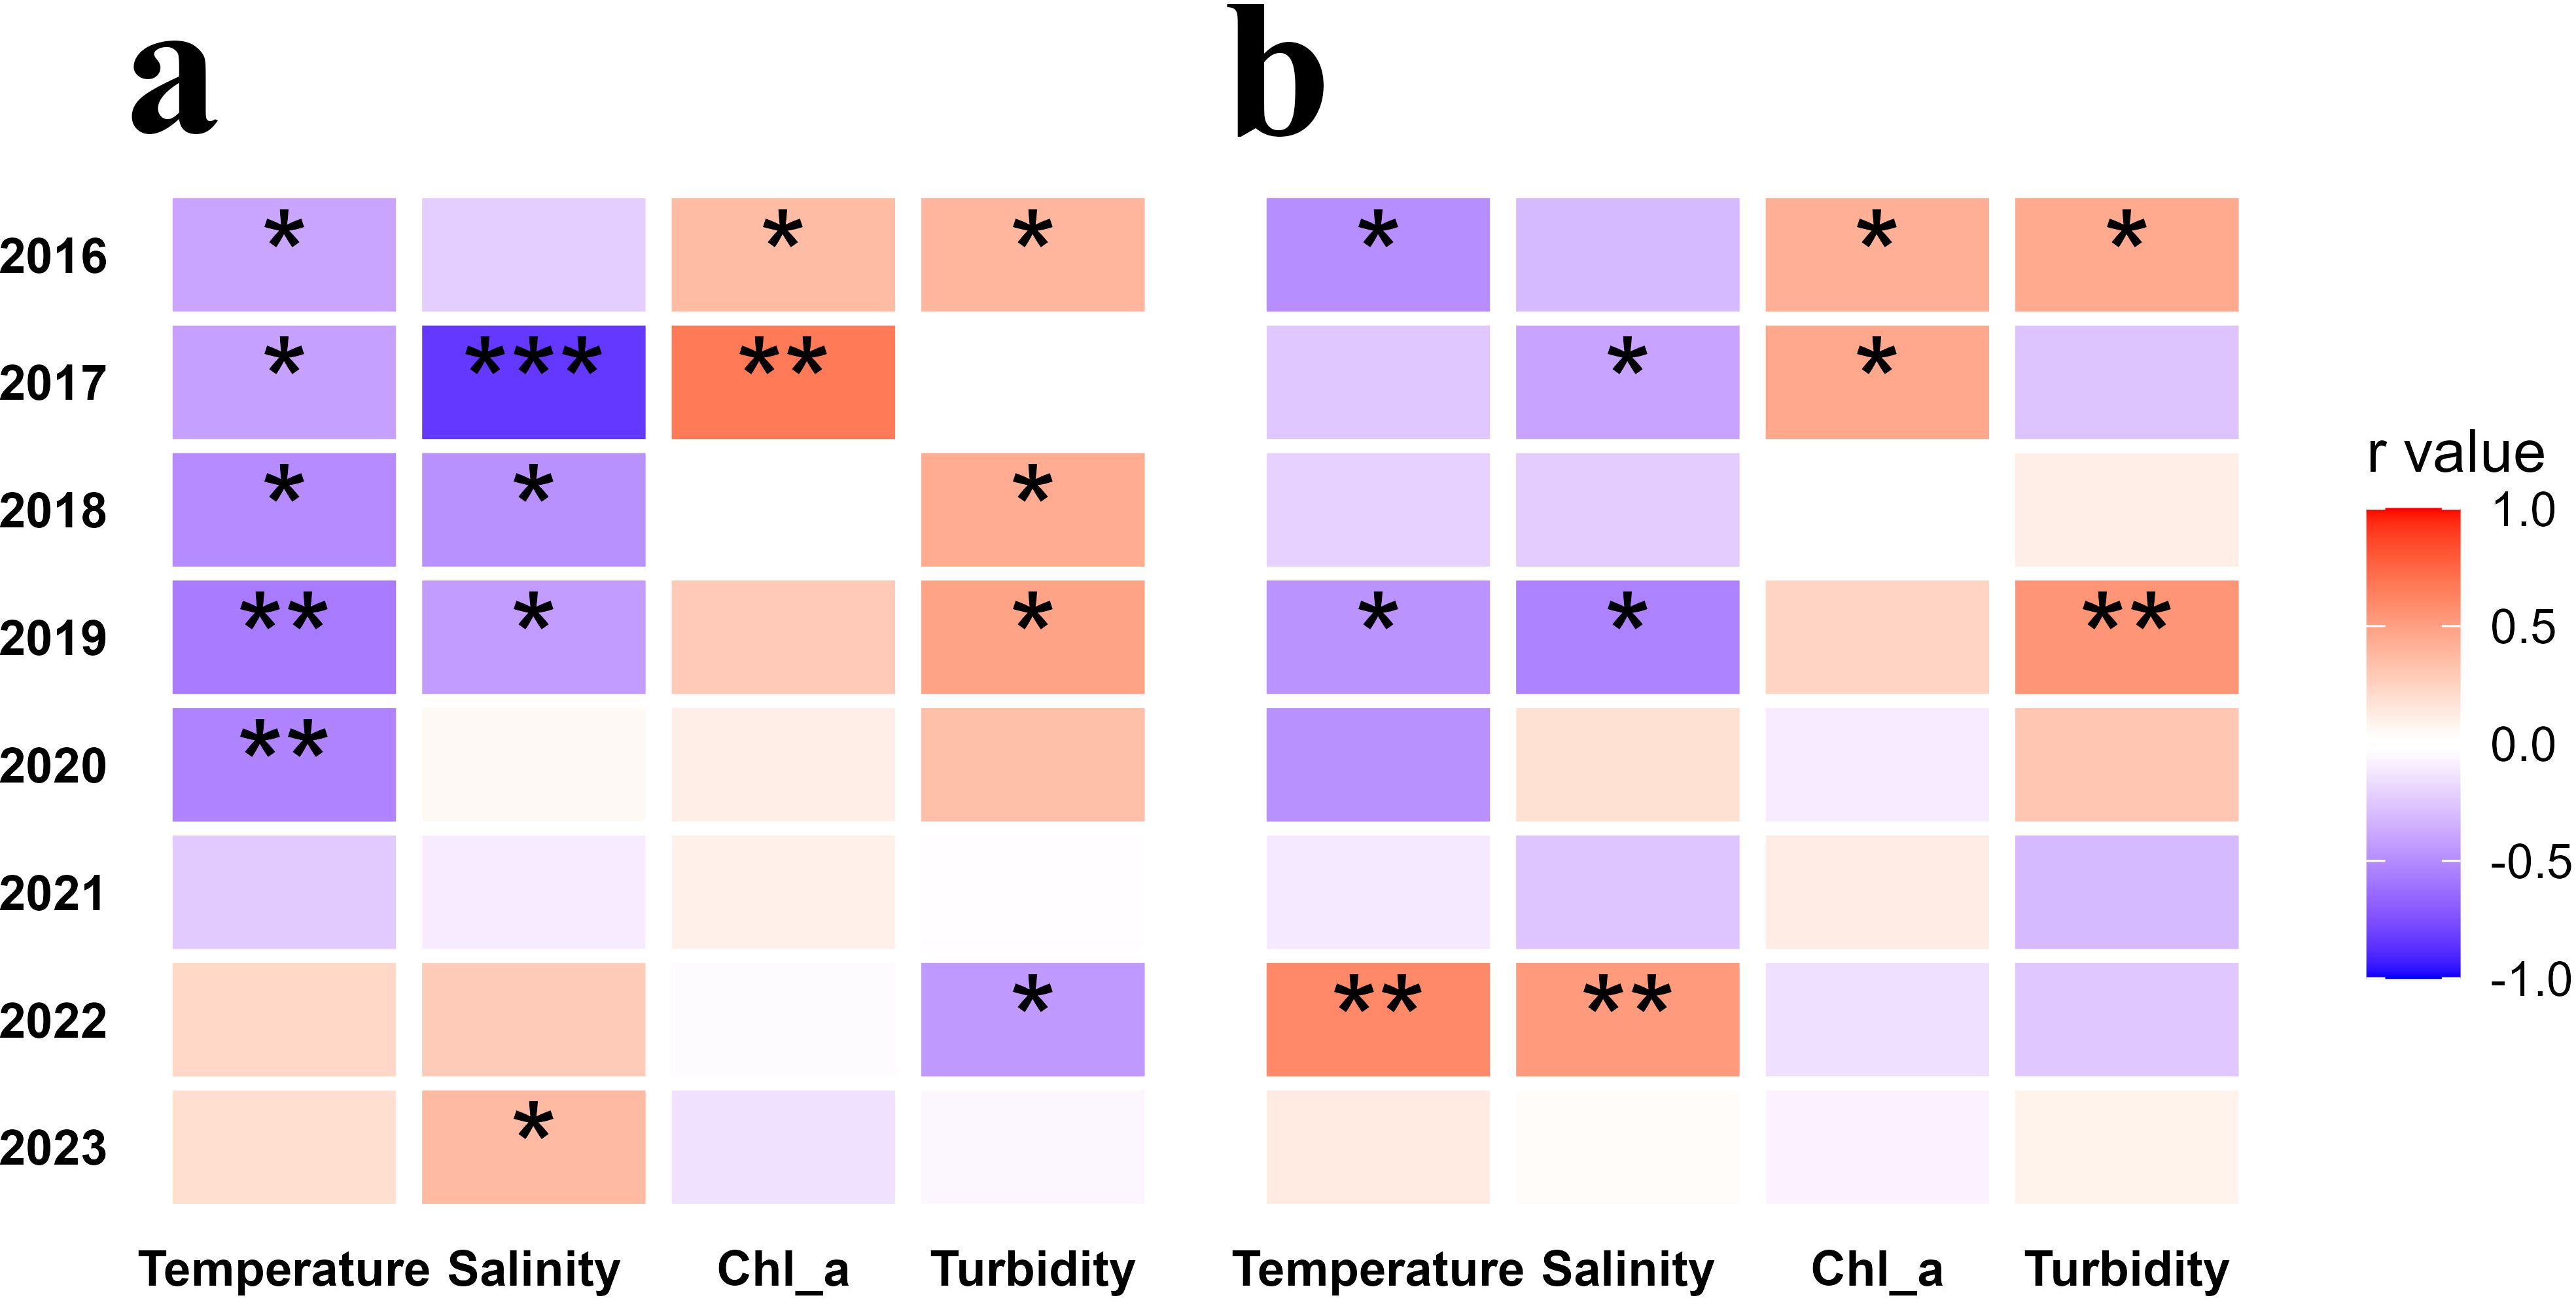
Figure 11. Spearman correlation analysis between zooplankton biomass (a) and abundance (b) and environmental factors in summer from 2016 to 2023. Asterisks ("*") denote statistically significant differences (*: 0.01 < p < 0.05; **: 0.001 < p < 0.01; ***: p < 0.001).
In normal years, 2017 showed significant negative correlations between temperature and biomass (r = -0.41*, p = 0.031), as well as between salinity and both biomass (r = -0.84*, p < 0.001) and abundance (r = -0.40*, p = 0.003), and significant positive correlations between Chl a and both biomass (r = 0.67*, p < 0.001) and abundance (r = 0.46*, p = 0.014). In 2018, temperature and salinity showed significant negative correlations with biomass (r = -0.50* and -0.48*, p = 0.009 and 0.012, respectively), and turbidity showed significant positive correlations with biomass (r = 0.44*, p = 0.023). In 2019, there were significant negative correlations between temperature and both biomass (r = -0.57*, p = 0.001) and abundance (r = -0.47*, p = 0.010), as well as between salinity and both biomass (r = -0.43*, p = 0.021) and abundance (r = -0.54*, p = 0.003), and significant positive correlations between turbidity and both biomass (r = 0.48*, p = 0.008) and abundance (r = 0.55*, p = 0.002). In 2021, none of the correlations were significant (Figure 11).
In the drought years, 2022 showed significant positive correlations between temperature and abundance (r = 0.60*, p < 0.001), as well as between salinity and abundance (r = 0.52*, p = 0.003); while significant negative correlations between turbidity and biomass (r = -0.44*, p = 0.013). In 2023, significant positive correlations were found between salinity and biomass (r = 0.37*, p = 0.026) (Figure 11).
For the GAM models with biomass as the dependent variable, temperature was a significant negative factor in 2016, 2019, and 2020. There were no significant factors in other years (Table 1).
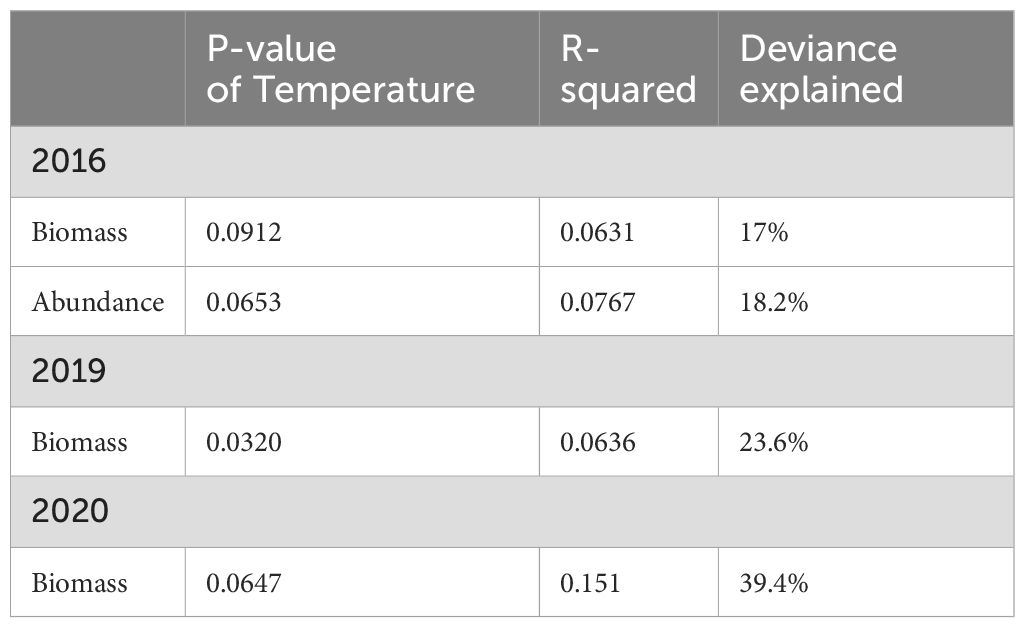
Table 1. Best generalized additive models selected for zooplankton biomass and abundance in relation to environmental variables from 2016 to 2023, only significant predictors included for each year.
For the GAM models with abundance as the dependent variable, temperature was a significant negative factor in 2016. There were no significant factors in other years (Table 1).
During flood years, salinity, temperature and turbidity were the significant environmental factors that regulated the spatial variations of zooplankton community, explaining 7.1%, 6.2%, and 7.4% of the variation in 2016, respectively and explaining 28.6%, 8.6%, and 17.1% of the variation in 2020, respectively (Table 2, Figures 12a, b).
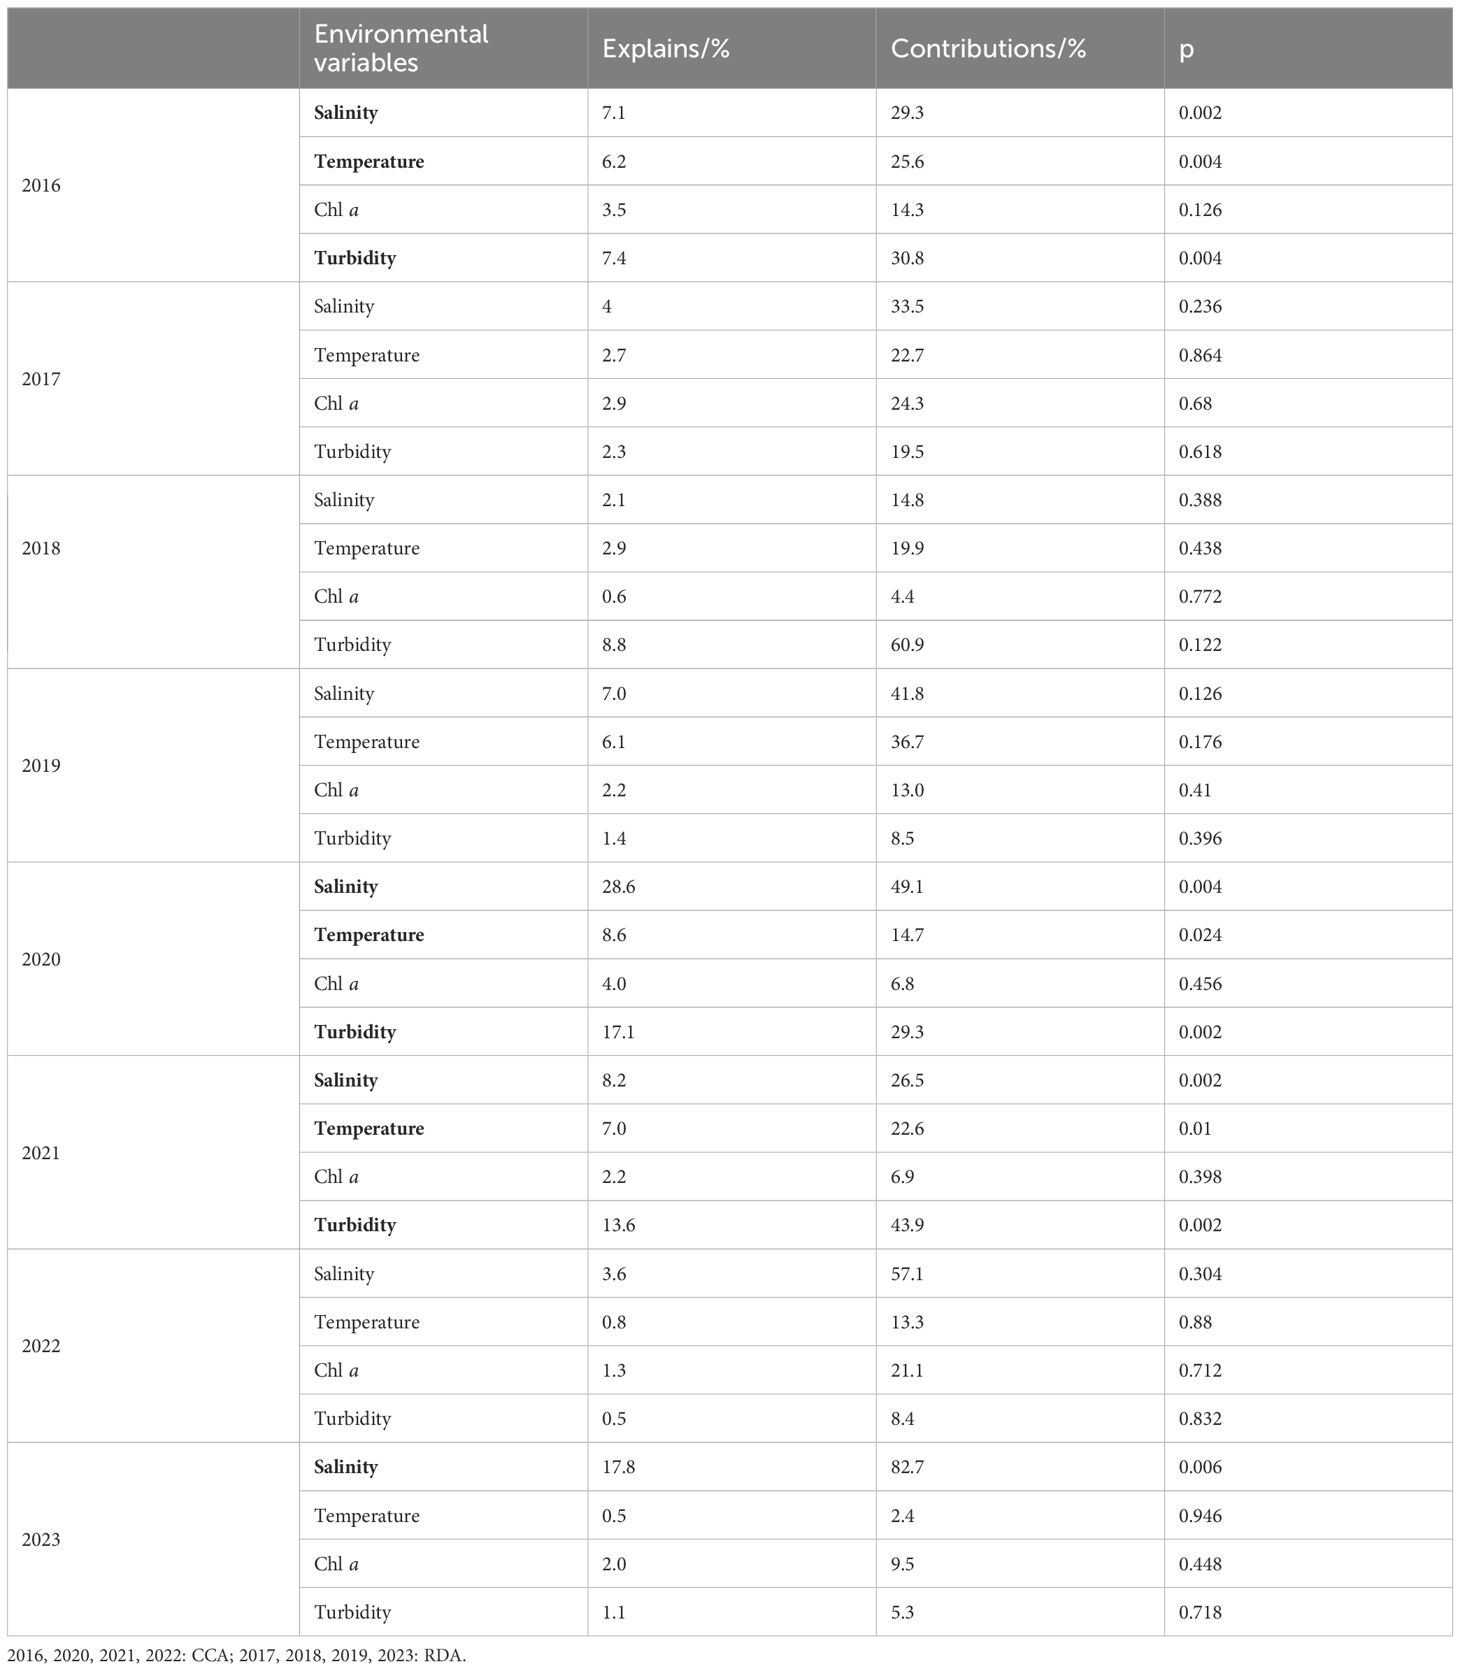
Table 2. Explanatory powers of the environmental variables for the community structures in summer from 2016 to 2023.

Figure 12. Relationships between zooplankton communities and environmental variables (only showing results where p< 0.05) in summer from 2016 to 2023. (a): 2016; (b): 2020; (c): 2021; (d): 2023.
During drought years, salinity was the relatively important environmental factor that regulated the spatial variations of zooplankton community. In 2023, salinity accounted for 17.8% of the variation; while there were no significant influencing factors in 2022 (Table 2, Figures 12c, d).
During normal years, there were no significant influencing factors in 2017, 2018 and 2019. While in 2021, salinity, temperature and turbidity were the primary significant environmental factors, explaining 8.2%, 7.0%, and 13.6% of the variation, respectively (Table 2).
Major estuaries worldwide, including the Mississippi River Estuary (Wang et al., 2021), Amazon River Estuary (Yu et al., 2022; Oumarou et al., 2007), and Pearl River Estuary (Ou et al., 2019; Zheng et al., 2014), experience significant freshwater input and exhibit diverse frontal dynamics. For instance, in the Mississippi River Estuary, the plume creates two distinct types of coastal fronts—one is extending from the surface to the seabed and the other is confined to surface waters. These fronts are driven by horizontal velocity and buoyancy gradients, with strong surface convergence and vorticity aiding in their formation (Wang et al., 2021). In the Amazon River Estuary, wind and tidal effects cause the salinity fronts to shift horizontally (Yu et al., 2022; Oumarou et al., 2007). Similarly, in the Pearl River Estuary, both sediment and plume fronts vary, primarily influenced by runoff and wind (Ou et al., 2019; Zheng et al., 2014). The Jiulong River Estuary also shows complex salinity fronts influenced by river plumes, tidal movements, and flow shear transformations, all modulated by runoff and tidal changes (Luo et al., 2012).
In contrast, the YRE exhibits unique frontal dynamics due to its distinctive geographic and hydrodynamic conditions (Zhou et al., 2021), including sediment fronts and plume fronts (mainly salinity fronts). The sediment fronts in the YRE are primarily shaped by topography, where shallow waters facilitate their formation (Du Y. et al., 2023; Du P. et al., 2022; Yang et al., 2016; Framiñan and Brown, 1996), and by tidal forces. The Yangtze River Diluted Water (YRDW) and the Yellow Sea Coastal Current transport sediments to the YRE, with resuspension primarily driven by tidal bottom shear stress (Luo et al., 2017), providing a continuous driving force for fronts formation (Hu et al., 2016). Monsoons also contribute by influencing wind and wave conditions, impacting sediment resuspension (Liu and Wang, 2019). Therefore, in this study, the intensity of the summer tides and monsoon activity thus control the variability of the sediment fronts in different years. Additionally, the YRDW can alter the stratification of waters outside the estuary, suppressing sediment resuspension and affecting fronts dynamics (Lee et al., 2015). Thus, in this study, the size of the Yangtze River runoff in different years plays a key role in regulating the variability of sediment fronts. Furthermore, ENSO-induced anomalies in wind patterns and sea surface temperature further drive the interannual variation of the sediment fronts (Du Y. et al., 2022; Liu et al., 2013). In the outer estuary, the low-salinity YRDW converges with the high-salinity waters of the East China Sea shelf. The diluted water, being relatively less dense, overlays the denser seawater. This interaction between the two water masses leads to the formation of plume fronts where surface convergence and downwelling occur (Eduardo et al., 2015). Therefore, the plume fronts also show interannual variability influenced by runoff, wind, and tidal forces (Liu et al., 2022).
In this study, the interannual variations of the sediment fronts and plume fronts in summer generally aligned with the magnitude of the Yangtze River runoff (Figures 1c, 2, 4). The sediment fronts could be observed within this study area (Figure 4), but when the summer runoff was too low, the sediment fronts weakened significantly or even disappeared (Figures 4g, h), such as in drought years (2022 and 2023), emphasizing the pivotal role of runoff in regulating their position. Plume fronts also fluctuated with runoff: during flood years (2016 and 2020), the Yangtze River runoff reached 50,000 m3/s (Figure 1c), discharging a large volume of low-salinity YRDW into the open sea. This met the high-salinity seawater, forming plume fronts. Due to the large runoff, the plume fronts extended to 123.5°E (2016, Figure 2a) or even beyond 124°E (2020, Figure 2e). During drought years, with the runoff around 20,000 m3/s (Figure 1c), the plume fronts reached only around 123°E (2023, Figure 2h) or even near 122.5°E (2022, Figures 2g). Normal years with the runoff around 40,000 m3/s (Figure 1c) saw plume fronts around 123°E (2017-2019, Figures 2b–d), though 2021 was exceptional due to typhoon-induced fluctuations, extending plume fronts to 123.5°E (Figure 2f). Our sampling in 2021 in the YRE experienced Typhoon “Omais”, resulting in a longer sampling period (August 17th to September 3rd), with no sampling from August 21st to 27th. The heavy rainfall brought by the typhoon caused a decrease in surface salinity and led to the expansion of the plume fronts.
In this study, turbidity, salinity and temperature were identified as significant factors influencing the spatial variation of zooplankton communities in 2016, 2020, and 2021 (Table 2, Figure 12), which could be classified as “wet years”, with relative contributions of turbidity and salinity greater than temperature. The years 2016 and 2020 were characterized by high Yangtze River runoff in August, while 2021 was impacted by the heavy rainfall brought by a typhoon during sampling period.
Previous researches indicate that turbidity in estuarine areas can affect the zooplankton distribution, with most studies reporting a negative impact of turbidity on the abundance of aquatic communities (Marcela et al., 2022; Salome et al., 2015; Carrasco et al., 2007). High turbidity reduces light availability, which inhibits phytoplankton photosynthesis and thus indirectly limits the food supply for zooplankton, affecting their growth and reproduction (María et al., 2018). Although some zooplankton can directly consume suspended particles, excessively high turbidity may overwhelm their capacity to process these particles, negatively impacting feeding and digestion (Goździejewska et al., 2024; Boenigk and Novarino, 2004). Moreover, turbidity can influence zooplankton behavior and alter predation pressures (Goździejewska et al., 2024; Sommaruga and Kandolf, 2014; Boenigk and Novarino, 2004). The turbidity gradient affects zooplankton communities by causing significant changes in their taxonomic and functional structure (size, feeding strategy), their quantitative parameters (abundance, biomass) and their interspecific relationships (Goździejewska et al., 2024). Salinity has also been widely recognized as a key factor influencing the spatial variation of zooplankton communities in many other estuaries (Venkataramana et al., 2023; Lucena-Moya and Duggan, 2017; Mouny and Dauvin, 2002). Zooplankton species possess unique physiological adaptations, including cellular osmoregulation, ion balance, and metabolic adaptability (Schubert et al., 2017; Charmantier et al., 1998; Yancey et al., 1982). Some zooplankton can maintain osmotic balance by regulating the concentration of solutes inside and outside their cell membranes, allowing them to maintain stable physiological conditions under variable salinity (von Weissenberg et al., 2022; Castellano et al., 2018). These physiological characteristics influence their survival and reproductive capacity in environments with varying salinity (Schubert et al., 2017; Shang et al., 2005). Climatic events such as typhoons can have significant effects on zooplankton communities by briefly altering the ecological environment (Liu et al., 2021).
During wet years, turbidity primarily affected species composition of zooplankton in Group I (Figures 12a–c). In the high-turbidity regions within the sediment fronts, reduced primary productivity due to light limitation and the provision of refuge for turbidity-tolerant species led to changes in the zooplankton community structure (Lee et al., 2015). These areas were dominated by Group I of zooplankton, with Acartia pacifica as the main dominant species in all three wet years (Table 3). While turbidity typically exerts a negative influence on zooplankton abundance (Salome et al., 2015), this pattern was consistent with our findings in 2016 and 2021, where the biomass and abundance of Group I were relatively low (Figures 9a, f, 10a, f). Combining correlation and linear regression results, turbidity did not play a dominant role in influencing biomass and abundance in 2016, 2020, and 2021 (Figure 11, Table 1). In wet years, nutrients brought by high runoff and strong water mixing under the influence of typhoon diluted the influence of turbidity on zooplankton biomass and abundance (Li et al., 2024b; Zhang et al., 2024). In summary, our study suggested that the effects of turbidity on zooplankton were more reflected in species screening and adjustment of community composition than in regulation of overall biomass and abundance.
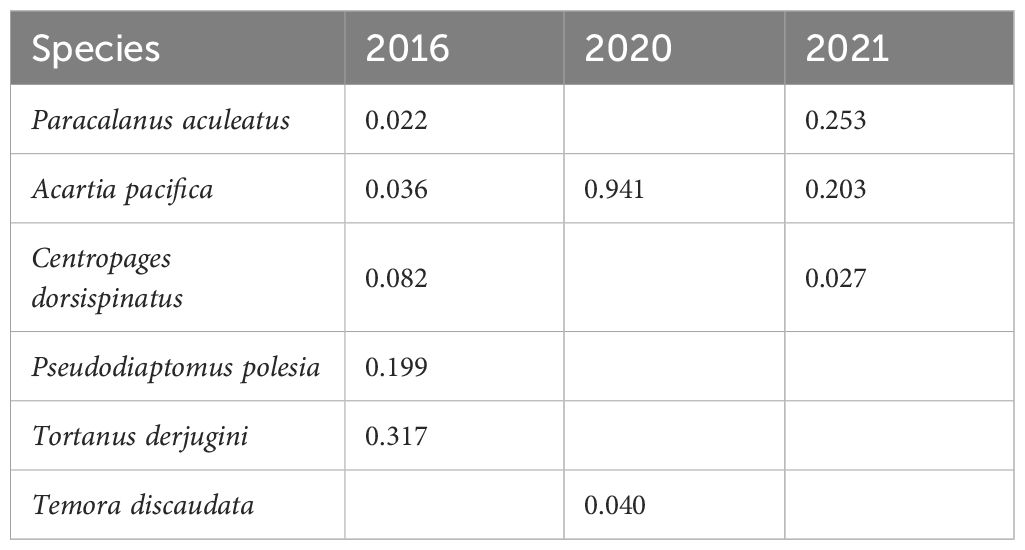
Table 3. Dominance () (Equation 1) of zooplankton dominant species in Group I during wet years.
Salinity also played a major role in shaping zooplankton community spatial pattern, particularly in wet years and in 2023 (Table 2, Figure 12). In wet years, the expansion of low-salinity areas due to the extended plume fronts affected zooplankton species composition. During the drought year of 2023, when only a plume front was present without a prominent sediment front, the absence of turbidity fronts left salinity as the primary factor influencing zooplankton distribution. According to the zooplankton clustering results, the average salinity of different regions was calculated (Figure 13), and the representative species composition of different regions was shown (Figure 14). In the high salinity regions (>25), the species with the highest relative abundance at four years all was euryhaline species P. aculeatus; in the moderate salinity regions (10-25), the relative abundance of nearshore low-salinity species A. pacifica and C. dorsispinatus increased; in the low salinity region (<10), the relative abundance of brackish-water species P. polesia greatly increased, while that of euryhaline species P. aculeatus decreased (Figures 13, 14). Combined with the results of correlation and linear regression, the controlling effect of salinity on zooplankton biomass and abundance was also weak (Figure 11, Table 1). In conclusion, the regulation of turbidity and salinity on zooplankton community is mainly reflected in the species composition.
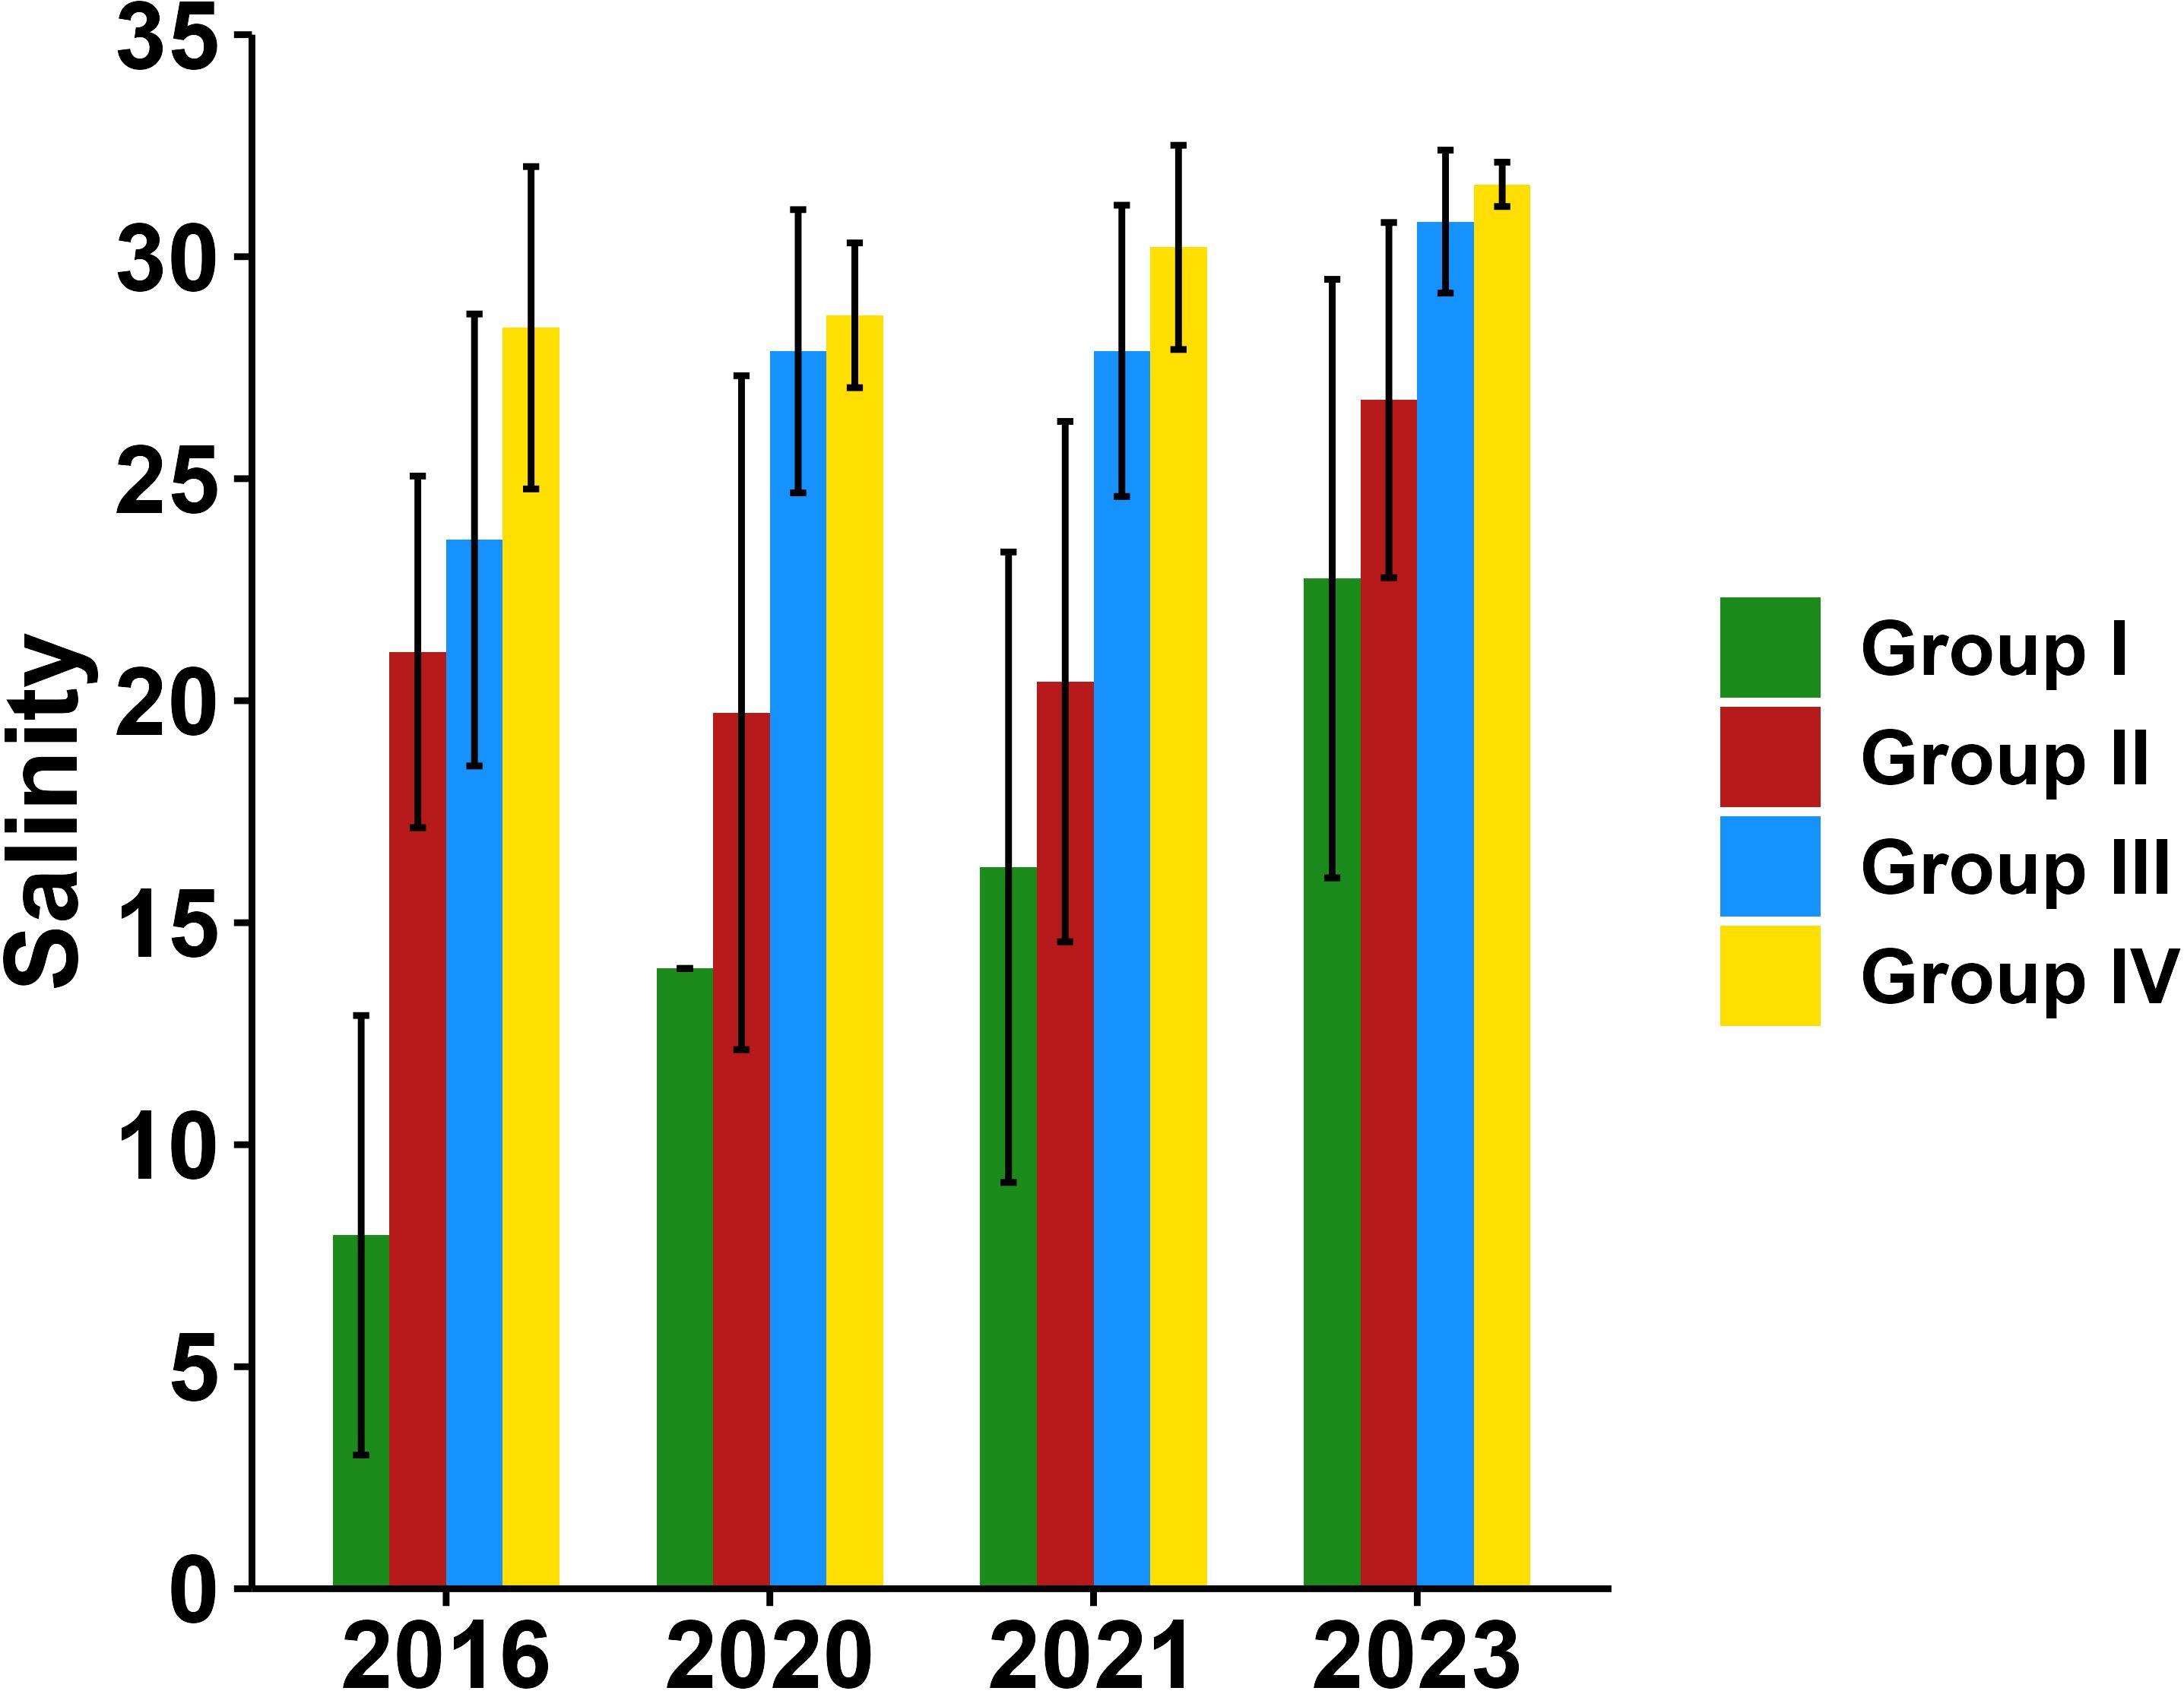
Figure 13. Average salinity in different regions for each summer during 2016, 2020, 2021 and 2023.
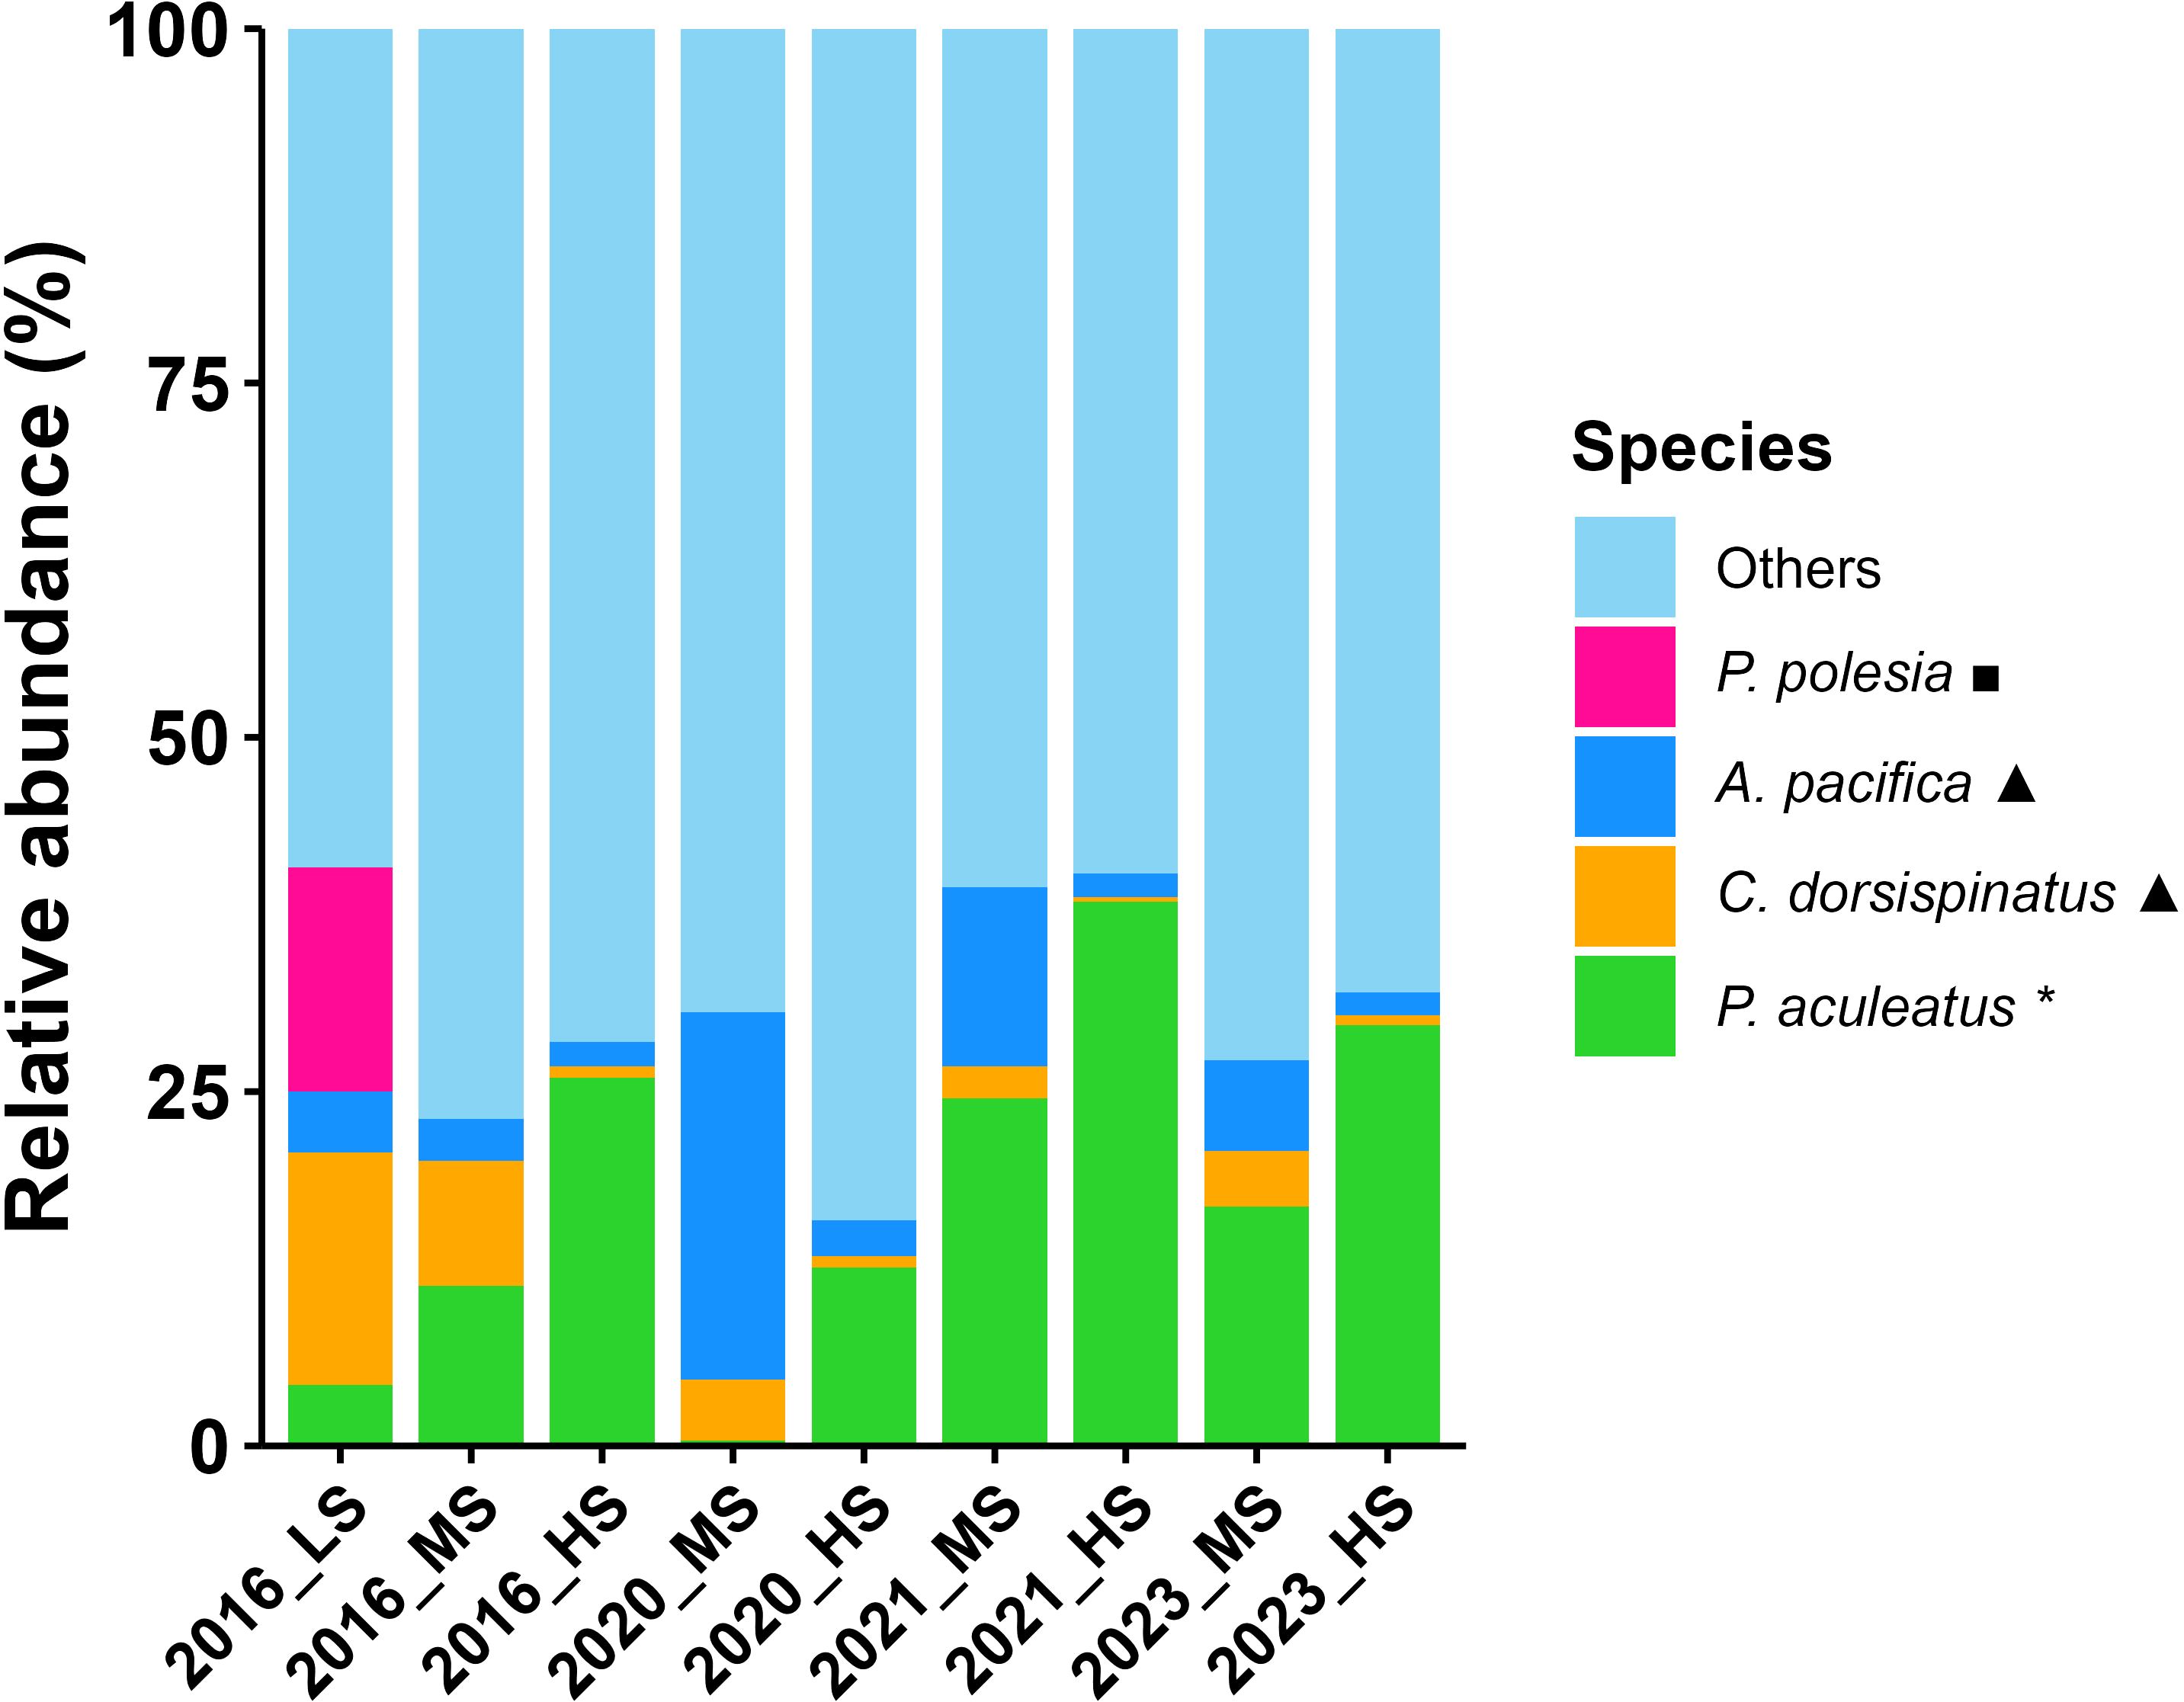
Figure 14. Relative abundances (%) of representative species in different salinity regions for each summer during 2016, 2020, 2021 and 2023. Salinity regions: LS, low (<10); MS, moderate (10-25); HS, high (>25). Ecotype: *, euryhaline; ▲, nearshore low-salinity; ◼, estuarine brackish-water.
In contrast, during the normal years of 2017, 2018, and 2019, when a dual-front structure existed, and in the drought year of 2022, when only salinity fronts were present, the environmental gradients of salinity, temperature, turbidity, and Chl a were relatively smaller, and these factors were not detected to have significant effects on zooplankton distribution (Table 2).
Spearman correlation analysis indicated a significant positive correlation between Chl a and zooplankton biomass and abundance in 2016 and 2017, though no significant correlation was found in other years (Figure 11). However, CCA and RDA results suggested that Chl a was not a major factor determining zooplankton spatial distribution (Table 2). Previous studies in other estuaries have also found that food availability, while important, is not always the primary limiting factor for zooplankton biomass and abundance (Sun et al., 2016; Chen et al., 2011). Although herbivorous copepods, such as Acartia spp., prefer areas with abundant food resources, food quality, including phytoplankton species composition and defenses, may play a more critical role in zooplankton utilization of available biomass (Sun et al., 2016; Van Donk et al., 2011). In the YRE, changes in the phytoplankton community composition, such as shifts towards species with lower nutritional value (e.g., high levels of detritus or toxins), could affect zooplankton feeding efficiency and growth, despite high Chl a concentrations (Marc et al., 2025; Camille et al., 2024). In this study, compared to salinity and turbidity, Chl a had a weaker influence on zooplankton communities, impacting biomass and abundance in some years but showing negligible effects on species composition in the YRE.
In the context of global warming, the summer subtropical high in 2022 exhibited unprecedented strength and extensive coverage, persistently influencing the Yangtze River Basin. This phenomenon, compounded by the prolonged La Nina event and anthropogenic activities, led to significant changes in the region (Ge et al., 2025; Lyu et al., 2023). This extreme hydrological event significantly affected the zooplankton communities in the YRE and adjacent waters. The river’s flow dropped to a historical low of 20,000 m³/s (Figure 1c), causing a sharp increase in estuarine salinity. Tidal action further exacerbated saltwater intrusion, allowing oceanic species to invade the estuary (Wang et al., 2023). Consequently, Groups I and II were entirely replaced by Groups III and IV (Figure 6g). The reduction in river runoff also led to the disappearance of turbidity fronts (Figure 4g), which had previously supported species like A. pacifica. In 2022, A. pacifica lost its dominance in the estuary (Figure 8), primarily due to the higher salinity and absence of turbidity fronts.
Zooplankton biomass and abundance in 2022 were concentrated in the Zhoushan offshore area, significantly higher than in other regions (Supplementary Figures S1G, S2G). This was a result of reduced influence from YRDW, allowing the area to be more affected by nutrient-rich East China Sea currents. These currents, through upwelling and tidal mixing, introduced nutrients into surface waters, enhancing phytoplankton production and resulting in high Chl a (Figure 5g) (Li et al., 2021). This nutrient availability in the Zhoushan area provided an abundant food supply for zooplankton, explaining the higher biomass and abundance observed during the drought year (Liu et al., 2016). The increased salinity during this drought year favored species adapted to high-salinity conditions, notably M. rosea, whose dominance increased significantly (Figure 8). As a eurythermal and euryhaline species, M. rosea possesses strong osmoregulatory capabilities, allowing it to thrive despite rapid changes in salinity and temperature (Charmantier et al., 1998). The species’ ability to adapt to fluctuating food quality, including its diverse feeding strategy that includes phytoplankton and suspended particles, further contributed to its population expansion (Turner, 2004). With reduced freshwater input and rising salinity, competition decreased, giving M. rosea a distinct growth advantage (Kimmerer, 2002).
Based on this, we constructed a schematic diagram of zooplankton communities under three runoff models to illustrate the controlling effect of runoff changes on two frontal systems and zooplankton communities, mainly species changes, in the YRE (Figure 15).
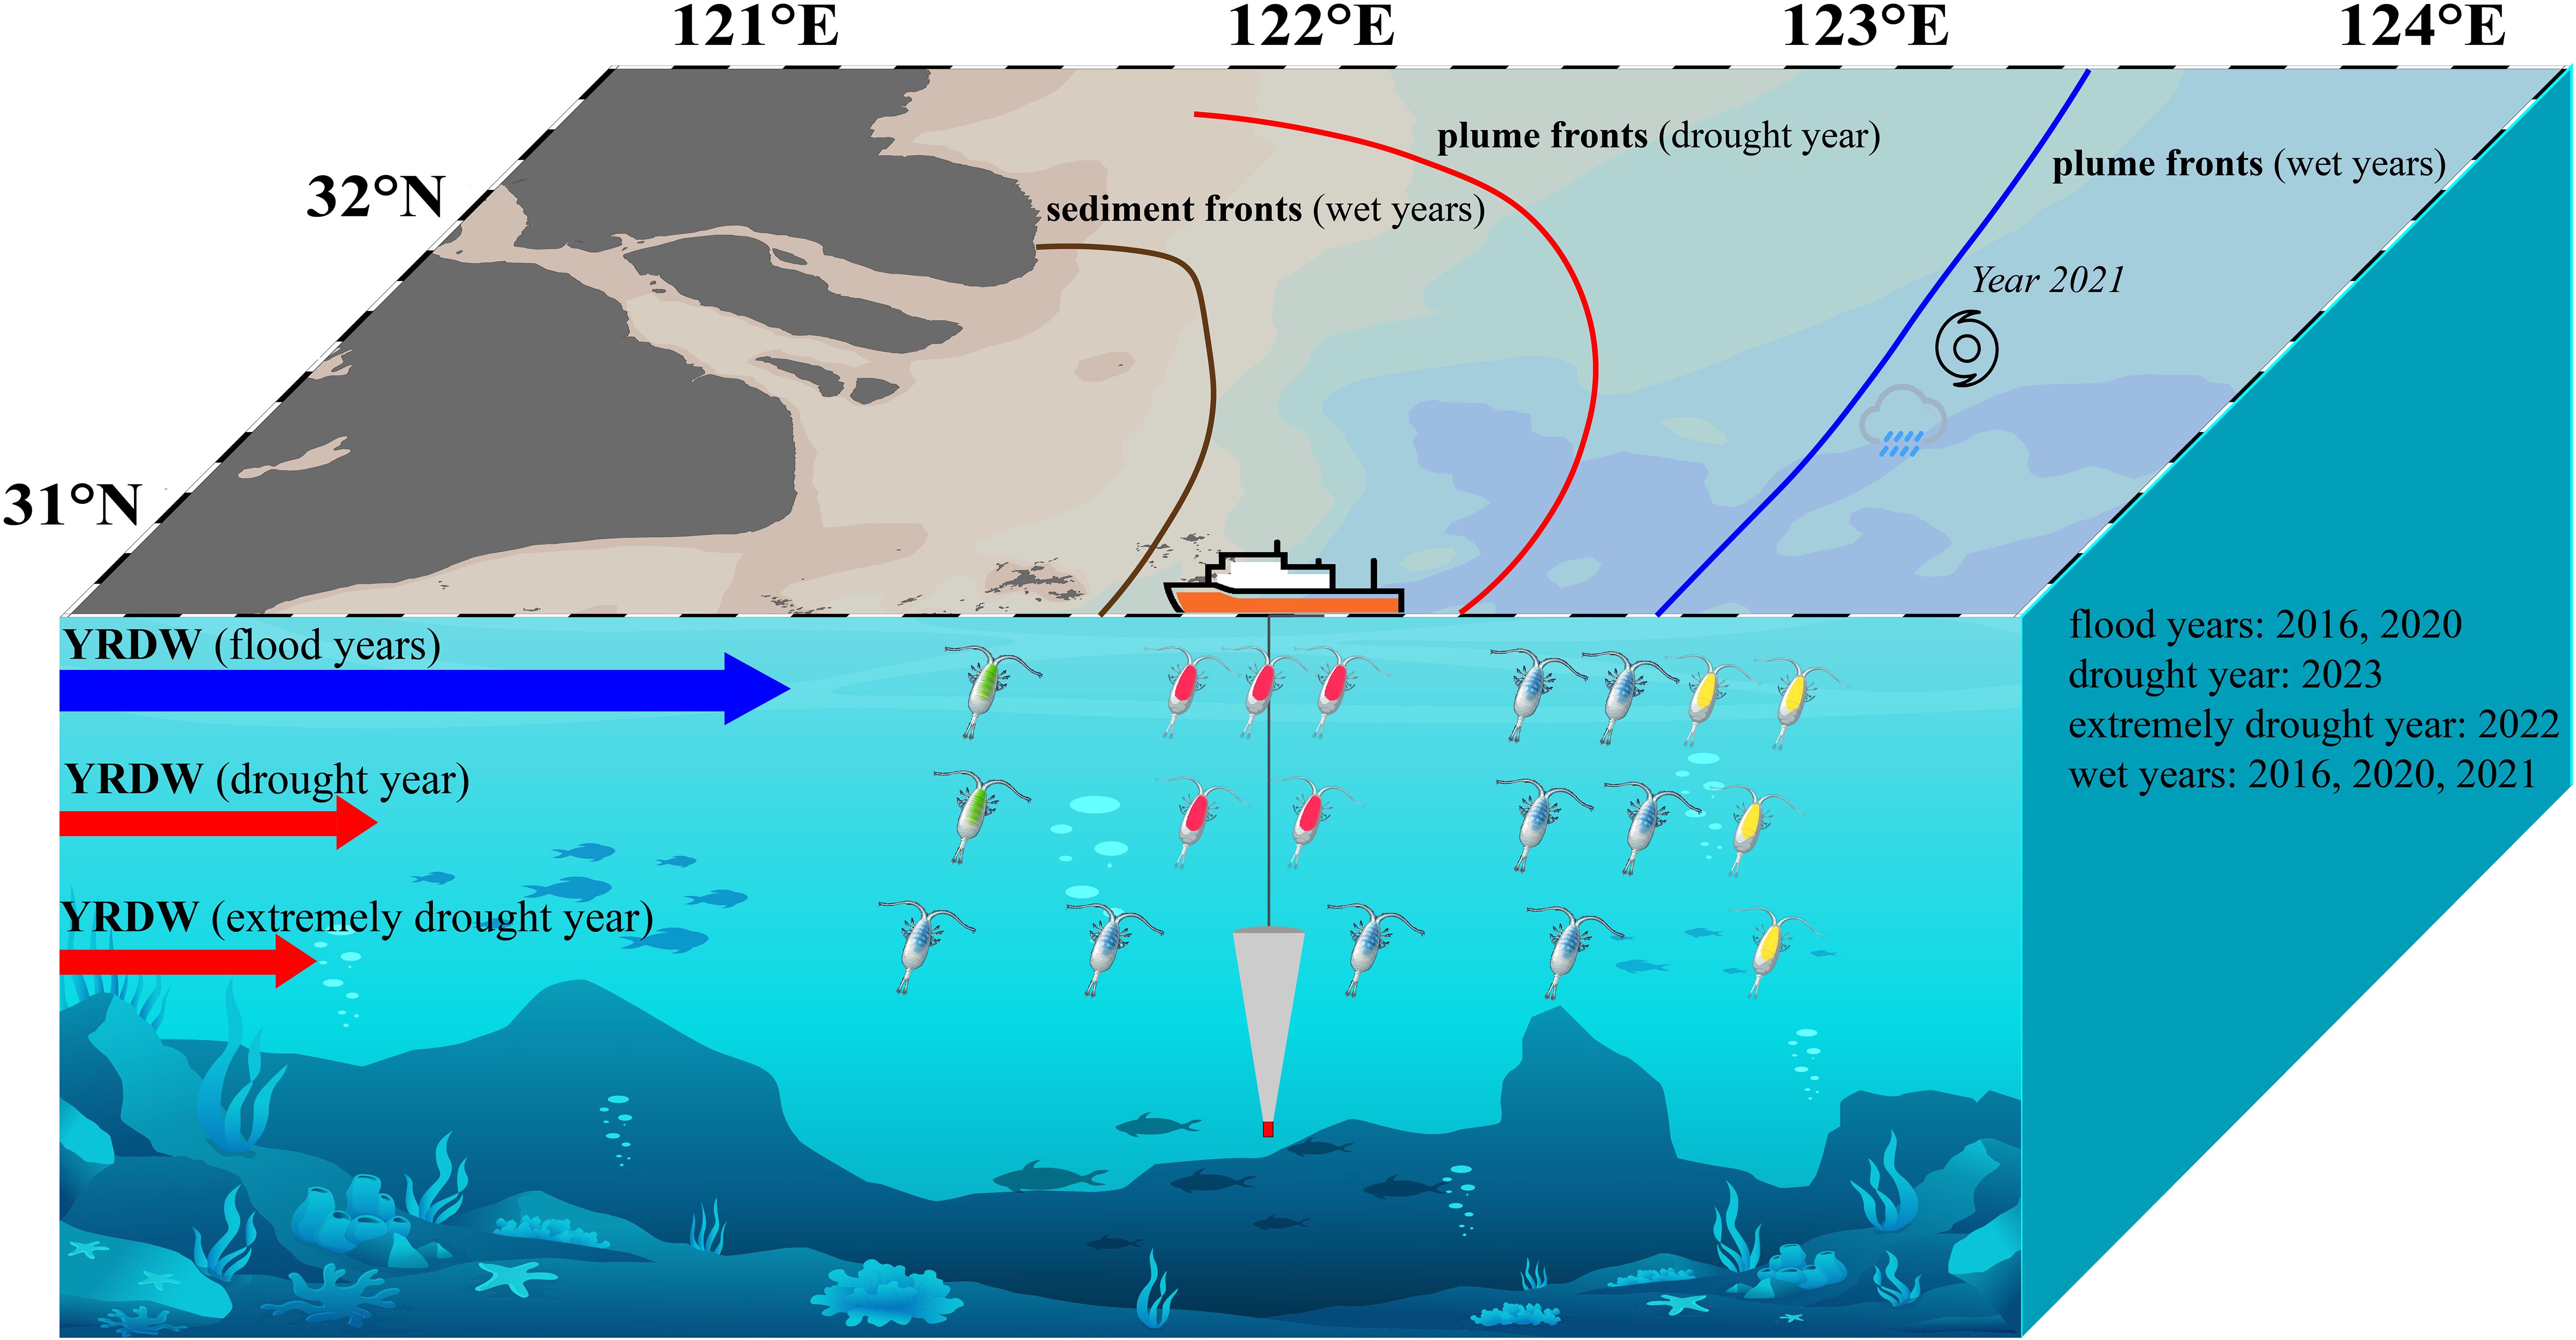
Figure 15. Runoff affects frontal system and zooplankton community in YRE. The four different colours of copepods represent the four communities of zooplankton, and the number of copepods indicates the approximate abundance.
The extreme drought in 2022 also likely affected fishery resources in the YRE (Cui et al., 2024; Brookes et al., 2015). During extreme drought, due to tough living conditions, zooplankton communities may exhibit a certain degree of homogenization. In contrast, fish tend to disperse actively, but the reduced connectivity between habitats leads to even higher homogenization levels (Diniz et al., 2023). Similar patterns have been observed in estuarine systems (Barros et al., 2024). Reduced freshwater flow and altered ecological conditions may have long-term implications for fisheries, especially as climate change increases the frequency of such extreme events (Leal et al., 2022). Continuous monitoring of zooplankton communities and their potential impacts on fisheries will be critical for sustainable resource management in the region. In addition, the extreme drought in the summer of 2024 led to the intrusion of large jellyfish, which typically thrive offshore at 123°E in the YRE, into nearshore low-salinity areas. This posed ecological risks to Hangzhou Bay, disrupted coastal power plant cooling systems, and resulted in economic losses. Although this study did not focus on large zooplankton, the findings from dry years highlight the need for heightened attention to the ecological risks posed by frequent extreme weather events to both estuarine ecosystems and industries, particularly in the context of climate change.
This study highlights the significant impact of estuarine fronts dynamics on zooplankton community in the YRE in summer during 2016 to 2023. Our findings reveal that in wet years sediment fronts notably influence species composition while plume fronts regulate distribution based on salinity tolerance, and salinity fronts emerge as the primary factor during drought years. The extreme drought of 2022 results in a marked increase in estuarine salinity, the disappearance of sediment fronts, and a notable shift in zooplankton communities, particularly favoring euryhaline species like M. rosea. This shift underscores the adaptability of certain species to changing environmental conditions, but also raises concerns about the implications for fishery resources or ecological risk in the YRE as climate change continues to increase the frequency of such extreme events. However, the variation of zooplankton community in the estuary are influenced by a variety of factors, many of which are not involved in this study, so the conclusions may be adjusted when the environmental factors of concern change. Furthermore, while our analysis focused on surface-layer measurements, subsurface vertical stratification and water column mixing processes were not explicitly addressed. Future studies employing depth-resolved sampling protocols coupled with high-resolution CTD profiling could elucidate how turbidity-salinity gradients interact with vertical hydrodynamics to structure zooplankton communities.
The original contributions presented in the study are included in the article/Supplementary Material. Further inquiries can be directed to the corresponding author.
The manuscript presents research on animals that do not require ethical approval for their study.
YX: Investigation, Writing – original draft. FC: Investigation, Writing – original draft. XM: Writing – original draft. MM: Writing – original draft. YZ: Writing – original draft. ZJ: Writing – original draft. ZZ: Writing – original draft. JZ: Writing – original draft. LS: Writing – original draft. FZ: Writing – original draft. PD: Investigation, Writing – original draft.
The author(s) declare that financial support was received for the research and/or publication of this article. This work was supported by the National Key Research and Development Program of China (2021YFC3101702); Project of The Science Technology Department of Zhejiang Province (Grant No. 2024C03235); Long-term Observation and Research Plan in the Changjiang Estuary and Adjacent East China Sea (LORCE) Project (SZ2001); Zhejiang Provincial Natural Science Foundation of China (Grants LR22D060001, LY22D060006, LY14D060007).
The authors declare that the research was conducted in the absence of any commercial or financial relationships that could be construed as a potential conflict of interest.
The author(s) declare that no Generative AI was used in the creation of this manuscript.
All claims expressed in this article are solely those of the authors and do not necessarily represent those of their affiliated organizations, or those of the publisher, the editors and the reviewers. Any product that may be evaluated in this article, or claim that may be made by its manufacturer, is not guaranteed or endorsed by the publisher.
The Supplementary Material for this article can be found online at: https://www.frontiersin.org/articles/10.3389/fmars.2025.1556561/full#supplementary-material
Barros A., Hartman R., Bashevkin S. M., Burdi C. E. (2024). Years of drought and salt: decreasing flows determine the distribution of zooplankton resources in the San Francisco estuary. San Francisco Estuary Watershed Sci. 22, 1–20. doi: 10.15447/sfews.2024v22iss1art3
Beardsley R. C., Limeburner R., Yu H., Cannon G. A. (1985). Discharge of the changjiang (Yangtze river) into the east China sea. Continental Shelf Res. 4, 57–76. doi: 10.1016/0278-4343(85)90022-6
Belkin I. M., Cornillon P. C., Sherman K. (2009). Fronts in large marine ecosystems. Prog. Oceanography 81, 223–236. doi: 10.1016/j.pocean.2009.04.015
Boenigk J., Novarino G. (2004). Effect of suspended clay on the feeding and growth of bacterivorous flagellates and ciliates. Aquat. Microbial Ecol. 34, 181–192. doi: 10.3354/ame034181
Brookes J. D., Aldridge K. T., Bice C. M., Deegan B., Ferguson G. J., Paton D. C., et al. (2015). Fish productivity in the lower lakes and Coorong, Australia, during severe drought. Trans. R. Soc. South Aust. 139, 189–215. doi: 10.1080/03721426.2015.1074338
Burdis M. R., Hirsch K. J. (2017). Crustacean zooplankton dynamics in a natural riverine lake, Upper Mississippi River. J. Freshw. Ecol. 32, 247–265. doi: 10.1080/02705060.2017.1279080
Camille R., Charlotte W., Elsie M. S., Sakina-Dorothée A., Alessandro T. (2024). A global biogeography analysis reveals vulnerability of surface marine zooplankton to anthropogenic stressors. One Earth 7, 146–160. doi: 10.1016/j.oneear.2023.12.002
Carrasco N. K., Perissinotto R., Miranda N. A. F. (2007). Effects of silt loading on the feeding and mortality of the mysid Mesopodopsis Africana in the StLucia Estuary, South Africa. J. Exp. Mar. Biol. Ecol. 352, 152–164. doi: 10.1016/j.jembe.2007.07.006
Castellano G. C., da Veiga M. P. T., Mazzini F. S., Vidal E. A. G., Freire C. A. (2018). Paralarvae of Octopus vulgaris Type II are stenohaline conformers: relationship to field distribution and dispersal. Hydrobiologia 808, 71–82. doi: 10.1007/s10750-017-3458-y
Charmantier G., Charmantier D. M., Anger K. (1998). Ontogeny of osmoregulation in the grapsid crab Armases miersii (Crustacea, Decapoda). Mar. Ecology-Progress Ser. 164, 285–292. doi: 10.3354/meps164285
Chen M., Chen B., Harrison P., Liu H. (2011). Dynamics of mesozooplankton assemblages in subtropical coastal waters of Hong Kong: a comparative study between a eutrophic estuarine and a mesotrophic coastal site. Continental Shelf Res. 31, 1075–1086. doi: 10.1016/j.csr.2011.03.011
Cram J. A., Hollins A., McCarty A. J. (2024). Microbial diversity and abundance vary along salinity, oxygen, and particle size gradients in the Chesapeake Bay. Environ. Microbiol. 26, e16557. doi: 10.1111/1462-2920.16557
Cui L., Zhong L., Meng J. (2024). Spatiotemporal evolution features of the 2022 compound hot and drought event over the yangtze river basin. Remote Sens. 16, 1367. doi: 10.3390/rs16081367
Dai Z., Du J., Zhang X., Su N., Li J. (2011). Variation of riverine material loads and environmental consequences on the Changjiang (Yangtze) Estuary in recent decades, (1955-2008). Environmetal Sci. Technol. 45, 223–237. doi: 10.1021/es103026a
Dai S., Lu X. (2014). Sediment load change in the Yangtze River (Changjiang): A review. Geomorphology 215, 60–73. doi: 10.1016/j.geomorph.2013.05.027
Diniz L. P., Petsch D. K., Mantovano T., Rodrigues L. C., Agostinho A. A., Bonecker C. C. (2023). A prolonged drought period reduced temporal β diversity of zooplankton, phytoplankton, and fish metacommunities in a Neotropical floodplain. Hydrobiologia 850, 1073–1089. doi: 10.1007/s10750-023-05140-7
Du Y., Qin Y., Chu D., He S., Zhang J., Wang G., et al. (2023). Spatial and temporal variability of suspended sediment fronts over the Yangtze Bank in the Yellow and East China Seas. Estuarine Coast. Shelf Sci. 288, 108361. doi: 10.1016/J.ECSS.2023.108361
Du P., Ye W., Deng B., Mao M., Zhu Y., Cheng F., et al. (2022). Long-term changes in zooplankton in the Changjiang estuary from the 1960s to 2020. Front. Mar. Sci. 9. doi: 10.3389/FMARS.2022.961591
Du P., Zeng D., Lin F., Naing S., Jiang Z., Zhang J., et al. (2023). Epipelagic mesozooplankton communities in the northeastern Indian Ocean off Myanmar during the winter monsoon. Haiyang Xuebao 42, 57–59. doi: 10.1007/S13131-022-2090-5
Du Y., Zhang J., Wei Z., Yin W., Wu H., Yuan Y., et al. (2022). Spatio-temporal variability of suspended sediment fronts (SSFs) on the inner shelf of the east China sea: the contribution of multiple factors. J. Geophysical Research: Oceans 127, e2021JC018392. doi: 10.1029/2021JC018392
Eduardo M. A., Alberto P., Oscar I., Hermes M. (2015). Ecological Processes at Marine Fronts (Cham, Germany: Springer International Publishing), 9–15.
Fernández de P.M.L., Molinero J. C. (2008). Decadal changes in hydrographic and ecological time-series in the Balearic Sea (western Mediterranean), identifying links between climate and zooplankton. ICES J. Mar. Sci. 65, 311–317. doi: 10.1093/icesjms/fsn017
Framiñan M. B., Brown O. B. (1996). Study of the Río de la Plata turbidity front, Part 1: spatial and temporal distribution. Continental Shelf Res. 16, 1259–1282. doi: 10.1016/0278-4343(95)00071-2
Fukuda M., Asanuma I. (2007). Phytoplankton distribution on the East China Sea determined by the interaction between the Yangtze River runoff and the Kuroshio. Costal Ocean Remote Sens. 6680, 1–10. doi: 10.1117/12.732979
Ge H., Zhu L., Mao B. (2025). Hydrological drought in the lower reaches of the Yangtze River (China): a 70-year data analysis. Front. Mar. Sci. 12. doi: 10.3389/fmars.2025.1534674
Goździejewska A. M., Kruk M., Bláha M. (2024). The zooplankton adaptation patterns along turbidity gradient in shallow water reservoirs. Ecohydrology Hydrobiology 24, 188–200. doi: 10.1016/j.ecohyd.2023.08.005
Hu Z., Pan D., He X., Bai Y. (2016). Diurnal variability of turbidity fronts observed by geostationary satellite Ocean Color remote sensing. Remote Sens. 8, 147. doi: 10.3390/rs8020147
Jiang Q., Xu Y., Yu C., Zhang H., Xiao Y., Tang Y., et al. (2018). Community structure of zooplankton in adjacent area of Changjiang estuary, China in summer 2016. Chin. J. Appl. Ecol. 29, 3078–3084. doi: 10.13287/j.1001-9332.201809.004
Jiang Y., Zhao F., Shi X., Cao L., Zeng C. (2024). Fronts affect fish community structure in the Yangtze River estuary and its adjacent area. J. Sea Res. 199, 102507. doi: 10.1016/j.seares.2024.102507
Julien D. P., Pierre B., Sabine H., Moreno H. D., Meunier C. L. (2024). Global change alters coastal plankton food webs by promoting the microbial loop: An inverse modelling and network analysis approach on a mesocosm experiment. Sci. Total Environ. 921, 171272. doi: 10.1016/J.SCITOTENV.2024.171272
Kimmerer W. J. (2002). Effects of freshwater flow on abundance of estuarine organisms: physical effects or trophic linkages? Mar. Ecol. Prog. Ser. 243, 39–55. doi: 10.3354/meps243039
Leal F. W., Nagy G. J., Martinho F., Saroar M., Erache M. G., Primo A. L., et al. (2022). Influences of climate change and variability on estuarine ecosystems: an impact study in selected European, South American and Asian countries. Int. J. Environ. Res. Public Health 19, 585. doi: 10.3390/ijerph19010585
Lee D. K., Kwon J. I., Son S. (2015). Horizontal distribution of Changjiang Diluted Water in summer inferred from total suspended sediment in the Yellow Sea and East China Sea. Acta Oceanologica Sin. 34, 44–50. doi: 10.1007/s13131-015-0776-7
Li D., Chen J., Wang B., Jin H., Shou L., Lin H., et al. (2024b). Hypoxia triggered by expanding river plume on the east China sea inner shelf during flood years. J. Geophysical Res. Oceans 129, e2024JC021299. doi: 10.1029/2024JC021299
Li Ji, Gao Y., Bao Y. (2023). Summer phytoplankton photosynthetic characteristics in the Changjiang River Estuary and the adjacent East China Sea. Front. Mar. Sci. 10. doi: 10.3389/FMARS.2023.1111557
Li W., Ge J., Ding P., Ma J., Glibert P. M., Liu D. (2021). Effects of dual fronts on the spatial pattern of chlorophyll-a concentrations in and off the changjiang river estuary. Estuaries Coasts 44, 1–11. doi: 10.1007/S12237-020-00893-Z
Li D., Wang B., Jin H., Miao Y., Sun Q., Lin H., et al. (2024a). Decoupling of high-resolution surface pH and DO reveals temporal algal bloom dynamics on the East China Sea. Water Res. 261, 122030. doi: 10.1016/j.watres.2024.122030
Liu H., Gilmartin J., Li C., Li K. (2021). Detection of time-varying pulsed event effects on estuarine pelagic communities with ecological indicators after catastrophic hurricanes. Ecol. Indic. 123, 107327. doi: 10.1016/j.ecolind.2020.107327
Liu H., Gilmartin J., Sluis Z. M., Kobari T., Rooker J., Bi H., et al. (2024). Dynamic oceanographic influences on zooplankton communities over the northern Gulf of Mexico continental shelf. J. Sea Res. 199, 102501. doi: 10.1016/j.seares.2024.102501
Liu D., Lü T., Lin L., Wei Q. (2022). Review of fronts and its ecological effects in the shelf sea of China. Adv. Mar. Sci. (in Chinese) 40, 725–741. doi: 10.12362/j.issn.1671-6647.20220719001
Liu S., Qi X., Li X., Ye H., Wu Y., Ren J., et al. (2016). Nutrient dynamics from the Changjiang (Yangtze River) estuary to the East China Sea. J. Mar. Syst. 154, 15–27. doi: 10.1016/j.jmarsys.2015.05.010
Liu X., Song J., Ren Y., Zhan D., Liu T., Liu K., et al. (2023). Spatio-temporal patterns of zooplankton community in the Yellow River estuary: Effects of seasonal variability and water-sediment regulation. Mar. Environ. Res. 189, 106060. doi: 10.1016/J.MARENVRES.2023.106060
Liu L., Wang Z. (2019). Temporal and spatial distributions and formation mechanism of suspended sediment in the coastal area of the Shandong Peninsula. Mar. Sci. (in Chinese) 43, 55–65. doi: 10.11759/hykx20190312004
Liu Na, Wang H., Ling T., Feng L. (2013). The influence of ENSO on sea surface temperature variations in the China seas. Acta Oceanologica Sin. 32, 21–29. doi: 10.1007/s13131-013-0348-7
Liu J., Yu S., Zhao M., He B., Zhang X. (2014). Shifts in archaeaplankton community structure along ecological gradients of Pearl Estuary Journal. FEMS Microbiol. Ecol. 90, 424–435. doi: 10.1111/1574-6941.12404
Lucena-Moya P., Duggan I. C. (2017). Correspondence between zooplankton assemblages and the Estuary Environment Classification system. Estuarine Coast. Shelf Sci. 184, 1–9. doi: 10.1016/j.ecss.2016.10.028
Luo Z., Pan W., Li Li, Zhang G. (2012). The study on three-dimensional numerical model and fronts of the Jiulong Estuary and the Xiamen Bay. Acta Oceanologica Sin. 31, 55–64. doi: 10.1007/s13131-012-0220-1
Luo Z., Zhu J., Wu H., Li X. (2017). Dynamics of the sediment plume over the Yangtze Bank in the Yellow and East China Seas. J. Geophysical Research: Oceans 122, 10073–10090. doi: 10.1002/2017JC013215
Lyu Z. Z., Gao H., Gao R. (2023). Extreme characteristics and causes of the drought event in the whole Yangtze River Basin in the midsummer of 2022. Advances in climate change research. 5, 642–650. doi: 10.1016/J.ACCRE.2023.09.007
Marc P., Martine R., Marine L., David V., Loïc G., Cécile D., et al. (2025). Zooplankton in Kone Lagoon (New Caledonia): Natural variability versus mining effects. Mar. pollut. Bull. 210, 117302–117302. doi: 10.1016/j.marpolbul.2024.117302
Marcela P.de A., André M., Luci C. C. P., Rauquírio M. C. (2022). Effects of environmental variables on mesozooplankton dynamics in an Amazonian estuary. Ecohydrology Hydrobiology 22, 511–529. doi: 10.1016/j.ecohyd.2022.05.002
María C. L., Juan C. M., Gerardo M. E. P., María S. B. d. C., Rosa E. P., Valeria A. G., et al. (2018). Long-term changes on estuarine ciliates linked with modifications on wind patterns and water turbidity. Mar. Environ. Res. 144, 46–55. doi: 10.1016/j.marenvres.2018.12.001
Mouny P., Dauvin J. C. (2002). Environmental control of mesozooplankton community structure in the Seine estuary (English Channel). Oceanologica Acta 25, 13–22. doi: 10.1016/S0399-1784(01)01177-X
Ou S., Yang Q., Luo X., Zhu F., Luo K., Yang H. (2019). The influence of runoff and wind on the dispersion patterns of suspended sediment in the Zhujiang (Pearl) River Estuary based on MODIS data. Acta Oceanologica Sin. 38, 26–35. doi: 10.1007/s13131-019-1396-4
Oumarou N., Jean-Luc D., Malika B. (2007). Numerical modeling of the Amazon River plume. Continental Shelf Res. 27, 873–899. doi: 10.1016/j.csr.2006.12.004
Ratnarajah L., Abu-Alhaija R., Atkinson A., Batten S., Bax N. J., Bernard K. S., et al. (2022). Monitoring and modelling marine zooplankton in a changing climate. Nat. Commun. 14, 564. doi: 10.1038/s41467-023-36241-5
Rogers T. L., Samuel M. B., Christina E. B. (2024). Evaluating top-down, bottom-up, and environmental drivers of pelagic food web dynamics along an estuarine gradient. Ecology 105, e4274. doi: 10.1002/ecy.4274
Salome J., Nicola K. C., Renzo P. (2015). Turbidity effects on the feeding, respiration and mortality of the copepod Pseudodiaptomus stuhlmanni in the St Lucia Estuary, South Africa. J. Exp. Mar. Biol. Ecol. 469, 63–68. doi: 10.1016/j.jembe.2015.04.015
Schubert H., Telesh I., Nikinmaa M., Skarlato S. (2017). “Physiological adaptations,” in Biological Oceanography of the Baltic Sea. Eds. Snoeijs-Leijonmalm P., Schubert H., Radziejewska T. (Springer, Dordrecht). doi: 10.1007/978-94-007-0668-2_7
Shang Xu, Wang G., Li S. (2005). Relationship between salinity tolerance during different developmental phase and ecological distribution of Schmackeria poplesia in Jiulongjiang Estuary in Fujian. J. Oceanography Taiwan Strait (in Chinese) 24, 330–338.
Shang J., Zhang W., Gao Yu, Li Y., Wu H. (2023). Dam-induced flow alternations drive the regime shift towards a cyanobacteria-dominated microbiota state in the Yangtze River. Water Res. 244, 120527. doi: 10.1016/J.WATRES.2023.120527
Shao Q., Liu Z., Zhang J., Sun D., Lin S. (2017). Seasonal variation in zooplankton community structure in the Changjiang estuary and its adjacent waters. Acta Ecologica Sin. 37, 683–691. doi: 10.5846/stxb201507271574
Sommaruga R., Kandolf G. (2014). Negative consequences of glacial turbidity for the survival of freshwater planktonic heterotrophic flagellates. Sci. Rep. 4, 4113. doi: 10.1038/srep04113
Sun Q., Li D., Wang B., Xu Z., Miao Y., Lin H., et al. (2023). Massive nutrients offshore transport off the Changjiang Estuary in flooding summer of 2020. Front. Mar. Science. 10. doi: 10.3389/fmars.2023.1076336
Sun D., Liu Z., Zhang J., Wang C., Shao Q. (2016). Environmental control of mesozooplankton community structure in the Hangzhou Bay, China. Acta Oceanologica Sin. 35, 96–106. doi: 10.1007/s13131-016-0893-y
Turner J. T. (2004). The importance of small planktonic copepods and their roles in pelagic marine food webs. Zoological Stud. 43, 255–266.
Van Donk E., Ianora A., Vos M. (2011). Induced defences in marine and freshwater phytoplankton: a review. Hydrobiologia 668, 3–19. doi: 10.1007/s10750-010-0395-4
Venkataramana V., Gawade L., Bharathi M. D., Sarma V. V. S. S. (2023). Role of salinity on zooplankton assemblages in the tropical Indian estuaries during post monsoon. Mar. pollut. Bull. 190, 114816. doi: 10.1016/J.MARPOLBUL.2023.114816
von Weissenberg E., Mottola G., Uurasmaa T. M., Anttila K., Engström Ö. J. (2022). Combined effect of salinity and temperature on copepod reproduction and oxidative stress in brackish-water environment. Front. Mar. Sci. 9. doi: 10.3389/fmars.2022.952863
Wang T., Barkan R., McWilliams C. J., Molemaker M. J. (2021). Structure of submesoscale fronts of the mississippi river plume. J. Phys. Oceanography 51, 1113–1131. doi: 10.1175/JPO-D-20-0191.1
Wang Y., Li C., Liu A., Wu L., Ge J. (2023). Dynamic mechanism of saltwater intrusion at Yangtze River estuary in summe. Yangtze River (in Chinese) 54, 7–14. doi: 10.16232/j.cnki.1001-4179.2023.04.002
Wang H., Liu F., Wang M., Bettarel Y., Eissler Y., Chen F., et al. (2024). Planktonic eukaryotes in the Chesapeake Bay: contrasting responses of abundant and rare taxa to estuarine gradients. Microbiol. Spectr. 12, e0404823. doi: 10.1128/spectrum.04048-23
Woodson C. B., Litvin S. Y. (2015). Ocean fronts drive marine fishery production and bio-geochemical cycling. Proc. Natl. Acad. Sci. United States America 112, 1710–1715. doi: 10.1073/pnas.1417143112
Xu Z., Shen X., Ma S. (2005). Ecological characters of zooplankton dominant species in the waters near the Changjiang estuary in spring and summer. Mar. Sci. (in Chinese) 29, 13–19.
Xu M., Wang Y., Feng Z., Wu H. (2024). Rapid variations of phytoplankton blooms and their dynamics off the Changjiang River Estuary. Front. Mar. Sci. 11. doi: 10.3389/FMARS.2024.1345940
Yancey P. H., Clark M. E., Hand S. C. (1982). Living with water stress: evolution of osmolyte systems. Science 217, 1214–1222. doi: 10.1126/science.7112124
Yang H., Oh E., Choi J. K. (2016). Application of Geostationary Ocean Color Imager Data to the extraction of ocean fronts. Remote Sens. Lett. 7, 456–465. doi: 10.1080/2150704X.2016.1149249
Yang J., Zhang D., Chen Y. (2024). Responding of zooplankton to environmental factor changes in the Changjiang River estuarine regions in spring-summer from 2016 to 2020. J. Oceanology Limnology 42, 544–559. doi: 10.1007/S00343-023-3033-5
Yu Di, Liu S., Li G., Zhong Y., Liang J., Shi J., et al. (2022). The river-sea interaction off the amazon estuary. Remote Sens. 14, 1022. doi: 10.3390/rs14041022
Zhang X., Gao S., Ji X., Zhu X., Zheng J., Guo S. (2024). Impact of typhoons on the ecological environment of the Pearl River Estuary in the summer of 2021—a study of an algal bloom event. Front. Mar. Sci. 11. doi: 10.3389/fmars.2024.1395804
Zheng S., Guan W., Cai S., Wei X., Huang D. (2014). A model study of the effects of river discharges and interannual variation of winds on the plume front in winter in Pearl River Estuary. Continental Shelf Res. 73, 31–40. doi: 10.1016/j.csr.2013.11.019
Keywords: Yangtze river estuary, sediment and plume fronts, zooplankton communities, interannual variability, extremely drought
Citation: Xu Y, Cheng F, Ma X, Mao M, Zhu Y, Jiang Z, Zheng Z, Zeng J, Shou L, Zhou F and Du P (2025) The impact of summer Yangtze river runoff fluctuations on estuarine fronts dynamics and zooplankton communities from 2016 to 2023. Front. Mar. Sci. 12:1556561. doi: 10.3389/fmars.2025.1556561
Received: 07 January 2025; Accepted: 26 February 2025;
Published: 20 March 2025.
Edited by:
Li Li, Zhejiang University, ChinaReviewed by:
Soultana Zervoudaki, Hellenic Centre for Marine Research (HCMR), GreeceCopyright © 2025 Xu, Cheng, Ma, Mao, Zhu, Jiang, Zheng, Zeng, Shou, Zhou and Du. This is an open-access article distributed under the terms of the Creative Commons Attribution License (CC BY). The use, distribution or reproduction in other forums is permitted, provided the original author(s) and the copyright owner(s) are credited and that the original publication in this journal is cited, in accordance with accepted academic practice. No use, distribution or reproduction is permitted which does not comply with these terms.
*Correspondence: Ping Du, ZHVwaW5nQHNpby5vcmcuY24=
Disclaimer: All claims expressed in this article are solely those of the authors and do not necessarily represent those of their affiliated organizations, or those of the publisher, the editors and the reviewers. Any product that may be evaluated in this article or claim that may be made by its manufacturer is not guaranteed or endorsed by the publisher.
Research integrity at Frontiers
Learn more about the work of our research integrity team to safeguard the quality of each article we publish.